

Abstract
Andrographis paniculata (Burm. F.) Nees. is considered as the herb of the future due to its precious chemical compounds, andrographolide (ANDRO), neoandrographolide (NAG) and 14-deoxyandrographolide (DAG). This study aims to profile the metabolites in young and mature leaf at six different harvest ages using 1HNMR-based metabolomics combined with multivariate data analysis. Principal component analysis (PCA) indicated noticeable and clear discrimination between young and mature leaves. A comparison of the leaves stage indicated that young leaves were separated from mature leaves due to its larger quantity of ANDRO, NAG, DAG, glucose and sucrose. These similar metabolites are also responsible for the PCA separation into five clusters representing the harvest age at 14, 16, 18, 20, 22 weeks of leaves extract. Loading plots revealed that most of the ANDRO and NAG signals were present when the plant reached at the pre-flowering stage or 18 weeks after sowing (WAS). As a conclusion, A. paniculata young leaves at pre-flowering harvest age were found to be richer in ANDRO, NAG and DAG compared to mature leaves while glucose and choline increased with harvest age. Therefore, young leaves of A. paniculata should be harvested at 18 WAS in order to produce superior quality plant extracts for further applications by the herbal, nutraceutical and pharmaceutical industries.
Subject terms: Biochemistry, Plant sciences
Introduction
The popularity of herbs among health consumers as an alternative medicine to alleviate diseases and health maintenance are due to its reputation of being safer and cheaper than synthetic medicines. Herbs are also easily available through cultivation practice, either in mass propagation or smaller scale planting. One of the more popular herbs among the Asian population is Andrographis paniculata (A. paniculata), also known as the ‘king of bitters’ and much used in Ayurvedic medicine. The herb has a broad range of pharmacological effects, including anti-cancer, anti-diarrheal, anti-hepatitis, anti-HIV, anti-inflammatory, anti-malarial, antioxidant, cytotoxic and hepatoprotective as well as useful against cardiovascular diseases and sexual dysfunction1–3.
More than 20 structurally analogous diterpenoids and 10 flavonoids have been isolated from different parts of A. paniculata plant4. The bitter taste of A. paniculata is mainly contributed by andrographolide (ANDRO) and its analogues such as 14-deoxyandrographolide (DAG) and neoandrographolide (NAG). According to Okhuarobo et al.5 ANDRO is the most prominent in occurrence and quantity among the chemical constituents of A. paniculata, widely distributed in the aerial parts and roots of this plant. Several studies confirmed that the phytochemicals of A. paniculata were found to be higher in leaves compared to other plant parts6–8.
The content of specific phytochemicals of a plant or herb is known to vary with plant age. Bioactive metabolites of the medicinal plant Melicope ptelefolia was reported to be higher in the young leaves rather than in the mature leaves9. Similar results have been reported for the young leaves of Clinacanthus nutans by Raya et al.10. Lawal et al.11 stated that the variability in the metabolite contents could be influenced by diverse factors, including plant harvest age or stage. Yusof et al.12 also reported that the metabolites of A. paniculata evaluated by Fourier Transform Infra-Red (FTIR) spectroscopy, showed clear differences in their relative concentrations when harvested at 120, 150 and 180 days after transplanting. For high-quality material production, which has a direct impact on assurance of product efficacy, determining the most appropriate age or stage for crop harvest is of utmost importance, even before postharvest processing technologies is considered. The best time to harvest a crop for specific characteristics may be different for different cultivars, geographical region, and/or climatic conditions. With respect to local cultivars of A. paniculata, there is a need for more information in this respect, especially with respect to the contents of the various bioactive diterpene lactones.
Metabolomics is a comprehensive tool for the quantitative and qualitative analysis of all metabolites found in an organism13,14. It is a holistic, non-biased, qualitative and quantitative overview of the metabolites present in an organism9,15. The metabolite profile at various time points can be measured using several available state-of-the-art analytical tools, all with high reproducibility and sensitivity. Nuclear magnetic resonance (NMR) spectroscopy, in combination with chemometrics, is a proven technique used in metabolite profiling of various plant species9,11,13,15. NMR allows simultaneous detection of diverse groups of secondary metabolites and the metabolite quantification can be performed without the need for any calibration curves15,16. It is a rapid and highly reproducible method that requires only a modest sample preparation method17. Thus, this study was conducted to discriminate young versus mature leaves and explore the changes in the metabolite profile of young leaves harvested at different harvest age or stage. Results from this study are to fill in the information gap in the potential use of A. paniculata as a phytomedicinal plant.
Materials and Methods
Weather description and seed germination
Peninsular Malaysia is equatorially located at 1° and 7° north and 99° to 105° east18. The climate in Malaysia can be described as typical tropical climate characterised by uniform high temperature, high humidity and abundant rainfall19. Two types of monsoon period influenced the climate, that is the southwest and the northeast monsoons, which occur from April to September (dry season), and October to March (wet season), respectively20. The present study was conducted during the wet season, starting in October 2014 until January 2015 (Table 1). The herbal crop grew well and did not show any pest or disease infestations during the whole cultivation period. All plant parts were normal and had a natural green colour. Seeds of A. paniculata (Accessions 11265-Harapan), obtained from the AgroGene Bank Laboratory, Universiti Putra Malaysia (UPM), Serdang, were scarified with sandpaper and then soaked in hot water (68 ± 2 °C) for 3 min to break their dormancy21. The seeds were then sown in petri dishes lined with Whatman filter paper (No. 2), premoistened with sterile distilled water. The petri dishes were sealed with parafilm and placed in a growth chamber under a controlled light source and 60–70% relative humidity. At the two-leaf stage, the seedlings were transplanted into Jiffy pellets and maintained in the nursery for eight weeks until the six- to the eight-leaf stage, after which they were field transplanted.
Table 1.
Climate data recorded at the field planting sites during the four months of study.
| 2014 | 2015 | |||
|---|---|---|---|---|
| October | November | December | January | |
| Average temperature (°C) | 28 | 27 | 27 | 28 |
| Humidity (%) | 81 | 84 | 85 | 78 |
| Rainfall (mm) | 210.2 | 355.3 | 322.9 | 177.8 |
Temperature and humidity were expressed as monthly average values and rainfall as accumulated rain per month. Source: Malaysia Meteorological Department, Ministry of Energy, Science, Technology, Environment and Climate Change.
Field transplanting
Field transplanting was conducted on clay loam soil at the Vegetable Unit, University Agriculture Park, UPM (2° 59.225′N, 101°42.439′E, 45 m above sea level). The seedlings (six- to the eight-leaf stage) were transplanted to a 1.2 m × 27 m raised (15–20 cm) bed, in 5 replications. Prior to transplanting, 10 ton/ha each of rice husk and chicken manure, were incorporated as soil amendments to about 15 cm topsoil on each bed and left aside for seven days before field transplanting. Each bed was covered with Agrosheet plastic mulching to control weeds. The seedlings were transplanted onto the raised beds, evenly distributed at a count of one seedling/point. There were two planting rows for each bed. The distance between the planting rows on each bed was 30 cm and between plants within the row was also 30 cm. The plots were maintained according to standard cultural practices. The crop was watered using a sprinkler irrigation system, carried out twice a day in the morning and late evening, except for rainy days. Organic-based fertiliser (8: 8: 8) at the rate of 250 kg N/ha was applied three days after transplanting.
Plant materials and extraction
Leaf samples from the five plots were harvested at 14, 16, 18, 20 and 22 weeks after sowing (WAS), which represent different phenological stages22 as describe in Fig. 1. To ensure sample uniformity, sampling was consistently carried out between 8:00 to 9:30 a.m. Six young leaves were obtained from the plant shoot tips while another six mature leaves were taken at the 5th internode from the base of the plant. Upon cutting, each leaf samples were immediately quenched in liquid nitrogen and further pulverised into powder form in the cryogenic state.
Figure 1.

Plant harvest ages and phenological stages of A. paniculata.
The samples were then freeze-dried over 48 hours to remove residual moisture in the leaf tissues. For each dried sample, 50 mg was directly extracted with 1.5 mL of prepared deuterated solvent made up of 0.75 mL CD3OD and 0.75 mL KH2PO4 buffer in D2O (pH 6.0) containing 0.1% 3-(trimethylsilyl)propionic-2,2,3,3-d4 acid sodium salt (TSP), using a vortex mixer23. The direct extraction was further assisted by 30 min sonication in a sonicator bath (FB15055, Fisherbrand, USA), at ambient temperature. The clear deuterated supernatant obtained after centrifuging (PK110, ALC, UK) for 10 min, was transferred into NMR tubes for measurement of its 1H spectrum.
1H NMR spectrometry
The 1H NMR measurements were performed using a 500 MHz Varian INOVA NMR spectrometer (Varian Inc., California, USA) operating at 499.887 MHz, with the temperature maintained at 26 °C. Each 1H NMR spectrum, acquired over a spectral width of 20 ppm, consisted of 64 scans requiring 3.53 min acquisition time11. All spectra were manually phased, and baseline corrected using the Chenomx software (version 8.1, Alberta, Canada) it a consistent setting for all sample spectra. According to Lawal et al.11 TSP had been used as an internal standard for the chemical shift reference and the intensity scaling for all 1H-NMR signals. It also used as a reference in the quantitation of metabolites. The chemical shifts of all data sets were referenced to the internal standard of TSP at 0 ppm. The 2D J-resolved experiments were also carried out to aid metabolite identification.
Bucketing of 1H NMR spectra and statistical analysis
The 1H NMR spectra were automatically converted to ASCII files using Chenomx software (version 8.1, Alberta, Canada). Spectral intensities were binned by equal width (δ 0.04) corresponding to the region of δ 0.50–10.00. The region δ 4.70–4.96 (water) and δ 3.28–3.33 (residual methanol) were excised from the analysis11,13,15. The processed and bucketed data were then subjected to multivariate data analysis. Principal component analysis (PCA) was performed with SIMCA-P software (version 13.0, Umetrics, Umeå, Sweden) using pareto scaling9,11,13,15.
One-way ANOVA (SAS version 9.4) was further conducted to determine the differences between the young and mature leaves. Leaf samples that showed higher contents of the bioactive marker compounds (e.g. ANDRO, DAG, NAD) were further evaluated based on harvest age of 14, 16, 18, 20 and 22 WAS. The means of the peak area of 1H NMR signals between the treatments were separated using the least significant difference (LSD) test at P ≤ 0.05. The relationships between plant age and variables (ANDRO, NAG, DAG, glucose, sucrose and choline) were determined using regression analysis. The formula to determine the plant harvest age for each optimum variable is as follows:
Regression model:
| 1 |
The equation to find the maximum parameter value:
| 2 |
where, α, b and c are the regression constant values and dy/dx is derivative of the y.
Results and Discussion
Visual inspection 1H NMR spectra
Seven compounds were identified in the A. paniculata leaf extract as listed in Table 2. Identification of the compounds was carried out by matching their chemical shift values with those in the Chenomx database, NMR spectrum of the authentic standard and further supported with 2D J-resolved spectrum (see Supplementary Figs S1–S4) as well as comparison with the literature13,23,24. Representative 1H NMR spectra of the young and mature leaf extract are shown in Fig. 2. Intensely visible signals were observed in the aliphatic (δ 0.5–3.0), carbohydrate (δ 3.0–5.5), and aromatic (δ 5.5–9.0) regions, for all the spectra. Most of the signals in the aliphatic and aromatic regions were relatively more intense in the spectra of young leaves compared with those of mature leaves.
Table 2.
Characteristic 1H NMR signals of compounds detected in the leaf extract of A. paniculata.
| Metabolites | 1H NMR characteristic signal |
|---|---|
| ANDRO | δ 6.92 (m), δ 4.88 (s), δ 4.52 (q), 2.52 (m), δ 1.92x, δ 0.64 (s) |
| NAG | δ 8.44 (s), δ 7.4 (s), 4.27 (d, J = 10 Hz), 1.04 (s) |
| DAG | δ 2.36 (d, J = 8.6 Hz), δ 1.16 (s), δ 0.72 (s) |
| Glucose | δ 5.16 (d, J = 3.75 Hz), δ 4.6 (d, J = 7.9 Hz), δ 3.84x, δ 3.68x, δ 3.24x |
| Sucrose | δ 5.4 (d, J = 3.6 Hz), δ 4.16 (d, J = 8.5 Hz) |
| Alanine | δ 1.44 (d, J = 7.9 Hz) |
| Choline | δ 3.20 (s) |
1H NMR peak signals:
s, d, q, m = singlet, quartet and multiple, respectively.
xobscured by overlapping with other signals.
Figure 2.

Full 1H NMR spectra of young and mature leaves of A. paniculata, from δ 0.0 to 8.0 ppm. Andrographolide (1), neoandrographolide (2), 14-deoxyandrographolide (3), glucose (4), sucrose (5), alanine (6) and choline (7).
This observation is similar to those of Shuib et al.9, who reported that young leaves of Melicope ptelefolia showed more intense 1H NMR signals in the aliphatic and aromatic regions as compared to mature leaves. As shown in Table 2 and Fig. 2, the 1H NMR signals observed in the aliphatic and aromatic regions were those of ANDRO (δ 6.92, 4.88, 4.52, 2.52, 1.92 and 0.64), NAG (δ 8.44, 7.4, 4.27 and 1.04) and DAG (δ 2.36, δ 1.16 and δ 0.72). Severely overlapping signals were observed in the carbohydrate region (δ 3.0–5.5) (Fig. 2). Nevertheless, the anomeric proton of glucose could be observed at δ 5.16 and δ 4.6 while those of sucrose were detectable at δ 5.4, and δ 4.16. The signals of these compounds were detected in the 1H NMR spectra of both young and mature leaves. However, the signal intensities of the compounds were substantially higher for the young leaves. According to Mediani et al.24, the overall quality of a plant is influenced by variations in the metabolite profile over its growth periods. Thus, the metabolite variation of the young leaf samples was monitored at 14, 16, 18, 20 and 22 WAS towards determining to optimum harvest age of the herb.
The1H NMR spectra of young leaves harvested at 14, 16, 18, 20 and 22 WAS are shown in Fig. 3. The 14 and 16 WAS represented the herb’s vegetative stage, 18 WAS represented pre-flowering stage, while 20 and 22 WAS represented the flowering and seed formation stages, respectively (Fig. 1). As shown in Fig. 3, the representative 1H NMR spectra of the leaf extract at the various harvest age did not show visually significant differences between each other, except that, for leaf samples harvested at 16, 18 and 20 WAS, there was a noticeable increase in signal intensities for the peaks at δ 0.5–3.0, representing the signals for ANDRO and DAG. This is a visual indication that the levels of these two bioactive compounds are changing during the pre-flowering and flowering stages. Greater detail of the difference between young and mature leaves, as well as the changes observed over the different harvest ages25,26, were thus further evaluated via 1H NMR-based metabolomics analysis.
Figure 3.

Full 1H NMR spectra of young leaves of A. paniculata, harvested at 14, 16, 18, 20 and 22 weeks after sowing (WAS) from δ 0.0 to 8.0 ppm. Andrographolide (1), neoandrographolide (2), and 14-deoxyandrographolide (3), glucose (4), sucrose (5), alanine (6) and choline (7).
Multivariate analysis of 1H NMR data
Principal Component Analysis (PCA) was performed to determine the difference between the leaf samples. The PCA score plot (Fig. 4a) showed clear cluster separation of the young (blue) and mature (green) leaves. All the samples in the score plot were within the 95% Hotelling T2 ellipse. The 2D plot showed that the best separation was obtained in PC 1 and PC 2 with an eigenvalue of 64%, the two PCs representing a variance of 18.7% and 45.8%, respectively. As shown in Fig. 4b, the PCA loading plot revealed that young leaves of A. paniculata have higher levels of the diterpene lactones, while mature leaves have higher levels of glucose (Fig. 4b). Most of the DAG signals also exist in the young leaves compared to the mature leaves. It is also noticeable that NAG was present in the young leaves. In contrast, the carbohydrate compounds and NAG as well as choline and alanine were dominant in the mature leaves (Fig. 4b).
Figure 4.
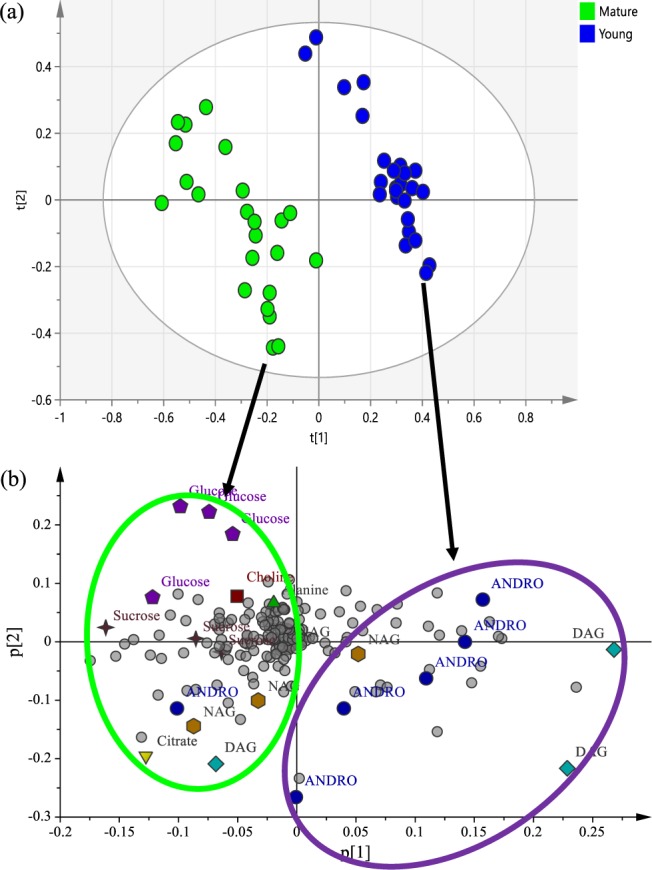
(a) PCA score plot for young versus mature leaves, along PC1 and PC2. (b) PCA loading plot showing the differentiating metabolites between young and mature leaves of Andrographis paniculata.
The levels of the discriminating metabolites were further analysed using one-way ANOVA. The characteristic signals of ANDRO, NAG, DAG, glucose, sucrose and choline were selected based on the most abundant signals relatively quantified by the 1H NMR spectra. Chemical shifts selected in the quantification were δ 4.52 (q) for ANDRO, δ 7.4 (s) for NAG, δ 0.72 (s) for DAG, δ 3.68 for glucose, δ 4.16 for sucrose and δ 3.2 for choline. Levels of ANDRO and DAG in the young leaves were significantly higher by 40% and 36%, respectively, compared to mature leaves. Conversely, the NAG level in young leaves was significantly lower than the mature leaves. Also, the levels of glucose and sucrose in the mature leaves were significantly higher by 20% and 28%, respectively, compared to the levels of glucose and sucrose in the young leaves (Fig. 5).
Figure 5.
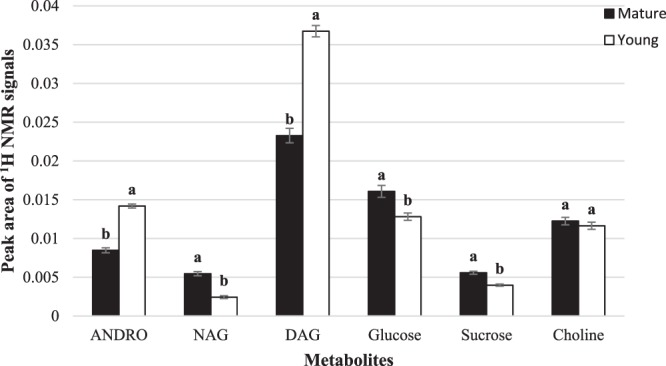
Peak area of 1H NMR signals of selected metabolites in young and mature leaves of A. paniculata. Mean values ± SE were from five replications. Different alphabets above each bar indicate significant differences at P ≤ 0.05 using the LSD test.
Other researchers have also reported the presence of higher levels of carbohydrate compounds in mature leaves. Shuib et al.9 reported similar results in that they found mature leaves to be richer in sugars and glycosidic compounds while the younger leaves have higher levels of the bioactive marker compounds and fatty acids9. Most studies have reported that the accumulation of secondary metabolites in young leaves is to protect against abiotic and biotic stress as well as to protect against insect pests and disease9,27–29. Brenes-Arguedas28 also stated that young leaves are more preferred by insect pest because the leaves are tender and nutritious. Also, the position of young leaves is more exposed to biotic and abiotic stress compared to the mature leaves29. Wingler et al.30 and Rolland et al.31 stated that sugar type compounds increased during senescence and accumulation of this compound lead to a repressed transcription of photosynthetic genes32,33. Shuib et al.9 reported that during leaf maturation, certain compounds might undergo enzymatic transformations or degraded to other secondary metabolites.
Metabolite changes at different harvesting age in young leaves of Andrographis paniculata
A PCA plot was further constructed for the 1H NMR data of young leaves at different harvest stages (Fig. 6a). In the model, 44% and 21% of the total variance could be explained by PC 1 and PC 2, respectively. The 22 WAS samples were distinctly separated from all the other samples by PC1, while the 14 WAS samples were separated from the other by PC2. Further examination of the loading plot (Fig. 6b) showed that the 22 WAS samples contained higher levels of glucose and choline, while the 14 WAS samples were richer in sucrose. Examination of the trajectory changes from the vegetative through to the post-flowering or seed formation stages, it could be observed from the loading plots that the levels of the diterpene lactones ANDRO, DAG and NAG were higher during the pre-flowering and flowering stages.
Figure 6.
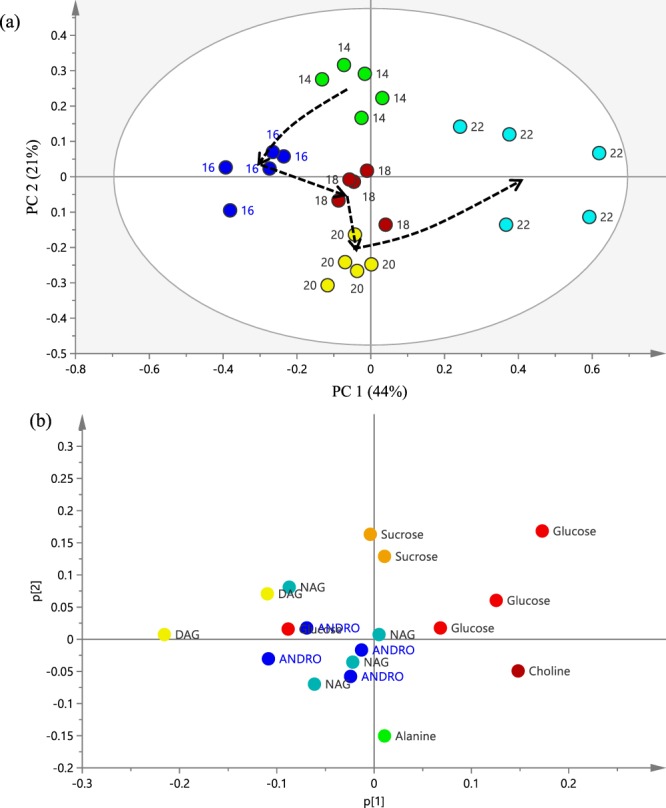
(a) Principal component analysis of young leaf samples harvested at 14, 16, 18, 20 and 22 WAS. Dashed arrow indicates the trajectory changes over the plant harvest ages. (b) The loading plots of metabolites for the first two principal components, PC1and PC2.
The levels of the discriminating metabolites were further analyzed by ANOVA and regression analysis. Chemical shifts selected in the quantification were δ 6.29 for ANDRO, δ 1.04 for NAG, δ 1.16 for DAG, δ 3.24 for glucose, δ 5.4 for sucrose and δ 3.2 for choline. From the results shown in Fig. 7, it can be seen that there was a significant quadratic relationship between harvest age and the levels of the diterpene lactones. The levels of ANDRO showed an increase from 14 WAS until 18 WAS, after which a pronounced decrease until 22 WAS (Fig. 7a). The quadratic equation explained that the optimum level peak area 1H NMR signals of ANDRO could be obtained 127 days after sowing, which coincided with the pre-flowering stage. A similar quadratic relationship with harvest age was observed for NAG and DAG (Fig. 7b,c). The optimum levels of NAG and DAG could be obtained 132 and 128 days after sowing, respectively, which were also within the pre-flowering stage.
Figure 7.

Relationships between plant harvest age (WAS) and peak area of 1H NMR signals of andrographolide (a), neoandrographolide (b), 14-deoxyandrographolide (c), glucose (d), sucrose (e), and choline (f). Solid line indicates a significant quadratic regression trend at P ≤ 0.05.
The glucose and choline levels also showed significant positive and quadratic relationships with harvest age (Fig. 7d,f). Starting from 14 up to 22 WAS (the seed formation stage), the glucose and choline levels increased by 46% and 37%, respectively. Conversely, there was a significant, negative quadratic relationship between sucrose levels with plant harvest, with 72% (R2 = 0.72) of the variability being due to the plant harvest age. Sucrose levels showed a reduction from 14 up to 20 WAS. After that, however, the levels increased by 39% until it reached the seed formation stage (Fig. 7e).
The present study demonstrated how the metabolites of A. paniculata changed during its growth period. The results of the present study further reemphasise that the biosynthesis of certain plant secondary metabolites can increase or decrease with plant age32. Borzak et al.33 mentioned that the patterns of the metabolite changes in the plant varied from seedling to the mature stage due to the changes in the ontogenetic expression. Previous studies on Indian cultivars of A. paniculata also reported higher contents of the metabolites between 120 to 135 days after sowing34, 130 days after planting35 and 135 days after planting36. For the Malaysian cultivar selected for this study, the optimum time for harvest is therefore similar, falling well within the pre-flowering stage at 18 WAS. The lower levels of the metabolites at the seed formation stage could be explained by the occurrence of senescence of the older leaves36. According to Ainsworth and Bush37, the senescence pathway of older leaves started when the accumulation of carbohydrate in the older leaves resulted from the suppression of the photosynthetic gene expression in the older leaves. Therefore, the accumulation of glucose at 22 WAS could be attributed to the increase in total surface area of leaves, which indirectly increases the photosynthetic activity and the accumulation of sugar in the plant11.
Conclusions
The present study used 1H NMR-based metabolomics combined with ANOVA and regression analysis to demonstrate the changes in the metabolite profile occurring in a local cultivar of A. paniculata during the period of its growth. Seven metabolites, including the bioactive compounds (ANDRO, NAG, and DAG), which were selected to represent quality parameter of the herb, were identified and their levels monitored in young and mature leaves, and then, over varying stages of its growth. Results from metabolomics and regression analysis revealed that young leaves of the herb are richer in the bioactive compounds, and the best time to harvest the herb is during the pre-flowering stage where the levels of these metabolites were observed to be at their highest. This information will be useful for farmers and entrepreneurs considering to venture into commercial herb farming where the objective is to produce superior and consistent quality of the plant material for further applications by the herbal, nutraceutical and pharmaceutical industries.
Supplementary information
Acknowledgements
This study was supported by the NKEA Research Grant Scheme (NH1211A003) from the Ministry of Agriculture and Agro-based Industry, Malaysia. The authors wish to thank to Mr Azizul Isha and Mr Salahudin Mohd. Raof for their help in NMR procedure and analysis.
Author contributions
All authors contributed extensively to the work presented in this article. N.E.T. and K.S. designed and performed research, wrote and revised the manuscript. N.S.S., B.R.K. and M.M. contributed to the development of the experimental part and performed chemical analyses. Maulidiani M. performed statistical analysis and helped in data interpretation and discussion. All authors reviewed the manuscript.
Competing interests
The authors declare no competing interests.
Footnotes
Publisher’s note Springer Nature remains neutral with regard to jurisdictional claims in published maps and institutional affiliations.
Supplementary information
is available for this paper at 10.1038/s41598-019-52905-z.
References
- 1.Hossain MS, Urbi Z, Sule A, Hafizur Rahman KM. Andrographis paniculata (Burm. f.) Wall. ex Nees: a review of ethnobotany, phytochemistry, and pharmacology. ScientificWorldJournal. 2014;2014:274905. doi: 10.1155/2014/274905. [DOI] [PMC free article] [PubMed] [Google Scholar]
- 2.Joselin J, Jeeva S. Andrographis paniculata: A review of its traditional uses, phytochemistry and pharmacology. Med. Aromat. Plants. 2014;3(4):169–184. [Google Scholar]
- 3.Valdiani A, et al. Nain-e Havandi Andrographis paniculata present yesterday, absent today: a plenary review on underutilized herb of Iran’s pharmaceutical plants. Mol. Biol. Rep. 2012;39(5):5409–5424. doi: 10.1007/s11033-011-1341-x. [DOI] [PubMed] [Google Scholar]
- 4.Thakur AK, Chatterjee SS, Kumar V. Adaptogenic potential of andrographolide: An active principle of the king of bitters (Andrographis paniculata) J. Tradit. Complement. Med. 2015;5(1):42–50. doi: 10.1016/j.jtcme.2014.10.002. [DOI] [PMC free article] [PubMed] [Google Scholar]
- 5.Okhuarobo A, et al. Harnessing the medicinal properties of Andrographis paniculata for diseases and beyond: A review of its phytochemistry and pharmacology. Asian Pacific J. Trop. Dis. 2014;4(3):213–222. doi: 10.1016/S2222-1808(14)60509-0. [DOI] [Google Scholar]
- 6.Pholphana N, Rangkadilok N, Saehun J, Ritruechai S, Satayavivad J. Changes in the contents of four active diterpenoids at different growth stages in Andrographis paniculata (Burm.f.) Nees (Chuanxinlian) Chin. Med. 2013;8:1. doi: 10.1186/1749-8546-8-2. [DOI] [PMC free article] [PubMed] [Google Scholar]
- 7.Gajbhiye N, Khristi S. Distribution pattern of andrographolide and total lactones in different parts of Kalmegh plant. Indian J. Hortic. 2010;67:591–593. [Google Scholar]
- 8.Pandey A, Mandal A. Variation in morphological characteristics and andrographolide content in Andrographis paniculata (Burm.f.) Nees of Central India. Iran. J. Energy Environ. 2010;1(2):165–169. [Google Scholar]
- 9.Shuib NH, et al. Discrimination of young and mature leaves of Melicope ptelefolia using 1H NMR and multivariate data analysis. Food Chem. 2011;126(2):640–645. doi: 10.1016/j.foodchem.2010.10.043. [DOI] [Google Scholar]
- 10.Raya KB, et al. Changes in phytochemical contents in different parts of Clinacanthus nutans (Burm. f.) lindau due to storage duration. Bragantia. 2015;74:445–452. doi: 10.1590/1678-4499.0469. [DOI] [Google Scholar]
- 11.Lawal U, et al. Metabolite profiling of Ipomoea aquatica at different growth stages in correlation to the antioxidant and α-glucosidase inhibitory activities elucidated by 1H NMR-based metabolomics. Sci. Hortic. (Amsterdam). 2015;192:400–408. doi: 10.1016/j.scienta.2015.06.036. [DOI] [Google Scholar]
- 12.Yusof NA, et al. Infrared-metabolomics approach in detecting changes in Andrographis paniculata metabolites due to different harvesting ages and times. J. Sci. Food Agric. 2015;95(12):2533–2543. doi: 10.1002/jsfa.6987. [DOI] [PubMed] [Google Scholar]
- 13.Mediani A, et al. Phytochemical and biological features of Phyllanthus niruri and Phyllanthus urinaria harvested at different growth stages revealed by 1H NMR-based metabolomics. Ind. Crops Prod. 2015;77:602–613. doi: 10.1016/j.indcrop.2015.09.036. [DOI] [Google Scholar]
- 14.Verpoorte R, Choi YH, Kim HK. NMR-based metabolomics at work in phytochemistry. Phytochem. Rev. 2007;6(1):3–14. doi: 10.1007/s11101-006-9031-3. [DOI] [Google Scholar]
- 15.Khoo LW, et al. Phytochemical diversity of Clinacanthus nutans extracts and their bioactivity correlations elucidated by NMR based metabolomics. Phytochem. Lett. 2015;14:123–133. doi: 10.1016/j.phytol.2015.09.015. [DOI] [Google Scholar]
- 16.Liu NQ, et al. Metabolomic investigation of the ethnopharmacological use of Artemisia afra with NMR spectroscopy and multivariate data analysis. J. Ethnopharmacol. 2010;128(1):230–235. doi: 10.1016/j.jep.2010.01.020. [DOI] [PubMed] [Google Scholar]
- 17.Maulidiani, Abas F, Khatib A, Shitan M, Shaari K, Lajis NH. Comparison of Partial Least Squares and Artificial Neural Network for the prediction of antioxidant activity in extract of Pegaga (Centella) varieties from 1H Nuclear Magnetic Resonance spectroscopy. Food Res. Int. 2013;54(1):852–860. doi: 10.1016/j.foodres.2013.08.029. [DOI] [Google Scholar]
- 18.Wong CL, et al. Rainfall Characteristics and Regionalization in Peninsular Malaysia Based on a High Resolution Gridded Data Set. Water. 2016;8:11. doi: 10.3390/w8110500. [DOI] [Google Scholar]
- 19.Shahid S, et al. Impacts and adaptation to climate change in Malaysian real estate. Int. J. Clim. Chang. Strateg. Manag. 2016;9(1):87–103. doi: 10.1108/IJCCSM-01-2016-0001. [DOI] [Google Scholar]
- 20.Deni SM, Jemain AA, Ibrahim K. The best probability models for dry and wet spells in Peninsular Malaysia during monsoon seasons. Int. J. Climatol. 2009;30(8):1194–1205. doi: 10.1002/joc.1972. [DOI] [Google Scholar]
- 21.Talei D, Valdiani A, Abdullah MP, Hassan SA. A rapid and effective method for dormancy breakage and germination of King of Bitters (Andrographis paniculata Nees.) seeds. Maydica. 2012;57(2):98–105. [Google Scholar]
- 22.Tajidin NE, et al. Growth Dynamics and Yield of Andrographis paniculata (Burm. F) Nees As Influence By Plant Harvest. Age. Int. J. Agric. Environ. Bioresearch. 2017;2(2):178–195. [Google Scholar]
- 23.Kim HK, Choi YH, Verpoorte R. NMR-based metabolomic analysis of plants. Nat. Protoc. 2010;5(3):536–549. doi: 10.1038/nprot.2009.237. [DOI] [PubMed] [Google Scholar]
- 24.Mediani A, Abas F, Ping TC, Khatib A, Lajis NH. Influence of Growth Stage and Season on the Antioxidant Constituents of Cosmos caudatus. Plant Foods Hum. Nutr. 2012;67(4):344–350. doi: 10.1007/s11130-012-0317-x. [DOI] [PubMed] [Google Scholar]
- 25.Ghasemzadeh A, et al. Variation in secondary metabolite production as well as antioxidant and antibacterial activities of Zingiber zerumbet (L.) at different stages of growth. BMC Complement. Altern. Med. 2016;16(1):104. doi: 10.1186/s12906-016-1072-6. [DOI] [PMC free article] [PubMed] [Google Scholar]
- 26.Tiwari R, Rana CS. Plant secondary metabolites: A review. Int. J. Eng. Res. Gen. Sci. 2015;3(5):661–670. [Google Scholar]
- 27.Oh M-M, Carey EE, Rajashekar CB. Regulated Water Deficits Improve Phytochemical Concentration in Lettuce. J. Am. Soc. Hortic. Sci. 2010;135(3):223–229. doi: 10.21273/JASHS.135.3.223. [DOI] [Google Scholar]
- 28.Brenes-Arguedas T, et al. Contrasting mechanisms of secondary metabolite accumulation during leaf development in two tropical tree species with different leaf expansion strategies. Oecologia. 2006;149(1):91–100. doi: 10.1007/s00442-006-0423-2. [DOI] [PubMed] [Google Scholar]
- 29.El Senousy AS, Farag MA, Al-Mahdy DA, Wessjohann LA. Developmental changes in leaf phenolics composition from three artichoke cvs. (Cynara scolymus) as determined via UHPLC–MS and chemometrics. Phytochemistry. 2014;108:67–76. doi: 10.1016/j.phytochem.2014.09.004. [DOI] [PubMed] [Google Scholar]
- 30.Wingler A, von Schaewen A, Leegood RC, Lea PJ, Paul Quick W. Regulation of Leaf Senescence by Cytokinin, Sugars, and Light. Plant Physiol. 1998;116(1):329–335. doi: 10.1104/pp.116.1.329. [DOI] [Google Scholar]
- 31.Rolland F, Baena-Gonzalez E, Sheen J. Sugar Sensing and Signaling in Plants: Conserved and Novel Mechanisms. Annu. Rev. Plant Biol. 2006;57(1):675–709. doi: 10.1146/annurev.arplant.57.032905.105441. [DOI] [PubMed] [Google Scholar]
- 32.Elger A, Lemoine DG, Fenner M, Hanley ME. Plant ontogeny and chemical defence: older seedlings are better defended. Oikos. 2009;118(5):767–773. doi: 10.1111/j.1600-0706.2009.17206.x. [DOI] [Google Scholar]
- 33.Borzak CL, Potts BM, Davies NW, O’Reilly-Wapstra JM. Population divergence in the ontogenetic trajectories of foliar terpenes of a Eucalyptus species. Ann. Bot. 2015;115(1):159–170. doi: 10.1093/aob/mcu222. [DOI] [PMC free article] [PubMed] [Google Scholar]
- 34.Ashok K, Amit A, Sujatha M, Murali B, Anand MS. Effect of aging on andrographolide content in Andrographis paniculata. J. Nat. Remedies. 2002;2(2):79–81. [Google Scholar]
- 35.Bhan MK, et al. Screening and optimization of Andrographis paniculata (Burm.f.) Nees for total andrographolide content, yield and its components. Sci. Hortic. (Amsterdam. 2006;107(4):386–391. doi: 10.1016/j.scienta.2005.09.001. [DOI] [Google Scholar]
- 36.Kumar S, Kumar A. Spatial and harvesting influence on growth, yield, quality, and economic potential of Kalmegh (Andrographis paniculata Wall Ex. Nees) J. Agric. Rural Dev. Trop. Subtrop. 2013;114(1):69–76. [Google Scholar]
- 37.Ainsworth EA, Bush DR. Carbohydrate Export from the Leaf: A Highly Regulated Process and Target to Enhance Photosynthesis and Productivity. Plant Physiol. 2011;155(1):64–69. doi: 10.1104/pp.110.167684. [DOI] [PMC free article] [PubMed] [Google Scholar]
Associated Data
This section collects any data citations, data availability statements, or supplementary materials included in this article.