Abstract
Objective
Postoperative complications adversely affected the prognosis in patients with gastric cancer. This study intends to investigate the feasibility of using machine-learning model to predict surgical outcomes in patients undergoing gastrectomy.
Methods
In this study, cancer patients who underwent gastrectomy at Shanghai Rui Jin Hospital in 2017 were randomly assigned to a development or validation cohort in a 9:1 ratio. A support vector classification (SVC) model to predict surgical outcomes in patients undergoing gastrectomy was developed and further validated.
Results
A total of 321 patients with 32 features were collected. The positive and negative outcomes of postoperative complication after gastrectomy appeared in 100 (31.2%) and 221 (68.8%) patients, respectively. The SVC model was constructed to predict surgical outcomes in patients undergoing gastrectomy. The accuracy of 10-fold cross validation and external verification was 78.17% and 78.12%, respectively. Further, an online web server has been developed to share the SVC model for machine-learning-assisted prediction of surgical outcomes in patients undergoing gastrectomy in the future procedures, which is accessible at the web address: http://47.100.47.97:5005/r_model_prediction.
Conclusions
The SVC model was a useful predictor for measuring the risk of postoperative complications after gastrectomy, which may help stratify patients with different overall status for choice of surgical procedure or other treatments. It can be expected that machine-learning models in cancer informatics research are possibly shareable and accessible via web address all over the world.
Keywords: Gastric cancer, postoperative complications, machine-learning models, support vector classification
Introduction
Gastric cancer is one of the most common malignancies and the second leading cause of cancer death in the world. In China, more than 679,100 new diagnoses are made every year. An estimated 498,000 patients died from gastric cancer in 2015 (1). Surgery is the only possible curative treatment, and results of gastrectomy have improved throughout the years with respect to survival, morbidity and postoperative mortality (2).
Concerning the risk of postoperative complications, researchers would generally perform a Student’s t test or Chi square test to discover the risk factors. Other methods include prognostic nutritional index (PNI) (3), modified Glasgow prognostic score (mGPS) (4), the Estimation of Physiological Ability and Surgical Stress (E-PASS) scoring system (5), etc. However, the reliability and practicability of the previous criteria were indeterminate, and the previous methods could not account for the influence of each factor adopted in the equation.
In recent years, cancer informatics and machine-learning models have been successfully applied in cancer research (6,7). In this work, the support vector classification (SVC) model was constructed to predict surgical outcomes in patients undergoing gastrectomy. Furthermore, we provided the web-server for researchers to utilize the model available in this work. Below, we are to describe how to develop a machine-learning model in detail, making the following six steps very clear: 1) how to collect a valid benchmark dataset to train and test the model; 2) how to check basic statistics of features available; 3) how to construct the optimal model based on data pretreatment, feature reduction, model selection, and model optimization; 4) how to evaluate the anticipated accuracy of the model; 5) how to establish an user-friendly web-server for the model that are accessible to the public; and 6) how to apply the model in diagnosing and taking care of patients after gastrectomy.
Materials and methods
Data collection of patients and variables
This study enrolled 321 patients who were diagnosed with gastric cancer and underwent gastrectomy with lymph node dissection in 2017 at Rui Jin Hospital affiliated to Shanghai Jiao Tong University. Patients who received chemotherapy and who underwent emergency surgery were excluded from the study. Ninety percent of the patients were randomly selected as training set, while the other 10 percent were used as testing set. In this work, we retrospectively reviewed clinical data only in past one year, because surgical and nursing technique has been developed rapidly in recent years. In our center, the number of patients who underwent laparoscopic surgery and enhanced recovery after surgery (ERAS) was increasing in the past few years. Thus, we decided to collect data from the most recent year to construct the model for predicting surgical outcomes in patients undergoing gastrectomy.
We retrospectively reviewed medical history, laboratory findings, operative findings, and surgical outcomes in patients undergoing gastrectomy. Variables included in this study were listed in Table 1 . Age was defined at the time of surgery. Body height and weight were measured on admission day.
1.
Variables included in this study
| Category | Variables |
| BMI, body mass index; WBC, while blood cell; RBC, red blood cell; HBG, hemoglobin; PLT, platelet counts; GLU, glucose; ALT, alanine aminotransferase; AST, aspartate aminotransferase; TBIL, total bilirubin; DBIL, direct bilirubin; TP, total protein; ALB, albumin; CREA, creatinine; BUN, blood urea nitrogen. | |
| Baseline information | Gender, age, weight, height, BMI, length of preoperative stay, number of comorbidities, tumor size |
| Routine blood test | WBC counts, lymphocyte counts, RBC counts, HBG, PLT counts |
| Chemistry profile | Blood GLU, ALT, AST, TBIL, direct bilirubin DBIL, TP, ALB, CREA, BUN |
| Surgical procedure | Surgery mode (open or laparoscopic), range of resection (total or subtotal gastrectomy), type of anastomosis (Billroth I or other methods), combined resection, length of anesthesia, length of surgery, blood transfusion, blood loss, urine volume, fluid intake |
In this work, patients with postoperative complications were categorized into “positive” group, while the others were categorized into “negative” group. The only endpoint of this study was analysis of in-patients’ morbidity. Postoperative complications were defined as either life-threatening or requiring significant deviation from standard management. These correlate to the Clavien-Dindo classification of Grade II and above complications (8).
Machine-learning methods for classification and prediction
In this work, supervised machine-learning methods including SVC, k-Nearest Neighbor (k-NN), linear discriminant analysis (LDA), general linear model (GLM) were used to construct classification models predicting postoperative complications. The data sets were randomly partitioned into 90% training set and 10% independent test set. Models were built using training set and validated using independent test set. The classification tasks were designed to evaluate the performances of different machine-learning models. For each classification task, feature reduction using principle component analysis was employed to select the most informative features among latent variables from the training set and to avoid overfitting. The optimal model was determined by the performances of the receiver operating characteristic (ROC) curves for different models on the training set. We built the models and selected the features using data only from the training set, in order to rigorously evaluate the performance of our finalized models with the independent test set. The inputs to the classification algorithms were the principle components, which were linear combination of quantitative features available as described in the previous section, and the surgical outcomes in patients undergoing gastrectomy were the predicted results of either positive group with postoperative complications or negative group. Considering the unbalanced data set consisting of positive and negative samples, Random Over-Sampling Examples (ROSE) (9-11) was carried out to deal with the class imbalance problems before modelling. Caret’s varImp function was used to assess feature importance, which calculates the area under the ROC curve. Introduction of mentioned machine-learning methods was provided in Supplementary materials .
Statistics and implementation
Statistical analyses and machine-learning algorithms were performed using R software (Version 3.5.0; R Foundation for Statistical Computing, Vienna, Austria) installed with caret and ROSE packages. Clinicopathological variables were analyzed using Chi-squared tests for discrete variables, and t-test for continuous variables. P values less than 0.05 were considered significant. The performance of model was evaluated by the area under the ROC curve, specificity and sensitivity, respectively. The ROC curve was created by plotting the true positive rate (TPR) against the false positive rate (FPR) at various threshold settings. TPR is also known as sensitivity, and FPR can be calculated as (1-specificity), which were given as follows:
 |
 |
where TP is true positive, FP is false positive, TN is true negative, and FN is false negative in the prediction results. All computations were carried out on an Intel Core i7 computer with a 4-core 2.7 GHz processor.
Results
Workflow of machine-learning process
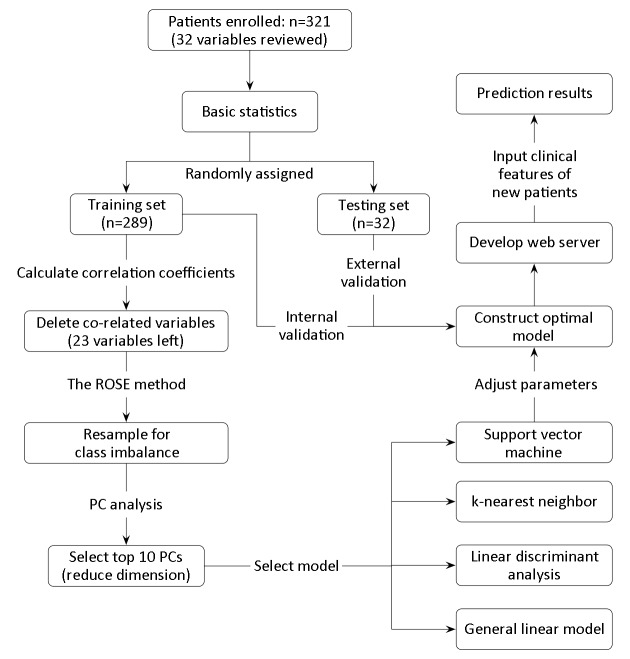
In this work, the machine-learning process can be illustrated in Figure 1 . The workflow of modelling mainly consists of procedures for basic statistics after collection of original data, data pretreatment such as deletion of co-related variables and resampling of data set, reduction of features via principal component analysis, model selection based on machine-learning approaches, model optimization via adjusting hyper-parameters, model validation, model accessibility, and model application.
1.
Workflow of machine-learning process. PC, principal component.
Baseline information
Clinical characteristics and corresponding complication rates were presented in Table 2 . Out of 321 patients, 100 (31.2%) were diagnosed with postoperative complications. Age (P<0.001), number of comorbidities (P=0.001), surgical mode (P=0.036), length of surgery (P=0.016) and tumor size (P=0.001) were significantly related to postoperative complications among the elderly patients.
2.
Baseline information of clinical features for all patients
| Variables | Complication [n (%)] | Total [n (%)] | P | |
| Yes | No | |||
| BMI, body mass index. | ||||
Age (year) (
 )
)
|
66.20±11.10 | 60.66±11.23 | 62.38±11.46 | <0.001 |
| Gender | 0.058 | |||
| Male | 72 (34.8) | 135 (65.2) | 207 (64.5) | |
| Female | 28 (24.6) | 86 (75.4) | 114 (35.5) | |
BMI (kg/m2) (
 )
)
|
23.75±3.62 | 23.15±3.02 | 23.34±3.22 | 0.147 |
Number of comorbidities (
 )
)
|
1.82±1.67 | 1.19±1.27 | 1.38±1.44 | 0.001 |
| Surgical mode | 0.036 | |||
| Open | 87 (33.9) | 170 (66.1) | 257 (80.1) | |
| Laparoscopic | 13 (20.3) | 51 (79.7) | 64 (19.9) | |
| Surgical procedure | 0.896 | |||
| Total gastrectomy | 21 (31.8) | 45 (68.2) | 66 (20.6) | |
| Subtotal gastrectomy | 79 (31.0) | 176 (69.0) | 255 (79.4) | |
Length of surgery (min) (
 )
)
|
192.6±57.4 | 177.5±49.6 | 182.2±52.5 | 0.016 |
Tumor size (cm) (
 )
)
|
3.90±2.30 | 3.07±2.02 | 3.33±2.14 | 0.001 |
Data pretreatment
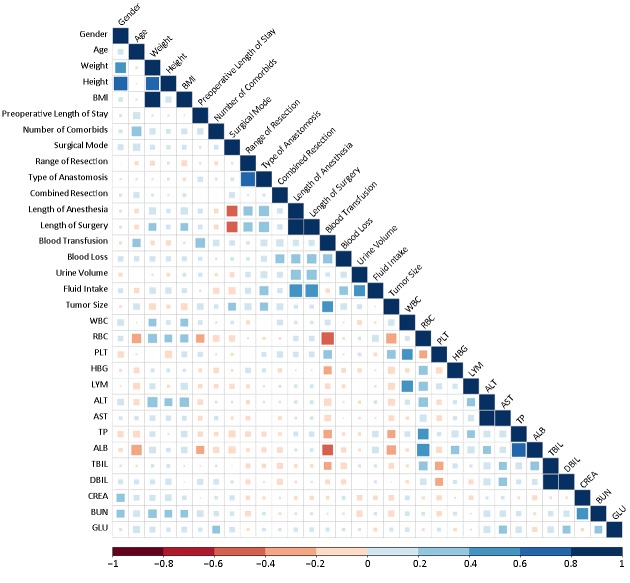
After splitting the data into training set (n=289) and testing set (n=32), one of data pretreatments is to check the co-linearity of the features in training set, since the model would be unsteady if there exist two features with co-linearity. After the computation of correlation coefficients between pairs of features (Figure 2 ), it was found that 9 correlation coefficients of feature pairs were more than 0.5. Therefore, 9 variables including weight, height, type of anastomosis, length of anesthesia, fluid intake, red blood cell (RBC), albumin (ALB), glutamic oxaloacetic transaminase (AST), and total bilirubin (TBIL) were deleted.
2.
Co-linearity of features in training set. BMI, body mass index; WBC, while blood cell; RBC, red blood cell; PLT, platelet; HBG, hemoglobin; LYM, lymphocyte absolute value; ALT, glutamic-pyruvic transaminase; AST, glutamic oxalacetic transaminase; TP, total protein; ALB, albumin; TBIL, total bilirubin; DBIL, direct bilirubin; CREA, creatinine; BUN, blood urea nitrogen; GLU, glucose.
Another data pretreatment is to resample data set for imbalanced distribution of different classes. In classification problems, a disparity in the frequencies of the observed classes can have a significant negative impact on model fitting. In this study, the number of patients with postoperative complications was less than half of that without complications (positive samples vs. negative samples: 31.2% vs. 68.8%). Thus, the ROSE method was executed to resample the unbalanced data set. After resampling, the seriousness of the effects of an imbalanced distribution was considerably relieved (positive samples vs. negative samples: 47.1% vs. 52.9%).
Feature reduction
Since overmuch variables would reduce the stability and reliability of the constructed models, the principal component analysis (PCA) method was used in this study to decrease the number of variables. It was found that the predictive models would be feasible by using the top 10 PCs as inputs of features (explained 67.6% of all variables).
Model selection
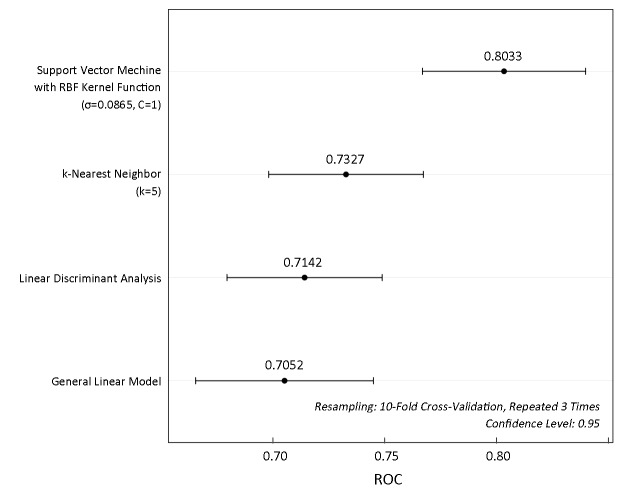
To concisely summarize the prediction performance of the models, we constructed ROC curves, which evaluate the performance of a model in a way that takes the uncertainty of each prediction into account. Figure 3 illustrates the ROC distributions constructed by SVC with RBF kernel function, k-NN, linear discriminant analysis (LDA), and general linear model (GLM) using the top 10 PCs as inputs of features, respectively. The ROC results indicated that the performance of SVC was better than those of the other methods. Thus, the SVC method with RBF kernel function was selected to construct the optimal model.
3.
Comparison of receiver operating characteristic (ROC) for different methods.
It was found that the classification performance of SVC model is strong because the area under the ROC curve was 0.8033, suggesting that this model would be useful in predicting postoperative complication after gastrectomy.
Model optimization
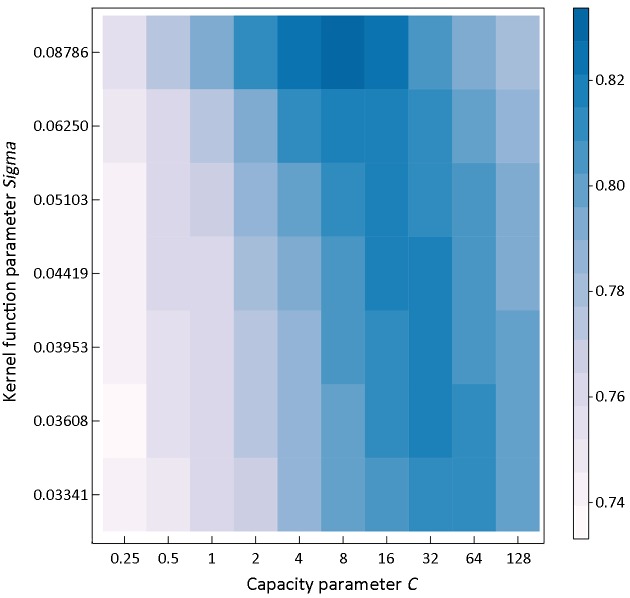
The optimal SVC model with RBF kernel function for discriminating different samples could be determined by two parameters, a capacity parameter C and a kernel function parameter σ. Figure 4 shows a ROC heatmap for tuning parameters of the optimal model. It could be concluded that the SVC model with capacity parameter C=8, using RBF kernel function with parameter σ=0.08786 could provide the best performance for predicting surgical outcomes in patients undergoing gastrectomy with the sensitivity of 81.73% and specificity of 72.55%. Based on the optimized parameters, the accuracy of training set would reach 94.81%, and the result of 10-fold cross validation showed that the accuracy was 78.17%, while the area under the ROC curve was 0.8275.
4.
Receiver operating characteristic (ROC) heatmap for tuning parameters. Resampling: 10-fold cross-validation, repeated 3 times.
Model validation
The effect of prediction verified by external dataset was 78.12%, with sensitivity of 90.91% and specificity of 50.00%. The result indicated that the SVC model available was efficient in predicting surgical outcomes in patients undergoing gastrectomy.
Model accessibility
In order to help surgeons to utilize the SVC model constructed in this work, an online web server was further developed for predicting surgical outcomes in patients undergoing gastrectomy. The online web server to share the model available for machine-learning-assisted prediction of surgical outcomes in patients undergoing gastrectomy can be accessible at the web address: http://47.100.47.97:5005/r_model_prediction.
Model application
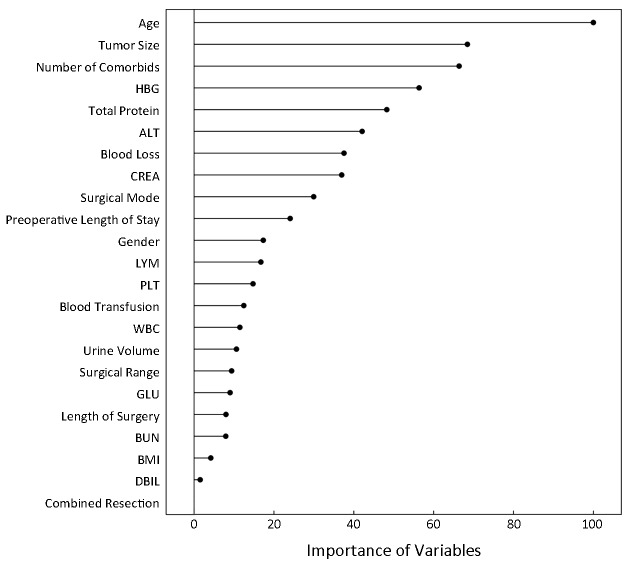
The model available can be used not only to predict surgical outcomes of new patients with gastric cancer undergoing gastrectomy but also to evaluate the importance of clinical features based on the Caret’s varImp function, and the rank was demonstrated in Figure 5 .
5.
Importance of clinical features via the model. HBG, hemoglobin; ALT, glutamic-pyruvic transaminase; CREA, creatinine; LYM, lymphocyte absolute value; PLT, platelet; WBC, while blood cell; GLU, glucose; BUN, blood urea nitrogen; BMI, body mass index; DBIL, direct bilirubin.
In the process of applying the model available via the web server, the surgeons need input the original data of clinical features. After receiving all of clinical features, the web server can provide online prediction of surgical outcomes in patients undergoing gastrectomy. Therefore, surgeons can obtain the predicted results and prepare further therapies for patients with postoperative complications after gastrectomy in advance. In particular, patients predicted negative outcomes exhibited a considerably reduced risk of postoperative complications, indicating that the SVC model is a helpful predictor of surgical outcomes in patients undergoing gastrectomy.
Discussion
To our knowledge, there are few studies applying machine-learning-assisted model to predict surgical outcomes in patients undergoing gastrectomy. In this study, we designed a workflow of machine-learning approach by using top 10 PCs as inputs coming from 23 clinical features. The machine-learning classifiers was built and evaluated for prediction of surgical outcomes in patients undergoing gastrectomy. We also validated our methodology using an independent test set and provided the online web server to share the model.
Our SVC model demonstrated that chronologic age was the most important variable concerning on postoperative complications after gastrectomy, followed by tumor size, number of comorbidities, etc. (Figure 5 ). These variables reflect both immunonutritional status and clinicopathological characteristics of surgical patients. Variables with higher rank may relate more closely to postoperative complications. For instance, elderly patients often have age-associated physiologic problems such as decreased organ reserve, concomitant comorbidities, and mental imbalance, leading to a higher risk for complications. Several articles also showed that age was an independent risk factor of postoperative complications, which indicated the relevance between machine-learning results and clinical facts (12,13). The SVC model also indicated that tumor size was the major variable related to postoperative complications after gastrectomy, in agreement with the report that the mean tumor size in the reoperation group was greater than that in the non-reoperation group (14). Besides the chronologic age and tumor size, our model also revealed that the number of comorbidities is among the top three important factors influencing postoperative complications, agreeing with the fact reported (15,16). In concordance with previous studies, basic statistics of this study confirmed that chronologic age was significantly correlated with postoperative complications (17,18). Univariate analysis also showed that number of comorbidities, tumor size, surgical mode, and length of surgery were significantly associated with postoperative complications, indicating that the risk of postoperative complication was related to multiple factors, including preoperative performance status, clinicopathological features, surgical stress, etc.
As the population ages, the number of surgical interventions in gastric cancer patients has been rapidly increasing in China. Overall, about 31% of patients occurred postoperative complications according to our data. Some researchers have pointed out that postoperative complications would adversely affect the overall survival in patients with cancer of digestive system (19,20). Mantovani et al. suggested that poor outcome might result from invisible residual tumor cells, the proliferation and metastasis of which could be promoted by inflammatory responses because of severe postoperative complications (21). Moreover, severe postoperative complications could also delay chemotherapy that was necessary to prolong the survival of patients with gastric cancer. Therefore, it is of importance to set up an informative model for the evaluation of performance status and the prediction of surgical outcome of elderly patients, considering the organic function and surgical invasion. A valid predictive model can be utilized to identify the appropriate treatment modality. There’s a very high probability that patients predicted negative outcomes may minimize cancer-related death and prolong disease-specific survival by allowing the recommended lymph node resection regardless of chronologic age or other factors. However, large prospective analyses are necessary to validate this recommendation.
Although this study has a number of strengths, it also has several limitations. Despite the successful application of machine-learning technology, which offers good sensitivity in postoperative complication identification, the specificity of external dataset was not high, which means the high-risk patients distinguished by prediction model might be not truly concurrent the postoperative complications. The possible implication of our model is to help doctors find patients who are more likely to suffer postoperative complications. Another limitation of this study is that the intraoperative features were essential for a better predictor, although the machine-learning model revealed the critical role of preoperative features. Further validation in additional cohorts of patients undergoing gastrectomy is necessary to confirm these conclusions in prospective research. We hope that the presented work provides readers with machine-learning tools that they can incorporate into their work.
Conclusions
To improve the long-term prognosis of patients with gastric cancer who have undergone gastrectomy, preventing postoperative complications is of critical importance. The SVC model available is a useful predictor for measuring the risk of postoperative morbidities and may help stratify patients with different overall status for choice of surgical procedures or other treatments.
Acknowledgements
None.
Footnote
Conflicts of Interest: The authors have no conflicts of interest to declare.
Supplementary materials
Machine-learning methods for classification and prediction
k-nearest neighbor (k-NN) classification
k-NN algorithm is one of the simplest machine-learning algorithms. In k-NN classification, an object is classified by a majority vote of its neighbors, with the object being assigned to the class most common among its k-NNs. The detailed algorithm can be found in Cover’s paper (1).
Linear discriminant analysis (LDA)
LDA is a generalization of Fisher’s linear discriminant, a method to find a linear combination of features that separates two or more classes of objects or events. LDA is closely related to logistic regression which also attempt to express one dependent variable as a linear combination of other features. The detailed algorithm can be found in Rao’s paper (2).
Support vector classification (SVC)
SVC is a very effective method for solving pattern recognition problems, and it is a learning machine method based on statistical learning theory proposed by Vapnik (3). The basic idea of applying SVC to pattern classification can be described as follows: suppose we are given a set of samples, that is, a series of input vectors xi∈Rm with corresponding labels (y1, x1), …, (yn, xn), y∈{−1, +1}; where −1 and +1 are used to stand, respectively, for the 2 classes. The goal here is to construct a binary classifier or derive a decision function from the available samples. The geometrical interpretation of SVC is that it determines the optimal separating surface, i.e. a hyperplane, which is equidistant from two sets of data points. This hyperplane has some statistical properties as discussed by Vapnik (4). Consider the problem of separating the set of training (input) vectors with a hyperplane:
 |
If the training data are linearly separable, then there exists a pair of parameter set (w, b), for which we can write:
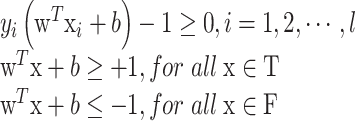 |
The decision rule is:
 |
where w and b are the weight vector and bias, respectively. Without loss of generality, the pair (w, b) can be rescaled:
 |
The learning problem is hence reformulated as follows. Let us minimize
 subject to the constraints of linear separability. This is equivalent to maximizing the distance, normal to the hyperplane, between the convex hulls of two classes and the optimization becomes a quadratic programming (QP) problem:
 |
subject to
 . This problem has global optimum, the Lagrangian is written as follows:
 |
where
 are the Lagrange multipliers, one for each data point. Hence we can write:
 |
note that the Lagrange multipliers are only non-zero when
 . Vectors fulfilling this requirement are called support vectors since they lie closest to the separating hyperplane. Then, the optimal separating hyperplane is given as follows:
 |
and the bias is given by:
 |
where xr and xs are any support vectors from each class satisfying the following equation:
 |
The classifier is then:
 |
In the case where a linear boundary is inappropriate, the SVC can map the input vector x into a higher dimensional feature space F. By choosing a non-linear mapping Φ, the SVC constructs an optimal separating hyperplane in this higher dimensional space, which is performed by a kernel function:
 |
Thus, the decision function implemented by SVC can be written as:
 |
where xi is the set of support vectors, and λi are obtained by solving the following convex quadratic programming problem:
 |
subject to:
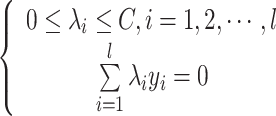 |
where C is a capacity parameter which controls the trade-off between the margin and misclassification error.
Acceptable kernel functions include polynomials, radial basis functions and certain sigmoid function. In this study, we choose radial basis functions (RBF) as the kernel function, which can be written as:
 |
The detailed theory and algorithm can be found in Vapnik’s papers (3,4).
10-fold cross-validation
During the process of 10-fold cross validation, the origin training sample is randomly partitioned into 10 equal sized subsamples. Each single subsample is in turn picked out as the validation data for testing the model, and the rest subsamples are used as training data. The procedure repeated 10 times, with each of the subsamples used exactly once as the validation data. In this research, the 10-fold cross validation was repeated 3 times to evaluate the generalization and reliability of the models built by machine-learning methods.
Principal component analysis (PCA)
PCA was used to transform the data to a smaller sub-space where new variables were uncorrelated with one another. PCA is a statistical procedure that uses an orthogonal transformation to convert a set of observations of possibly correlated variables into a set of values of linearly uncorrelated variables called principal components. This transformation is defined in such a way that the first principal component has the largest possible variance, and each succeeding component in turn has the highest variance possible under the constraint that it is orthogonal to the preceding components. The detailed algorithm can be found in Hotelling’s paper (5).
Random Over-Sampling Examples (ROSE) strategy to deal with class imbalance
ROSE provides a unified framework to deal with the class imbalance problems. It builds on the generation of new artificial examples from the classes, according to a smoothed bootstrap approach.
Consider a training set Tn, of size n, whose generic row is the pair
 . The class labels yi belong to the set {y0, yi}, and xi are some related attributes supposed to be realizations of a random vector x defined on Rd, with an unknown probability density function f(x). Let the number of units in class yj,j=0,1, be denoted by nj<n. The ROSE procedure for generating one new artificial example consists of the following steps:
1. Select y*=yj with probability πj.
2. Select
 , such that yi=y*, with probability
 .
.
3. Sample x* from
 , with
 a probability distribution centered at xi and covariance matrix Hj
The detailed algorithm can be found in Nicola’s paper (6).
References
1. Cover T, Hart P. Nearest neighbor pattern classification. IEEE Trans Inf Theory 1967;13:21-7.
2. Rao RC. The Utilization of Multiple Measurements in Problems of Biological Classification. J R Stat Soc Series B Stat Methodol 1948;10:159-203.
3. Vapnik VN. An overview of statistical learning theory. IEEE Trans Neural Netw 1997;10:988-99.
4. Vapnik VN. The Nature of Statistical Learning Theory. Springer: NewYork, 2000.
5. Hotelling H. Analysis of a complex of statistical variables into principal components. J Educ Psychol 1933;24:498.
6. Lunardon N, Menardi G, Torelli N. ROSE: A Package for Binary Imbalanced Learning. The R Journal 2014;6:79-89.
Contributor Information
Zhenggang Zhu, Email: zzg1954@hotmail.com.
Wencong Lu, Email: wclu@shu.edu.cn.
References
- 1.Chen W, Zheng R, Baade PD, et al Cancer statistics in China, 2015. CA Cancer J Clin. 2016;66:115–32. doi: 10.3322/caac.21338. [DOI] [PubMed] [Google Scholar]
- 2.Hartgrink HH, van de Velde CJ, Putter H, et al Extended lymph node dissection for gastric cancer: who may benefit? Final results of the randomized Dutch gastric cancer group trial. J Clin Oncol. 2004;22:2069–77. doi: 10.1200/JCO.2004.08.026. [DOI] [PubMed] [Google Scholar]
- 3.Watanabe M, Iwatsuki M, Iwagami S, et al Prognostic nutritional index predicts outcomes of gastrectomy in the elderly. World J Surg. 2012;36:1632–9. doi: 10.1007/s00268-012-1526-z. [DOI] [PubMed] [Google Scholar]
- 4.Nozoe T, Iguchi T, Egashira A, et al Significance of modified Glasgow prognostic score as a useful indicator for prognosis of patients with gastric carcinoma. Am J Surg. 2011;201:186–91. doi: 10.1016/j.amjsurg.2010.01.030. [DOI] [PubMed] [Google Scholar]
- 5.Haga Y, Ikei S, Ogawa M Estimation of physiologic ability and surgical stress (E-PASS) as a new prediction scoring system for postoperative morbidity and mortality following elective gastrointestinal surgery. Surg Today. 1999;29:219–25. doi: 10.1007/BF02483010. [DOI] [PubMed] [Google Scholar]
- 6.Kibbe W, Klemm J, Quackenbush J Cancer informatics: new tools for a data-driven age in cancer research. Cancer Res. 2017;77:e1–e2. doi: 10.1158/0008-5472.CAN-17-2212. [DOI] [PubMed] [Google Scholar]
- 7.Li Z, Zhang D, Dai Y, et al Computed tomography-based radiomics for prediction of neoadjuvant chemotherapy outcomes in locally advanced gastric cancer: A pilot study. Chin J Cancer Res. 2018;30:406–14. doi: 10.21147/j.issn.1000-9604.2018.04.03. [DOI] [PMC free article] [PubMed] [Google Scholar]
- 8.Dindo D, Demartines N, Clavien PA Classification of surgical complications: a new proposal with evaluation in a cohort of 6336 patients and results of a survey. Ann Surg. 2004;240:205–13. doi: 10.1097/01.sla.0000133083.54934.ae. [DOI] [PMC free article] [PubMed] [Google Scholar]
- 9.Lunardon N, Menardi G, Torelli N ROSE: A Package for Binary Imbalanced Learning. The R Journal. 2014;6:79–89. doi: 10.32614/RJ-2014-008. [DOI] [Google Scholar]
- 10.Lupi C, Giaccio V, Mastronardi L, et al Exploring the features of agritourism and its contribution to rural development in Italy. Land Use Policy. 2017;64:383–90. doi: 10.1016/j.landusepol.2017.03.002>. [DOI] [Google Scholar]
- 11.Susan S, Kumar A SSOMaj-SMOTE-SSOMin: Three-step intelligent pruning of majority and minority samples for learning from imbalanced datasets . Applied Soft Computing. 2019;78:141–9. doi: 10.1016/j.asoc.2019.02.028>. [DOI] [Google Scholar]
- 12.Seo SH, Hur H, An CW, et al Operative risk factors in gastric cancer surgery for elderly patients. J Gastric Cancer. 2011;11:116–21. doi: 10.5230/jgc.2011.11.2.116. [DOI] [PMC free article] [PubMed] [Google Scholar]
- 13.Yu J, Hu J, Huang C, et al The impact of age and comorbidity on postoperative complications in patients with advanced gastric cancer after laparoscopic D2 gastrectomy: Results from the Chinese laparoscropic gastrointestinal surgery study (CLASS) group. Eur J Surg Oncol. 2013;39:1144–9. doi: 10.1016/j.ejso.2013.06.021. [DOI] [PubMed] [Google Scholar]
- 14.Yi HW, Kim SM, Kim SH, et al Complications leading reoperation after gastrectomy in patients with gastric cancer: frequency, type, and potential causes. J Gastric Cancer. 2013;13:242–6. doi: 10.5230/jgc.2013.13.4.242. [DOI] [PMC free article] [PubMed] [Google Scholar]
- 15.Kim W, Song KY, Lee HJ, et al The impact of comorbidity on surgical outcomes in laparoscopy-assisted distal gastrectomy: a retrospective analysis of multicenter results. Ann Surg. 2008;248:793–9. doi: 10.1097/sla.0b013e3181887516. [DOI] [PubMed] [Google Scholar]
- 16.Cho GS, Kim W, Kim HH, et al Multicentre study of the safety of laparoscopic subtotal gastrectomy for gastric cancer in the elderly. Br J Surg. 2009;96:1437–42. doi: 10.1002/bjs.6777. [DOI] [PubMed] [Google Scholar]
- 17.Orsenigo E, Tomajer V, Palo S, et al Impact of age on postoperative outcomes in 1118 gastric cancer patients undergoing surgical treatment. Gastric Cancer. 2007;10:39–44. doi: 10.1007/s10120-006-0409-0. [DOI] [PubMed] [Google Scholar]
- 18.Polanczyk CA, Marcantonio E, Goldman L, et al Impact of age on perioperative complications and length of stay in patients undergoing noncardiac surgery. Ann Intern Med. 2001;134:637–43. doi: 10.7326/0003-4819-134-8-200104170-00008. [DOI] [PubMed] [Google Scholar]
- 19.Tokunaga M, Tanizawa Y, Bando E, et al Poor survival rate in patients with postoperative intra-abdominal infectious complications following curative gastrectomy for gastric cancer. Ann Surg Oncol. 2012;20:1575–83. doi: 10.1245/s10434-012-2720-9. [DOI] [PubMed] [Google Scholar]
- 20.Kubota T, Hiki N, Sano T, et al Prognostic Significance of Complications after Curative Surgery for Gastric Cancer. Ann Surg Oncol. 2013;21:891–8. doi: 10.1245/s10434-013-3384-9. [DOI] [PubMed] [Google Scholar]
- 21.Mantovani A, Allavena P, Sica A, et al Cancer-related inflammation. Nature. 2008;454:436–44. doi: 10.1038/nature07205. [DOI] [PubMed] [Google Scholar]


