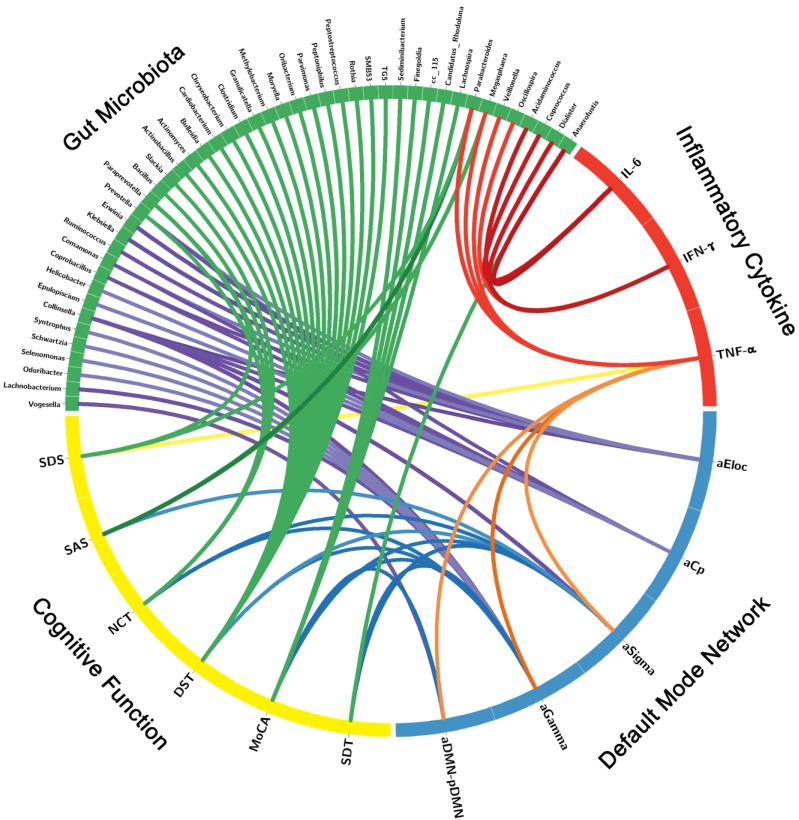
Figure 4.
Correlation Networks of Gut Microbiota, Inflammatory Cytokines, Cognitive Assessments and Brain Network Parameters. Graph shows correlations between gut microbiota, inflammatory cytokines, cognitive assessments and DMN parameters with group differences. Green block represents gut microbiota; yellow block represents cognitive function; blue block represents default mode network; red block represents inflammatory cytokine. Link transparency encodes the r value: the lower color opacity corresponds to the smaller absolute r value of the correlation; and the higher opacity corresponds to the larger absolute r value of the correlation.

