Abstract
Long non-coding RNAs (lncRNAs) are largely heterogeneous and functionally uncharacterized. Here, using FANTOM5 cap analysis of gene expression (CAGE) data, we integrate multiple transcript collections to generate a comprehensive atlas of 27,919 human lncRNA genes with high-confidence 5′ ends and expression profiles across 1,829 samples from the major human primary cell types and tissues. Genomic and epigenomic classification of these lncRNAs reveals that most intergenic lncRNAs originate from enhancers rather than from promoters. Incorporating genetic and expression data, we show that lncRNAs overlapping trait-associated single nucleotide polymorphisms are specifically expressed in cell types relevant to the traits, implicating these lncRNAs in multiple diseases. We further demonstrate that lncRNAs overlapping expression quantitative trait loci (eQTL)-associated single nucleotide polymorphisms of messenger RNAs are co-expressed with the corresponding messenger RNAs, suggesting their potential roles in transcriptional regulation. Combining these findings with conservation data, we identify 19,175 potentially functional lncRNAs in the human genome.
The human genome is pervasively transcribed1,2, producing thousands of lncRNAs3–5. Despite a few well-characterized examples6, for example MALAT1 (ref. 7), most lncRNAs have low abundance and lack typical signatures of selective constraints4,5. In addition, a substantial fraction of lncRNAs seem to be unstable8 and originate from regulatory regions of other functional units, for example promoter upstream transcripts (PROMPTs)9 and enhancer RNAs10. Given their diversity in biogenesis11, their low expression and conservation levels, the functional relevance12 of most lncRNAs remains unclear. Further, at some lncRNA loci it is not their transcripts but the mere act of transcription that is functionally relevant13. Thus the functionality of these lncRNA loci is more likely to be revealed by assessing the selective constraints14 and genetic variations15–17 within their regulatory regions than their transcript sequences. This emphasizes the need to gather transcript models with accurate 5′ ends. Currently available lncRNA catalogues are, however, mostly derived from RNA sequencing (RNA-seq) assemblies3,4 and the 5′ ends of their transcript models are generally inaccurate18.
Here we integrate multiple collections of transcript models2–4,19 with CAGE20 data sets10,21,22 to build an atlas of human lncRNAs with accurate 5′ ends. Having these 5′ complete transcript models allows us to better assess the sequence features and selective constraints at lncRNA loci, and categorize them on the basis of epigenetic marks at their transcription initiation regions (TIRs). We further integrate genetic data sets15–17 with 1,829 expression profiles from the FANTOM5 project10,21,22 (Supplementary Table 1) to identify potentially functional lncRNAs. Taken together, this study systematically elucidates the diversity of lncRNAs and summarizes the functional relevance of nearly 20,000 lncRNAs as an online resource, which can be further used in prioritizing lncRNA candidates for functional studies.
Building a 5′ complete transcriptome
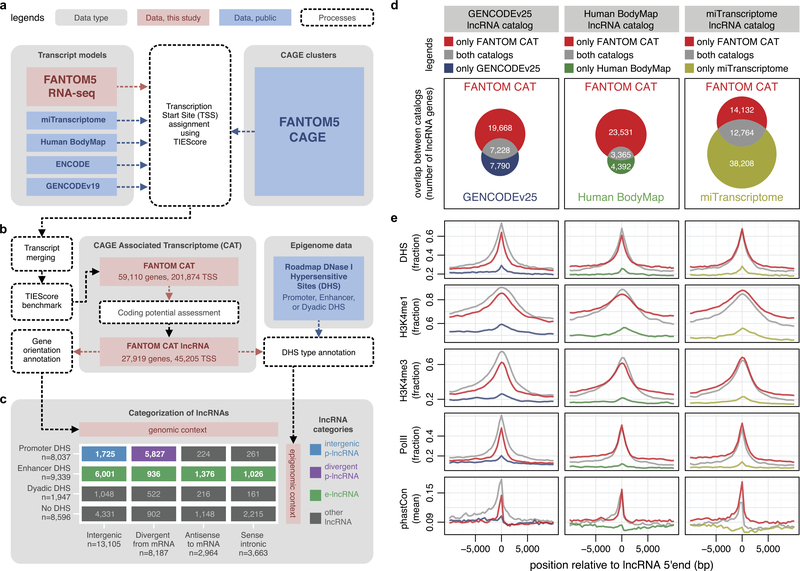
To build a 5′ complete transcriptome atlas, we first collected transcript models from GENCODE release 19 (ref. 19), Human BodyMap 2.0 (ref. 4), miTranscriptome3, ENCODE2 and an RNA-seq assembly from 70 FANTOM5 samples (Extended Data Fig. 1a, Methods and Supplementary Table 2). To identify 5′ complete transcript models, we developed the transcription initiation evidence score (TIEScore). For a given pair of CAGE cluster and transcript model, TIEScore evaluates three criteria: (1) the expression level of the CAGE cluster, (2) the distance from the transcript 5′ end to the CAGE cluster and (3) the length and number of exons of a transcript, to determine the likelihood that they identify a genuine transcription start site (TSS) (Supplementary Note 1 and Methods). We next assessed the performance of TIEScore on 70 matched CAGE and RNA-seq data sets on the basis of epigenomic information23, and found that TIEScore outperformed both CAGE-only and RNA-seq-only approaches in identifying genuine TSSs (Supplementary Note 2 and Methods). We then applied TIEScore to each of the five transcript model collections separately and merged them into a meta-assembly referred to as the FANTOM CAGE-associated transcriptome (FANTOM CAT) (Extended Data Fig. 1a, b). Finally, we defined genes at permissive (n = 124,245), robust (n = 59,110) and stringent (n = 31,520) TIEScore cutoffs (Supplementary Note 3 and Methods). The robust cutoff defines the FANTOM CAT genes used in the remainder of the manuscript (Supplementary Table 3), unless otherwise specified.
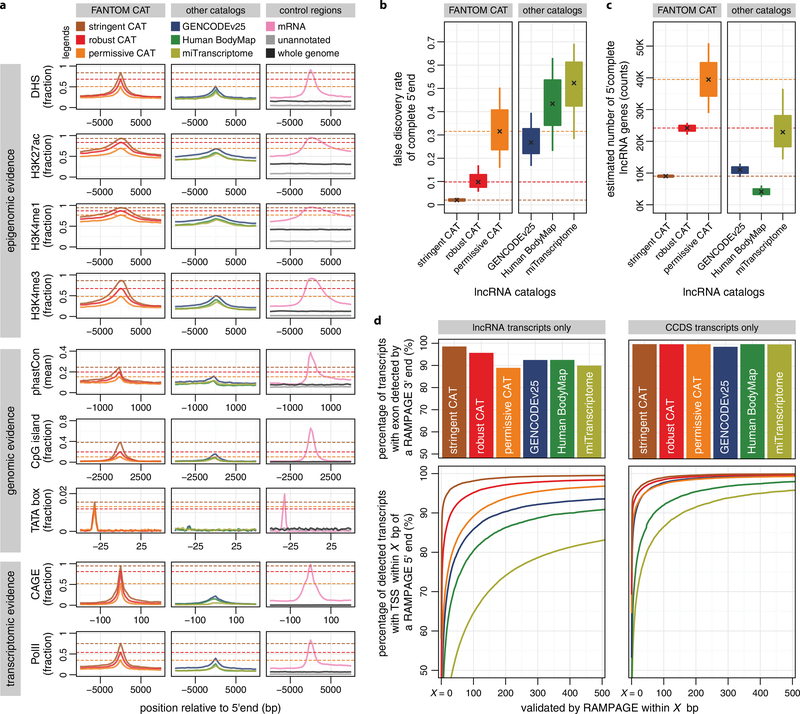
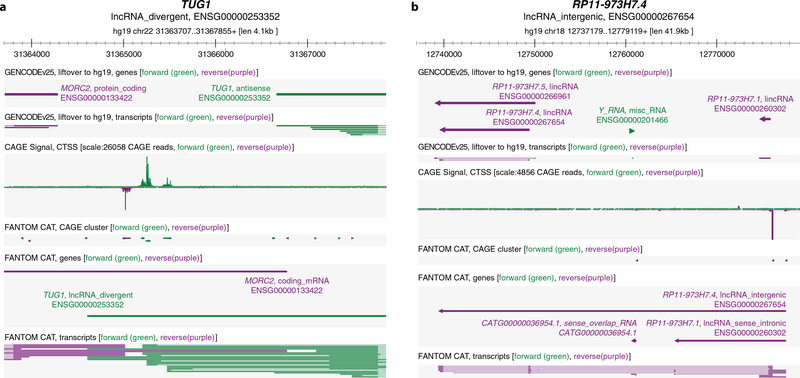
We next defined 27,919 lncRNA genes in FANTOM CAT on the basis of Coding-Potential Assessment Tool (CPAT)24 scores and GENCODE release 19 annotations19 (Methods and Extended Data Fig. 1b). The 5′ ends of our lncRNA transcript models show stronger evidence for being genuine TSSs than those in other catalogues (Extended Data Fig. 1d, e and Extended Data Fig. 2a). Furthermore, the FANTOM CAT catalogue has a lower false discovery rate (FDR) of complete 5′ ends (Extended Data Fig. 2b) and contains more 5′ complete transcript models (Extended Data Fig. 2c), as further validated by RAMPAGE data25 (Extended Data Fig. 2d). Taken together, FANTOM CAT improves the existing lncRNA transcript models (examples in Extended Data Fig. 3 and Supplementary Note 4) and provides the most comprehensive catalogue of human lncRNAs so far.
lncRNA TIRs
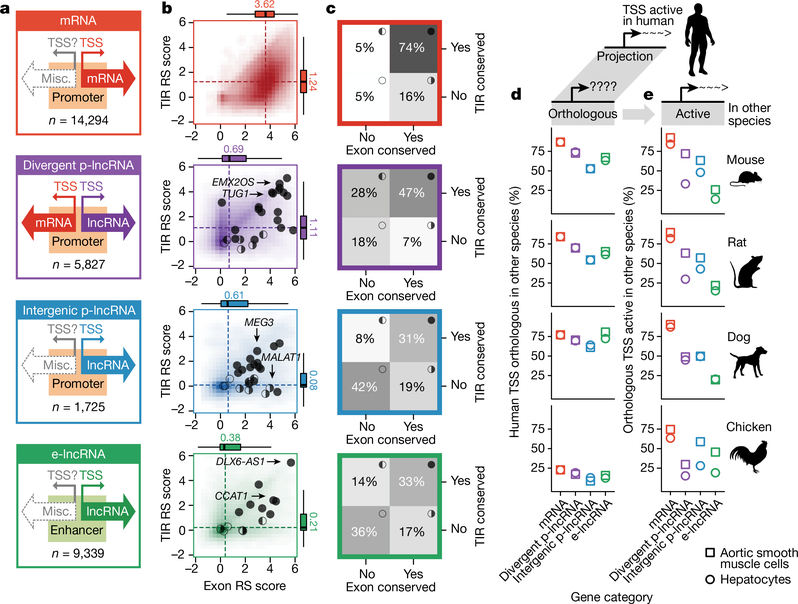
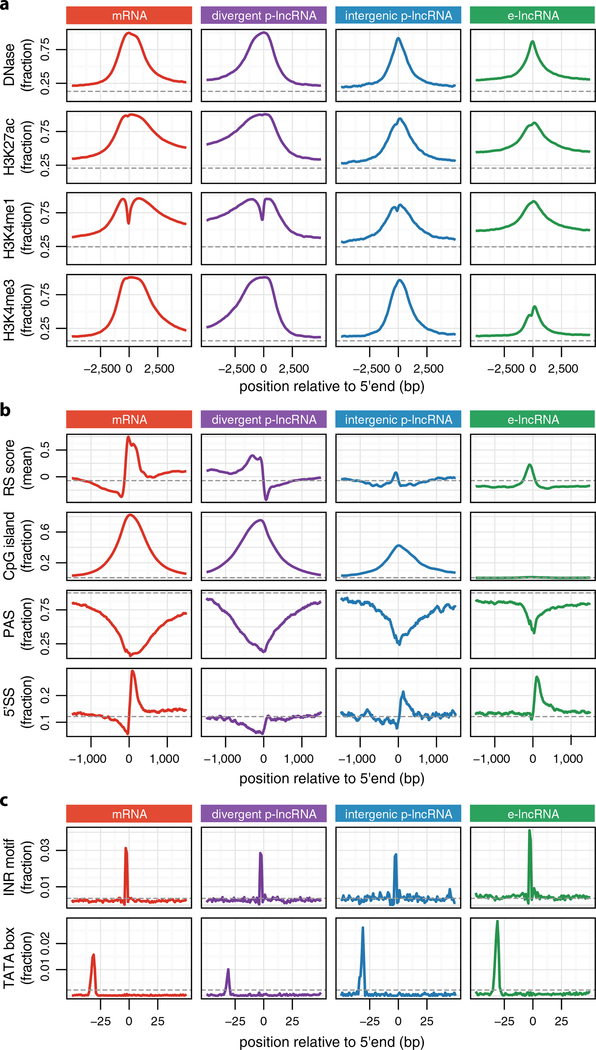
Next, we categorized lncRNAs on the basis of the overlap between their TSSs and the DNase I hypersensitive sites (DHSs) previously classified as promoter, enhancer or dyadic regulatory regions23 (Fig. 1a and Extended Data Fig. 1b, c). We found that a large fraction of DHS-supported intergenic lncRNAs (68%) originate from enhancer DHSs (e-lncRNA, Extended Data Fig. 1c). For lncRNAs originating from promoter DHSs, most (72%), were divergently transcribed from messenger RNA (mRNA) TSS (divergent p-lncRNA, Extended Data Fig. 1c) as previously observed in mouse erythroblasts26, and surprisingly only a minority, for example MALAT1 (ref. 7), were intergenic (intergenic p-lncRNA, Extended Data Fig. 1c). Histone marks at the TIRs of these lncRNA categories recapitulate the epigenomic features of their regulatory regions (Extended Data Fig. 4a).
Figure 1 |. Conservation of lncRNAs.
a, Categories of lncRNAs. b, Rejected substitution (RS) scores14. Per-nucleotide values of the highest scoring window (200 nt) were plotted. Box plots show the median (dashed lines), quartiles and Tukey whiskers. Circles indicate functional lncRNAs from lncRNAdb6. The filled, half-filled and empty circles represent different TIR and exon conservation scenarios as in c. c, Percentages of genes (grey scale) defined to have conserved TIR, exon or both, based on GERP elements14. d, Percentages of all orthologous human TSSs. e, Percentages of active orthologous human TSSs.
Leveraging the 5′ completeness of FANTOM CAT, we revisited1,27 the analysis of sequence features at TIRs of mRNAs and lncRNAs. First, we examined the overall selective constraints on the basis of rejected substitution score14. For mRNAs, we observed strongly positive rejected substitution scores at their TSSs and slightly negative scores upstream (Extended Data Fig. 4b, first row). For divergent p-lncRNAs, we observed a mirrored pattern to their mRNA counterpart, as expected (Extended Data Fig. 4b, first row). Although intergenic p-lncRNAs and e-lncRNAs showed only slightly positive rejected substitution scores at their TIRs (Extended Data Fig. 4b, first row), we observed sequence features conducive to generating long transcripts (Extended Data Fig. 4b, third and fourth rows) and enrichment of motifs involved in transcription initiation (Extended Data Fig. 4c). Taken together, these suggest that at least a subset of intergenic p-lncRNA and e-lncRNA TIRs have undergone selection for both transcription initiation and elongation.
Directionality and stability of lncRNAs
Transcription initiation is intrinsically bidirectional28. Functionally distinct RNA species were previously categorized by their transcriptional directionality and by exosome sensitivity8. For each lncRNA category we examined the relationship between transcriptional directionality, exosome sensitivity and the properties of their transcripts (Supplementary Note 5 and Supplementary Table 4). We found that most divergent p-lncRNAs are exosome sensitive, short and rarely spliced (that is, PROMPT9 like), in contrast to intergenic p-lncRNAs, which are less exosome sensitive, longer and more spliced (Supplementary Note 5). In addition, while most e-lncRNA TIRs are bidirectionally transcribed, as previously described10 (Supplementary Note 5), we also identified a subset of unidirectional e-lncRNAs which captures documented functional examples (for example CCAT1, which promotes long-range chromatin looping29).
lncRNA conservation
We next investigated the conservation of TIRs and exonic regions using rejected substitution scores14 (Fig. 1b and Methods). Generally, exonic regions from all three lncRNA categories (median ≤ 0.69) were less conserved than mRNAs (median = 3.62), and TIRs of intergenic p-lncRNAs and e-lncRNAs were less conserved than those of divergent p-lncRNAs and mRNAs (Fig. 1b). Of note, functional examples from lncRNAdb6 fall across all lncRNA categories (Fig. 1b, circles, and Supplementary Table 5), and generally have more conserved TIRs and exonic regions (Fig. 1b, above medians indicated by dashed lines). This could suggest that functional lncRNAs are more conserved but could also reflect the bias during candidate selection for characterization, as conservation has often been used as a criterion to prioritize lncRNAs for functional studies30.
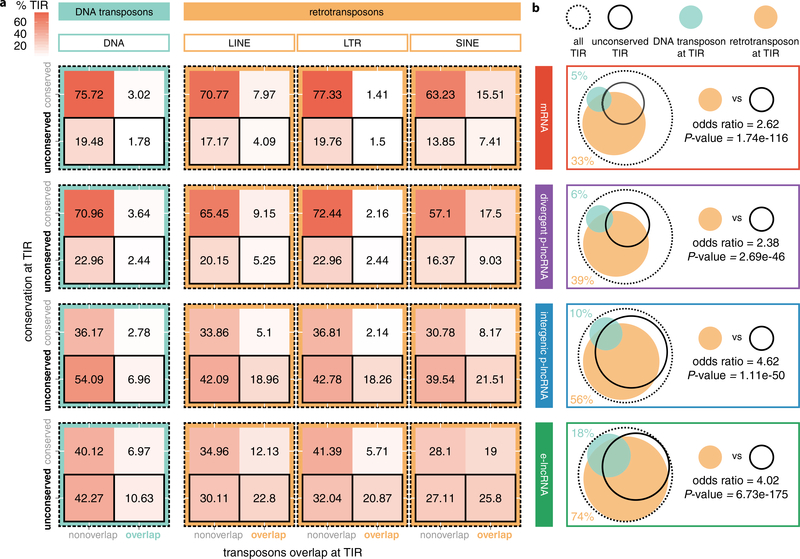
We next annotated lncRNAs with conserved TIRs or conserved exonic regions on the basis of their overlap with predefined selectively constrained regions (genomic evolutionary rate profiling (GERP) elements)14, against random expectations (Fig. 1c, one-tailed binomial test, P < 0.05, Methods). Under this criterion, 64% of lncRNAs were defined to have either conserved TIRs or conserved exonic regions (Supplementary Table 6). Examining the overlap between transposons and TIRs revealed the extensive presence of retrotransposons at TIRs (Extended Data Fig. 5a, Supplementary Table 7 and Methods). We found that most e-lncRNA (74%) and intergenic p-lncRNA (56%) TIRs overlap retrotransposons (Extended Data Fig. 5b). The retrotransposons are significantly enriched in unconserved TIRs of all gene categories (Extended Data Fig. 5b, one-tailed Fisher’s exact test, P < 0.05), implying the contribution of retrotransposons to the birth of TIRs, in particular of e-lncRNAs and intergenic p-lncRNAs31.
As sequence conservation does not imply conserved transcriptional activity across species, we assessed the orthologous transcriptional activity of lncRNA TSSs using CAGE profiles of aortic smooth muscle cells and hepatocytes from human, mouse, rat, dog and chicken (Supplementary Table 8). Most (>50%) TSSs active in the two human cell types had orthologous sequences in other mammalian species but the extent varied across gene categories, with mRNA TSSs being the most orthologous and intergenic p-lncRNA TSSs the least (Fig. 1d). Of these orthologous TSSs, varying fractions were active in the matched cell types of other mammalian species: ~85% for mRNAs, ~65% for divergent p-lncRNAs, ~50% for intergenic p-lncRNAs and ~20% for e-lncRNAs (Fig. 1e). Despite the comparable percentages of orthologous TSSs for p-lncRNAs and e-lncRNAs (Fig. 1d), the higher levels of conserved activity of p-lncRNAs compared with e-lncRNAs (Fig. 1e) supports previous observations that the activity of enhancers evolves at a faster pace than that of promoters32.
Expression specificity of lncRNAs
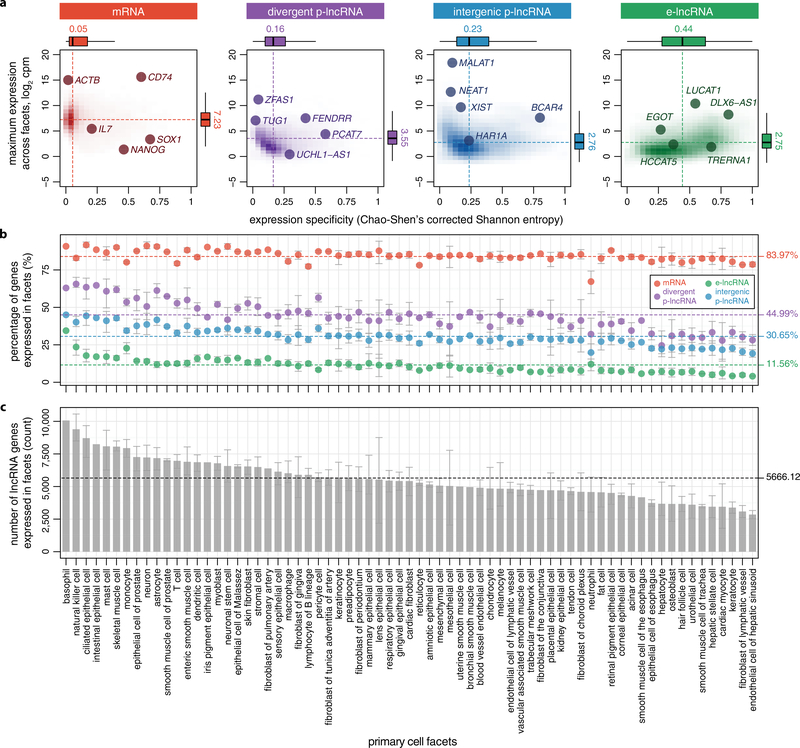
To assess the expression specificity of lncRNAs, we calculated their expression level and specificity across 69 primary cell facets10 (Methods). Despite comparable expression levels across all lncRNA categories, e-lncRNAs were considerably more cell-type-specific (median = 0.44) than p-lncRNAs (median = 0.16 and 0.23) as previously reported4,5 (Extended Data Fig. 6a). This is reflected in the lower fraction of e-lncRNAs (11.56%) expressed in each facet (Extended Data Fig. 6b). On average 5,666 lncRNA genes were found expressed in each facet (Extended Data Fig. 6c and Supplementary Table 9).
lncRNAs implicated in GWAS traits
Given the cell-type-specific nature of lncRNA expression, the types of cell in which a given lncRNA is specifically expressed may be used as a cue to its functions: for example, lncRNAs playing roles in maintaining pluripotency may be specifically expressed in stem cells33. Therefore, we identified genes with enriched expression in various tissues and cells on the basis of FANTOM5 sample ontology annotations21 (Supplementary Table 10 and Methods, one-tailed Mann-Whitney rank sum test, P < 0.05). This identified known associations such as enriched expression of the pluripotency-maintaining lncRNA (IncRNA-ES1, ENSG00000226673)33 in embryonic stem cells (CL:0002248). In total, 85% of FANTOM CAT genes were found to have enriched expression in at least one sample ontology term (for simplicity we refer to these as ‘cell-type-enriched genes’, Supplementary Table 11).
Taking advantage of the single nucleotide polymorphisms (SNPs) associated with human traits identified from genome-wide association studies (GWAS)15 and from fine-mapping studies based on probabilistic identification of causal SNPs (PICS)17 (Supplementary Table 12 and Methods), we associated 40.7% of FANTOM CAT genes with at least one trait (for simplicity we refer to these as ‘trait-associated genes’, Supplementary Table 13).
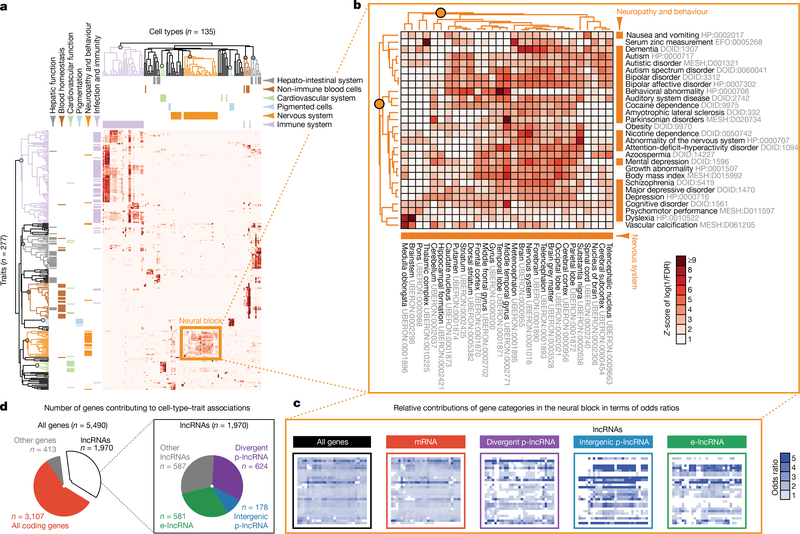
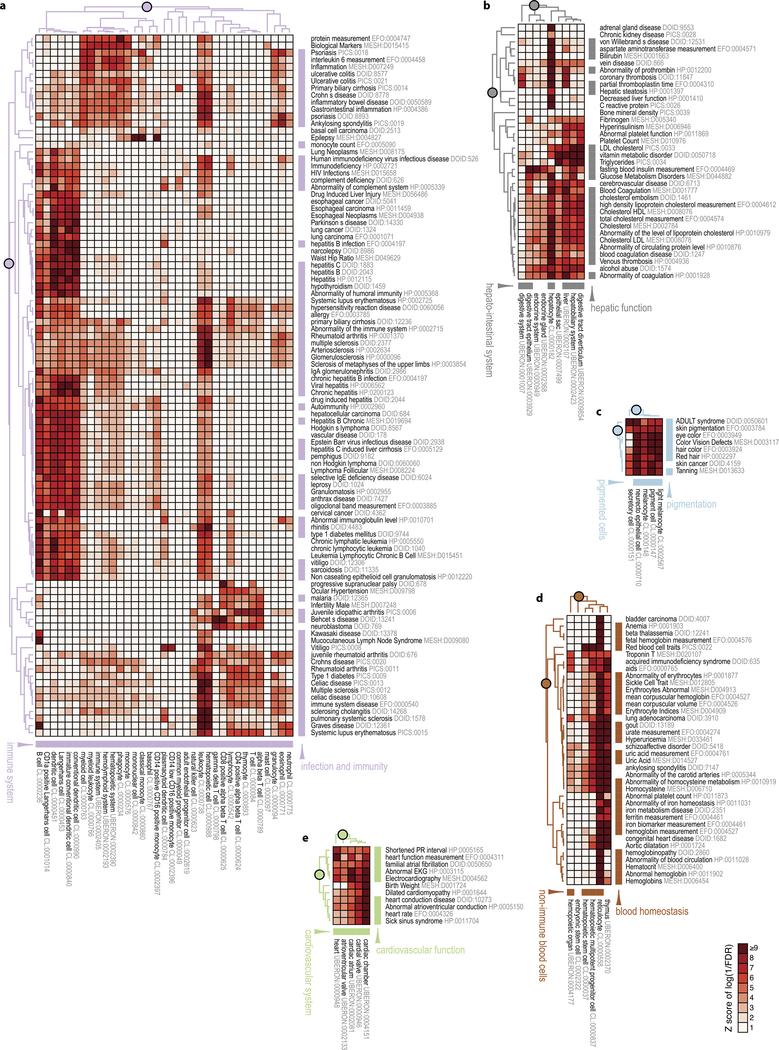
On the basis of these lists of cell-type-enriched and trait-associated genes, we evaluated the association between 345 cell types and 603 traits (208,035 possible pairs) and identified 1,874 pairs of cell types and traits with significant association (Methods, one-tailed Fisher’s exact test, FDR < 0.05). A systematic literature curation found that 85% of these pairs were biologically plausible, as opposed to 21% of random control pairs (Supplementary Table 14 and Methods). Unsupervised clustering of significantly associated cell-type-trait pairs revealed that related cell types and traits tended to cluster together (Fig. 2a). For example, genes associated with neuropathy and behaviour traits significantly overlap genes enriched in nervous system tissues (Fig. 2b). Other examples showing the associations of traits to immune system, hepato-intestinal system, pigmented cells, non-immune blood cells and cardiovascular system are provided in Extended Data Fig. 7a-e. Examining the relative contributions of the four gene categories to the association between nervous system tissues and neuropathy and behaviour traits (Fig. 2c), we found that the odds ratios of the lncRNA categories are generally comparable to, if not higher than, those of mRNAs, implying that lncRNAs contribute substantially to the specific associations between related cell types and traits. These results thus identified groups of potential functionally related mRNAs and lncRNAs that are active in the same cell types and associated with the same traits, with a total of 5,490 FANTOM CAT genes (including 1,970 lncRNA genes) involved in at least one significantly associated cell-type-trait pair (Fig. 2d and Supplementary Table 15).
Figure 2 |. Cell-type-specific lncRNAs implicated in GWAS traits.
a, Unsupervised clustering of cell types and traits based on the association of cell-type-enriched genes with trait-associated genes. All lncRNAs and all other genes were used. Only cell types and traits involved in significantly associated cell-type-trait pairs were plotted. Intensity represents the level of association measured as Z-score of the log-transformed FDR reciprocal in one-tailed Fisher’s exact test. Cell types and traits were clustered on the basis of the Z-score. Selected cell types and traits of six matching themes were colour-coded accordingly. Clusters for specific themes are highlighted in the dendrograms (Extended Data Fig. 7 for detailed views). b, Detailed view of the neural block, showing significant association of genes enriched in nervous system tissues and genes associated with neuropathy and behaviour traits. c, Contributions of gene categories within the neural block. Odds ratios were calculated on the basis of all genes, or other gene categories as indicated. d, Number of genes contributing to significantly associated cell-type-trait pairs.
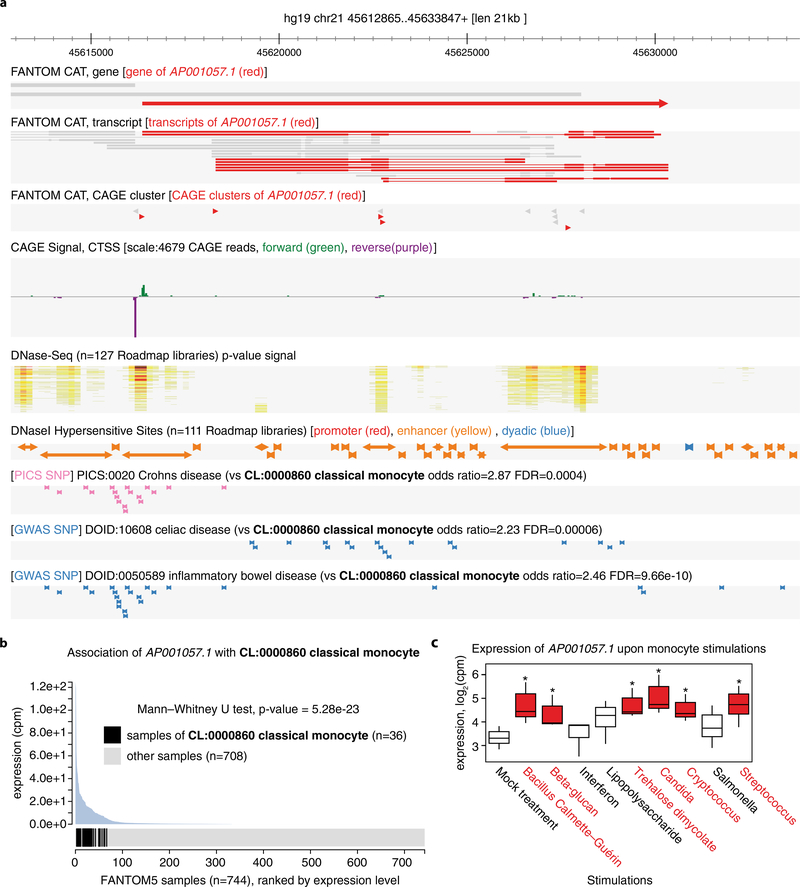
Some associations between cell types and traits involve mainly protein-coding genes: for example, the association between cardial valve (UBERON:0000946) and shortened PR interval (HP:0005165) involves only protein-coding genes (TBX5, NKX2–5, XIRP1, SCN5A and ITGA9). Of note, TBX5, NKX2–5 and SCN5A have previously been implicated in the trait34–36. In contrast, other associations between cell types and traits involve larger fractions of lncRNAs: for example, the association between middle temporal gyrus (UBERON:0002771) and autism spectrum disorder (DOID:0060041) involves 18 lncRNAs out of 49 genes. Another example is the e-lncRNA AP001057.1 (ENSG00000232124), which is associated with multiple immune traits, enriched in classical monocytes (CL:0000860) and induced upon treatment with various microbial agents (Extended Data Fig. 8).
Selective constraint and SNP enrichment
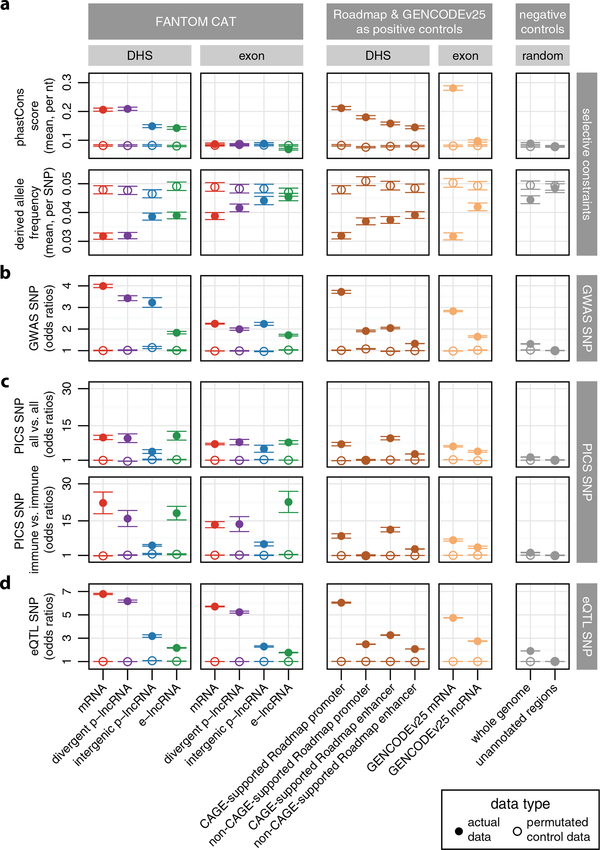
The function of some lncRNAs, for example Lockd in mouse37, has been attributed to the act of transcription rather than to the transcripts themselves13. To evaluate the functional relevance of the regulatory and transcribed regions of lncRNA, we examined selective constraint and enrichment of GWAS15,17 and eQTL16 SNPs within DHS (that is, regulatory) and exonic (that is, transcribed) regions. We first evaluated the selective constraints in terms of sequence conservation across species (phastCons score38) and variation within populations (derived allele frequency39). We found DHSs of all gene categories to be more selectively constrained than their corresponding exons both across species and within populations (Extended Data Fig. 9a, Methods). We also noticed that the DHSs with CAGE support are generally more constrained than those lacking CAGE support (Extended Data Fig. 9, third column).
We next evaluated the enrichment of GWAS and PICS SNPs15,17 (Extended Data Fig. 9b, c and Methods). For all gene categories, we observed higher levels of GWAS SNP enrichment at DHSs than their corresponding exons (Extended Data Fig. 9b). Regardless, both GWAS and PICS SNPs were still enriched (above the background) at exons of all gene categories (Extended Data Fig. 9b, c). As expression of lncRNAs is typically more cell-type-specific, we also performed a focused analysis for genes enriched in immune cells and associated with PICS SNPs of immune traits (that is, immune versus immune, Extended Data Fig. 9c). For all regions and across all gene categories (except intergenic p-lncRNAs), we observed higher enrichments for the focused (immune versus immune) analysis compared with the global (all versus all) analysis (Extended Data Fig. 9c, in particular exons of e-lncRNAs). This result highlights the importance of considering cell-type specificity when assessing enrichment of trait-associated SNPs, as well as the functional relevance of the exons of e-lncRNAs.
Finally, we evaluated the enrichment of eQTL-associated SNPs (GTEx SNPs associated with mRNA expression levels16, Methods) at lncRNA loci (Extended Data Fig. 9d). As expected, the DHSs of mRNAs and divergent p-lncRNAs showed the strongest enrichment as they overlap the regulatory regions of mRNAs. Interestingly, we observed modest, but significant (Student’s t-test, P < 0.05), enrichment in both DHSs and exons of intergenic p-lncRNAs and e-lncRNAs, suggesting these lncRNAs might potentially affect the expression of nearby mRNAs, similar to cis-acting ncRNA-activating RNAs40.
lncRNAs implicated in eQTL
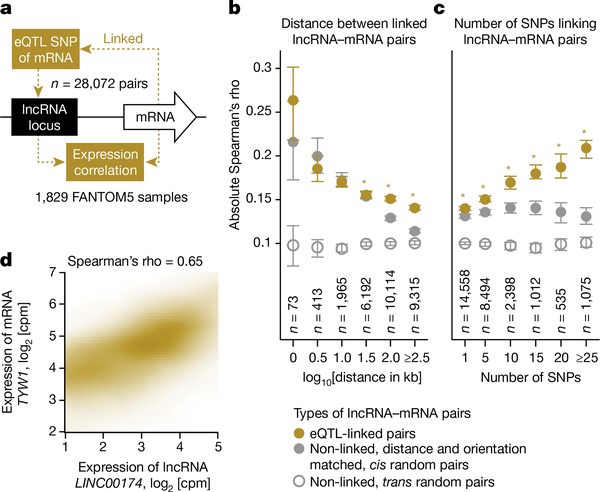
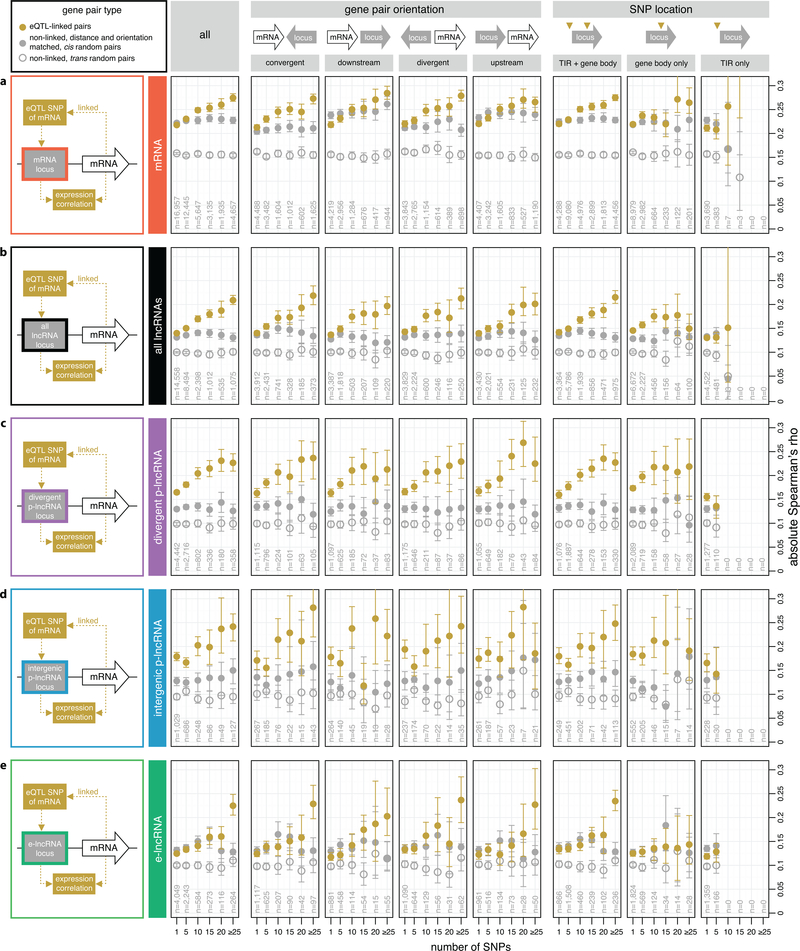
Given the enrichment of eQTL-associated SNPs at lncRNA loci (Extended Data Fig. 9d), we next evaluated the expression correlation of lncRNA-mRNA pairs linked by eQTL-associated SNPs (Fig. 3a and Methods) separated by various distances (Fig. 3b) and linked by varying numbers of SNPs (Fig. 3c). The results showed that eQTL-linked lncRNA-mRNA pairs were generally more co-expressed than the corresponding sets of control random pairs. We observed that the correlation decreases with the distance (Fig. 3b, significant when distance ≥ 101.5 kilobases (kb), paired Student’s t-test, P < 0.05) and increases with the number of SNPs (Fig. 3c, significant for all cases, paired Student’s t-test, P < 0.05). This analysis thus identified a subset of significantly co-expressed (Methods, binomial test, P < 0.05) eQTL-linked lncRNA-mRNA pairs (n = 5,264 pairs involving 3,166 lncRNAs, Supplementary Table 16 and Fig. 3d for an example). Interestingly, we observed similar above-background levels of co-expression in eQTL-linked mRNA-mRNA pairs (Extended Data Fig. 10a), as well as in all categories of lncRNA (Extended Data Fig. 10c-e). Moreover, the phenomenon appears to be independent of the orientation of the gene pair and locations of the SNPs (Extended Data Fig. 10b, across the columns). Therefore, these observations might represent a general mode of co-regulation between neighbouring transcribing loci, independent of types and orientations of the loci, which is in agreement with a recent publication showing that mRNA promoters can act as enhancers of neighbouring genes13.
Figure 3 |. LncRNAs implicated in eQTL.
a, Rationale of the analysis. Expression correlation of lncRNA-mRNA pairs (b) binned on the basis of distances between the pair and (c) binned on the basis of the number of eQTL-associated SNPs16 linking the pair. Circles represent the mean of absolute Spearman’s rho and the error bars represent their 99.99% confidence intervals. Asterisks indicate that the absolute Spearman’s rho for the eQTL-linked pairs is significantly higher than that of non-linked, distance- and orientation-matched cis random pairs (paired Student’s t-test, P < 0.05). d, Co-expression of an eQTL-linked lncRNA-mRNA pair; cpm, counts per million.
Conclusions
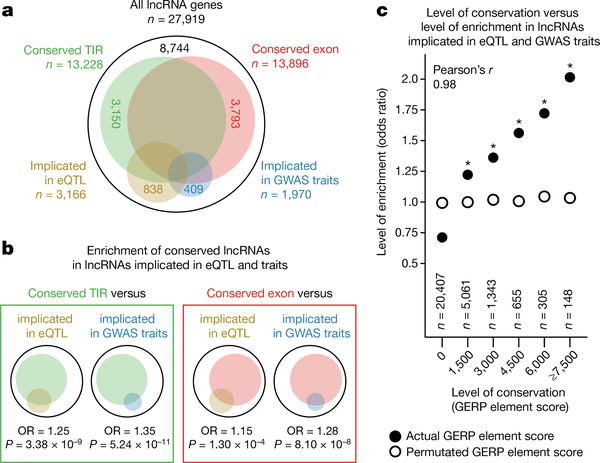
We compiled an atlas of human lncRNAs with the most accurate 5′ ends and the broadest collection of expression profiles so far. High-confidence 5′ ends of our transcript models allowed detailed analyses of their regulatory regions and revealed that lncRNAs are more conserved than previously appreciated. It highlighted that intergenic p-lncRNAs, such as MALAT1 (ref. 7), are a minority compared with intergenic e-lncRNAs and divergent p-lncRNAs. Despite their heterogeneous biogenesis, and their potential to be promiscuous by-products of transcription (from enhancers10 and divergent from mRNA promoters9), all three categories of lncRNAs have documented functional examples in lncRNAdb6. Assessing the functional relevance of lncRNAs, we identified lncRNAs with conserved exons (n = 13,896), conserved TIRs (n = 13,228), implicated in GWAS traits (n = 1,970) and implicated in eQTL (n = 3,166) (Supplementary Table 17 and Fig. 4a). We observed modest, but significant, enrichment of conserved lncRNAs in the sets of lncRNAs implicated in GWAS traits and eQTL (Fig. 4b, one-tailed Fisher’s exact test, P < 0.05), and found that it positively correlates with the level of conservation (Fig. 4c, Pearson’s r = 0.98). These observations support the notion that selectively more constrained lncRNAs are more likely to be functional, although it does not exclude the potential functionality of lncRNAs with weaker selective constraints. Taken together, our analyses provide further evidence of the potential functionality of 69% of the FANTOM CAT lncRNAs (n = 19,175 of 27,919), advancing the current scientific debate on the functional relevance12 of pervasive transcription from mammalian genomes41. To what extent the remaining 31% represents spurious transcription initiation by RNA polymerase II42 is still an open question. Although most of the lncRNAs detected here are likely to originate from genuine TSSs (Supplementary Note 6), additional studies are needed to completely understand their biogenesis and assess their functionality. To this end, we have summarized their expression patterns, genomic features, conservation and intersection with genetic data into a comprehensive resource (http://fantom.gsc.riken.jp/cat/). This encompasses a web application to retrieve gene-, trait- and cell-type-based information and ZENBU43 views for visualizing genomic data. We anticipate wide applications of this resource in prioritizing lncRNA candidates for further elucidation of their functions, which is continuing in the sixth iteration of FANTOM (http://fantom.gsc.riken.jp/6/).
Figure 4 |. Functional evidence of human lncRNAs.
a, Venn diagram showing lncRNAs with conserved exon, conserved TIR, implicated in eQTL or implicated in GWAS traits. b, Enrichment of lncRNAs with conserved exon or TIR in lncRNAs implicated in eQTL or GWAS traits. ‘OR’ and ‘P’ refer to odds ratio and P value of one-tailed Fisher’s exact test. c, Level of conservation versus level of enrichment in lncRNAs implicated in eQTL or GWAS traits. Asterisks indicate lncRNAs at certain levels of conservation are significantly enriched in lncRNAs implicated in eQTL or GWAS traits (one-tailed Fisher’s exact test, P < 0.05).
METHODS
No statistical methods were used to predetermine sample size. The experiments were not randomized. The investigators were not blinded to allocation during experiments and outcome assessment.
Genome version
Analyses in this study were performed on genome version hg19 (GRCh37) for human, mm9 for mouse, rn6 for rat, canFam3 for dog and galGal4 for chicken.
Human ethics
All human samples examined in this study were either exempted material or were obtained with informed consent and covered under ethics applications H17–34 and H21–14 to the RIKEN Yokohama Ethics IRB.
FANTOM5 RNA-seq libraries of human samples
Seventy samples from diverse biological sources (Supplementary Table 2) exhibiting potential for discovery of novel genes (large proportion of ‘orphan’ CAGE clusters with no association to known gene models) were profiled using random primed RNA-seq. All total RNA samples (except the whole blood) underwent ribosomal depletion using a Ribo-Zero rRNA removal kit (Epicentre, Illumina). The whole blood, CD19+ B cells and CD8+ T cells were polyA+ selected using Dynabeads Oligo(dT)25 (Life Technologies). (RNA extraction details have been described21.) Strand-specific, 100 bp single-end RNA-seq libraries were generated at RIKEN GeNAS (as described10) and sequenced on an Illumina HiSeq2000 platform to a depth of ~200 million reads each.
Assembly of FANTOM5 RNA-seq
Raw reads were processed via the Moirai pipeline44 and included adaptor clipping and removing of low-quality reads and ribosomal RNA sequences (rRNAdust version 1.02 (ref. 44)). Individual libraries were mapped onto hg19 using TopHat (version 1.4.1)45 and assembled using Cufflinks (version 1.3.0)45 with default parameters and de novo assembled using Trinity (version r2012–01-25)46 with default parameters. De novo transcripts were aligned to the genome with BLAT47 (only transcripts with 96% identity and with alternative mapping score within 5% of the best scoring location were kept). Alignment gaps ≤3 bp were considered as mismatches and assemblies with non-canonical splicing junctions were discarded. The splice junctions from these Cufflinks and Trinity assemblies were combined and used in a second iteration of assembly. Specifically, reads from individual libraries were re-mapped onto hg19 using TopHat (version 1.4.1)45 by supplying these combined splicing junctions and Cufflinks2 (version 2.0.2)45 was used for assembling individual libraries. These individual assemblies were merged into the final assembly (FANTOM5 RNA-seq assembly) using Cuffmerge (version 1.0.0)45. Read counts and corresponding expression levels for each transcript in each of the 70 libraries were estimated using Sailfish (version 0.6.3)48 with default parameters.
Transcript model collections from published assemblies
Transcript models from GENCODE release 19 (ref. 19) (http://www.gencodegenes.org/) and miTran-scriptome3 assemblies (http://mitranscriptome.org/) were downloaded and used as is. Cuffmerge (version 1.0.0)45 was used to merge transcript models provided by the Human BodyMap 2.0 (ref. 4) (ftp://ftp.broadinstitute.org/Transcriptome_Assemblies/) and transcript models from total, polyA+ and polyA− RNA assemblies generated by ENCODE2.
FANTOM5 CAGE clusters
A CAGE cluster (CAGE peaks, corresponding to TSS regions) was defined by the ‘decomposition peak identification’ method as described in our previous study21 (http://fantom.gsc.riken.jp/5/data/). To expand the coverage of lowly abundant transcripts and to assure the identifier compatibility with our previous studies10,21,22, the ‘FANTOM5 phase 1 + 2 robust’ CAGE clusters27 (n = 201,802) were used and then the non-overlapping FANTOM5 phase 2 unfiltered CAGE clusters (n = 4,218,430) were added. Only the CAGE clusters with at least three reads (sum among 1,897 FANTOM5 samples) were retained. This produced a set of 3,339,568 CAGE clusters used in all analyses in this study.
Rationale of TIEScore
TIEScore evaluates the properties of a pair of CAGE cluster and transcript model to determine the likelihood they identify a genuine TSS, in terms of estimated DHS validation rates (see Supplementary Note 1 for details).
Gold standard TSS and non-TSS regions based on chromatin states
Gold standard TSS and non-TSS regions were defined on the basis of chromatin states estimated by chromHMM49 among from Roadmap Epigenomics Consortium23 and FANTOM5 CAGE clusters10,21,22 (see Supplementary Note 2 for details).
Benchmark of TIEScore using matched CAGE and RNA-seq libraries
Using 70 samples with matched CAGE and RNA-seq libraries, the performance of TIEScore was compared against CAGE or RNA-seq read count alone, in identification of genuine TSSs (see Supplementary Note 2 for details).
Meta-assembly of FANTOM CAT
TIEScore was first applied to each of the five transcript model collections separately and then merged into a non-redundant transcript set (referred to as raw FANTOM CAT) (see Supplementary Note 1 for details).
Validation of TSS using DHS and RAMPAGE data sets
The definition of DHS was based on Roadmap Epigenome Consortium30. The TSS of a transcript (that is, its 5′ end) or a CAGE cluster (that is, its most prominent TSS) was defined as validated if it overlapped a DHS. TSS validations by DHS were performed on transcripts and CAGE clusters, grouped by bins of TIEScore in Supplementary Fig. 3b or TIEScore criteria values in Supplementary Fig. 1b. RAMPAGE25 data sets (n = 207) were downloaded50 and used to validate the TSSs of transcripts. A transcript was defined as ‘detected by RAMPAGE’ if the 3′ ends of at least three RAMPAGE fragments overlapped its exon. The TSS of a detected transcript was defined as ‘validated by RAMPAGE’ if the 5′ end of an exon-overlapping RAMPAGE fragment was found in close proximity, ranging from 0 to 100 bp in Supplementary Fig. 3c or 0 to 500 bp in Extended Data Fig. 2d, representing various stringencies of TSS validation. TSS validations by RAMPAGE were performed on transcripts grouped by bins of TIEScore in Supplementary Fig. 3c, and lncRNA and CCDS transcripts of various transcript catalogues in Extended Data Fig. 2d.
Reducing the isoform complexity of raw FANTOM CAT
Low-abundance transcript isoforms (associated with the same CAGE cluster) were removed to reduce the complexity of FANTOM CAT. Specifically, the abundance (in fragments per kilobase per millions, FPKM) was estimated for each transcript in raw FANTOM CAT across 107 RNA-seq libraries (37 ENCODE libraries50 and 70 FANTOM5 libraries, Supplementary Table 2) using Sailfish (version 0.6.3)48 and is represented by the 75th percentile of its FPKM across these libraries. For each of the CAGE clusters the abundance of all of its associated transcripts was summed and the non-GENCODE (version 19) transcripts with < 10% of the sum were removed. All GENCODE (version 19) transcripts within a CAGE cluster were retained. Only the top five most abundant non-GENCODE (version 19) transcripts within a CAGE cluster were retained. (Note: all CAGE clusters in raw FANTOM CAT were retained.)
Definition and classification of FANTOM CAT genes
FANTOM CAT genes were defined on the basis of clustering of transcript models in raw FANTOM CAT and all genes were assigned to one of the 11 classes defined on the basis of coding potential and genomic context (see Supplementary Note 4 for details).
Annotation of open reading frames in FANTOM CAT
Coordinates of open reading frames on all FANTOM CAT transcripts were extracted using getorf51. The coding potentials of these open reading frames were assessed using PhyloCSF52, RNAcode53, and ribosome profiling data in sorfs.org (ref. 54) (see Supplementary Note 4 for details).
Comparison of lncRNAs with other lncRNA catalogues
Three lncRNA catalogues, GENCODE release 25 (ref. 5) lncRNAs on hg19, Human BodyMap 2.0 (ref. 4) lncRNAs and miTranscriptome3 lncRNAs, were compared with lncRNAs of FANTOM CAT. The non-redundant 5′ end regions (±50 nt) of all transcripts in each of these catalogues and the FANTOM CAT catalogues (permissive, robust and stringent) were extracted and their FDRs on complete 5′ ends were calculated using the 10 sets of gold standard TSS and non-TSS regions with N ranging from 10 to 100 in steps of 10 (Extended Data Fig. 2b). The number of lncRNA genes with genuine 5′ ends was estimated as (1 − FDR) × number lncRNA genes in each of the catalogues (Extended Data Fig. 2c).
Definition of genes originating from promoter, enhancer and dyadic regulatory regions
The definition of DNaseI-accessible regulatory regions is based on the Roadmap Epigenome Consortium23 (http://egg2.wustl.edu/roadmap/web_portal/DNase_reg.html). A gene is defined as originating from promoter, enhancer or dyadic DHS when its strongest TSS is located within the corresponding type of DHS.
Definition of unannotated genomic regions
Unannotated genomic regions were defined as the whole-genome regions excluding exonic and intronic regions of GENCODE release 25 (ref. 19) genes, DHS ranges of Roadmap Epigenome Consortium23 and annotated gaps.
CpG island, polyadenylation signal, 5′ splicing sites, TATA-box and initiator motifs around TIRs
Locations of CpG islands were obtained from the University of California, Santa Cruz (UCSC) genome browser55. The position weight matrix (PWM) of motifs 5′ splicing site (5′SS, SD0001.1), TATA-box (POL012.1) and initiator (POL002.1) were obtained from JASPAR (http://jaspar.genereg.net/). The PWMs of polyadenylation signal (PAS) were constructed on the basis of the annotated PAS in GENCODE release 19 (ref. 19). The locations of these motifs on hg19 were predicted on the basis of their PWM using HOMER (http://homer.salk.edu/homer/).
Directionality, splicing index, genomic span and exosome sensitivity
We examined the relationship between the directionality of CAGE clusters and the properties of their transcripts as described in Supplementary Note 5.
Definition of conserved TIRs and exons in FANTOM CAT
The TIR of a gene was defined as the region from −609 to +604 bp of its strongest TSS, based on the median distance between all TSSs and the boundaries of their overlapping DHSs. The exonic region of a gene was defined as the merged exonic regions of its associated transcripts. The strength of selective constraints on genomic regions was measured on the basis of rejected substitution score from GERP14. For each TIR and exonic region of a gene, the 200 bp window yielding the highest per-nucleotide score was considered (Fig. 1b). Conserved TIRs and exons were defined (as in Fig. 1c) on the basis of their overlaps (≥50 bp) with the highest-scoring GERP elements14 as follows. TIR or exonic regions were defined as conserved when the observed value (score of the highest-scoring GERP elements) was greater than 50% (one-tailed binomial test, P < 0.05) of the values from 100 random permutations (that is, regions of the same sizes randomly sampled from unannotated genomic regions). Each gene was thus classified as one of the following scenarios: (1) both TIR and exon conserved, (2) TIR conserved only, (3) exon conserved only, or (4) unconserved. Most lncRNAs (divergent p-lncRNA: 81.9%, intergenic p-lncRNA: 57.8% and e-lncRNA: 63.8%) were defined to have either conserved TIRs or exons, versus 94.6% for mRNAs (Fig. 1c).
Analysis of transposable elements
We annotated repeat elements in hg19 using RepeatMasker (4.0.3), nhmmer (hmmer-3.1b1)56 and Dfam (1.2)57. It has been reported that screening for repeat elements using nhmmer and Dfam is more sensitive and specific than consensus sequence-based approaches57. Specifically, we ran the command ‘RepeatMasker -e hmmer -species human -s -xsmall -pa 8 chr.fa’, for each assembled chromosome. Repeat elements were classified by class, family and individual element names as provided by Dfam. The TIR of a gene was defined as ‘transposable element overlapping’ when it intersects with the transposable element with at least 1 bp. Enrichment of transposable-element-overlapping TIRs in unconserved TIRs was tested using a one-tailed Fisher’s exact test.
FANTOM5 CAGE libraries of rat, dog and chicken samples
RNA and cell samples of hepatocytes and aortic smooth muscle cells of rat, dog and chicken (Supplementary Table 1) were purchased from Cell Applications (CAC35405, CACn35405, CAR35405, CAR780K30 s, CA354-R10a, M354–20, chicken hepatocytes were a custom order), Sciencell (SC5205), Celsis (F00205, M00205) and BD Gentest (454830). CAGE libraries were prepared on the Helicos platform and analysed as described previously10, except that mapping of the CAGE reads was done against the rat (rn6), dog (canFam3) and chicken (galGal4) genomes.
Conservation of TSS activities
The most prominent TSS of each FANTOM CAT CAGE cluster on hg19 was projected onto the genomes of mouse (mm9), rat (rn6), dog (canFam3) and chicken (galGal4) using the UCSC liftover tool55. A human TSS was defined as orthologous when it could be projected onto the genomes of other species (Fig. 1d). An orthologous human TSS was considered active in another species when the projected TSS (±50 nt) contained ≥5 CAGE reads in the same cell type (Fig. 1e).
Calculation of expression levels of CAGE clusters and genes
The expression levels of CAGE clusters and genes of FANTOM CAT were calculated for all FANTOM5 samples (Supplementary Table 1). For each CAGE cluster a flanking region of ±50 nt to its most prominent TSS was defined for read counting. For pairs of CAGE clusters with their most prominent TSSs located within 100 nt of each other, the region between the two TSSs was equally divided to avoid any overlapping flanking regions. The numbers of CAGE read 5′ ends (CAGE TSS) falling within the flanking region of each CAGE cluster in each CAGE library were counted, and the expression levels of CAGE clusters were relative log expression (rle) normalized across all libraries as counts per million (cpm) using edgeR (version 3.6.8)58 with default settings. Gene-based expression levels were calculated as the sum of counts per million of their associated CAGE clusters.
Expression specificity of genes across primary cell facets
FANTOM5 primary cell samples21 were grouped as non-overlapping facets (n = 69) as previously described10 (Supplementary Table 1). The expression level of a gene in a facet was represented by its maximum counts per million calculated across all individual samples within this facet (Extended Data Fig. 6a). The expression specificity of a gene across the primary cell facets was represented by Chao-Shen corrected Shannon’s entropy59 and calculated as a ratio of the sum of read counts within each facet to the sum of read counts in all facets (Extended Data Fig. 6a).
Identification of dynamically expressed lncRNAs
Differential expression analysis was performed on 25 sets of FANTOM5 experiments where cells were subjected to stimulation or underwent differentiation (20 time course experiments from FANTOM5 ‘Phase 2’22 and 5 paired control and treatment experiments from FANTOM5 ‘Phase 1’21, Supplementary Table 18). The read count of a gene in each sample was calculated as the sum of read counts of its associated CAGE clusters. For each experiment, a group of samples was defined as the reference (for example, initial time point of a time course) and the other groups were defined as the queries. Queries were tested for differential expression against the reference set using edgeR (version 3.6.8)58 with default settings. A gene was defined as ‘dynamically regulated’ when it was significantly differentially expressed (FDR < 0.05) in at least one comparison (Supplementary Table 19). An example is shown in Extended Data Fig. 9c.
Sample ontology annotations of FANTOM5 samples
A set of non-redundant sample ontology terms21 describing the originating cells (n = 173, Cell Ontology terms60) and tissues (n = 174, Uberon terms61) of 744 FANTOM5 samples was selected on the basis of manual curation of the set of sample ontology terms we published previously21 (http://fantom.gsc.riken.jp/5/datafiles/latest/extra/Ontology/). Each curated sample ontology term is associated with a unique set of samples and the overrepresentation of similar samples within a term is kept minimal, for example samples from multiple adjacent time points in a time course. The association between each sample ontology term and the 744 FANTOM5 samples can be found in Supplementary Table 10.
Definition of cell-type-enriched genes
FANTOM CAT genes were defined as enriched in particular cells and tissues by examining their expression in samples annotated with sample ontology terms21 as described above. A gene was defined as enriched in a sample ontology term when (1) its mean expression was five times higher in samples of that ontology than in other samples, (2) it was detected in at least 50% of the samples of that ontology, and (3) P < 0.05 in a one-tailed Mann-Whitney rank sum test. Only sample ontology terms with at least two samples profiled in FANTOM5 were considered. This defined 49,979 of 59,110 FANTOM CAT genes to be enriched in at least one sample ontology term (that is, cell-type-enriched genes: 15,791 coding genes, 23,766 lncRNA genes and 7,422 other genes, Supplementary Table 11).
Processing of trait-associated SNPs
Trait-associated SNPs were taken from (1) GWASdb15 for genome-wide association studies SNPs (GWAS lead SNPs) (as of 28 June 2015, http://jjwanglab.org/gwasdb) and (2) probabilistic identification of causal SNPs17 (PICS) for fine-mapped SNPs (PICS SNPs) (http://pubs. broadinstitute.org/pubs/finemapping/). The PICS set contains 8,741 SNPs associated with 39 traits. For the GWASdb set, only the lead SNPs with P < 1 × 10⁻⁵ were used. The GWASdb traits from multiple redundant classifications of disease ontology (DOID), human phenotype ontology (HP), Medical Subject Headings (MeSH) and experiment factor ontology (EFO) terms were manually curated and removed to minimize redundancy. The SNPs within the linkage disequilibrium block of the GWAS lead SNPs (that is, proxy SNPs) were searched for using SNAP (version 2.2)62 (https://www.broadinstitute.org/mpg/snap/) with an r2 threshold of 0.8 and distance limit of 500 kb in any of the three population panels of the 1000 Genomes Project pilot data63. The proxy SNP coordinates were mapped from hg18 to hg19 using the UCSC liftOver tool55, resulting in a set of 868,536 GWAS proxy SNPs. The final set of trait-associated SNPs (8,741 PICS SNPs, 72,919 lead GWAS SNPs and 868,536 proxy GWAS SNPs) was associated with 39 and 788 traits from PICS17 and GWASdb15, respectively (Supplementary Table 12).
Definition of trait-associated genes
A gene was defined as associated with a trait when its 5′ end regions (−800 to +200 nt of the most prominent TSS of all of its associated CAGE clusters) or genic regions (all exons and the size-limited introns (≤ 11 kb) of its associated transcripts) overlapped at least one trait-associated SNP. As fewer than 10% of human mRNA introns were shown to be longer than 11 kb (ref. 64), introns exceeding this length were excluded to minimize assembly artefacts. This defined 24,059 of 59,110 FANTOM CAT genes to be associated with at least one trait (that is, trait-associated genes: 11,836 coding genes, 9,595 lncRNA genes and 2,628 other genes, Supplementary Table 13).
Association between cell-type-enriched genes and trait-associated genes
For each pair of cell types and traits, the significance of their association was evaluated. Specifically, for each pair, the genes associated (1) only with either the cell type or the trait (single positives), (2) with both the cell type and the trait (double positives) and (3) with neither the cell type nor the trait (double negatives) were counted and tested for the significance of association (one-tailed Fisher’s exact test). The pair of cell type and trait was considered significantly associated when (1) FDR < 0.05 (P values adjusted for multiple testing within a trait using BH method) and (2) at least 10% of the trait-associated genes were double positives. Only cell types and traits associated with at least 25 genes were tested. The tests were performed for all genes together (Fig. 2a) and for each of the four gene categories separately for neural block in Fig. 2c.
Clustering of cell types and traits
Cell types and traits were clustered (Fig. 2a) on the basis of the pairwise Pearson’s correlation of log(1/FDR) of the one-tailed Fisher’s exact test (scaled as Z-score within each trait) using the R package Pheatmap (clustering method = complete). In Fig. 2a, colour bars were added to summarize the six manually curated biological themes.
Curation of significantly associated cell-type-trait pairs
For each pair of significantly associated cell types and traits, their physiological relevance was manually curated by literature mining. Blind controls were randomly selected from 300 non-associated cell-type and trait pairs and added to the curation list (Supplementary Table 14).
Selective constraints and enrichment of SNPs
In Extended Data Fig. 9, DHS regions of a gene category were defined as regions of all DHS associated with the genes of the category. Exon regions of a gene category were defined as ‘merged’ exonic regions of its genes and excluding its DHS regions (generated using Bedtools version 2.20.1 (ref. 65)). For positive control DHS regions, the promoter and enhancer DHS from Roadmap Epigenome Consortium23 were divided into CAGE-supported and non-CAGE supported ones on the basis of their overlap with all FANTOM5 clusters10,21,22. For positive control exon regions, we used the merged exonic regions of GENCODE release 25 mRNAs and lncRNAs. For negative control regions, 100,000 1-kb windows were randomly sampled from the whole genome and from unannotated genomic regions. In Extended Data Fig. 9a, selective constraints in these region sets were based on measurements of 100,000 randomly sampled windows from each set of regions; conservation across interspecies: per base PhastCons score from placental mammals on the basis of a 46-way alignments66; variations within population: per SNP-derived allele frequencies based on 1000 Genomes Project data39. In Extended Data Fig. 9b, c, GWAS lead and PICS SNPs were defined as described. In Extended Data Fig. 9d, eQTL-associated SNPs of mRNA were obtained from GTEx16 (data release version 6p, pooled from all 44 tissues) and only SNPs associated with the expression variation of protein coding genes at P < 1 × 10⁻⁵ were retained. These SNPs are referred to as foreground SNPs. SNPdb version 142 (from the UCSC Genome Browser55) was used to define the background SNPs for PICS and eQTL-associated SNPs. For GWAS lead SNPs, all SNPs on two popular SNPs array platforms (Affymetrix version 6 and Illumina 550, from the UCSC Genome Browser55) were used as background SNPs. Enrichment of foreground SNPs in each set of regions was evaluated by first counting the number of the foreground and background SNPs intersecting these regions (as observedfore and observedback), then the counting was repeated for 100 permutations (regions of the same sizes shuffled into unannotated genomic regions, as shuffledfore and shuffledback). The odds ratio of foreground SNP enrichment for each round of permutation was calculated as (observedfore/observedback)/(shuffledfore/shuffledback). As a control, the analysis was repeated by replacing the foreground SNPs with randomly chosen background SNPs. In Extended Data Fig. 9c, to test for cell-type specificity of traits, the process was repeated only with a subset of genes enriched in immune cells (as defined above) and associated with PICS SNPs of immune traits (that is, immune versus immune, focused analysis).
Co-expression between lncRNA-mRNA pairs linked by eQTL-associated SNPs
eQTL SNPs of mRNA were obtained as described above (GTEx16 data release version 6p). A pair of lncRNA and mRNA was defined as ‘linked by eQTL’ if the 5′ end region (−800 to +200 nt of its strongest TSS) or the genic region (exons and introns) of the lncRNA overlapped with at least one eQTL-associated SNP of the mRNA. The pairs with the lncRNA divergently transcribed from the mRNA TSS or overlapping with mRNA on the same strand were defined as positional dependent and discarded. As negative controls, the same number of lncRNA-mRNA pairs on different chromosomes (trans random pairs) and on the same chromosome with matched distance and orientation (non-linked, distance and orientation matched cis random pairs) were randomly sampled. The Spearman correlation was calculated for the expression profiles of each lncRNA-mRNA pair across the 1,829 FANTOM5 samples (Supplementary Table 1). The distance between the pair was defined as the distance between their strongest TSSs. The extent of co-expression (measured by absolute Spearman’s rho) of the eQTL-linked lncRNA-mRNA pair, at various distances between the pair (Fig. 3b) and number of SNPs linking the pair (Fig. 3c), was compared with that of non-linked, distance and orientation matched cis random pairs. eQTL-linked lncRNA-mRNA pairs were found to be significantly more co-expressed (P < 0.05, paired Student’s t test) in all cases except when distances between the pair were less than 101.5 kb (asterisks in Fig. 3b). To define significantly co-expressed individual eQTL-linked lncRNA-mRNA pairs, the absolute Spearman’s rho of each lncRNA-mRNA pair was compared with that of 100 non-linked, distance- and orientation-matched cis random pairs (that is, matched background correlation). An eQTL-linked lncRNA-mRNA pair was defined as ‘implicated in eQTL’ when (1) the distance between the pair was ≥ 101.5 kb and (2) the pair were significantly more co-expressed than the 75th percentile of the matched background correlation (one-tailed binomial test, P < 0.05).
Enrichment of conserved lncRNAs in lncRNAs implicated in eQTL and GWAS traits
In Fig. 4, ‘Conserved lncRNAs’ were defined as lncRNAs with conserved TIRs or conserved exons as in Fig. 1. ‘LncRNAs implicated in GWAS traits’ and ‘lncRNAs implicated in eQTL’ were defined as in Fig. 2 and Fig. 3, respectively. Enrichment of conserved lncRNAs in the lists of lncRNAs implicated in eQTL and GWAS traits was investigated using a one-tailed Fisher’s exact test. ‘Level of conservation’ refers to the score of the most conserved GERP element14 within the TIR or exon of an lncRNA (bin = 1,500). ‘Level of enrichment’ refers to the odds ratio of lncRNAs at a certain level of conservation to be implicated in eQTL or GWAS traits based on a one-tailed Fisher’s exact test.
Web resource
FANTOM CAT web resource was developed using the AngularJS JavaScript framework (https://angularjs.org/), the D3js visualization library67 (http://d3js.org/) and additional front-end modules and development tools from Project-chi (https://github.com/Hypercubed/Project-Chi). An online version of the resource is located at http://fantom.gsc.riken.jp/cat/. The source code (under MIT license) is available at https://github.com/Hypercubed/fantom-cat/. The genomic context of FANTOM CAT genes is visualized with ZENBU43 (an interactive visualization and analysis integrated web-service).
Data availability
The FANTOM CAT meta-assembly and its related resources can be found at http://fantom.gsc.riken.jp/cat/. The CAGE data generated in this study have been deposited in DDBJ (http://trace.ddbj.nig.ac.jp/) under accession codes DRA004812, DRA004813 and DRA004814 (Supplementary Table 1). The RNA-seq data generated in this study have been deposited in DDBJ under accession codes DRA001101 and DRA004790 (Supplementary Table 2). Previously published FANTOM5 CAGE data can be found in DDBJ under accession codes DRA000991, DRA001026, DRA001027, DRA001028, DRA002216, DRA002711, DRA002747, DRA002748 and DRA005089 (Supplementary Table 1). Sample information is available through the FANTOM5 resource browser SSTAR68 at http://fantom.gsc.riken.jp/5/sstar/Browse_samples. The authors declare that the data supporting the findings of this study are available within the paper and its Supplementary Information files. Source data for all figures, Extended Data figures and Supplementary Figures are provided in the online version of the paper.
Extended Data
Extended Data Figure 1 |. Building a 5′ complete lncRNA catalogue.
a, Integration of CAGE and transcript models. CAGE clusters were used to integrate transcript models from various sources and their 5′ completeness was assessed on the basis of TIEScore. b, Identification of lncRNAs. TIEScore identified 59,110 genes and coding potential assessment further identified 27,919 lncRNAs in FANTOM CAT at the robust TIEScore cutoff. c, Categorization of lncRNAs. LncRNAs were annotated according to their gene orientation (that is, genomic context) and DHS type23 (that is, epigenomic context) and then categorized into divergent p-lncRNAs (purple), intergenic p-lncRNAs (blue), e-lncRNAs (green) and other lncRNAs (grey). d, Overlaps between FANTOM CAT and other lncRNA catalogues. e, LncRNA gene models outside FANTOM CAT are 5′ incomplete. LncRNAs found commonly in both catalogues (grey), or only in FANTOM CAT (red), show stronger evidence of transcription initiation (DHS, H3K4me1, H3K4me3 and PolII ChIP-seq23) and conservation (phastCons38) than those found only in other lncRNA catalogues (blue, green or yellow).
Extended Data Figure 2 |. FANTOM CAT is more 5′ complete than other lncRNA catalogues.
a, FANTOM CAT lncRNA TSS are well-supported. The 5′ ends of FANTOM CAT lncRNAs (first column) have stronger transcriptomic, epigenomic and genomic evidence of transcription initiation than the 5′ ends of lncRNA models in the Human BodyMap 2.0 (ref. 4), miTranscriptome3 and GENCODE release 25 (ref. 19) (second column). In b and c, the box plots show the median, quartiles and Tukey whiskers of the estimates of FDR of complete 5′ ends (b) and number of 5′ complete lncRNA genes (c) on the basis of ten sets of gold standard TSS and non-TSS regions (Methods). b, FDR of complete 5′ ends. c, Estimated number of 5′ complete lncRNA genes (total number of genes × [1 − FDR]). d, Validation rate of gene models using RAMPAGE. RAMPAGE data sets25,50 (n = 207, Methods) were used to validate the lncRNA transcripts in FANTOM CAT and other catalogues (left). Transcripts containing full consensus CDS (CCDS transcripts) were used for control (right). The exon of a transcript is detected by RAMPAGE31 if it overlaps ≥3 RAMPAGE 3′ ends. Transcript detection rates of all catalogues were plotted (upper). About 95% of lncRNA transcripts in the robust FANTOM CAT can be detected, which is slightly higher than that of GENCODE release 25 (~92%). The TSS of a detected transcript is validated by RAMPAGE if it is located within the proximity of a RAMPAGE 5′ end (for example, from 0 to 500 bp, x axis, lower). At 100 bp, ~95% of lncRNA transcripts in the robust FANTOM CAT can be validated, versus ~85% for that of GENCODE release 25. We note the percentages of CCDS transcripts in FANTOM CAT and GENCODE release 25 detected or validated by RAMPAGE are similar, with the robust and stringent FANTOM CAT catalogues performing slightly better.
Extended Data Figure 3 |. Revision of lncRNA models in GENCODE.
a, An example of improved TSS annotation of a GENCODE release 25 lncRNA gene. The 5′ ends of GENCODE release 25 annotated lncRNA transcripts of TUG1 (ENSG00000253352) are distant from the region of strong CAGE signal, while FANTOM CAT added extra transcripts accurately start from the proximal CAGE signal summit. b, An example of bridged gene models of GENCODE release 25 lncRNA genes. In GENCODE release 25, the locus was annotated with three short lncRNA genes; FANTOM CAT bridged these short lncRNA transcript models into a long transcript model (RP11–973H7.4, ENSG00000267654) starting from the proximal CAGE signal summit.
Extended Data Figure 4 |. Heterogeneity among lncRNA gene categories.
a, Epigenomic features surrounding TSS. The y axis refers to the fraction of TIR overlaps with peaks of the corresponding epigenomic signal from the Roadmap Epigenome Consortium23. b, Genomic features surrounding TSS. Sequence features conducive to generating longer transcripts are enrichment of 5′ splice site (5′ SS) and depletion of polyadenylation sites (PAS). Sequence features associated with transcription initiation include CpG islands, INR (initiator) motif and TATA box motif. c, Core promoter motifs. Grey dashed lines indicate whole-genome background.
Extended Data Figure 5 |. Transposons at TIRs.
a, Percentages of genes with conserved and unconserved TIR (as defined in Fig. 1c) and their overlap with various classes of transposons. b, Enrichment of retrotransposons at unconserved TIR. The Venn diagrams show the overlap between unconserved TIR, DNA transposons and retrotransposons. Retrotransposons are significantly enriched in unconserved TIR of all gene classes (one-tailed Fisher’s exact test, P < 0.05).
Extended Data Figure 6 |. Expression landscape of lncRNAs in primary cells.
a, Expression level and specificity. Abbreviation cpm is relative log expression (rle) normalized count per millions. The maximum expression level (log2 cpm) and expression specificity (Chao-Shen’s corrected Shannon entropy59) of genes among 69 primary cell facets10 were plotted. Box plots show the median (dashed lines), quartiles and Tukey whiskers. b, Percentage of genes within categories expressed within primary cell facets. The circles represent the mean among samples within a facet and the error bars represent 99.99% confidence intervals. Dashed lines represent the means among all samples. c, Number of lncRNA genes expressed within primary cell facets. Dashed line represents the mean among all samples. The x axis is sorted on the basis of number of lncRNA genes expressed. A gene is considered as ‘expressed’ when cpm ≥ 0.01.
Extended Data Figure 7 |. Association of cell-type-enriched genes with trait-associated genes of different biological themes.
A detailed view of blocks from Fig. 2a. The dendrograms were coloured as in Fig. 2a. a, ‘Immune system’ cell types and ‘infection and immunity’ traits. b, ‘Hepato-intestinal system’ cell types and ‘hepatic function’ traits. c, ‘Pigmented cells’ cell types and ‘pigmentation’ traits. d, ‘Non-immune blood cells’ cell types and ‘blood homeostasis’ traits. e, ‘Cardiovascular system’ cell types and ‘cardiovascular function’ traits.
Extended Data Figure 8 |. LncRNA AP001057.1 is associated with classical monocytes and implicated in immune diseases.
a, Genomic view of AP001057.1 (ENSG00000232124) in the ZENBU genome browser43. The strongest TSS of AP001057.1 overlaps with an enhancer DHS. The locus overlaps with fine-mapped SNPs associated with Crohn’s disease and GWAS SNPs associated with coeliac disease and inflammatory bowel disease. b, AP001057.1 is associated with classical monocytes (CL:0000860). c, AP001057.1 is significantly upregulated in monocytes upon stimulation with various immunogenic agents (FDR < 0.05 in edgeR58, highlighted in red and indicated with asterisks). Note: we performed differential expression analysis to identify lncRNAs that are dynamically regulated upon stimulation, infection or differentiation on the basis of 25 manually curated series of FANTOM5 samples (Supplementary Table 18 and Methods), and the results are available in Supplementary Table 19. Figures were captured (with slight modifications) from the online resource at http://fantom.gsc.riken.Jp/cat/v1/#/genes/ENSG00000232124.1.
Extended Data Figure 9 |. Selective constraints and enrichment of GWAS trait and eQTL-associated SNPs at lncRNA loci.
a, Selective constraints between species (phastCons38) and within human population (derived allele frequency39). b, Enrichment of GWAS SNPs. Only lead GWAS SNPs15 were used (Methods). c, Enrichment of PICS17 fine-mapped SNPs in global (all versus all) or focused (immune versus immune) analysis (Methods). d, Enrichment of GTEx eQTL SNPs16 associated with expression of mRNAs. Circles represent means and the error bars represent their 99.99% confidence intervals.
Extended Data Figure 10 |. Co-expression of various gene pairs linked by eQTL SNPs.
We searched for gene loci that overlap eQTL SNPs associated with expression variation of mRNAs (as identified by GTEx16). Gene loci overlapping these SNPs were then paired with the corresponding mRNA and their expression correlation across the FANTOM5 expression atlas was investigated. Rows compare the gene types overlapping the SNPs. a, mRNAs; b, all lncRNAs; c, divergent p-lncRNAs; d, intergenic p-lncRNAs; e, e-lncRNAs. Columns compare the relative orientation of the gene pairs and the position of the SNPs. The term ‘all’ refers to all orientations of the gene pairs and positions of the SNPs pooled. Gene pairs were binned on the basis of the number of SNPs linking the pair (bin = 5 SNPs). The data points represent the mean of absolute Spearman’s rho and the error bars represent its 99.99% confidence intervals. At each bin, the number of pairs plotted is the same for the three pair types as indicated.
Supplementary Material
Acknowledgements
FANTOM5 was made possible by research grants for the RIKEN Omics Science Center and the Innovative Cell Biology by Innovative Technology (Cell Innovation Program) from the MEXT to Y.H. It was also supported by research grants for the RIKEN Preventive Medicine and Diagnosis Innovation Program (RIKEN PMI) to Y.H. and the RIKEN Centre for Life Science Technologies, Division of Genomic Technologies (RIKEN CLST (DGT)) from the MEXT Japan. A.R.R.F. is supported by a Senior Cancer Research Fellowship from the Cancer Research Trust, the MACA Ride to Conquer Cancer and the Australian Research Council’s Discovery Projects funding scheme (DP160101960). S.D. is supported by award number U54HG007004 from the National Human Genome Research Institute of the National Institutes of Health, funding from the Ministry of Economy and Competitiveness (MINECO) under grant number BIO2011-26205, and SEV-2012-0208 from the Spanish Ministry of Economy and Competitiveness. Y.A.M. is supported by the Russian Science Foundation, grant 15-14-30002. We thank RIKEN GeNAS for generation of the CAGE and RNA-seq libraries, the Netherlands Brain Bank for brain materials, the RIKEN BioResource Centre for providing cell lines and all members of the FANTOM5 consortium for discussions, in particular H. Ashoor, M. Frith, R. Guigo, A. Tanzer, E. Wood, H. Jia, K. Bailie, J. Harrow, E. Valen, R. Andersson, K. Vitting- Seerup, A. Sandelin, M. Taylor, J. Shin, R. Mori, C. Mungall and T. Meehan.
Footnotes
The authors declare no competing financial interests. Readers are welcome to comment on the online version of the paper.
Supplementary Information is available in the online version of the paper.
Reviewer information Nature thanks M. Gerstein, J. Rinn and the other anonymous reviewer(s) for their contribution to the peer review of this work.
Online Content Methods, along with any additional Extended Data display items and Source Data, are available in the online version of the paper; references unique to these sections appear only in the online paper.
References
- 1.Carninci P et al. The transcriptional landscape of the mammalian genome. Science 309, 1559–1563 (2005). [DOI] [PubMed] [Google Scholar]
- 2.Djebali S et al. Landscape of transcription in human cells. Nature 489, 101–108 (2012). [DOI] [PMC free article] [PubMed] [Google Scholar]
- 3.Iyer MK et al. The landscape of long noncoding RNAs in the human transcriptome. Nature Genet. 47, 199–208 (2015). [DOI] [PMC free article] [PubMed] [Google Scholar]
- 4.Cabili MN et al. Integrative annotation of human large intergenic noncoding RNAs reveals global properties and specific subclasses. Genes Dev. 25, 1915–1927 (2011). [DOI] [PMC free article] [PubMed] [Google Scholar]
- 5.Derrien T et al. The GENCODE v7 catalog of human long noncoding RNAs: analysis of their gene structure, evolution, and expression. Genome Res. 22, 1775–1789 (2012). [DOI] [PMC free article] [PubMed] [Google Scholar]
- 6.Quek XC et al. lncRNAdb v2.0: expanding the reference database for functional long noncoding RNAs. Nucleic Acids Res. 43, D168–D173 (2015). [DOI] [PMC free article] [PubMed] [Google Scholar]
- 7.Schmidt LH et al. The long noncoding MALAT-1 RNA indicates a poor prognosis in non-small cell lung cancer and induces migration and tumor growth. J. Thorac. Oncol 6, 1984–1992 (2011). [DOI] [PubMed] [Google Scholar]
- 8.Andersson R et al. Nuclear stability and transcriptional directionality separate functionally distinct RNA species. Nature Commun. 5, 5336 (2014). [DOI] [PubMed] [Google Scholar]
- 9.Preker P et al. RNA exosome depletion reveals transcription upstream of active human promoters. Science 322, 1851–1854 (2008). [DOI] [PubMed] [Google Scholar]
- 10.Andersson R et al. An atlas of active enhancers across human cell types and tissues. Nature 507, 455–461 (2014). [DOI] [PMC free article] [PubMed] [Google Scholar]
- 11.Quinn JJ & Chang HY Unique features of long non-coding RNA biogenesis and function. Nature Rev. Genet 17, 47–62 (2016). [DOI] [PubMed] [Google Scholar]
- 12.Palazzo AF & Lee ES Non-coding RNA: what is functional and what is junk? Front. Genet 6, 2 (2015). [DOI] [PMC free article] [PubMed] [Google Scholar]
- 13.Engreitz JM et al. Local regulation of gene expression by lncRNA promoters, transcription and splicing. Nature 539, 452–455 (2016). [DOI] [PMC free article] [PubMed] [Google Scholar]
- 14.Davydov EV et al. Identifying a high fraction of the human genome to be under selective constraint using GERP++. PLoS Comput. Biol 6, e1001025 (2010). [DOI] [PMC free article] [PubMed] [Google Scholar]
- 15.Li MJ et al. GWASdb v2: an update database for human genetic variants identified by genome-wide association studies. Nucleic Acids Res 44 (D1), D869–D876 (2016). [DOI] [PMC free article] [PubMed] [Google Scholar]
- 16.Consortium GTEx. The Genotype-Tissue Expression (GTEx) pilot analysis: multitissue gene regulation in humans. Science 348, 648–660 (2015). [DOI] [PMC free article] [PubMed] [Google Scholar]
- 17.Farh KK-H et al. Genetic and epigenetic fine mapping of causal autoimmune disease variants. Nature 518, 337–343 (2015). [DOI] [PMC free article] [PubMed] [Google Scholar]
- 18.Steijger T et al. Assessment of transcript reconstruction methods for RNA-seq. Nature Methods 10, 1177–1184 (2013). [DOI] [PMC free article] [PubMed] [Google Scholar]
- 19.Harrow J et al. GENCODE: the reference human genome annotation for The ENCODE Project. Genome Res. 22, 1760–1774 (2012). [DOI] [PMC free article] [PubMed] [Google Scholar]
- 20.Shiraki T et al. Cap analysis gene expression for high-throughput analysis of transcriptional starting point and identification of promoter usage. Proc. Natl Acad. Sci. USA 100, 15776–15781 (2003). [DOI] [PMC free article] [PubMed] [Google Scholar]
- 21.Forrest ARR et al. A promoter-level mammalian expression atlas. Nature 507, 462–470 (2014). [DOI] [PMC free article] [PubMed] [Google Scholar]
- 22.Arner E et al. Transcribed enhancers lead waves of coordinated transcription in transitioning mammalian cells. Science 347, 1010–1014 (2015). [DOI] [PMC free article] [PubMed] [Google Scholar]
- 23.Roadmap Epigenomics Consortium et al. Integrative analysis of 111 reference human epigenomes. Nature 518, 317–330 (2015). [DOI] [PMC free article] [PubMed] [Google Scholar]
- 24.Wang L et al. CPAT: Coding-Potential Assessment Tool using an alignment-free logistic regression model. Nucleic Acids Res. 41, e74 (2013). [DOI] [PMC free article] [PubMed] [Google Scholar]
- 25.Batut P, Dobin A, Plessy C, Carninci P & Gingeras TR High-fidelity promoter profiling reveals widespread alternative promoter usage and transposon-driven developmental gene expression. Genome Res. 23, 169–180 (2013). [DOI] [PMC free article] [PubMed] [Google Scholar]
- 26.Sigova AA et al. Divergent transcription of long noncoding RNA/mRNA gene pairs in embryonic stem cells. Proc. Natl Acad. Sci. USA 110, 2876–2881 (2013). [DOI] [PMC free article] [PubMed] [Google Scholar]
- 27.Carninci P et al. Genome-wide analysis of mammalian promoter architecture and evolution. Nature Genet. 38, 626–635 (2006). [DOI] [PubMed] [Google Scholar]
- 28.Core LJ et al. Analysis of nascent RNA identifies a unified architecture of initiation regions at mammalian promoters and enhancers. Nature Genet. 46, 1311–1320 (2014). [DOI] [PMC free article] [PubMed] [Google Scholar]
- 29.Xiang J-F et al. Human colorectal cancer-specific CCAT1-L lncRNA regulates long-range chromatin interactions at the mYc locus. Cell Res. 24, 513–531 (2014). [DOI] [PMC free article] [PubMed] [Google Scholar]
- 30.Ulitsky I Evolution to the rescue: using comparative genomics to understand long non-coding RNAs. Nature Rev. Genet. 17, 601–614 (2016). [DOI] [PubMed] [Google Scholar]
- 31.Kapusta A et al. Transposable elements are major contributors to the origin, diversification, and regulation of vertebrate long noncoding RNAs. PLoS Genet. 9, e1003470 (2013). [DOI] [PMC free article] [PubMed] [Google Scholar]
- 32.Villar D et al. Enhancer evolution across 20 mammalian species. Cell 160, 554–566 (2015). [DOI] [PMC free article] [PubMed] [Google Scholar]
- 33.Ng S-Y, Johnson R & Stanton LW Human long non-coding RNAs promote pluripotency and neuronal differentiation by association with chromatin modifiers and transcription factors. EMBO J. 31, 522–533 (2012). [DOI] [PMC free article] [PubMed] [Google Scholar]
- 34.Holm H et al. Several common variants modulate heart rate, PR interval and QRS duration. Nature Genet. 42, 117–122 (2010). [DOI] [PubMed] [Google Scholar]
- 35.Pfeufer A et al. Genome-wide association study of PR interval. Nature Genet. 42, 153–159 (2010). [DOI] [PMC free article] [PubMed] [Google Scholar]
- 36.Smith JG et al. Genome-wide association study of electrocardiographic conduction measures in an isolated founder population: Kosrae. Heart Rhythm 6, 634–641 (2009). [DOI] [PMC free article] [PubMed] [Google Scholar]
- 37.Paralkar VR et al. Unlinking an lncRNA from its associated cis element. Mol. Cell 62, 104–110 (2016). [DOI] [PMC free article] [PubMed] [Google Scholar]
- 38.Siepel A et al. Evolutionarily conserved elements in vertebrate, insect, worm, and yeast genomes. Genome Res. 15, 1034–1050 (2005). [DOI] [PMC free article] [PubMed] [Google Scholar]
- 39.1000 Genomes Project Consortium et al. An integrated map of genetic variation from 1,092 human genomes. Nature 491, 56–65 (2012). [DOI] [PMC free article] [PubMed] [Google Scholar]
- 40.Lai F et al. Activating RNAs associate with Mediator to enhance chromatin architecture and transcription. Nature 494, 497–501 (2013). [DOI] [PMC free article] [PubMed] [Google Scholar]
- 41.Clark MB et al. The reality of pervasive transcription. PLoS Biol. 9, e1000625, (2011). [DOI] [PMC free article] [PubMed] [Google Scholar]
- 42.Struhl K Transcriptional noise and the fidelity of initiation by RNA polymerase II. Nature Struct. Mol. Biol 14, 103–105 (2007). [DOI] [PubMed] [Google Scholar]
- 43.Severin J et al. Interactive visualization and analysis of large-scale sequencing datasets using ZENBU. Nature Biotechnol. 32, 217–219 (2014). [DOI] [PubMed] [Google Scholar]
- 44.Hasegawa A, Daub C, Carninci P, Hayashizaki Y & Lassmann T MOIRAI: a compact workflow system for CAGE analysis. BMC Bioinformatics 15, 144 (2014). [DOI] [PMC free article] [PubMed] [Google Scholar]
- 45.Trapnell C et al. Transcript assembly and quantification by RNA-Seq reveals unannotated transcripts and isoform switching during cell differentiation. Nature Biotechnol. 28, 511–515 (2010). [DOI] [PMC free article] [PubMed] [Google Scholar]
- 46.Grabherr MG et al. Full-length transcriptome assembly from RNA-Seq data without a reference genome. Nature Biotechnol. 29, 644–652 (2011). [DOI] [PMC free article] [PubMed] [Google Scholar]
- 47.Kent WJ BLAT--the BLAST-like alignment tool. Genome Res. 12, 656–664 (2002). [DOI] [PMC free article] [PubMed] [Google Scholar]
- 48.Patro R, Mount SM & Kingsford C Sailfish enables alignment-free isoform quantification from RNA-seq reads using lightweight algorithms. Nature Biotechnol. 32, 462–464 (2014). [DOI] [PMC free article] [PubMed] [Google Scholar]
- 49.Ernst J & Kellis M ChromHMM: automating chromatin-state discovery and characterization. Nature Methods 9, 215–216 (2012). [DOI] [PMC free article] [PubMed] [Google Scholar]
- 50.Sloan CA et al. ENCODE data at the ENCODE portal. Nucleic Acids Res. 44 (D1), D726–D732 (2016). [DOI] [PMC free article] [PubMed] [Google Scholar]
- 51.Rice P, Longden I & Bleasby A EMBOSS: the European Molecular Biology Open Software Suite. Trends Genet. 16, 276–277 (2000). [DOI] [PubMed] [Google Scholar]
- 52.Lin MF, Jungreis I & Kellis M PhyloCSF: a comparative genomics method to distinguish protein coding and non-coding regions. Bioinformatics 27, i275–i282 (2011). [DOI] [PMC free article] [PubMed] [Google Scholar]
- 53.Washietl S et al. RNAcode: robust discrimination of coding and noncoding regions in comparative sequence data. RNA 17, 578–594 (2011). [DOI] [PMC free article] [PubMed] [Google Scholar]
- 54.Olexiouk V et al. sORFs.org: a repository of small ORFs identified by ribosome profiling. Nucleic Acids Res. 44 (D1), D324–D329 (2016). [DOI] [PMC free article] [PubMed] [Google Scholar]
- 55.Kent WJ et al. The human genome browser at UCSC. Genome Res. 12, 996–1006 (2002). [DOI] [PMC free article] [PubMed] [Google Scholar]
- 56.Wheeler TJ & Eddy SR nhmmer: DNA homology search with profile HMMs. Bioinformatics 29, 2487–2489 (2013). [DOI] [PMC free article] [PubMed] [Google Scholar]
- 57.Wheeler TJ et al. Dfam: a database of repetitive DNA based on profile hidden Markov models. Nucleic Acids Res. 41, D70–D82 (2013). [DOI] [PMC free article] [PubMed] [Google Scholar]
- 58.Robinson MD, McCarthy DJ & Smyth GK edgeR: a Bioconductor package for differential expression analysis of digital gene expression data. Bioinformatics 26, 139–140 (2010). [DOI] [PMC free article] [PubMed] [Google Scholar]
- 59.Chao A & Shen T-J Nonparametric estimation of Shannon’s index of diversity when there are unseen species in sample. Environ. Ecol. Stat 10, 429–443 (2003). [Google Scholar]
- 60.Meehan TF et al. Logical development of the cell ontology. BMC Bioinformatics 12, 6 (2011). [DOI] [PMC free article] [PubMed] [Google Scholar]
- 61.Mungall CJ, Torniai C, Gkoutos GV, Lewis SE & Haendel MA Uberon, an integrative multi-species anatomy ontology. Genome Biol. 13, R5 (2012). [DOI] [PMC free article] [PubMed] [Google Scholar]
- 62.Johnson AD et al. SNAP: a web-based tool for identification and annotation of proxy SNPs using HapMap. Bioinformatics 24, 2938–2939 (2008). [DOI] [PMC free article] [PubMed] [Google Scholar]
- 63.1000 Genomes Project Consortium et al. A map of human genome variation from population-scale sequencing. Nature 467, 1061–1073 (2010). [DOI] [PMC free article] [PubMed] [Google Scholar]
- 64.Sakharkar MK, Chow VTK & Kangueane P Distributions of exons and introns in the human genome. In Silico Biol. 4, 387–393 (2004). [PubMed] [Google Scholar]
- 65.Quinlan AR & Hall IM BEDTools: a flexible suite of utilities for comparing genomic features. Bioinformatics 26, 841–842 (2010). [DOI] [PMC free article] [PubMed] [Google Scholar]
- 66.Pollard KS, Hubisz MJ, Rosenbloom KR & Siepel A Detection of nonneutral substitution rates on mammalian phylogenies. Genome Res. 20, 110–121 (2010). [DOI] [PMC free article] [PubMed] [Google Scholar]
- 67.Bostock M, Ogievetsky V & Heer J D3: data-driven documents. IEEE Trans. Vis. Comput Graph 17, 2301–2309 (2011). [DOI] [PubMed] [Google Scholar]
- 68.Abugessaisa I et al. FANTOM5 transcriptome catalog of cellular states based on Semantic MediaWiki. Database 2016, baw105 (2016). [DOI] [PMC free article] [PubMed] [Google Scholar]
Associated Data
This section collects any data citations, data availability statements, or supplementary materials included in this article.
Supplementary Materials
Data Availability Statement
The FANTOM CAT meta-assembly and its related resources can be found at http://fantom.gsc.riken.jp/cat/. The CAGE data generated in this study have been deposited in DDBJ (http://trace.ddbj.nig.ac.jp/) under accession codes DRA004812, DRA004813 and DRA004814 (Supplementary Table 1). The RNA-seq data generated in this study have been deposited in DDBJ under accession codes DRA001101 and DRA004790 (Supplementary Table 2). Previously published FANTOM5 CAGE data can be found in DDBJ under accession codes DRA000991, DRA001026, DRA001027, DRA001028, DRA002216, DRA002711, DRA002747, DRA002748 and DRA005089 (Supplementary Table 1). Sample information is available through the FANTOM5 resource browser SSTAR68 at http://fantom.gsc.riken.jp/5/sstar/Browse_samples. The authors declare that the data supporting the findings of this study are available within the paper and its Supplementary Information files. Source data for all figures, Extended Data figures and Supplementary Figures are provided in the online version of the paper.


