

Abstract
Introduction:
Job satisfaction is a multidimensional response to work and workplace environment. It depends on many factors, and affects the behavior of employees that, in turn, affects organizational functioning. The aim of the study was to measure job satisfaction among different categories of healthcare providers from the Punjab government health services and to determine the factors that affect job satisfaction the most.
Methodology:
The study was conducted between September 2015 and February 2016 and included 462 participants working under the Punjab Government health services. Multi-stage random sampling was used, and participants were interviewed telephonically. The study instrument comprised the sociodemographic data and questions from Job Satisfaction Scale (JSS).
Results:
Three-fourth of the respondents (75.3%) were dissatisfied by their working conditions, followed by fringe benefits facet (34%), promotion facet (25.4%), and contingent rewards facet (23.7%). But they felt satisfied concerning relations with their coworkers (97%), nature of their work (93.3%), supervision (91.2%) and communication facet (80.6). Ambivalence was seen in a range of 2.8% (coworkers facet) to 54.8% (contingent rewards facet).
Conclusion:
Job satisfaction affects future career goals, social relationships, and personal health. An extremely demanding workplace can make workers susceptible to feelings of uncertainty and low self-esteem. It is recommended to beef up the policies related to healthcare providers and their working conditions regularly. Job responsibilities should have a scope of change to avoid monotony and loss of interest. A conducive working ecosystem can have a positive effect on the evolving health system of a country.
Keywords: Fringe-benefits, job satisfaction, rewards, salary, supervision, working conditions
Introduction
Job satisfaction is defined as the degree to which individuals feel positive or negative about their jobs.[1] It is a multidimensional response toward work and workplace environment and improves positive energy and performance.[2] It can be considered as a generalized feeling about the job or as a related constellation of attitudes about various aspects or facets of the job. Job satisfaction depends on many factors, and a person may be satisfied with one or more aspects of his/her career, but at the same time, maybe unhappy with other elements. As per the motivator-hygiene theory by Herzberg, job satisfaction and dissatisfaction are not two opposite ends of the same spectrum but instead are two unrelated concepts.[3] “Motivating” factors like pay and benefits, fringe benefits, and contingent rewards need to be met for an employee to be satisfied with work. On the other hand, “hygiene” factors (such as operating conditions, nature of work, communication facet, and coworkers support) are associated with job dissatisfaction. Because both the hygiene and motivational factors are independent, it may be possible that healthcare providers are neither satisfied nor dissatisfied. As per the theory, when working conditions (hygiene factors) are weak, the employee is disgruntled, but when these factors are high, it means the employee is not dissatisfied (or neutral), but not necessarily satisfied.
Job satisfaction can affect the behavior of employees that, in turn, affects organizational functioning.[4] As per the theory of ERG (Existence Relatedness Growth), humans have three sets of basic needs: existence, relatedness, and growth.[5] If attempts to satisfy needs with high priority are not fruitful, then the individual will focus on his demands that initially had a lower priority, which can lead to frustration and dissatisfaction. Therefore, satisfaction at work can be considered as a proxy indicator of emotional well-being or physiological health. It is also inversely associated with absenteeism, turnover in an organization, level of stress, and eventual exhaustion that ultimately improves productivity.[6] The quality of services is linked to the skills, motivation, and satisfaction of the workers providing the healthcare services. As per the World Health Organization (WHO), there is a global concern for the shortage of human resource in health care.[7] Job dissatisfaction has been stated to be one of the significant and consistent predictors of intention to leave the job and migration of healthcare workers apart from other causes.[8,9] Managers who grasp the importance of factors affecting the satisfaction of staff are more likely to gain improved performance. Therefore, the objectives of the present study were to measure the job satisfaction among different groups of healthcare providers from the Punjab health services and to determine the factors that affect the job satisfaction.
Methodology
Study settings
The study was conducted between September 2015 and February 2016 in the state of Punjab, North India. The state has a total population of around 2.77 crores (census 2011).[10] It provides preventive, promotive, and curative services through its 176 health institutions under Punjab Health Systems Corporation (PHSC), stratified as 21 district hospitals, 2 special hospitals, 34 sub-divisional hospitals, and 119 community health centers.
Study participants
A list of eligible healthcare providers- who were permanently employed for more than 1 year at primary health centers, community health centers, and district hospitals of Punjab was prepared. Healthcare providers include doctors, nurses, pharmacists, and lab technicians.
Sample size
An online sample size calculator, open epi (Version 3.01) was used to calculate the sample size.[11] From a north Indian study,[12] taking minimum prevalence of job satisfaction among healthcare providers as 55% (at 95% confidence level with a design effect of 1.2), the total sample size estimated was 457.
Sampling technique
Multi-stage random sampling was used. Initially, nine districts of Punjab state were randomly selected with the help of random number table from a total of 22. Then from each district, 50 eligible study participants (10 from each designation) were randomly approached telephonically from the list prepared after taking an appointment. A single interviewer was trained to conduct all interviews in English or local language after receiving verbal consent from the study participants. Each interview lasted for 20--25 min. There were no refusals. About 12 participants who initially missed the telephone calls responded back. So, they were also interviewed and included in the study to give a final sample of 462.
The study instrument comprised of two parts: Part A included the sociodemographic data like participants’ age, caste, education level, designation, years of work experience, marital status, staying away from/with family and number of transfers in last 5 years. Part B contained questions from Job Satisfaction Scale (JSS) developed by Spector that is a 36-item nine facet scale that includes pay, promotion, supervision, fringe benefit (part of the total compensation package other than pay for time worked), contingent reward (reward for meeting the identified goals), operating condition, coworkers, nature of the work, and communication to assess employee satisfaction with different facets of their jobs.[13] Apart from the 36 items, another set of 10 questions tailored explicitly for government services were included in part B.
As per the standard interpretation of the JSS, agreement with positively worded items and disagreement with negatively worded questions would represent satisfaction, whereas conflict with positive-worded questions and agreement with negative-worded items represents dissatisfaction scored on a 6 point Likert scale. For the 4-item subscales, as well as the 36-item total score, this means that scores with a mean item response (after reverse scoring the negatively-worded items) of 4 or more represent satisfaction, whereas mean responses of 3 or less represent dissatisfaction. Mean scores between 3 and 4 were ambivalence. Translated into the summed scores, for the 4-item subscales with a range from 4 to 24, scores of 4--12 are dissatisfied, 16--24 are satisfied, and between 12 and 16 are ambivalent. For the 36-item total where possible scores range from 36 to 216, the ranges are 36--108 for dissatisfaction, 144--216 for satisfaction, and between 108 and 144 for ambivalent. Data management was undertaken using Statistical Package for Social Sciences (version 16.0; SPSS, Inc., Chicago, Ill., USA) to calculate descriptive statistics.
Results
A total of 462 healthcare providers were interviewed during the survey. The mean age of the respondents was 42.08 ± 10.23 years (minimum 25 years, maximum of 62 years) [Table 1]. 41.8% (n = 193) respondents were females, and working as pharmacists (n = 135; 29.2%), medical officers (n = 143; 29.0%), staff nurses (n = 92; 19.9%), and lab technicians (n = 87; 18.9%). Most of the participants were living with their families (n = 366; 79.3%), 14.2% (n = 65) were living in a different city than the city of their current posting. Majority of the participants (52%) were working at the same place for the last 5 years. The mean work experience was 17.6 years (minimum of 1 year and a maximum of 38 years). The total mean score on JSS was 150.19 ± 19.08, with a minimum of 91 and a maximum of 191. Overall, 66% (n = 307) of the respondents were satisfied with their present job, only 2.8% (n = 13) were dissatisfied while 31.2% (n = 145) were ambivalent [Table 2]. Among the satisfied respondents, majority were lab technicians (77%; n = 67) and medical officers (72%; n = 103), followed by pharmacist (56.3%; n = 76), and nurses (55.4%; n = 51).
Table 1.
Sociodemographic characteristics of the study participants
| Variable | Frequency | Percentage |
|---|---|---|
| Gender | ||
| Female | 193 | 41.8 |
| Male | 269 | 58.2 |
| Age Group | ||
| 21-30 years | 89 | 19.3 |
| 31-40 years | 112 | 24.2 |
| 41-50 years | 134 | 29.0 |
| >50 years | 127 | 27.5 |
| Current designation | ||
| Lab Technician | 87 | 18.8 |
| Medical Officer | 134 | 29.0 |
| Staff Nurse | 92 | 19.9 |
| Pharmacist | 135 | 29.2 |
| Senior Medical Officer/Specialist | 14 | 3.0 |
| Current marital status | ||
| Married | 390 | 84.4 |
| Single | 72 | 15.6 |
| Participants living with family | ||
| Yes | ||
| In the same town/city of posting | 301 | 65.2 |
| In another town/city of posting | 65 | 14.1 |
| No | ||
| Lives separate | 96 | 20.8 |
| Last educational degree | ||
| Less than graduation | 47 | 10.2 |
| Graduation diploma/degree | 305 | 66.0 |
| Post-Graduation diploma/degree | 110 | 23.8 |
| No. of transfers in the last five years | ||
| Less than two transfers | 370 | 80.1 |
| ≥2 transfers | 92 | 19.9 |
| Participants according to their caste | ||
| Unreserved | 274 | 59.3 |
| Reserved | 188 | 40.7 |
| Type of health facility | ||
| Primary health center | 71 | 15.4 |
| Community health center | 189 | 40.9 |
| Sub-divisional hospital | 84 | 18.2 |
| District hospital | 118 | 25.5 |
| Total | 462 | 100.0 |
Table 2.
Details of the scoring pattern for the subscales of the JSS scale
| Subscale | Total score of each Facet | Dissatisfied | Ambivalent | Satisfied | |||||
|---|---|---|---|---|---|---|---|---|---|
| Min | Max | Mean score±SD | n (%) | Mean score±SD | n (%) | Mean score±SD | n (%) | Mean score±SD | |
| Pay | 4 | 24 | 16.38±4.04 | 76 (16.4) | 9.52±2.30 | 97 (21.0) | 14.16±0.74 | 289 (62.6) | 18.93±4.04 |
| Promotion | 7 | 22 | 14.36±2.80 | 117 (25.3) | 10.08±1.29 | 187 (40.2) | 13.96±0.78 | 158 (34.2) | 17.45±1.42 |
| Supervision | 7 | 24 | 20.52±2.96 | 9 (1.9) | 9.78±2.28 | 32 (6.9) | 15.22±1.13 | 421 (91.1) | 21.15±2.11 |
| Fringe Benefits | 4 | 23 | 14.04±4.20 | 158 (34.2) | 9.30±2.44 | 124 (26.8) | 14.10±0.80 | 180 (39.0) | 18.12±1.88 |
| Contingent rewards | 6 | 24 | 14.34±2.60 | 110 (23.8) | 11.25±1.22 | 252 (54.5) | 14.18±1.01 | 100 (21.6) | 18.12±2.55 |
| Operating conditions | 4 | 19 | 10.79±2.43 | 348 (75.3) | 9.72±1.63 | 99 (21.4) | 13.64±0.76 | 15 (3.2) | 16.73±9.96 |
| Co-workers | 11 | 24 | 21.11±2.43 | 1 (0.2) | 11 | 13 (2.8) | 14.23±0.72 | 448 (97) | 21.8±1.89 |
| Nature of work | 5 | 24 | 20.24±3.08 | 10 (2.2) | 9.50±2.50 | 21 (4.5) | 14.52±0.51 | 431 (93.3) | 20.76±2.35 |
| Communication | 5 | 24 | 10.35±3.41 | 20 (4.3) | 10.35±1.88 | 69 (15.1) | 14.29±0.80 | 373 (80.6) | 19.61±2.47 |
| Total | 91 | 191 | 150.19±19.08 | 13 (2.8) | 100.77±5.77 | 144 (31.2) | 131.76±7.96 | 305 (66) | 160.98±11.80 |
The components of the JSS were further analyzed individually. In six out of nine facets (pay, supervision, contingent rewards, nature of work, coworkers and communication), maximum score of 24 was reached, whereas pay, fringe benefits, and operating conditions touched the minimum total score, that is, 4. Communication facet had the lowest mean score (10.35 ± 3.41) among the nine facets. As per the standard interpretation of the JSS, final scores of each facet was further categorized into dissatisfied, ambivalent, and satisfied. Nearly, three-fourths of the respondents (75.3%) were dissatisfied by their working conditions, followed by fringe benefits facet (34%), promotion facet (25.4%), and contingent rewards facet (23.7%). On the other hand, respondents were satisfied concerning relations with their coworkers (97%), nature of their work (93.3%), supervision (91.2%), and communication facet (80.6). Ambivalence was seen in a range of 2.8% (coworkers facet) to 54.8% (contingent rewards facet) [Table 2]. Table 3 illustrates the association between the satisfied respondents as per the JSS classification based on the mean score for each facet and their designation. Figure 1 depicts the same association graphically through a radar plot. The following observations were made:
Table 3.
Distribution of the satisfied workers according to different domains of the scale
| LT n=87 (100) | MO n=134 (100) | Nurse n=92 (100) | Pharmacist n=135 (100) | SMO/Specialist n=14 (100) | Total n=462 (100) | |
|---|---|---|---|---|---|---|
| Pay | 49 (56.3) | 114 (85.1) | 47 (51.1) | 67 (49.6) | 12 (58.7) | 289 (62.6) |
| Promotion | 35 (40.2) | 66 (49.3) | 26 (28.3) | 25 (18.5) | 6 (42.9) | 158 (34.2) |
| Supervision | 83 (95.4) | 123 (91.8) | 84 (91.3) | 118 (87.4) | 13 (92.9) | 421 (91.1) |
| Fringe Benefits | 36 (41.4) | 71 (53.0) | 27 (29.3) | 43 (31.9) | 3 (21.4) | 180 (39.0) |
| Contingent rewards | 10 (11.5) | 62 (46.3) | 10 (10.9) | 14 (10.4) | 4 (28.6) | 100 (21.6) |
| Operating conditions | 3 (3.4) | 8 (6.0) | 1 (1.1) | 2 (1.5) | 1 (7.1) | 15 (3.2) |
| Coworkers | 86 (98.9) | 128 (95.5) | 87 (94.6) | 133 (98.5) | 14 (100) | 448 (97.0) |
| Nature of work | 84 (96.6) | 127 (94.8) | 88 (95.7) | 120 (88.9) | 12 (85.7) | 431 (93.3) |
| Communication | 83 (95.4) | 103 (76.9) | 70 (76.1) | 108 (80.0) | 9 (64.3) | 373 (80.7) |
| Overall | 67 (77.0) | 103 (76.9) | 51 (55.4) | 76 (56.3) | 8 (57.1) | 305 (66.0) |
Figure 1.
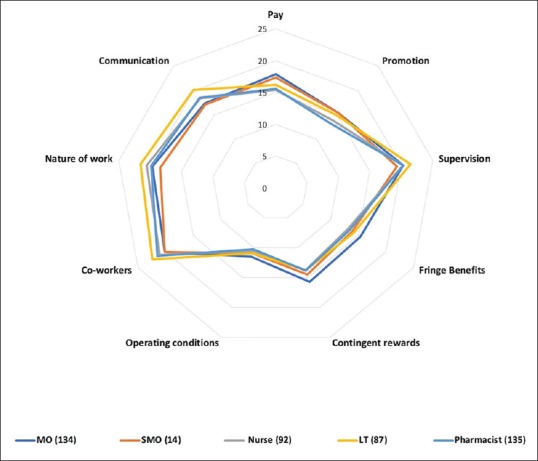
Radar chart comparing mean scores among health staff for different components of JSS
1. Pay facet
Maximum satisfaction was seen among the senior medical officers (85.7%; n = 12), followed by medical officers (85.1%; n = 114), and lab technicians (56.3%; n = 49). (Pvalue = 0.000)
2. Promotion facet
In each group, satisfaction was depicted in less than 50% respondents, but pharmacists (18.5%; n = 25) and nurses were least satisfied (28.3%; n = 26). (P value = 0.000)
3. Supervision facet
All the groups were satisfied in range of 95.5% (lab technicians) to 87.4% (pharmacists) (P value = 0.303)
4. Fringe benefit facet
Only the medical officers were satisfied in maximum strength (53.0%, n = 71) but senior medical officers (21.4%, n = 3) and nurses were least satisfied (29.3%, n = 27). (P value = 0.000)
5. Contingent reward facet
The paramedical staff, that is, pharmacists (10.4%, n = 14), nurses (10.9%, n = 10), and lab technicians (11.5%, n = 10) were less satisfied than the medical officers (46.3%, n = 62) and senior medical officers (28.3%, n = 4). (P value = 0.000)
6. Operating condition facet
Almost all the groups were dissatisfied from their current working conditions, with satisfaction ranging from 1.1% (nurses) to 6.0% (medical officers) (P value = 0.129)
7. Coworkers facet
Most of the healthcare providers in all the groups were satisfied with their coworkers in a range of 100% (senior medical officers) to 94.6% (nurses) (P value = 0.398).
8. Nature of the work facet
Majority of the respondents in all the groups were satisfied in a range of 96.6% (lab technicians) to 85.7% (senior medical officers) (P value = 0.097).
9. Communication facet
Around three-fourth of the medical officers (76.9%, n = 103), 64.3% of senior medical officers (n = 9), nurses (76.1%, n = 70), pharmacist (80.0%, n = 108), and lab technicians (95.4%, n = 83) were found to be satisfied. (P value = 0.003).
Subsequently, the satisfaction among the healthcare workers was associated with independent variables [Table 4]. Since the number of dissatisfied respondents was minimal for analysis, they were merged with the ambivalent group. The fact that the ambivalent group scored less than the satisfied group justifies its confluence with the dissatisfied group to make satisfied and non-satisfied groups. Satisfaction level among the healthcare workers was significantly associated with their current marital status, educational degree, and no transfers in the last 5 years. Other components like age, stay with family in the same town and city of present posting were only partially significant. Furthermore, the mean score obtained on Likert scale for the questions that were tailor-made to inquire about aspects of being in government health services by participants who were identified as satisfied or dissatisfied as per the JSS scoring system was compared to assess their satisfaction about Government job [Table 5]. The differences were statistically significant.
Table 4.
Association of the satisfaction of participants with different sociodemographic factors according to their designation
| Variable | Satisfaction | LT | MO | Nurse | Pharmacist | SMO/ Spec | Total | P-value |
|---|---|---|---|---|---|---|---|---|
| Gender | ||||||||
| Female | No | 6 (28.6) | 12 (26.1) | 40 (44.0) | 10 (33.3) | 2 (40.0) | 70 (36.3) | 0.245 |
| Yes | 15 (71.4) | 34 (73.9) | 51 (56.0) | 20 (66.7) | 3 (60.0) | 123 (63.7) | ||
| Male | No | 14 (21.2) | 19 (21.6) | 1 (100.0) | 49 (46.7) | 4 (44.4) | 87 (32.3) | 0.000 |
| Yes | 52 (78.8) | 69 (78.4) | 0 (0.0) | 56 (53.3) | 5 (55.6) | 182 (67.7) | ||
| Age groups | ||||||||
| 21-30 years | No | 4 (25.0) | 11 (23.4) | 14 (60.9) | 0 (0.0) | 2 (100.0) | 31 (34.8) | 0.006 |
| Yes | 12 (75.0) | 36 (76.6) | 9 (39.1) | 1 (100.0) | 0 (0.0) | 58 (65.2) | ||
| 31-40 years | No | 4 (14.8) | 12 (30.8) | 13 (40.6) | 6 (66.7) | 1 (20.0) | 36 (32.1) | 0.033 |
| Yes | 23 (85.2) | 27 (69.2) | 19 (59.4) | 3 (33.3) | 4 (80.0) | 77 (67.9) | ||
| 41-50 years | No | 6 (25.0) | 5 (14.7) | 9 (42.9) | 23 (43.4) | 2 (100.0) | 45 (33.6) | 0.010 |
| Yes | 18 (75.0) | 29 (85.3) | 12 (57.1) | 30 (56.6) | 0 (0.0) | 89 (66.4) | ||
| >50 years | No | 6 (30.0) | 3 (21.4) | 5 (31.3) | 30 (41.7) | 1 (20.0) | 45 (35.4) | 0.505 |
| Yes | 14 (70.0) | 11 (78.6) | 11 (68.8) | 42 (58.3) | 4 (80.0) | 82 (64.6) | ||
| Participants according to their caste | ||||||||
| Unreserved Categories | No | 10 (23.3) | 21 (25.0) | 16 (36.4) | 41 (44.1) | 5 (50.0) | 93 (33.9) | 0.030 |
| Yes | 33 (76.7) | 63 (75.0) | 28 (63.6) | 52 (55.9) | 5 (50.0) | 181 (66.1) | ||
| Reserved Categories | No | 10 (22.7) | 10 (20.0) | 25 (52.1) | 18 (42.9) | 1 (25.0) | 64 (34.0) | 0.109 |
| Yes | 34 (77.3) | 40 (80.0) | 23 (47.9) | 24 (57.1) | 3 (75.0) | 124 (66.0) | ||
| Current marital status | ||||||||
| Married | No | 14 (20.3) | 25 (24.0) | 34 (42.0) | 52 (42.3) | 5 (38.5) | 130 (33.3) | 0.002 |
| Yes | 55 (79.7) | 79 (76.0) | 47 (58.0) | 71 (57.7) | 8 (61.5) | 260 (66.7) | ||
| Single | No | 6 (33.3) | 6 (20.0) | 7 (63.6) | 7 (58.3) | 1 (100.0) | 27 (37.5) | 0.025 |
| Yes | 12 (66.7) | 24 (80.0) | 4 (36.4) | 5 (41.7) | 0 (0.0) | 45 (62.5) | ||
| Participants living with family | ||||||||
| Yes In the same town/city of posting | No | 0 (0.0) | 17 (16.7) | 29 (42.0) | 52 (45.6) | 3 (30.0) | 101 (33.6) | 0.000 |
| Yes | 6 (100.0) | 85 (83.3) | 41 (58.0) | 62 (54.4) | 7 (70.0) | 200 (66.4) | ||
| In another town/city of posting | No | 10 (19.6) | 2 (25.0) | 2 (66.7) | 0 (0.0) | 1 (100.0) | 15 (23.1) | 0.104 |
| Yes | 41 (80.4) | 6 (75.0) | 1 (33.3) | 2 (100.0) | 0 (0.0) | 50 (76.9) | ||
| No Lives separate | No | 10 (33.3) | 12 (50.0) | 10 (50.0) | 7 (36.8) | 2 (66.7) | 41 (42.7) | 0.557 |
| Yes | 20 (66.7) | 12 (50.0) | 10 (50.0) | 12 (63.2) | 1 (33.3) | 55 (57.3) | ||
| Last educational degree | ||||||||
| Below graduation | No | 3 (20.0) | 0 | 6 (50.0) | 13 (65.0) | 0 | 22 (46.8) | 0.030 |
| Yes | 12 (80.0) | 0 | 6 (50.0) | 7 (35.0) | 0 | 25 (53.2) | ||
| graduate diploma/degree | No | 12 (24.0) | 27 (22.5) | 22 (44.9) | 33 (42.9) | 4 (36.4) | 97 (31.8) | 0.005 |
| Yes | 38 (76.0) | 93 (77.5) | 26 (55.3) | 44 (57.1) | 7 (63.6) | 208 (68.2) | ||
| PG diploma/degree | No | 5 (22.7) | 4 (28.6) | 14 (42.4) | 13 (34.2) | 2 (66.7) | 38 (34.5) | 0.004 |
| Yes | 17 (77.3) | 10 (71.4) | 19 (57.6) | 25 (65.8) | 1 (33.3) | 72 (65.5) | ||
| No. of transfers in the last 5 years | ||||||||
| Less than two transfers | No | 16 (21.1) | 26 (23.9) | 35 (43.2) | 35 (38.5) | 6 (46.2) | 118 () | 0.004 |
| Yes | 60 (78.9) | 83 (76.1) | 46 (56.8) | 56 (61.5) | 7 (53.8) | 252 (68.1) | ||
| ≥ 2 transfers | No | 4 (36.4) | 5 (20.0) | 6 (54.5) | 24 (54.5) | 0 | 39 (42.4) | 0.053 |
| Yes | 7 (63.6) | 20 (80.0) | 5 (45.5) | 20 (45.5) | 1 (100) | 53 (57.6) |
Table 5.
Comparison of the mean score of specific government job-related questions among the satisfied and dissatisfied/ambivalent group as per the total mean score of the JS scale
| Questions | Mean | P | |
|---|---|---|---|
| Dissatisfied/Ambivalent | Satisfied | ||
| You feel motivated to work in the public health sector | 4.65±0.964 | 5.50±0.678 | 0.000 |
| Your staff members understand each other’s role | 5.04±0.817 | 5.48±0.692 | 0.000 |
| The equipment is adequate | 4.92±0.900 | 5.18±0.899 | 0.004 |
| The timeliness of receiving TA/DA/reimbursements | 4.37±0.885 | 4.88±0.857 | 0.000 |
| You believe that you have to face bias by seniors | 1.37±0.832 | 1.18±0.629 | 0.013 |
| Your seniors listen to your issues | 4.29±0.960 | 4.95±0.746 | 0.000 |
| The patients are satisfied with the services you provide | 5.09±0.685 | 5.44±0.626 | 0.000 |
| You feel that you can help your patients | 5.13±0.732 | 5.50±0.618 | 0.000 |
| You feel that you can meet patients needs | 5.10±0.724 | 5.52±0.612 | 0.000 |
Discussion
To realize the goal of comprehensive universal health coverage, it is important to increase the utilization of public health services through effective primary care. As per the National Family Household Survey-4, there is a higher utilization of private health sector (56.1% and 49% in urban and rural households) as compared to the public sector (42% and 46.4%).[14] As a result, out of pocket expenditure in India is one of the highest in the world.[15] To mitigate, Government of India has introduced various strategies like Ayushman Bharat, Janani Shishu Suraksha Karyakaram (JSSK), Janani Suraksha Yojana (JSY). But all these efforts cannot achieve the desired goal until we have self-motivated and efficient healthcare providers at primary and secondary healthcare levels. Primary healthcare providers act as gate keepers of health of the whole nation. They offer services at the doorstep and reduces the burden at the secondary and tertiary care.[16] However, there motivation is the key to effective health service delivery and the motivation depends upon job satisfaction. Hence, it is critical to ensure that they feel satisfied with their jobs. Our study included healthcare workers with different designations to have a comprehensive picture of job satisfaction. Past studies focussed mainly on doctors and nurses.[17] Our study has used JSS. This is a frequently used validated instrument that allows comparisons with previous studies.[18] In the present study, 66% of the respondents were satisfied with their present job. This high level of satisfaction contradicts results observed in other studies from India and abroad.[19,20,21] Another study reported a higher job satisfaction than ours, but it was done only among the doctors practicing in the tertiary care institutions of Chandigarh.[22] Any level of dissatisfaction among healthcare providers in the public sector demands further assessment, as this could have deterrent consequences in terms of overall efficiency, effectiveness, and sustainability of any health system.
Job satisfaction was similar across all age groups in our study. Some studies have reported higher satisfaction in elderly professionals compared to younger professionals.[23,24] Male workers felt more satisfied compared to females similar to a survey conducted among German physicians.[25] However, a Spanish study reported the opposite results.[23] Some other reviews concluded that gender is not a strong independent predictor.[26,27] The differences may be attributed to cultural variations. In India, women comprise 25% percent of the Indian workforce, but women with families are still doing 90% of household responsibilities and childcare duties,[28] so even a little inconvenience at any of the two places can make them feel dissatisfied.
Highest job satisfaction in terms of mean total score as per JSS was observed among the pharmacists followed by medical officers. But, the proportion of satisfied group was highest among the lab technicians, followed by medical officers [Table 3]. High scores can be attributed to the stability of job, supportive administration, regular duty-offs, and a decent salary in the government-funded health facility. A government servant working in health department also enjoys a respectable status in the society, and this adds to the satisfaction.[29] Apart from this, there are other benefits offered in government jobs like maternity leaves, childcare leaves, pension benefits to the employees.
Our study reported less satisfaction among nurses (55.4%) but another study from India reported higher satisfaction among the nurses.[30] The difference can be attributed to the shortage of manpower and more work stress in the primary health centers in comparison to the central institutes. Currently, most of the nurses in the government sector are hired on contractual basis under the National Health Mission. This instability of job and low salary may affect the peace of mind and hence the satisfaction.[31,32] Jaiswal et al. reported technicians to be least satisfied while working in a tertiary care institute of Delhi and highlighted wide variation in educational qualifications, improper recruitment policies, improper deployment, very few career growth opportunities, lesser option for training as the main reasons.[30] Rates of job satisfaction depicted in our study among the medical officers were similar to studies conducted outside India.[31] The dissatisfaction among healthcare providers can be attributed to the existence of multiple cadres, different pay scales for the same job (contractual vs. regular), injustice to the proficient skills (especially doctors with post-graduation degrees), lack of autonomy regarding professional decisions, stagnation and in-commensurate remuneration according to some.[33] Job dissatisfaction among doctors may also be a manifestation of their changing portfolio in developing society as they are regularly given the administrative charges apart from clinical work for which most of them are not trained adequately.[30]
Most of the workers felt satisfied with their current pay scales (62.6%). Majority of them (40.2%) had mixed opinions regarding promotion opportunities. Other studies have also indicated a significant relationship between pay, promotion opportunity, and job satisfaction. Health system should consider these variables to retain their best brains.[34] Most of the employees (91%) were satisfied with their supervisors. It is crucial poor job satisfaction and higher turnover intention have been related with poor supervision, which is harmful for the organization in many ways, for example, replacement cost, work abruption, and demotivation among other coworkers.[35] In our study, a large proportion of workers were utterly dissatisfied from fringe benefits and contingent rewards offered to them. This is a crucial cause of demotivation and hamper the growth needs of workers. As the healthcare settings provide round the clock services, contingent rewards play a significant role as observed in other studies also.[36]
The effect of working environment, coworkers support and team dynamics, team leader qualities, and nature of work assigned to workers on their overall satisfaction can also not be ignored.[37,38,39] Ideally, it is challenging to perform international comparisons of the working environment and job satisfaction. The healthcare settings and the duties of healthcare providers with a similar designation differ between countries and differences are marked even within states. For instance, a medical officer in a primary health centers is supposed to perform both clinical and administrative duties, while there are only clinical duties to be completed in most of the district level hospitals. A viable communication system within a system help in resolving issues and hence increase satisfaction.[24,40] Community Health Workers Motivation Framework explains the effect of environment and working conditions on motivation and job satisfaction among healthcare providers by Gopalan et al.[41] According to this framework, the sources of motivation can be classified into individual and environmental factors. The latter is further divided into the health system and community-level elements.
Our study had certain limitations. The causal relationship between factors affecting satisfaction couldn’t be confirmed as the study was cross-sectional. The study did not evaluate the efficiency of the participants. This could help to assess a relationship between different factors leading to their actual performance. But the study might well offer fresh insights as to the current job satisfaction level among the healthcare providers.
Conclusion
Job satisfaction influences daily motivation to go to the workplace and social relationships. The extremely demanding workplace can lead to feelings of uncertainty, low self-esteem, and concerns about future career goals. The paper intends to sensitize the policy makers on the subject of satisfaction of the workforce and its implications. It is suggested that job responsibilities should have a scope of change or else, monotony prevails and leads to loss of interest. It is essential to beef up the policies related to healthcare providers and their working conditions regularly. Interventions directed at improving the various facets will have a positive effect on job satisfaction. A conducive working ecosystem in addition to a satisfied and ambitious workforce can and have a positive impact on the evolving health system of a country.
List of abbreviations
JSS: Job Satisfaction Scale.
ERG: Existence Relatedness Growth.
PHSC: Punjab Health Systems Corporation.
Ethics approval and consent to participate
The Institutional Ethics Committee approved the study protocol of the PGIMER, Chandigarh, India (approval no: P-622, letter number: PGI/IEC/2014/233). Consent was obtained from all subjects before the interview.
Consent for publication
Not applicable.
Availability of data and material
The datasets used and analyzed during the current study are available from the corresponding author on reasonable request.
Authors’ contributions
Conceived and designed the study: TDS, MK, RK Performed the study: TDS, MK, RK Analysed the data: TDS, MV, MK, RK. Wrote the paper: TDS, MV, MK, RK. Provided comments and inputs to revise the paper: TDS, MV, MK, RK. All authors critically revised the manuscript and read and approved the final manuscript.
Financial support and sponsorship
Nil.
Conflicts of interest
There are no conflicts of interest.
Acknowledgements
We acknowledge the hard work done by Dr. Nidhi Jaswal (Ph.D.) who contacted all the participants telephonically and recorded their responses. We are also thankful to Punjab Health Systems Corporation (PHSC), and Punjab Civil Medical Services (PCMS); Department of Health and Family Welfare, Government of Punjab for providing us a conducive environment to carry out this research
References
- 1.Schermerhorn JR. 11th ed. New York: Wiley; 2010. Organizational Behavior; p. 672. [Google Scholar]
- 2.Bhatnagar K, Srivastava K. Job satisfaction in health-care organizations. Ind Psychiatry J. 2012;21:75–8. doi: 10.4103/0972-6748.110959. [DOI] [PMC free article] [PubMed] [Google Scholar]
- 3.Herzberg F. Motivation-hygiene profiles: Pinpointing what ails the organization. Organ Dyn. 1974;3:18–29. [Google Scholar]
- 4.Bakotić D. Relationship between job satisfaction and organisational performance. Econ Res Istraživanja. 2016;29:118–30. [Google Scholar]
- 5.Alderfer CP. New York: Free Press; 1972. Existence, Relatedness, and Growth: Human Needs in Organizational Settings. [Google Scholar]
- 6.Aazami S, Shamsuddin K, Akmal S, Azami G. The relationship between job satisfaction and psychological/physical health among Malaysian working women. Malays J Med Sci. 2015;22:40–6. [PMC free article] [PubMed] [Google Scholar]
- 7.World Health Organization. Global health workforce shortage to reach 12.9 million in coming decades [Internet]. WHO. World Health Organization. 2014. [cited 2019 Feb 12]. Available from: https://www.who.int/mediacentre/news/releases/2013/health-workforce-shortage/en/
- 8.Ojakaa D, Olango S, Jarvis J. Factors affecting motivation and retention of primary health care workers in three disparate regions in Kenya. Hum Resour Health. 2014;12:33. doi: 10.1186/1478-4491-12-33. [DOI] [PMC free article] [PubMed] [Google Scholar]
- 9.Dayrit MM, Dolea C, Dreesch N. Addressing the human resources for health crisis in countries: How far have we gone? What can we expect to achieve by 2015? Rev Peru Med Exp Salud Publica. 2011;28:327–36. [PubMed] [Google Scholar]
- 10.Department of Planning. Basic Statistics of Punjab [Internet] 2011. [cited 2019 Feb 12]. p. 9. Available from: http://pbplanning.gov.in/pdf/basicStat2011in_eng.pdf .
- 11.OpenEpi - Toolkit Shell for Developing New Applications. 2013:1–2. [Google Scholar]
- 12.Dixit J, Goel S, Sharma V. A comparative study on the level of satisfaction among regular and contractual health-care workers in a Northern city of India. J Fam Med Prim Care. 2017;6:416–23. doi: 10.4103/jfmpc.jfmpc_278_16. [DOI] [PMC free article] [PubMed] [Google Scholar]
- 13.Spector PE. Measurement of human service staff satisfaction: Development of the Job Satisfaction Survey. Am J Community Psychol. 1985;13:693–713. doi: 10.1007/BF00929796. [DOI] [PubMed] [Google Scholar]
- 14.Sembiah S, Paul B, Dasgupta A, Bandyopadhyay L. Capacity building of private sector workforce for public health services in India: Scope and challenges. Indian J Community Med. 2018;43:144–7. doi: 10.4103/ijcm.IJCM_316_17. [DOI] [PMC free article] [PubMed] [Google Scholar]
- 15.World Bank Group. Global health expenditure database (current US$) [Internet] 2016. [cited 2019 Sep 04]. Available from: https://apps.who.int/nha/database/Select/Indicators/en .
- 16.Anant P, Bergkvist S, Chandani T, Katyal A, Rao R, Reddy S, et al. Landscaping of Primary Healthcare in India [Internet] 2016. [cited 2019 Sep 04]. Available from: https://accessh.org/wp-content/uploads/2016/05/Primary-Care-Landscape_ACCESS-Health-International.pdf .
- 17.Peters DH, Chakraborty S, Mahapatra P, Steinhardt L. Job satisfaction and motivation of health workers in public and private sectors: Cross-sectional analysis from two Indian states. Hum Resour Health. 2010;8:27. doi: 10.1186/1478-4491-8-27. [DOI] [PMC free article] [PubMed] [Google Scholar]
- 18.Sibbald B, Enzer I, Cooper C, Rout U, Sutherland V. GP job satisfaction in 1987, 1990 and 1998: Lessons for the future? Fam Pract. 2000;17:364–71. doi: 10.1093/fampra/17.5.364. [DOI] [PubMed] [Google Scholar]
- 19.Kumar R, Ahmed J, Shaikh BT, Hafeez R, Hafeez A. Job satisfaction among public health professionals working in public sector: A cross sectional study from Pakistan. Hum Resour Health. 2013;11:2. doi: 10.1186/1478-4491-11-2. [DOI] [PMC free article] [PubMed] [Google Scholar]
- 20.Koch K, Miksch A, Schürmann C, Joos S, Sawicki PT. The German health care system in international comparison. Dtsch Aerzteblatt Online. 2011;108:255–61. doi: 10.3238/arztebl.2011.0255. [DOI] [PMC free article] [PubMed] [Google Scholar]
- 21.Kaur S, Sharma R, Talwar R, Verma A, Singh S. A study of job satisfaction and work environment perception among doctors in a tertiary hospital in Delhi. Indian J Med Sci. 2009;63:139–44. [PubMed] [Google Scholar]
- 22.Sharma M, Goel S, Singh SK, Sharma R, Gupta PK. Determinants of Indian physicians’ satisfaction & dissatisfaction from their job. Indian J Med Res. 2014;139:409–17. [PMC free article] [PubMed] [Google Scholar]
- 23.Carrillo-García C, Solano-Ruíz M del C, Martínez-Roche ME, Gómez-García CI. Job satisfaction among health care workers: The role of gender and age. Rev Lat Am Enfermagem. 2013;21:1314–20. doi: 10.1590/0104-1169.3224.2369. [DOI] [PubMed] [Google Scholar]
- 24.Alcaraz-Mor R, Vigouroux A, Urcun A, Boyer L, Villa A, Lehucher-Michel M-P. Quality of work life of young hospital doctors?: Satisfied despite everything. Sante Publique (Paris) 2019;31:113. doi: 10.3917/spub.191.0113. [DOI] [PubMed] [Google Scholar]
- 25.Behmann M, Schmiemann G, Lingner H, Kühne F, Hummers-Pradier E, Schneider N. Job satisfaction among primary care physicians. Dtsch Aerzteblatt Online. 2012;109:193–200. doi: 10.3238/arztebl.2012.0193. [DOI] [PMC free article] [PubMed] [Google Scholar]
- 26.Keeton K, Fenner DE, Johnson TRB, Hayward RA. Predictors of physician career satisfaction, work–life balance, and burnout. Obstet Gynecol. 2007;109:949–55. doi: 10.1097/01.AOG.0000258299.45979.37. [DOI] [PubMed] [Google Scholar]
- 27.Cujec B, Oancia T, Bohm C, Johnson D. Career and parenting satisfaction among medical students, residents and physician teachers at a Canadian medical school. CMAJ. 2000;162:637–40. [PMC free article] [PubMed] [Google Scholar]
- 28.Batra JK, P A, Sehgal M. Coping strategies of young married women in banking sector with reference to health and family. Int J Adv Res. 2016;2:1–9. [Google Scholar]
- 29.Ellickson MC, Logsdon K. Determinants of job satisfaction of municipal government employees. Public Pers Manage. 2002;31:343–58. [Google Scholar]
- 30.Jaiswal P, Gadpayle A, Modi R, Padaria R, Singhal A, Sachdeva S, et al. Job satisfaction among hospital staff working in a Government teaching hospital of India. Med J Dr DY Patil Univ. 2015;8:131–7. [Google Scholar]
- 31.Kohli S, Bagga R. Job satisfaction amongst contractual and regular nursing staff in two Government hospitals of Delhi: A comparison. Heal Popul Perspect Issues. 2013;36:98–107. [Google Scholar]
- 32.Lee E. Why newly graduated nurses in South Korea leave their first job in a short time? A survival analysis. Hum Resour Health. 2019;17:61. doi: 10.1186/s12960-019-0397-x. [DOI] [PMC free article] [PubMed] [Google Scholar]
- 33.Hwara AHi. South Africa: 2009. [cited 2019 Feb 12]. Motivation, job satisfaction and attitudes of nurses in the public health services of Botswana. [Internet] p. 449. Available from: http://uir.unisa.ac.za/bitstream/handle/10500/3084/dissertation_hwara_h.pdf?sequence=1&isAllowed=y . [Google Scholar]
- 34.Ehsan Malik M, Malik ME, Danish RQ, Munir Y. The impact of pay and promotion on job satisfaction: Evidence from higher education institutes of Pakistan. Am J Econ. 2012;2:6–9. [Google Scholar]
- 35.Wisal A, Jamal K, Ghayur A. Impact of abusive supervision on job satisfaction and turnover intention: Role of power distance as a moderator. City Univ Res J. 2016;26(06):122–36. [Google Scholar]
- 36.Artz B. Fringe Benefits and Job Satisfaction. Department of Economics-University of Wisconsin, Whitewater Working Paper No.8(03) 2008. [Last cited on 2019 Sep 16]. Available from: https://www.uww.edu/Documents/colleges/cobe/economics/wpapers/08_03_Artz.pdf .
- 37.Merga H, Fufa T. Impacts of working environment and benefits packages on the health professionals’ job satisfaction in selected public health facilities in eastern Ethiopia: Using principal component analysis. BMC Health Serv Res. 2019;19:494. doi: 10.1186/s12913-019-4317-5. [DOI] [PMC free article] [PubMed] [Google Scholar]
- 38.Scanlan LM, Devine SG, Watkins DL. Job satisfaction of mental healthcare workers in multidisciplinary teams. J Ment Health. 2019:1–8. doi: 10.1080/09638237.2019.1644489. doi: 10.1080/09638237.2019.1644489. [DOI] [PubMed] [Google Scholar]
- 39.Kolo E. Job satisfaction among healthcare workers in a tertiary center in Kano, Northwestern Nigeria. Niger J Basic Clin Sci. 2018;15:87. [Google Scholar]
- 40.Sharma P, Lampley J, Good D. Organizational communication: Perceptions of staff members’ level of communication satisfaction and job satisfaction. J Acad Adm High Educ. 2015;11:43–54. [Google Scholar]
- 41.Gopalan SS, Mohanty S, Das A. Assessing community health workers’ performance motivation: A mixed-methods approach on India's Accredited Social Health Activists (ASHA) programme. BMJ Open. 2012;2:e001557. doi: 10.1136/bmjopen-2012-001557. [DOI] [PMC free article] [PubMed] [Google Scholar]
Associated Data
This section collects any data citations, data availability statements, or supplementary materials included in this article.
Data Availability Statement
The datasets used and analyzed during the current study are available from the corresponding author on reasonable request.