

Abstract
Objective
In health informatics, there have been concerns with reuse of electronic health data for research, including potential bias from incorrect or incomplete outcome ascertainment. In this tutorial, we provide a concise review of predictive value–based quantitative bias analysis (QBA), which comprises epidemiologic methods that use estimates of data quality accuracy to quantify the bias caused by outcome misclassification.
Target Audience
Health informaticians and investigators reusing large, electronic health data sources for research.
Scope
When electronic health data are reused for research, validation of outcome case definitions is recommended, and positive predictive values (PPVs) are the most commonly reported measure. Typically, case definitions with high PPVs are considered to be appropriate for use in research. However, in some studies, even small amounts of misclassification can cause bias. In this tutorial, we introduce methods for quantifying this bias that use predictive values as inputs. Using epidemiologic principles and examples, we first describe how multiple factors influence misclassification bias, including outcome misclassification levels, outcome prevalence, and whether outcome misclassification levels are the same or different by exposure. We then review 2 predictive value–based QBA methods and why outcome PPVs should be stratified by exposure for bias assessment. Using simulations, we apply and evaluate the methods in hypothetical electronic health record–based immunization schedule safety studies. By providing an overview of predictive value–based QBA, we hope to bridge the disciplines of health informatics and epidemiology to inform how the impact of data quality issues can be quantified in research using electronic health data sources.
Keywords: electronic health records, outcome assessment, bias, medical informatics
INTRODUCTION
Large electronic health data sources such as electronic health record (EHR) and claims databases are increasingly relied on for medical research.1–3 In health informatics, there have been concerns with the accuracy of electronic health data that is reused for research purposes,4,5 including potential bias that may arise from incorrect and incomplete ascertainment of clinical outcomes.6 Epidemiologists have also recognized such data accuracy issues can lead to outcome misclassification, which is as a major threat to study validity.3,7,8 Outcome misclassification occurs when a case definition does not correctly identify the outcome of interest in the electronic health data source. Diagnosis codes, procedure codes, laboratory results, and other electronic data indicators may be used in an outcome case definition,8 which are also called phenotypes.9
Outcome validation through review of medical provider notes, patient or provider questionnaires or other methods has been encouraged in research using electronic health data sources.10–12 In small studies, validation of outcome status for all individuals may be feasible. More commonly, studies using electronic health data sources are large, including thousands or hundreds of thousands of individuals, and validation of outcome status for all individuals is not a practical option.6 Instead, conducting an internal validation on a sample of individuals or using case definitions that have been previously validated elsewhere are recommended practices.11–13 Several large systematic reviews have summarized results from validation studies of outcomes identified in electronic health data sources. These reviews have found a wide range of misclassification levels across clinical outcomes and data sources.4,9,14–16 A recent review of the accuracy of clinical outcomes in primary care records reported sensitivity levels from 17% to 100%, specificity levels from 67% to 100%, negative predictive values (NPVs) from 51% to 100%, and positive predictive values (PPVs) from 12% to 100%.9 Of the 66 validation studies reporting outcome PPVs, 94% reported PPVs <100%, indicating evidence of false positive outcomes in the data source.9
PPVs are the most frequently reported measure of outcome misclassification from electronic health data sources.9,17 A common approach to estimating a PPV involves applying the outcome case definition to the electronic health data source, reviewing clinical provider notes from a sample of individuals who meet the outcome case definition, and distinguishing true positive outcomes from false positive outcomes. A PPV is estimated as the percentage of outcomes that met the case definition that are true positives. Case definitions with high levels of PPVs have been suggested to be fit for use in research.6,18 However, previous epidemiological research has found that, in some cases, even small amounts of misclassification can cause “profound” bias in research studies.19
When reusing EHR data for clinical research, health informaticians have identified the need to incorporate data quality evaluation approaches used in other disciplines and to integrate statistical methods for assessing the impact of data quality issues.5 In this tutorial, our objective is to provide a concise review of methods from the discipline of epidemiology for quantifying the bias caused by outcome misclassification. We introduce quantitative bias analysis (QBA), a field of epidemiologic methods in which estimates of data accuracy are used to quantify the bias of an exposure-outcome association caused by outcome misclassification.20,21 To date, there has been minimal use of QBA in research,21,22 particularly in electronic health data–based studies. One reason for their low usage is a lack of knowledge of these methods among researchers.21 Also, traditional QBA involves using sensitivity and specificity estimates as inputs. In studies using electronic health data, PPVs are often the only measure of outcome validity that researchers can estimate. Therefore, in this article, we focus on QBA methods that rely solely on predictive values.
In this tutorial, we first review terminology used in epidemiology to describe outcome misclassification, when outcome misclassification causes bias of an exposure-outcome association, and why overall PPVs do not always adequately reflect this bias. We then review 2 QBA methods using predictive values20,23 and use simulations to demonstrate the application and effectiveness of these methods. The tutorial is concluded with a discussion of the strengths and limitations of these methods, and on extensions of QBA that could be used in electronic health data–based research.
One motivation for this work was to review QBA for use in a field of research we work in, immunization schedule safety research using EHR data. We previously published original research in which, in simulations of immunization schedule safety studies with misclassified outcomes, we found that overall outcome PPV estimates did not always reflect the bias caused by misclassification. We also found that traditional methods of QBA using sensitivity and specificity measures as inputs were effective in bias correction.24 In contrast, in this tutorial we review distinct QBA methods that use predictive values as inputs. These predictive value–based QBA methods are not as well known as traditional QBA methods using sensitivity and specificity estimates. However, these predictive value–based QBA methods are more pertinent to studies in which electronic health data are being reused for research purposes, as the PPV is the most accessible estimate to researchers using these data sources. While our simulations are modeled on EHR-based immunization schedule safety studies, the predictive value–based QBA methods examined in this tutorial can be broadly applied in electronic health data–based research.
OUTCOME MISCLASSIFICATION BIAS
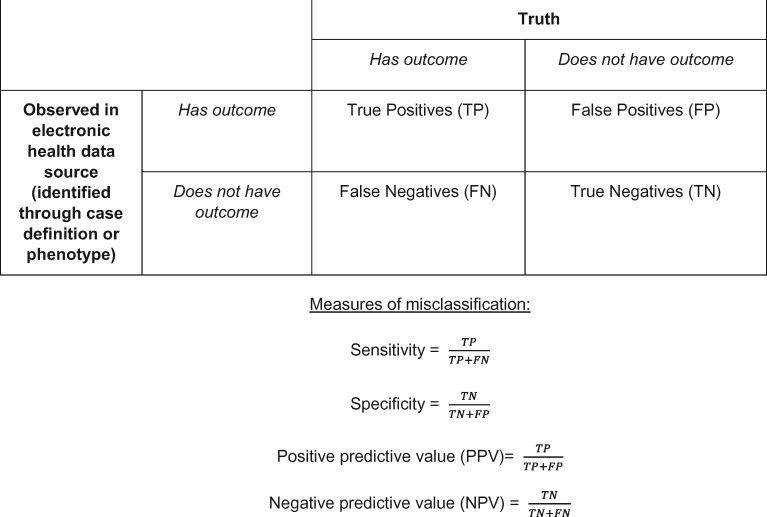
Misclassification is ubiquitous in electronic health data sources, and there are many reasons misclassification occurs when electronic health data are reused for research. Outcome false positives can occur when the diagnostic or procedural codes used do not reflect the true medical issue or when a clinician applies a code to a patient’s medical record but later rules out the condition.8 Outcome false negatives can occur when patients do not seek medical treatment for clinical conditions, or seek care outside of the medical institutions contributing data to the study.8 Applying an incorrect code to a patient’s record (ie, miscoding) can lead to both false positives and false negatives. In health informatics, the data quality dimensions of correctness and completeness have been assessed comparably to PPV and sensitivity (Box 1).4,5
Box 1.
Epidemiological framework for outcome misclassification in electronic health data sources.
The magnitude and direction of bias of an exposure-outcome association caused by outcome misclassification is influenced by multiple factors.25 One factor is the level of misclassification, traditionally measured by sensitivity and specificity. However, the magnitude of bias is also influenced by the prevalence of the outcome in the study population. In general, the magnitude of bias is most affected by false positives in a data source, and bias becomes larger the more rare an outcome is. The direction of bias is impacted by whether misclassification is the same or different by exposure group. In epidemiology, the terms “nondifferential” and “differential” are used to describe whether outcome sensitivity and specificity are the same or different by exposure. If outcome specificity levels are the same across a binary exposure, then a risk ratio is diluted by an equal rate of false positives among exposed and unexposed persons, and bias toward the null typically occurs. In contrast, a risk ratio is not biased by nondifferential outcome sensitivity; however, other exposure-outcome association measures, such as a risk difference, can be biased. When outcome sensitivity or specificity is differential by exposure, under- or overestimation of a true effect can occur.26
PPVs <100% indicate that specificity is also <100% and that outcome false positives are present in the data source. In Table 1, we provide examples to demonstrate the limitations of relying on overall PPVs to assess the magnitude or direction of outcome misclassification bias. Examples 1a, 1b, and 1c show 3 hypothetical cohort studies from large data sources. Each example study includes 10 000 exposed and 400 000 unexposed individuals, and a baseline outcome prevalence of 2.5%. Across the 3 examples, the true relative risk (RR) and outcome sensitivity and specificity by exposure differ, but the observed RR with misclassification is the same (RRobserved , 0.87), and the overall outcome PPV is 93%-94%. Despite having high overall outcome PPVs, in example 1a there is negligible bias, in example 1b misclassification bias would lead to an inaccurate conclusion as to the magnitude of the exposure-outcome association, and in example 1c misclassification bias would cause type I error. Without knowing the underlying nature of the misclassification, with a calculated RR of 0.87 and an overall PPV of 93%-94%, the reported results could be unbiased (example 1a), underestimate the true effect (example 1b), or report an effect that does not truly exist (example 1c). Across all examples, sensitivity and specificity levels are high and in line with levels previously reported in validation studies. However, in examples 1b and 1c, the varying direction of bias is driven by differential outcome sensitivity and specificity. In studies relying on electronic health data, differential outcome misclassification may occur for several reasons. People have varying propensity to seek care for medical conditions or may have chosen to seek care outside the health system from which the electronic health data were collected. If such care-seeking behavior is also associated with exposure, then differential outcome sensitivity would occur. For example, differential outcome sensitivity is a concern in immunization schedule safety research, as children who are undervaccinated or whose parents choose alternative immunization schedules have lower rates of healthcare utilization than do children vaccinated per the U.S. recommended immunization schedule.27,28 Moreover, differential outcome misclassification can occur due to chance alone, and even small differences in outcome misclassification, particularly in outcome specificity, can lead to varying magnitudes and directions of bias.29
Table 1.
Examples showing that an overall outcome PPV may not be indicative of the presence, magnitude or direction of outcome misclassification bias
| Example | True RR and exposure-outcome counts, without misclassification | Levels of outcome misclassification | Observed RR and exposure-outcome counts, with misclassification | Observed outcome PPVs and consequence of misclassification | ||||
|---|---|---|---|---|---|---|---|---|
| 1a | True RR: 0.86 (95% CI, 0.75-0.98) |
|
Observed RR: 0.87 (95% CI, 0.76-0.99) |
|
||||
| With outcome | Without outcome | |||||||
| With outcome | Without outcome | Exposed | 219 | 9781 | ||||
| Unexposed | 10 085 | 389 915 | ||||||
| Exposed | 215 | 9785 | ||||||
| Unexposed | 10 000 | 390 000 | ||||||
| 1b | True RR: 0.70 (95% CI, 0.60-0.81) |
|
Observed RR: 0.87 (95% CI, 0.76-0.99) |
|
||||
| With outcome | Without outcome | |||||||
| With outcome | Without outcome | |||||||
| Exposed | 175 | 9825 | ||||||
| Exposed | 210 | 9790 | ||||||
| Unexposed | 10 000 | 390 000 | ||||||
| Unexposed | 9702 | 390 298 | ||||||
| 1c | True RR: 1.00 (95% CI, 0.88-1.13) |
|
Observed RR: 0.87 (95% CI, 0.76-0.99) |
|
||||
| With outcome | Without outcome | With outcome | Without outcome | |||||
| Exposed | 223 | 9777 | ||||||
| Exposed | 250 | 9750 | ||||||
| Unexposed | 10 241 | 389 759 | ||||||
| Unexposed | 10 000 | 390 000 | ||||||
The data are from a hypothetical cohort study of 10 000 exposed individuals, 400 000 unexposed individuals, and a baseline outcome prevalence of 2.5%.
CI, confidence interval; PPV0: outcome positive predictive value among unexposed; PPV1: outcome positive predictive value among exposed; RR: relative risk; SN0: sensitivity among unexposed; SN1: sensitivity among exposed; SP1: specificity among exposed; SP0: specificity among unexposed; PPV: overall outcome positive predictive value;.
QBA USING PREDICTIVE VALUES
Given information about the extent of outcome misclassification, QBA methods can be used to assess how far an observed effect is from the true effect in a research study.20 Traditional QBA methods for outcome misclassification rely on sensitivity and specificity measures as inputs, called bias parameters.20 As described in the previous section, these measures of outcome misclassification are usually not accessible to researchers using electronic health data sources, and predictive values are more commonly reported. Here, we describe 2 published QBA methods for outcome misclassification that use predictive values.20,23
In the textbook Applying Quantitative Bias Analysis to Epidemiologic Data, Lash et al20 provide a bias analysis method for exposure misclassification using PPVs and NPVs. In the top half of Table 2, a similar approach for outcome misclassification is demonstrated. In Table 2, the cells A, B, C, and D denote observed exposure-outcome counts. Measures of association are calculated from these counts; formula 1 shows calculation of a relative risk. Let PPV1 and PPV0 denote outcome PPVs among exposed and unexposed groups, respectively, and NPV1 and NPV0 denote outcome NPVs among exposed and unexposed groups, respectively. The bottom half of Table 2 shows the calculations for the corrected cell sizes for each exposure-outcome combination (denoted as A*, B*, C*, and D*), and a QBA-corrected relative risk can then be calculated (formula 2).
Table 2.
Quantitative bias analysis for outcome misclassification using positive predictive values and negative predictive values
| Exposure-outcome cell counts observed in electronic health data source, not accounting for outcome misclassification | ||
| Observed to have the outcome in data source | Observed to not have the outcome in data source | |
| Exposed | ||
| Unexposed | ||
| Formula 1: Calculation of relative risk observed in electronic data in an analysis of electronic data, without consideration of outcome misclassification | ||
| RR(Observed) = | ||
| Corrected distribution of outcomes by exposure using positive and negative predictive values 20 | ||
| With Outcome | Without Outcome | |
| Exposed | (1-NPV1) | (1-NPV1)) |
| Unexposed | (1-NPV0) | (1-NPV0)) |
| Formula 2: Calculation of corrected relative risk following corrected distribution of outcomes by exposure | ||
| RR(Corrected) = | ||
NPV0: negative predictive value among unexposed; NPV1: negative predictive value among exposed; PPV0: positive predictive value among unexposed; PPV1: positive predictive value among exposed; RR: relative risk.
A limitation of this approach is that NPVs may sometimes be difficult to estimate from electronic health data. To estimate an NPV, one would need to sample from individuals who did not have the outcome recorded in the data source, and then determine which individuals truly did have the outcome. For some clinical conditions, it is likely that hundreds of observed nonoutcomes would need to be reviewed before any false negatives are identified. Moreover, standard approaches for estimating PPVs such as chart reviews may not be effective for ascertaining false negatives due to outside use of health services.
In 1993, Brenner and Gefeller23 demonstrated a QBA method that only requires outcome PPV estimates by exposure. They showed that if the observed RR, PPV1, and PPV0 are known, and sensitivity is nondifferential to exposure, then a corrected RR can be calculated using only PPVs (formula 3).23 This method is a special case of the method by Lash et al,20 but the requirement of nondifferential outcome sensitivity is a limitation. Depending on the study, outcome sensitivity may be nondifferential or differential to exposure.
Formula 3: Calculation of corrected relative risk using positive predictive values stratified by exposure, assumingnondifferential sensitivity.23
Both the method by Lash et al20 and the method by Brenner and Gefeller23 require that predictive values are stratified by exposure. This is because predictive values are a function of sensitivity, specificity, and prevalence (formulas 4 and 5).30 If any of these factors differ by exposure, then the outcome PPV will differ by exposure. Even if sensitivity and specificity are equal across exposure groups, outcome PPVs will differ if a true exposure-outcome association exists, since outcome prevalence will differ by exposure. The true outcome prevalence will be higher in the exposure group with the higher risk, and thus the outcome PPV will also be higher in that group.
Formulas 4 and 5: Bayes’rulefor relating sensitivity, specificity, and prevalence to the positive and negative predictive values.30
SIMULATIONS OF QBA USING PREDICTIVE VALUES
Simulation methods
To demonstrate the application and effectiveness of predictive value–based QBA methods, we conducted simulations of EHR-based cohort studies of early childhood immunization schedule safety. A 2013 Institute of Medicine report called for observational studies on risks of chronic outcomes in children whose parents choose alternative immunization schedules for them as compared with children whose parents follow the U.S. recommended immunization schedule.31 The U.S. Centers for Disease Control and Prevention’s Vaccine Safety Datalink (VSD), which coordinates a linked database from health plans for vaccine research, is conducting such studies.28,32 However, validation studies for several outcomes of interest, such as asthma, chronic urticaria, and diabetes,33–35 indicate that some misclassification of these outcomes is likely.
We nested the simulations within a cohort of children born 2002-2012 from 2 VSD sites, Kaiser Permanente Colorado and Kaiser Permanente Northern California. Both health plans’ Institutional Review Boards approved this study. The cohort included 257 010 children continuously enrolled in their health plan from birth to their second birthday, which is when children are recommended to receive up to 28 vaccine doses per the U.S. recommended immunization schedule.36 Follow-up time for these children was from their second birthday to the first occurrence of either disenrollment from the health plan or their eighth birthday. Actual birthdates and follow-up time were used from this cohort; all other data were simulated.
Details of our simulation methodology to study misclassification bias in immunization schedule safety research have been published elsewhere.24 Briefly, we used probabilistic modeling to simulate that 2.4% of the cohort were vaccinated per alternative immunization schedules (exposed group) and 60.6% received all vaccines on time per the U.S. recommended immunization schedule (unexposed group). The remaining 37.0% are assumed to be undervaccinated by some other pattern (eg, completely unvaccinated, missing some vaccines); these patterns are not considered in our simulations. We simulated a baseline outcome rate of 1000 events/100 000 person-years between 2-8 years of age and RRs of 2.00, 1.00, and 0.50 across 1000 replications. These simulated RRs represent the true exposure-outcome association, without misclassification bias.
We then applied imperfect outcome specificity ranging from 90% to 99% and sensitivity ranging from 50% to 95%, based on overall outcome misclassification levels previously measured in EHR or claims databases.33–35,37,38 We simulated hypothetical levels of both nondifferential and differential misclassification, with both small and large differences in specificity sensitivity levels. In simulations of nondifferential misclassification, specificity and sensitivity were applied without regard to exposure. In simulations of differential misclassification, specificity and sensitivity were applied separately by exposure group. We simulated scenarios of lower sensitivity among children on alternative immunization schedules, as parents of these children express greater distrust in the traditional medical system and are more likely to seek outside care.39 We simulated scenarios of both higher and lower specificity in the exposed group as compared with the unexposed. Sensitivity and specificity were applied to simulated data as probabilities, and Bernoulli trials determined which children had an outcome false positive or false negative status, representing outcome misclassification.
For each combination of sensitivity and specificity tested, we reported the mean outcome PPV and NPV overall, PPV1 and NPV1, and PPV0 and NPV0 across the 1000 replications. We reported the median RRs and 95% simulation intervals (SIs) from our simulated analyses of electronic health data when misclassification is present. The 95% SI represents the 2.5th and 97.5th percentiles of the RR generated across the 1000 replications of a simulation.40 We then applied the QBA methods shown in formulas 2 and 3 to the simulated data, and report the median RR and 95% SI from these bias correction methods. While actual follow-up time in the VSD cohort was used to simulate probability of the outcome, our RR calculations used counts of people as the denominators for each exposure group (as shown in formulas 1 and 2).
For simulations in which true RR = 1, we reported type I error as the percent of simulated replications where the null hypothesis was rejected at alpha = .05. Type I error is a function of both systematic error (exhibited as a biased RR estimate) and random error, as greater precision in RR estimation, usually from larger sample sizes, will lead to greater probability in rejecting the null hypothesis with a biased estimate.
All analyses were conducted in SAS version 9.4 (SAS Institute, Cary, NC).
Simulation results
Across replications, an average of 6117 children were simulated to be exposed to alternative immunization schedules and 155 731 children were simulated to the fully vaccinated unexposed group. There was an average of 8207 simulated outcomes in the unexposed group, equating to a 5% baseline outcome prevalence. With nondifferential outcome misclassification and simulated RR = 2.00, the outcome PPV among the exposed group (PPV1) was higher than the PPV among the unexposed group (PPV0) due to higher outcome prevalence among exposed (Table 3). In contrast, when simulated RR = 0.50 and outcome misclassification is nondifferential to exposure, PPV1 is lower than PPV0 (Table 3).
Table 3:
Median relative risk and 95% SI from electronic data analysis with outcome misclassification present and following QBA using predictive values in a simulated immunization schedule cohort study
| Simulation Scenario | Simulated levels of outcome misclassification | Mean overall outcome PPV PPV1, PPV0 | Mean overall outcome NPV NPV1, NPV0 | Median RR(95% SI) |
||
|---|---|---|---|---|---|---|
| From analysis of electronic data with outcome misclassification present | Following QBA using PPV1, PPV0, NPV1, NPV0 | Following QBA using PPV1, PPV0, and assuming nondifferential sensitivity | ||||
| Formula 1 | Formula 2 | Formula 3 | ||||
| Simulated RR = 2.00 | ||||||
| Nondifferential misclassification | ||||||
| 1 | SN = 95%, SP = 99% | 84.6% 91.8%, 84.1% | 99.7% 99.4%, 99.7% | 1.83 (1.70 - 1.98) | 2.00 (1.86 - 2.16) | 2.00 (1.85 - 2.17) |
| 2 | SN = 90%, SP = 98% | 72.2% 84.2%, 71.4% | 99.4% 98.8%, 99.4% | 1.70 (1.57-1.83) | 2.00 (1.86 - 2.16) | 2.00 (1.84-2.16) |
| Differential specificity | ||||||
| 3 | SN1 = 95%; SN0 = 95% | 80.6% | 99.7% | 3.19 | 2.00 | 2.00 |
| SP1 = 90%; SP0 = 99% | 52.8%, 84.1% | 99.3%, 99.7% | (3.01-3.36) | (1.86-2.16) | (1.85-2.16) | |
| 4 | SN1 = 95%; SN0 = 95% | 73.7% | 99.7% | 1.58 | 2.00 | 2.00 |
| SP1 = 99%; SP0 = 98% | 91.8%, 72.6% | 99.4%, 99.7% | (1.46-1.70) | (1.86-2.16) | (1.85-2.16) | |
| Differential sensitivity | ||||||
| 5 | SN1 = 70%; SN0 = 95% | 84.4% | 99.6% | 1.39 | 2.00 | 1.47 |
| SP1 = 99%; SP0 = 99% | 89.2%, 84.1% | 96.6%, 99.7% | (1.27-1.51) | (1.86-2.16) | (1.34-1.61) | |
| 6 | SN1 = 50%; SN0 = 95% | 84.2% | 99.5% | 1.04 | 2.00 | 1.06 |
| SP1 = 99%; SP0 = 99% | 85.5%, 84.1% | 94.4%, 99.7% | (0.94-1.14) | (1.86-2.16) | (0.95-1.17) | |
| Differential specificity and sensitivity | ||||||
| 7 | SN1 = 70%; SN0 = 95% | 73.3% | 99.6% | 1.20 | 2.00 | 1.47 |
| SP1 = 99%; SP0 = 98% | 89.1%, 72.6% | 96.5%, 99.7% | (1.10-1.30) | (1.86-2.16) | (1.34-1.61) | |
| 8 | SN1 = 90%; SN0 = 95% | 80.6% | 99.7% | 3.10 | 2.00 | 1.89 |
| SP1 = 90%; SP0 = 99% | 51.5%, 84.1% | 98.7%, 99.7% | (2.93-3.27) | (1.86-2.16) | (1.74-2.05) | |
| Simulated RR = 0.50 | ||||||
| Nondifferential misclassification | ||||||
| 1 | SN = 95%, SP = 99% | 83.8% 72.1%, 84.1% | 99.7% 99.9%, 99.7% | 0.58 (0.51-0.66) | 0.50 (0.43-0.58) | 0.50 (0.43-0.58) |
| 2 | SN = 90%, SP = 98% | 71.1% 55.0%, 71.5% | 99.5% 99.7%, 99.4% | 0.65 (0.58-0.73) | 0.50 (0.43-0.58) | 0.50 (0.42-0.58) |
| Differential specificity | ||||||
| 3 | SN1 = 95%; SN0 = 95% | 79.4% | 99.7% | 2.05 | 0.50 | 0.50 |
| SP1 = 90%; SP0 = 99% | 20.5%, 84.1% | 99.9%, 99.7% | (1.92-2.20) | (0.43-0.58) | (0.42-0.58) | |
| 4 | SN1 = 95%; SN0 = 95% | 72.5% | 99.7% | 0.50 | 0.50 | 0.50 |
| SP1 = 99%; SP0 = 98% | 72.1%, 72.5% | 99.9%, 99.7% | (0.44-0.58) | (0.43-0.58) | (0.42-0.58) | |
| Differential sensitivity | ||||||
| 5 | SN1 = 70%; SN0 = 95% | 83.8% | 99.7% | 0.47 | 0.50 | 0.37 |
| SP1 = 99%; SP0 = 99% | 65.5%, 84.1% | 99.2%, 99.7% | (0.40-0.55) | (0.43-0.58) | (0.30-0.44) | |
| 6 | SN1 = 50%; SN0 = 95% | 83.7% | 99.7% | 0.39 | 0.50 | 0.26 |
| SP1 = 99%; SP0 = 99% | 57.5%, 84.1% | 98.7%, 99.7% | (0.32-0.45) | (0.43-0.58) | (0.21-0.32) | |
| Differential specificity and sensitivity | ||||||
| 7 | SN1 = 70%; SN0 = 95% | 72.4% | 99.7% | 0.41 | 0.50 | 0.37 |
| SP1 = 99%; SP0 = 98% | 65.5%, 72.5% | 99.2%, 99.7% | (0.35-0.47) | (0.43-0.58) | (0.31-0.44) | |
| 8 | SN1 = 90%; SN0 = 95% | 79.3% | 99.7% | 2.03 | 0.50 | 0.47 |
| SP1 = 90%; SP0 = 99% | 19.7%, 84.1% | 99.7%, 99.7% | (1.90-2.17) | (0.43-0.58) | (0.40-0.55) | |
The 95% SI represents the 2.5th and 97.5th percentiles of the RR from across 1000 replications for each simulated scenario. When the simulated relative risk was 2.00, the 95% simulation interval before applying misclassification was 1.86-2.16. When the simulated relative risk was 0.50, the 95% SI before applying misclassification was 0.43-0.58.
PPV0: positive predictive value among unexposed; PPV1: positive predictive value among exposed; QBA: quantitative bias analysis; SI: simulation interval; SN: overall outcome sensitivity; SN0: outcome sensitivity among unexposed; SN1: outcome sensitivity among exposed; SP: overall outcome specificity; SP0: outcome specificity among unexposed; SP1: outcome specificity among exposed.
In the 8 misclassification scenarios we simulated, the median RRs observed with analysis of electronic health data as is, ignoring misclassification bias, ranged from 1.04 (95% SI, 0.94-1.14) to 3.19 (95% SI, 3.01-3.36) when true RR = 2.00 (Table 3) and from 0.39 (95% SI, 0.32-0.45) to 2.05 (95% SI, 1.92-2.20) when true RR = 0.50 (Table 3). Overall mean outcome PPVs ranged from 71.1% to 84.6% (Figure 1). The QBA method with PPVs and NPVs stratified by exposure (formula 2) resulted in correction of misclassification bias in all simulations. Applying PPVs stratified by exposure and assuming nondifferential sensitivity (formula 3) was also effective, except when outcome sensitivity was simulated to be differential (Tables 3 and 4). In some cases, applying this method when outcome sensitivity was differential by exposure resulted in more biased estimates than did analysis of electronic data, ignoring misclassification bias. For example, when true RR was simulated at 0.50, we observed an RR of 0.39 (95% SI, 0.32-0.45) when sensitivity among exposed was 50%, sensitivity among unexposed was 95%, and specificity in both groups was 99%. After applying the ratio of PPV1 to PPV0 formula (formula 3), the RR was 0.26 (95% SI, 0.21-0.32) (Table 3).
Figure 1.

Overall outcome positive predictive value (PPV) and observed relative risk (RR), without bias analysis, from 8 simulated scenarios of outcome misclassification. (1) nondifferential misclassification: overall outcome sensitivity (SN) = 95%, overall outcome specificity (SP) = 99%; (2) nondifferential misclassification: SN = 90%, SP = 98%; (3) differential specificity: outcome sensitivity among exposed (SN1) = 95%, outcome specificity among unexposed (SN0) = 95%, outcome specificity among exposed (SP1) = 90%, outcome sensitivity among unexposed (SP0) = 99%; (4) differential specificity: SN1 = 95%, SN0 = 95%, SP1 = 99%, SP0 = 98%; (5) differential sensitivity: SN1 = 70%, SN0 = 95%, SP1 = 99%; SP0 = 99%; (6) differential sensitivity: SN1 = 50%, SN0 = 95%, SP1 = 99%; SP0 = 99%; (7) differential specificity and sensitivity: SN1 = 70%; SN0 = 95%, SP1 = 99%; SP0 = 98%; and (8) differential specificity and sensitivity: SN1 = 90%; SN0 = 95%, SP1 = 90%; SP0 = 99%.
Table 4.
Median RR and 95% SI from electronic data analysis with outcome misclassification present and following QBA using predictive values in a simulated immunization schedule cohort study, with simulated RR = 1.00
| Simulation Scenario | Simulated levels of outcome misclassification | Mean overall outcome PPV PPV1, PPV0 | Mean overall outcome NPV NPV1, NPV0 | Median RR (95% SI) |
||
|---|---|---|---|---|---|---|
| From analysis of electronic data with outcome misclassification present |
Following QBA using PPV1, PPV0, NPV1, NPV0 |
Following QBA using PPV1, PPV0, and assuming nondifferential sensitivity |
||||
| Formula 1 | Formula 2 | Formula 3 | ||||
| Nondifferential misclassification | ||||||
| 1 | SN = 95%, SP = 99% | 84.1% 84.1%, 84.1% | 99.7% 99.7%, 99.7% | 1.00 (0.90-1.11) 5.0% type I error | 1.00 (0.90-1.11) | 1.00 (0.90-1.12) |
| 2 | SN = 90%, SP = 98% | 71.5% 71.4%, 71.5% | 99.4% 99.4%, 99.4% | 1.00 (0.90-1.11) 4.6% type I error | 1.00 (0.90-1.11) | 1.00 (0.88-1.11) |
| Differential specificity | ||||||
| 3 | SN1 = 95%; SN0 = 95% | 79.8% | 99.7% | 2.43 | 1.00 | 1.00 |
| SP1 = 90%; SP0 = 99% | 34.6%, 84.1% | 99.7%, 99.7% | (2.28-2.59) 100% type I error | (0.90-1.11) | (0.89-1.11) | |
| 4 | SN1 = 95%; SN0 = 95% | 72.9% | 99.7% | 0.86 | 1.00 | 1.00 |
| SP1 = 99%; SP0 = 98% | 84.1%, 72.5% | 99.7%, 99.7% | (0.78-0.95) 80.7% type I error | (0.90-1.11) | (0.89-1.11) | |
| Differential sensitivity | ||||||
| 5 | SN1 = 70%; SN0 = 95% | 84.0% | 99.7% | 0.78 | 1.00 | 0.74 |
| SP1 = 99%; SP0 = 99% | 79.4%, 84.1% | 98.3%, 99.7% | (0.69-0.87) 99.2% type I error | (0.90-1.11) | (0.64-0.83) | |
| 6 | SN1 = 50%; SN0 = 95% | 83.9% | 99.6% | 0.60 | 1.00 | 0.52 |
| SP1 = 99%; SP0 = 99% | 73.5%, 84.1% | 97.3%, 99.7% | (0.52-0.68) 100% type I error | (0.90-1.11) | (0.44-0.61) | |
| Differential specificity and sensitivity | ||||||
| 7 | SN1 = 70%; SN0 = 95% | 72.7% | 99.7% | 0.67 | 1.00 | 0.73 |
| SP1 = 99%; SP0 = 98% | 79.6%, 72.6% | 98.3%, 99.7% | (0.60-0.75) 100% type I error | (0.90-1.11) | (0.64-0.83) | |
| 8 | SN1 = 90%; SN0 = 95% | 79.7% | 99.7% | 2.38 | 1.00 | 0.95 |
| SP1 = 90%; SP0 = 99% | 33.4%, 84.1% | 99.4%, 99.7% | (2.23-2.55) 100% type I error | (0.90-1.11) | (0.84-1.06) | |
The 95% SI represents the 2.5th and 97.5th percentiles of the RR from across the 1000 replications for each simulated scenario. The 95% SI for the simulated RR of 1.00 before applying any misclassification was 0.90-1.11.
PPV0: positive predictive value among unexposed; PPV1: positive predictive value among exposed; QBA: quantitative bias analysis; SI: simulation interval; SN: overall outcome sensitivity; SN0: outcome sensitivity among unexposed; SN1: outcome sensitivity among exposed; SP: overall outcome specificity; SP0: outcome specificity among unexposed; SP1: outcome specificity among exposed.
When simulated RR = 1.00, nondifferential outcome misclassification resulted in type I error rates <5%. However, across simulations of differential outcome misclassification, type I error ranged from 80.7% to 100% (Table 4). The 2 methods with stratified outcome PPVs corrected the median biased RR back to 1.00, except when sensitivity was differential to exposure and formula 3, which assumes nondifferential sensitivity, was used.
DISCUSSION
Data quality concerns in electronic health data–based research have garnered considerable attention, with calls for use of validated algorithms,9,12,13 increased transparency in data quality reporting,9,13 and guidelines for the conduct and reporting of validation studies.9,10 While these efforts affirm the importance of assessing data quality, there has been less emphasis on how to quantify and correct the bias caused when outcomes are misclassified in studies that reuse electronic health data. In this tutorial, we introduced epidemiologic methods for quantifying this bias, focusing on QBA methods that are likely to be most accessible in electronic health data–based research: methods using predictive values.
To date, results from validation studies have been considered in a largely qualitative manner, with high levels of sensitivity, specificity, or predictive values being interpreted as valid and acceptable for use. However, multiple factors influence how outcome misclassification biases an exposure-outcome association, and, in some cases, small amounts of misclassification can cause large amounts of bias.19,25,29 Furthermore, to apply the QBA methods reviewed in this tutorial, overall outcome PPVs cannot be used; PPVs should be estimated by exposure. Of the 2 QBA methods we reviewed, the method by Brenner and Gefeller23 is the most accessible to researchers using electronic health data, since it relies only on PPVs. However, a limitation is the assumption of nondifferential sensitivity. In their paper, Brenner and Gefeller23 demonstrated that if sensitivity is in fact differential by exposure group, then the “corrected” RR will still be biased by a factor of . Therefore, it is recommended that if differential sensitivity is known or suspected, then the impact of such differential sensitivity be tested by including this additional bias factor in bias analyses.
Bias analysis may not be necessary for studies that are descriptive or exploratory in nature, or that do not address causal links between exposures and outcomes. However, quantifying bias is important for studies assessing causal associations, or when policy decisions may be based on the study’s results.21 If results from an electronic health data–based study will be used for either of these purposes, then bias analysis is recommended when possible. Unfortunately, applying QBA may be desirable but not feasible. The methods presented here are best suited for studies where PPVs can be estimated by exposure from an internal validation study. If such internal validation is not possible, but an overall outcome PPV has been previously estimated in a comparable data source, then an approach could be used whereby the overall PPV is used to estimate the number of false positive outcomes in the present dataset. Then, 2 bias analyses could be conducted: one in which all outcome false positives are assumed to be in the exposed group and one in which all outcome false positives are assumed to be in the unexposed group. This approach would show the 2 extremes of the potential impact of false positives. In scenarios in which the PPV is relatively high and the outcome is relatively common, such an analysis may provide reassurance that the results observed are robust against imperfect outcome specificity in the electronic health data source.
This tutorial has several limitations. We used simulations to evaluate the application and effectiveness of QBA methods that use PPVs as bias parameters. By establishing different levels of nondifferential and differential misclassification, we were able to evaluate these QBA methods across multiple scenarios. However, while the overall levels of misclassification used in our simulations were informed by previous observations in electronic health data, there has been minimal empirical research measuring differential misclassification; therefore, our simulated levels of differential misclassification were hypothetical. Also, we only focused on simple QBA applied to 2x2 tables with exposure-outcome counts or directly to RR estimates. However, extensions of simple QBA should be considered in research using electronic health data sources. For example, multiple bias analysis allows consideration of co-occurring sources of bias, including exposure misclassification, covariate misclassification, and unmeasured confounding.20 Probabilistic bias methods, whereby a range of bias parameters are considered, are especially promising for electronic health data–based research, as additional uncertainty in estimation of sensitivity, specificity, or predictive values can be incorporated.20,22 While epidemiologic studies using electronic health data sources are ideal candidates for bias analysis because sample sizes are typically large and random error is minimized, Bayesian methods that incorporate both systematic and random error should be considered.20,41 QBA applied to individual-level data merit broader consideration, including methods that treat outcome misclassification as a missing data problem.42 Finally, multiple strategies for bias analysis in multivariable modeling are available, including calculating bias parameters by stratum or using propensity scores to summarize information on the covariates in the bias analysis.43
CONCLUSION
Large data sources such as EHR and claims data have become cornerstones of modern medical and public health research. By providing an overview of methods for quantifying bias using predictive values, we hope to encourage broader consideration of QBA in studies where electronic health records and claims data are being reused for research purposes.
FUNDING
This work was supported by National Institutes of Health, National Institute of Allergy and Infectious Diseases grant number R01AI107721 (MK).
CONTRIBUTIONS
SRN contributed to the conception and design of this work, acquisition, analysis and interpretation of data, drafting and critically revising the work. SX, MK, MFD, BF, and JMG contributed to the conception and design of this work, acquisition and interpretation of data, and critically revising the work. All authors approve of the final version and agree to be accountable for all aspects of the work.
Conflict of interest statement
None declared.
REFERENCES
- 1. Schneeweiss S, Avorn J.. A review of uses of health care utilization databases for epidemiologic research on therapeutics. J Clin Epidemiol 2005; 584: 323–37. [DOI] [PubMed] [Google Scholar]
- 2. Casey JA, Schwartz BS, Stewart WF, Adler NE.. Using electronic health records for population health research: a review of methods and applications. Annu Rev Public Health 2016; 371: 61–81. [DOI] [PMC free article] [PubMed] [Google Scholar]
- 3. Mooney SJ, Westreich DJ, El-Sayed AM.. Epidemiology in the era of big data. Epidemiology 2015; 263: 390.. [DOI] [PMC free article] [PubMed] [Google Scholar]
- 4. Hogan WR, Wagner MM.. Accuracy of data in computer-based patient records. J Am Med Inform Assoc 1997; 45: 342–55. [DOI] [PMC free article] [PubMed] [Google Scholar]
- 5. Weiskopf NG, Weng C.. Methods and dimensions of electronic health record data quality assessment: enabling reuse for clinical research. J Am Med Inform Assoc 2013; 201: 144–51. [DOI] [PMC free article] [PubMed] [Google Scholar]
- 6. Hripcsak G, Albers DJ.. Next-generation phenotyping of electronic health records. J Am Med Inform Assoc 2013; 201: 117–21. [DOI] [PMC free article] [PubMed] [Google Scholar]
- 7. Funk MJ, Landi SN.. Misclassification in administrative claims data: quantifying the impact on treatment effect estimates. Curr Epidemiol Rep 2014; 14: 175–85. [DOI] [PMC free article] [PubMed] [Google Scholar]
- 8. Chubak J, Pocobelli G, Weiss NS.. Tradeoffs between accuracy measures for electronic health care data algorithms. J Clin Epidemiol 2012; 653: 343–9.e342. [DOI] [PMC free article] [PubMed] [Google Scholar]
- 9. McBrien KA, Souri S, Symonds NE.. Identification of validated case definitions for medical conditions used in primary care electronic medical record databases: a systematic review. J Am Med Inform Assoc 2018; 2511: 1567–78. [DOI] [PMC free article] [PubMed] [Google Scholar]
- 10. Benchimol EI, Manuel DG, To T, Griffiths AM, Rabeneck L, Guttmann A.. Development and use of reporting guidelines for assessing the quality of validation studies of health administrative data. J Clin Epidemiol 2011; 648: 821–9. [DOI] [PubMed] [Google Scholar]
- 11. Richesson RL, Smerek MM, Cameron CB.. A framework to support the sharing and reuse of computable phenotype definitions across health care delivery and clinical research applications. EGEMS (Wash DC) 2016; 43: 1232.. [DOI] [PMC free article] [PubMed] [Google Scholar]
- 12. Lanes S, Brown JS, Haynes K, Pollack MF, Walker AM.. Identifying health outcomes in healthcare databases. Pharmacoepidemiol Drug Saf 2015; 2410: 1009–16. [DOI] [PubMed] [Google Scholar]
- 13. Kahn MG, Brown JS, Chun AT, et al. Transparent reporting of data quality in distributed data networks. EGEMS (Wash DC )2015; 31: 1052. [DOI] [PMC free article] [PubMed] [Google Scholar]
- 14. Leong A, Dasgupta K, Bernatsky S, Lacaille D, Avina-Zubieta A, Rahme E.. Systematic review and meta-analysis of validation studies on a diabetes case definition from health administrative records. PLoS One 2013; 810: e75256.. [DOI] [PMC free article] [PubMed] [Google Scholar]
- 15. Pace R, Peters T, Rahme E, Dasgupta K.. Validity of health administrative database definitions for hypertension: a systematic review. Can J Cardiol 2017; 338: 1052–9. [DOI] [PubMed] [Google Scholar]
- 16. Nissen F, Quint J, Wilkinson S, Müllerova H, Smeeth L, Douglas IJ.. Validation of asthma recording in electronic health records: a systematic review. Clin Epidemiol 2017; 9: 643–56.. [DOI] [PMC free article] [PubMed] [Google Scholar]
- 17. van Walraven C, Bennett C, Forster AJ.. Administrative database research infrequently used validated diagnostic or procedural codes. J Clin Epidemiol 2011; 6410: 1054–9. [DOI] [PubMed] [Google Scholar]
- 18. Carnahan RM. Mini‐Sentinel's systematic reviews of validated methods for identifying health outcomes using administrative data: summary of findings and suggestions for future research. Pharmacoepidemiol Drug Saf 2012; 21: 90–9. [DOI] [PubMed] [Google Scholar]
- 19. Greenland S. Basic methods for sensitivity analysis of biases. Int J Epidemiol 1996; 256: 1107–16. [PubMed] [Google Scholar]
- 20. Lash TL, Fox MP, Fink AK. Applying Quantitative Bias Analysis to Epidemiologic Data. New York, NY: Springer Science & Business Media; 2011. [Google Scholar]
- 21. Lash TL, Fox MP, MacLehose RF, Maldonado G, McCandless LC, Greenland S.. Good practices for quantitative bias analysis. Int J Epidemiol 2014; 436: 1969–85. [DOI] [PubMed] [Google Scholar]
- 22. Hunnicutt JN, Ulbricht CM, Chrysanthopoulou SA, Lapane KL.. Probabilistic bias analysis in pharmacoepidemiology and comparative effectiveness research: a systematic review. Pharmacoepidemiol Drug Saf 2016; 2512: 1343–53. [DOI] [PMC free article] [PubMed] [Google Scholar]
- 23. Brenner H, Gefeller O.. Use of the positive predictive value to correct for disease misclassification in epidemiologic studies. Am J Epidemiol 1993; 13811: 1007–15. [DOI] [PubMed] [Google Scholar]
- 24. Newcomer SR, Kulldorff M, Xu S, et al. Bias from outcome misclassification in immunization schedule safety research. Pharmacoepidemiol Drug Saf 2018; 272: 221–8. [DOI] [PMC free article] [PubMed] [Google Scholar]
- 25. Copeland KT, Checkoway H, McMichael AJ, Holbrook RH.. Bias due to misclassification in the estimation of relative risk. Am J Epidemiol 1977; 1055: 488–95. [DOI] [PubMed] [Google Scholar]
- 26. Rothman KJ, Greenland S, Lash TL. Modern Epidemiology. 2nd Edition. Philadelphia, PA: Lippincott, Williams & Wilkins; 2008.
- 27. Glanz JM, Newcomer SR, Narwaney KJ, et al. A population-based cohort study of undervaccination in 8 managed care organizations across the United States. JAMA Pediatr 2013; 1673: 274–81. [DOI] [PubMed] [Google Scholar]
- 28. Glanz JM, Newcomer SR, Jackson ML, et al. White paper on studying the safety of the childhood immunization schedule in the Vaccine Safety Datalink. Vaccine 2016; 34: A1–A29. [DOI] [PubMed] [Google Scholar]
- 29. Jurek AM, Greenland S, Maldonado G, Church TR.. Proper interpretation of non-differential misclassification effects: expectations vs observations. Int J Epidemiol 2005; 343: 680–7. [DOI] [PubMed] [Google Scholar]
- 30. Rosner B. Fundamentals of Biostatistics Toronto, Canada: Nelson Education; 2015. [Google Scholar]
- 31. Committee on the Assessment of Studies of Health Outcomes Related to the Recommended Childhood Immunization Schedule, Board on Population Health, Public Health Practice, Institute of Medicine Childhood Immunization Schedule and Safety: Stakeholder Concerns, Scientific Evidence, and Future Studies. Washington, DC: National Academies Press; 2013. [PubMed] [Google Scholar]
- 32. McNeil MM, Gee J, Weintraub ES, et al. The Vaccine Safety Datalink: successes and challenges monitoring vaccine safety. Vaccine 2014; 3242: 5390–8. [DOI] [PMC free article] [PubMed] [Google Scholar]
- 33. Wakefield DB, Cloutier MM.. Modifications to HEDIS and CSTE algorithms improve case recognition of pediatric asthma. Pediatr Pulmonol 2006; 4110: 962–71. [DOI] [PubMed] [Google Scholar]
- 34. Cherepanov D, Raimundo K, Chang E, et al. Validation of an ICD-9–based claims algorithm for identifying patients with chronic idiopathic/spontaneous urticaria. Ann Allergy Asthma Immunol 2015; 1145: 393–8. [DOI] [PubMed] [Google Scholar]
- 35. Lawrence JM, Black MH, Zhang JL, et al. Validation of pediatric diabetes case identification approaches for diagnosed cases by using information in the electronic health records of a large integrated managed health care organization. Am J Epidemiol 2014; 1791: 27–38. [DOI] [PubMed] [Google Scholar]
- 36. Robinson CL, Romero JR, Kempe A, Pellegrini C, Szilagyi P.. Advisory committee on immunization practices recommended immunization schedule for children and adolescents aged 18 years or younger-United States, 2018. MMWR Morb Mortal Wkly Rep 2018; 675: 156–7.. [DOI] [PMC free article] [PubMed] [Google Scholar]
- 37. Saydah SH, Geiss LS, Tierney E, Benjamin SM, Engelgau M, Brancati F.. Review of the performance of methods to identify diabetes cases among vital statistics, administrative, and survey data. Ann Epidemiol 2004; 147: 507–16. [DOI] [PubMed] [Google Scholar]
- 38. Wilchesky M, Tamblyn RM, Huang A.. Validation of diagnostic codes within medical services claims. J Clin Epidemiol 2004; 572: 131–41. [DOI] [PubMed] [Google Scholar]
- 39. Downey L, Tyree PT, Huebner CE, Lafferty WE.. Pediatric vaccination and vaccine-preventable disease acquisition: associations with care by complementary and alternative medicine providers. Matern Child Health J 2010; 146: 922–30. [DOI] [PMC free article] [PubMed] [Google Scholar]
- 40. Johnson CY, Flanders WD, Strickland MJ, Honein MA, Howards PP.. Potential sensitivity of bias analysis results to incorrect assumptions of nondifferential or differential binary exposures misclassification. Epidemiology 2014; 256: 902–9.. [DOI] [PMC free article] [PubMed] [Google Scholar]
- 41. Gustafson P, McCandless L.. Commentary: priors, parameters, and probability a Bayesian perspective on sensitivity analysis. Epidemiology 2014; 256: 910–2. [DOI] [PubMed] [Google Scholar]
- 42. Cole SR, Chu H, Greenland S.. Multiple-imputation for measurement-error correction. Int J Epidemiol 2006; 354: 1074–81. [DOI] [PubMed] [Google Scholar]
- 43. Lash TL, Abrams B, Bodnar LM.. Comparison of bias analysis strategies applied to a large data set. Epidemiology 2014; 254: 576. [DOI] [PMC free article] [PubMed] [Google Scholar]