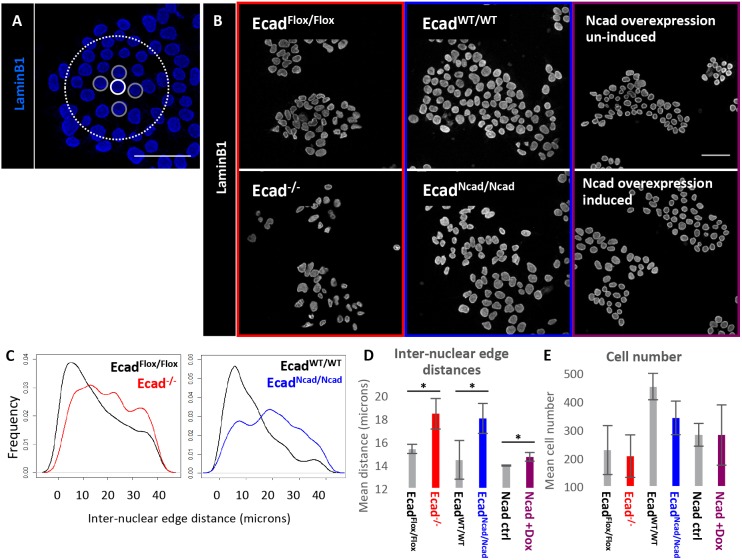
Fig. 3.
Effects of cadherin switching on cellular clustering. (A) Methodology for measuring inter-nuclear edge distances. For each nucleus (white solid line), the nearest neighbours (grey solid line) within a 40 µm radius (white dotted line) are determined by Delaunay triangulation, and the inter-nuclear edge distances between these nuclei are calculated; the process is repeated for all nuclei in the image. (B) ICC of all cell lines used for cadherin domain deletion/substitution experiments stained for lamin B1. Ncad overexpression was performed in A2Lox-Ncad-HA cells. Cells cultured in neural differentiation conditions for 24 h. (C) Density plots of inter-nuclear edge distance in four cell lines. n=1054 for all samples; plots show a representative sample for three biological replicates. (D) Mean inter-nuclear edge distances. n=3 biological replicates, each containing hundreds to thousands of cells. (E) Mean cell number. n=3 biological replicates. Error bars represent s.d., *P≤0.05, paired Student's t-test. Scale bars: 50 μm.

