



Abstract
Background:
Percutaneous coronary intervention (PCI) is a common and expensive procedure that has become a target for bundled payment initiatives. We described the magnitude and determinants of variation in 90-day PCI episode payments across a diverse array of patients and hospitals.
Methods and Results:
We linked clinical registry data from PCIs performed at 33 Michigan hospitals to 90-day episodes of care constructed using Medicare fee-for-service and commercial insurance claims from 1/2012-10/2016. Payments were price-standardized and risk-adjusted using clinical and administrative variables in an observed-over-expected framework. Hospitals were stratified into quartiles based on average episode payments. Payment components between the highest and lowest quartiles were compared to identify drivers of variation (i.e. index hospitalization/procedure, readmissions, post-acute care, professional fees). Among 40,925 90-day PCI episodes, the average risk-adjusted 90-day episode payment by hospital ranged between $22,154 and $27,205 with a median of $24,696 (IQR: $24,190-$25,643). Hospitals in the lowest and highest quartiles had average episode payments of $23,744 and $26,504, respectively (difference: $2,760). Readmission payments were the primary driver of this variation (46.2%), followed by post-acute care (22.6%). Readmissions remained the primary driver of variation in key subgroups including inpatient and outpatient PCI, as well as PCI for acute myocardial infarction (AMI) and non-AMI indications.
Conclusions:
Substantial hospital-level variation exists in 90-day PCI episode payments. Over half the variation between high and low payment hospitals was related to care after the index procedure, primarily due to readmissions and post-acute care. Hospitals and policymakers should consider targeting these components when developing initiatives to reduce PCI-related spending.
Keywords: percutaneous coronary intervention, cost, payment, value
INTRODUCTION
The annual direct cost of cardiovascular disease and stroke in the United States is estimated to be $190 billion.1 Faced with rising health care costs, public and private payers have turned their attention to novel payment models and policy initiatives aimed at controlling costs.2–7 For instance, the Centers for Medicare and Medicaid Services (CMS) implemented the Hospital Readmission Reduction Program (HRRP) which penalizes hospitals with higher than expected readmission rates for specific conditions.7 However, rising health care costs may also be related to increased utilization in other aspects of care (i.e. increased skilled nursing facility usage, etc.). Bundled payment models were designed to link hospital reimbursement to their performance within an episode of care, incorporating not only readmission costs but all healthcare costs throughout the continuum of inpatient and outpatient care after an index event like an admission for acute myocardial infarction (AMI).2–6, 8
Percutaneous coronary intervention (PCI), one of the most common cardiovascular procedures performed in the United States,1 has become a focus of bundled payment initiatives.3–5, 9 Indeed, CMS recently announced the creation of the Bundled Payments for Care Improvement (BPCI) Advanced model, which consists of 32 clinical episodes of care including two episodes designed around PCI.9 In addition, episodes of care triggered by PCI are being considered as a resource-use metric used to modify physician payment in the new Quality Payment Program (QPP) created by the passage of the Medicare Access and Children’s Health Insurance Program Reauthorization Act (MACRA).10 However, the sources of payment variation within cardiovascular episodes of care remain poorly understood – especially for conditions treated with PCI. Prior research on episodes of care have primarily focused on surgical procedures such as coronary artery bypass graft surgery, cystectomy, nephrectomy, prostatectomy, and colectomy.11–15 In contrast to many surgeries, PCI is performed across a broad spectrum of patient presentations – ranging from patients with stable angina undergoing outpatient elective PCI to those presenting with ST-elevation myocardial infarction (STEMI) and cardiogenic shock requiring emergent PCI and life supportive measures in an intensive care unit. These differences could lead to substantial variation in the sources of episode spending across PCI procedures relative to other conditions that have been studied. Understanding the drivers of variation in PCI episodes of care is critical for both policy design and clinical quality improvement initiatives.
In this context, we evaluated the determinants of variation in 90-day PCI episode payments across a diverse array of patients and hospitals in the state of Michigan. We linked records from a statewide clinical PCI registry to private insurance and Medicare administrative claims to: 1) evaluate the variation in 90-day PCI episode payments across hospitals; and 2) identify the components of healthcare payments that drive this variation.
METHODS
Data Sources
We used two data sources for this study. The first was the Blue Cross Blue Shield of Michigan Cardiovascular Consortium (BMC2) clinical PCI registry, which includes all patients who underwent PCI in both inpatient and outpatient settings at 47 non-federal PCI-capable hospitals in the state of Michigan.16, 17 The second data source was the Michigan Value Collaborative (MVC), a statewide collaborative focused on improving the value of care in the state of Michigan. MVC developed and maintains a validated claims-based registry with 90-day price-standardized episodes of care from Medicare fee-for-service and Blue Cross Blue Shield of Michigan preferred provider organization administrative claims.13–15, 18 All clinically-related claims within 90 days after discharge from the index hospitalization or procedure were included in the episode. This use of a 90-day window is consistent with the design of recent bundled payment initiatives.9, 19 The first eligible PCI claim that occurred in the administrative data triggered the initiation of a PCI episode. All other eligible claims, including subsequent PCIs, were included within the initial 90-day episode and did not initiate a new PCI episode of care. For beneficiaries insured by Blue Cross Blue Shield of Michigan, we were unable to determine if they lost coverage during a 90-day episode of care.
Because payments between private insurers and providers are frequently negotiated, payments were standardized for each claim using average Medicare payments in the state of Michigan. This allowed us to make comparisons of payments across insurers by removing differences in negotiated prices between insurers and hospitals/providers.
The University of Michigan Institutional Review Board approved the study and determined that it met the definition of research not requiring informed consent. The analytic and statistical methods are available through Milan Seth (mcseth@med.umich.edu) to other researchers for purposes of replicating the procedure. However, the data used in this study cannot be shared due to our data use agreements.
Study Population
We obtained all 90-day episodes for conditions where PCI may have occurred, which included 90-day episodes of care defined by MVC for two episodes – AMI and PCI. The administrative claim codes used as inclusion and exclusion criteria used to trigger AMI and PCI episodes are shown in Supplemental Table 1. Notably, patients admitted for AMI and treated with PCI were assigned solely to an AMI episode of care. Among AMI episodes, we included episodes where the discharge diagnosis-related group (DRG) indicated that PCI was performed during the index hospitalization (246, 247, 248, 249, 250, 251) or there was a professional claim with a Current Procedural Terminology (CPT) code indicating PCI was performed (92920, 92928, 92933, 92980, 92982) during the index hospitalization. Next, we linked the two data sources together using iterative deterministic matching to construct a cohort of patients who underwent PCI between January 1, 2012 and October 29, 2016 in Michigan (Supplemental Figure 1). We linked patients between the datasets using patient date of birth, sex, procedure dates, and hospital national provider identifiers.20
From this linked cohort, we excluded PCIs performed at hospitals without on-site cardiac surgical backup (14 hospitals) because all PCIs at these hospitals were performed for emergent indications and are likely to be different in important ways than the remaining 33 hospitals. We also excluded episodes where the patient was discharged against medical advice or discharged to hospice care, as such dispositions may dramatically affect 90-day payments.
Risk-adjusted episode payments
Total 90-day episode payments were adjusted for patient case mix using an observed-over-expected (O/E) payment framework. We predicted expected episode payments using a linear regression model incorporating clinical and procedural variables from the BMC2 PCI clinical registry (complete list of clinical variables available in Supplemental table 2) and a predicted episode payment variable provided by the MVC. This MVC variable was derived using a 2-step model that utilizes age, sex, admission acuity, CMS hierarchical condition categories and prior outlier 6-month high spending, along with AMI and PCI episode-specific claims-based risk adjustment variables. Next, we divided the observed episode payment by the expected episode payment and multiplied this ratio by the overall mean 90-day episode payment to obtain risk-adjusted payments. Risk-adjusted 90-day payments were used for all analyses unless otherwise specified. The total risk-adjusted episode payment was then disaggregated into 4 principal payment components: index hospitalization/procedure, professional fees, post-acute care, and readmissions.13–15
Identifying Drivers of Episode Payment Variation
We ranked hospitals by their average 90-day risk-adjusted episode payments and categorized them into quartiles. Hospitals in the lowest quartile (i.e. low payment hospitals) were compared to hospitals in the highest quartile (i.e. high payment hospitals). Next, we divided the difference in average payments for each component between high and low payment hospitals by the difference in total episode payments between high and low payment hospitals to the percentage of total payment variation driven by each principal component of care.13–15
To further evaluate the drivers of variation, we examined differences in payments between high and low payment hospitals for specific aspects of care within the principal components of post-acute care and professional care. For instance, subcomponents within post-acute care included skilled nursing facilities, inpatient/outpatient rehabilitation facilities, home health agency payments, and other facility payments, to name a few. Professional payments were categorized using Berenson-Eggers Type of Service (BETOS) codes.21
For the principal component of readmissions, we investigated the relationship between a hospital’s 90-day risk-adjusted readmission rate and its average 90-day risk-adjusted total episode payment to further understand whether the variation in readmission payments was driven by differences in the rate of readmission or the amount of payment for the readmission that is usually determined by the DRG. The method used to calculate a hospitals’ 90-day risk-adjusted readmission rates can be found in the Supplemental Methods. Among all readmissions that occurred during a 90-day episode, we described the five most common readmission DRGs and the percentage of readmissions with a DRG indicating that PCI was performed (DRG 246, 247, 248, 249, 250, 251) among low and high payment hospitals.
Lastly, we examined the relationship between a hospital’s 90-day risk-adjusted mortality rate and its average 90-day risk-adjusted episode payment to understand whether hospitals achieving lower average payments were doing so at the expense of clinical quality (i.e. higher risk-adjusted mortality rates).
Subgroup analyses
Given that PCI is performed for a diverse array of patient presentations in both inpatient and outpatient settings, we evaluated hospital-level variation in average 90-day episode payments in two important sets of subgroups. For the first set of subgroups, we stratified episodes based on whether the index PCI was performed for an indication of AMI – defined as a coronary artery disease presentation of STEMI or non-STEMI as per the NCDR CathPCI registry definition.22 For the second set of subgroups, we stratified episodes based on whether PCI was performed during an inpatient or outpatient stay. Such differences in the hospital environment may be important for understanding the sources and magnitude of payment variation, as inpatient hospitalizations are often reimbursed at a higher rate than outpatient procedures.23 We identified inpatient and outpatient PCIs using the place of service indicator attributed to each episode by MVC for the index procedure. Finally, because episodes of care triggered by PCI for the treatment of STEMI are being considered as a cost measure that may be used to adjust payments in the QPP, we also evaluated payment variation among episodes where the index PCI was performed for the treatment of STEMI. Then, within each subgroup we re-ranked hospitals by their average 90-day episode payment and categorized them into high and low payment quartiles and calculated the component drivers of variation.
Statistical Analysis
Standardized differences were used as a measure of imbalance in baseline characteristics between episodes at hospitals with the lowest average 90-day risk-adjusted episode payments (quartile 1) and those with the highest average 90-day episode payments (quartile 4). Absolute standardized differences >10% were considered to be an indicator of baseline imbalance.24 We compared hospital characteristics reported in the 2016 American Hospitals Association survey between high and low payment hospitals. The characteristics included annual PCI volume, organizational structure, hospital bed size, teaching status, geographic locations, and percentage of Medicaid admissions. We used Spearman’s correlation testing to investigate the relationship between hospital-level variables (i.e. 90-day risk-adjusted readmission rates, mortality rates, and average 90-day episode payments). A p-value <0.05 was considered statistically significant. All analyses were performed using R version 3.2.125 and Stata version 14.2 (StataCorp LP, College Station, Texas).
RESULTS
Of the 42,334 90-day PCI episodes between January 2012 and October 2016 that were linked between the BMC2 clinical registry and the MVC claims-based registry, a total of 1,409 episodes were excluded, leaving 40,925 episodes comprising the primary analytic cohort (Supplemental Figure 1). Of these, 32,803 (80.2%) patients were covered by Medicare insurance. The average 90-day risk-adjusted episode payment by hospital ranged between $22,154 and $27,205 with a median of $24,696 (interquartile range: $24,190 – $25,643; Figure 1).
Figure 1.
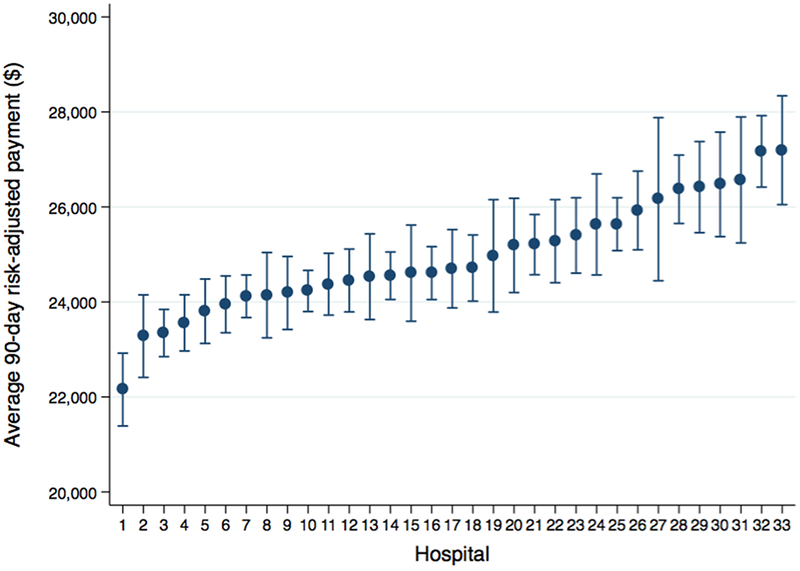
Average 90-day percutaneous coronary intervention total episode payment by hospital.
Hospitals ordered from lowest to highest mean risk-adjusted total episode payment. Error bars indicate 95% confidence intervals.
A total of 10,547 episodes were attributed to 9 low payment hospitals (quartile 1), and 9,074 episodes to 8 high payment hospitals (quartile 4). Patients who underwent PCI at the highest payment hospitals compared with the lowest payment hospitals were more likely to be black; have a history of heart failure; present with unstable angina; undergo elective PCI; receive mechanical circulatory support for PCI; and undergo femoral access for PCI (Table 1). High payment hospitals tended to be larger (≥500 beds), performed more annual PCIs, and had a higher percentage of admissions covered by Medicaid insurance, compared with low payment hospitals (Supplemental table 3). Hospitals in the lowest and highest payment quartiles had average risk-adjusted 90-day episode payments of $23,744 and $26,504, respectively. This amounted to a difference of $2,760, or 11.6% increased payment at high payment hospitals (Figure 2A). Payments related to readmissions (46.2%) were the primary driver of this difference in payment, followed by payments for post-acute care (22.6%) (Figure 2B). The composition of episode payments for hospitals in all four quartiles is shown in Supplemental Figure 2.
Table 1.
Baseline patient and procedural characteristics of percutaneous coronary intervention episodes at high and low payment hospitals.
| Characteristic | Low payment hospitals (9 hospitals; 10,547 episodes) | High payment hospitals (8 hospitals; 9,074 episodes) | Absolute standardized difference (%) |
|---|---|---|---|
| Age | 68.73 ± 11.22 | 68.42 ± 11.35 | 2.7 |
| Female sex | 3,841 (36.4%) | 3,556 (39.2%) | 5.7 |
| White race | 9,682 (91.8%) | 6,868 (75.7%) | 44.7 |
| Black or African American race | 567 (5.4%) | 2,020 (22.3%) | 50.5 |
| Comorbidities | |||
| Current/Recent Smoker (within 1 year) | 2,399 (22.8%) | 2,152 (23.7%) | 2.3 |
| Hypertension | 9,122 (86.5%) | 7,983 (88.0%) | 4.4 |
| Dyslipidemia | 8,808 (83.6%) | 7,450 (82.2%) | 3.7 |
| Family History of Premature CAD | 1,659 (15.7%) | 1,325 (14.6%) | 3.1 |
| Prior MI | 3,458 (32.8%) | 2,811 (31.0%) | 3.9 |
| Prior Heart Failure | 1,545 (14.7%) | 1,936 (21.3%) | 17.5 |
| Prior Valve Surgery/Procedure | 192 (1.8%) | 191 (2.1%) | 2.1 |
| Prior PCI | 4,522 (42.9%) | 4,114 (45.3%) | 5.0 |
| Prior CABG | 2,016 (19.1%) | 1,632 (18.0%) | 2.9 |
| Cerebrovascular Disease | 1,713 (16.2%) | 1,640 (18.1%) | 4.9 |
| Peripheral Arterial Disease | 1,772 (16.8%) | 1,743 (19.2%) | 6.3 |
| Diabetes Mellitus | 3,994 (37.9%) | 3,764 (41.5%) | 7.4 |
| Heart Failure within 2 Weeks | 1,503 (14.3%) | 1,102 (12.1%) | 6.2 |
| Cardiogenic Shock within 24 Hours | 151 (1.4%) | 145 (1.6%) | 1.4 |
| Cardiac Arrest within 24 Hours | 157 (1.5%) | 126 (1.4%) | 0.8 |
| CAD Presentation | |||
| No symptom/no angina | 219 (2.1%) | 279 (3.1%) | 6.3 |
| Symptom unlikely to be ischemic | 144 (1.4%) | 175 (1.9%) | 4.4 |
| Stable angina | 833 (7.9%) | 721 (7.9%) | 0.2 |
| Unstable angina | 4,719 (44.8%) | 4,565 (50.3%) | 11.1 |
| Non-STEMI | 2,894 (27.4%) | 1,989 (21.9%) | 12.8 |
| STEMI or equivalent | 1,735 (16.5%) | 1,344 (14.8%) | 4.5 |
| Index procedural characteristics | |||
| IABP | 145 (1.4%) | 158 (1.7%) | 3.0 |
| Other mechanical Ventricular Support | 39 (0.4%) | 161 (1.8%) | 13.7 |
| Femoral access | 6,701 (63.5%) | 6,640 (73.2%) | 20.9 |
| Radial access | 3,807 (36.1%) | 2,396 (26.4%) | 21.0 |
| PCI Status: Elective | 2,611 (24.8%) | 3,703 (40.8%) | 34.8 |
| PCI Status: Urgent | 6,042 (57.3%) | 3,901 (43.0%) | 28.9 |
| PCI Status: Emergency | 1,878 (17.8%) | 1,449 (16.0%) | 4.9 |
| PCI Status: Salvage | 11 (0.1%) | 13 (0.1%) | 1.1 |
| Pre-procedure creatinine (mg/dL) | 1.12 ± 0.83 | 1.24 ± 1.13 | 11.7 |
| Pre-procedure hemoglobin (g/dL) | 13.39 ± 1.86 | 13.15 ± 1.96 | 12.8 |
Data are presented as n (%) or mean ± standard deviation where appropriate.
Abbreviations: CAD = coronary artery disease; CABG = coronary artery bypass grafting; IABP = intra-aortic balloon pump; MI = myocardial infarction; PCI = percutaneous coronary intervention; STEMI = ST-elevation myocardial infarction.
Figure 2.
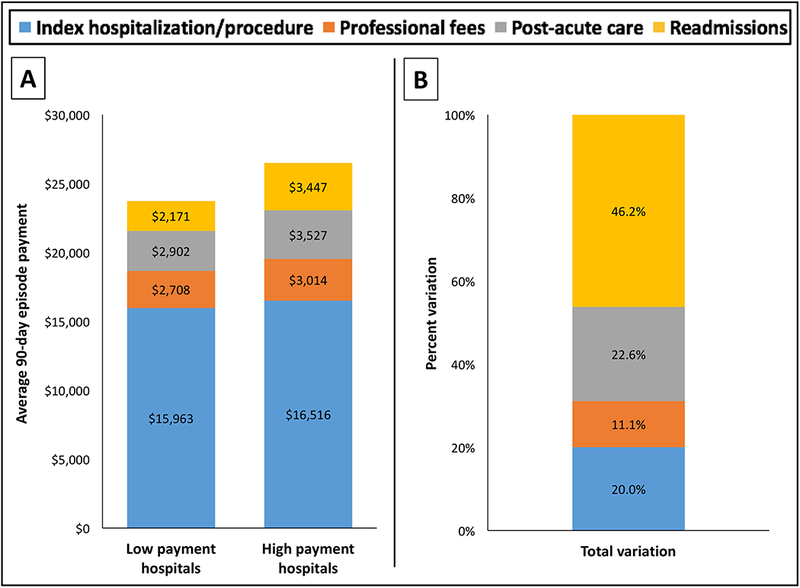
Payment components and variation of average 90-day episode payments between high and low payment hospitals.
Payment components contributing to the average 90-day episode payments among high and low payment hospitals (Panel A). The contribution of each payment category to total episode payment variation between high and low payment hospitals (Panel B).
Readmissions
The overall 90-day episode readmission rate was 18.4% (n/N=7537/40,925). We found a strong correlation between hospital risk-adjusted 90-day readmission rates and average risk-adjusted episode payments (Spearman’s rho: 0.63; p<0.001; Figure 3). There were 2,507 readmissions occurring in episodes at low payment hospitals (24 readmissions per 100 episodes) and 2,972 readmissions occurring in episodes at high payment hospitals (33 readmissions per 100 episodes). PCI with drug eluting-stent without major comorbidity or complication (DRG 247) was the most common readmission DRG at both low and high payment hospitals (Supplemental table 4). There was a similar percentage of readmissions associated with a DRG indicating that PCI was performed at low and high payment hospitals (11.8% and 11.7%, respectively).
Figure 3.
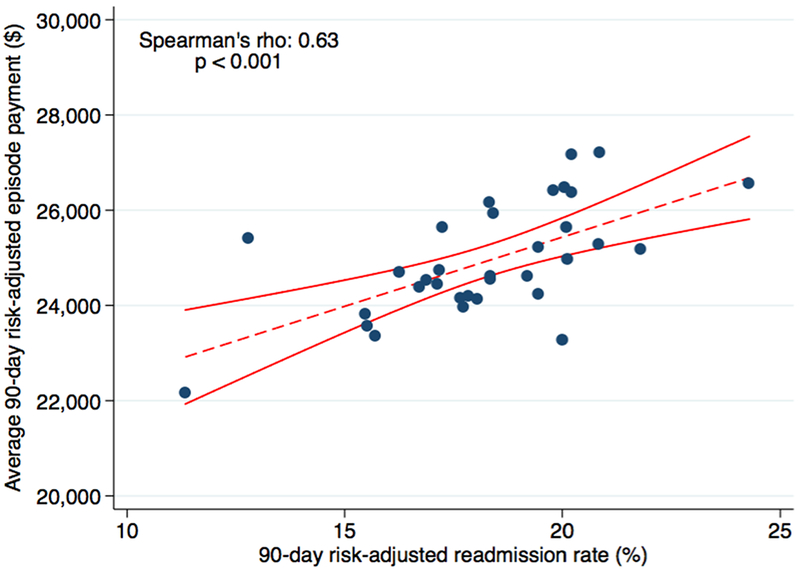
The relationship between hospital 90-day risk-adjusted readmission rates and average 90-day risk-adjusted episode payments.
Correlation between average 90-day risk-adjusted episode payments and 90-day risk-adjusted readmission rates by hospital. The red line indicates the line of best fit with corresponding 95% confidence intervals (dashed line). Spearman’s correlation coefficient and p-value are noted in the top left corner.
Post-acute care and Professional fees
Within the component of post-acute care, the largest difference in payments between high and low payment hospitals was related to procedural outpatient facility payments and home health agency payments (difference: $336 and $143, respectively). On average, low payment hospitals received higher payments related to outpatient rehabilitation care compared with high payment hospitals (difference: -$55; Table 2). Payments related to procedural care, other care, and imaging studies were the largest drivers of variation within the professional fees component of care (Table 2).
Table 2.
Subcomponent payments at high and low payment hospitals.
| Low payment hospitals (9 hospitals; 10,547 episodes) | High payment hospitals (8 hospitals; 9,074 episodes) | Difference | |
|---|---|---|---|
| Post-acute care | |||
| Procedures | $647 | $984 | $336 |
| Home health | $368 | $511 | $143 |
| Durable medical equipment | $135 | $234 | $99 |
| Skilled Nursing Facility | $452 | $493 | $41 |
| Inpatient rehab | $90 | $123 | $33 |
| Other | $267 | $340 | $73 |
| Tests | $62 | $70 | $9 |
| Imaging | $119 | $116 | −$3 |
| Evaluation & Management | $31 | $24 | −$7 |
| Emergency department | $438 | $393 | −$45 |
| Outpatient rehab | $293 | $238 | −$55 |
| Professional fees | |||
| Other | $129 | $227 | $98 |
| Procedures | $1,279 | $1,355 | $76 |
| Imaging | $142 | $196 | $53 |
| Evaluation & Management | $1,045 | $1,084 | $39 |
| Labs & Tests | $73 | $102 | $29 |
| Anesthesia | $25 | $37 | $12 |
| Outpatient rehabilitation | $14 | $13 | −$1 |
Average episode payments and 90-day mortality
Among the 32,518 Medicare episodes with post-discharge data on patient vital status, the overall 90-day episode mortality rate was 3.6%. We found a modest positive correlation between a hospital’s average risk-adjusted 90-day episode payment and its 90-day risk-adjusted mortality rate with a Spearman’s rho of 0.35 (p=0.045; Supplemental Figure 3A). To assess if this relationship was primarily driven by the high cost of care of patients who died, we repeated the analysis by excluding episodes where death occurred from the calculation of a hospital’s average episode payment. A similar relationship between a hospital’s average risk-adjusted 90-day episode payment and its 90-day risk-adjusted mortality rate was noted (Spearman’s rho: 0.31, p=0.079; Supplemental Figure 3B).
Subgroup analysis
There were 16,468 (40.2%) episodes where the index PCI was performed for treatment of AMI and 24,447 (59.8%) episodes where it was performed for treatment of non-AMI conditions. Ten cases were excluded from this analysis due to a missing coronary artery disease presentation variable. There were 28,285 (69.1%) episodes where the index PCI was performed in the inpatient setting and 12,640 (30.9%) episodes where it was performed in the outpatient setting. After re-classifying hospitals into high and low payment quartiles within each subgroup, readmissions remained the largest contributor to payment variation in all four subgroups (Supplemental table 5). The absolute differences between high and low payments hospitals were relatively constant, ranging between $3,066 and $3,796 dollars. However, the largest difference was among the outpatient PCI subgroup where the average payment at high payment hospitals was 19.4% higher than low payment hospitals.
We also evaluated payment variation among episodes where the index PCI was performed for the treatment of STEMI (n=6,263). In this subgroup, the average payment was 19.5% higher at high payment hospitals compared with low payment hospitals (difference: $4,905). Payments related to post-acute care and professional fees were the largest contributors to payment variation (Supplemental table 6).
DISCUSSION
In this analysis of over forty thousand 90-day PCI episodes, we report two main findings. First, there was substantial variation in average 90-day episode payments across 33 hospitals performing both elective and non-elective PCI in the state of Michigan. This suggests variable healthcare use across the state even after accounting for hospital case mix. The difference in average 90-day payments to hospitals in the highest and lowest payment quartiles was $2,760, representing approximately 12% higher payments at high payment versus low payment hospitals. Second, more than half of this difference was related to variation in care after the index hospitalization or procedure; principally in the form of payments for readmissions and post-acute care. These may be important areas of healthcare use for hospitals and policymakers to target in the current era of payment reform.
In contrast to many surgical episodes of care where post-acute care payments were the major driver of variation,11, 14, 26 we found a substantial proportion of the variation in episode payments was related to readmission payments, regardless of the indication for PCI or whether it was performed in the inpatient or outpatient setting. Although readmissions are already a major focus of national healthcare policies such as HRRP,7 and PCI for the treatment of AMI is targeted under this policy, readmissions after PCI performed for other indications are not. In the current study, we demonstrated a strong correlation between hospital 90-day risk-adjusted readmission rates and risk-adjusted 90-day episode payments. High and low payment hospitals also shared the five most common causes of readmissions, suggesting that readmission payments are more likely driven by increased readmission rates rather than variable reimbursement for common readmission diagnoses between high and low payment hospitals. Readmissions were also the largest contributor to payment variation among AMI, non-AMI, inpatient, and outpatient PCI subgroups. Therefore, hospitals that can safely reduce readmissions after PCI stand to benefit under payment policies where reimbursement is tied to spending within an episode of care.
However, not all readmissions are preventable, nor should all readmissions be prevented. Prior research by Wasfy and colleagues demonstrated that over 40% of readmissions within 30 days after PCI at two tertiary care academic centers could have been prevented.27 Tanguturi et al followed up this finding with the implementation of a series of interventions at their institution which was associated with a reduction in their hospital’s 30-day post-PCI readmission rate from 9.6% to 5.3% between 2011 and 2015.28 Further development and implementation of strategies to safely reduce readmissions after PCI will be increasingly important for hospitals when payments are tied to their performance within episodes of care.
Wasfy and colleagues also found that staged PCI was the most common cause of preventable readmissions in their study.27 In the current study, approximately 12% of readmissions at low and high payment hospitals contained a discharge DRG indicating that PCI was performed. However, we were unable to identify if these readmissions were for unplanned or planned PCI; therefore, a fraction of these readmissions may have been planned admissions for staged PCI. Nevertheless, although some have argued that payments associated with staged PCIs should be excluded from episodes of care,29 recent bundled payment models including PCI do not exclude staged or planned PCIs from episodes of care.19, 30
Approximately a quarter of the variation in payments between high and low payment hospitals was attributed to post-acute care payments. The primary drivers of variation within this component included payments for procedures performed at outpatient facilities and home health agency care. Not surprisingly, this contrasts with surgical episodes such as coronary artery bypass grafting, where payments to rehabilitation facilities are responsible for the majority of variation in post-acute care payments.13 Notably, low payment hospitals had higher average payments for outpatient rehabilitation compared with high payment hospitals. Cardiac rehabilitation is a class I guideline recommendation after PCI.31 It is also associated with a reduction in hospital admissions and an improvement in quality of life.32
Lastly, we did not find evidence that low payment hospitals were achieving this distinction at the expense of poorer performance on important quality measures such as 90-day risk-adjusted mortality. With the continued growth of bundled payment models, it will be important to ensure that reductions in health care payments do not occur at the expense of clinical quality.
Our findings concerning the drivers of variation in episode spending for PCI should be considered in light of several new policy developments. The passage of MACRA in April 2015 represented a major shift in healthcare payment policy with a focus on incentivizing value over volume.33 Beginning in 2017, all providers caring for Medicare patients had to select one of two payment pathways in the QPP. Physicians who choose to participate in the Merit-based Incentive Payment System (MIPS) will receive a payment adjustment based on performance in four domains including clinical quality, meaningful use, resource use, and clinical practice improvement.34 Among eight episodes of care being piloted as measures of resource use that may eventually be used to adjust physician payment, at least two episodes are specific to cardiovascular care including episodes triggered by elective outpatient PCI and STEMI with PCI.10 Of note, although readmissions were the predominant source of payment variation in the overall study cohort and most subgroups, among episodes where PCI was performed for the treatment of STEMI, payments related to post-acute care and professional fees were the largest contributor to payment variation. This suggests that hospitals and policymakers may need to consider targeting different components of care depending on the indication for PCI.
The other pathway created by the QPP is the advanced alternative payment model pathway, where physicians may receive a 5% incentive payment for being involved in qualified alternative payment models.35 CMS recently announced the creation of a new voluntary 90-day bundled payment model, Bundled Payments for Care Improvement (BPCI) Advanced, that will allow healthcare providers to participate in the advanced alternative payment model pathway.9 BPCI Advanced consists of 32 clinical episodes including inpatient and outpatient PCI, thus underscoring the relevance of our findings for policymakers and healthcare providers as this new model is implemented in the coming years.
Limitations
Our study has several important limitations. First, there may be patient characteristics associated with healthcare use and 90-day episode payments that were unmeasured and may affect case mix adjustment between hospitals. However, we used variables from a clinical PCI registry as well as administrative claims to adjust episode payments for case mix. Most bundled payment models rely exclusively on administrative claims for risk adjustment,36 thus our findings represent a more robust risk-adjustment than would be employed in real-world applications. Second, the specific episode definitions in our paper differ from those proposed by various payer policies. We did not seek to emulate a specific episode policy, but instead, sought to broadly describe variation in 90-day PCI episode payments among a diverse set of patients and hospitals. Third, as noted above, we were unable to identify if PCIs occurring after the index procedure were planned or staged procedures. Therefore, a fraction of readmissions where PCI occurred may have been planned. However, recent bundled payment initiatives designed by CMS have not traditionally accounted for staged or planned PCIs.19, 36 Further research is needed to understand the impact of including staged PCIs on total episode payments in PCI bundles. Fourth, all hospitals participating in the BMC2 PCI registry also engage in collaborative quality improvement initiatives for PCI. Moreover, many of these hospitals also participate in other collaborative quality initiatives including the MVC where they receive information regarding their hospital’s healthcare utilization across a diverse array of episodes of care.37 Engagement in these initiatives may have led to a reduction in the variation in healthcare use after PCI over time. Therefore, these findings may not be generalizable to sites that do not participate in such quality improvement initiatives.38
Conclusions
We found significant variation in 90-day episode payments after PCI among 33 sites in the state of Michigan. Over half the variation between high and low payment hospitals was related to care after the index event, primarily due to readmissions and post-acute care payments. Hospitals and policymakers should consider targeting these components when developing initiatives to reduce healthcare spending. Future research should focus on identifying procedural or post-procedural factors that may be targeted to safely reduce post-discharge healthcare use.
Supplementary Material
What is Known.
Percutaneous coronary intervention (PCI) is a common and costly procedure that has become the focus of new bundled payment initiatives.
Episodes of care designed around PCI are included in the Bundled Payment for Care Improvement (BPCI) Advanced model and are poised to play an important role in Medicare’s Quality Payment Program (QPP).
What the Study Adds.
Compared to hospitals in the lowest payment quartile, hospitals in the highest quartile received approximately 12% higher payments.
The majority of this difference was related to variation in payments after the index hospitalization or procedure – principally readmissions and post-acute care.
Hospitals and policymakers should consider targeting these components when designing initiatives to reduce healthcare spending in the context of novel value-based healthcare policies.
Acknowledgments
Funding:
Dr. Sukul is supported by the National Institutes of Health T32 postdoctoral research training grant (T32-HL007853). This research was also supported by a physician investigator research grant by the Blue Cross Blue Shield of Michigan Foundation (2544.PIRAP). Support for the Blue Cross Blue Shield of Michigan Cardiovascular Consortium (BMC2) and the Michigan Value Collaborative (MVC) is provided by Blue Cross Blue Shield of Michigan as part of the Blue Cross Blue Shield of Michigan Value Partnerships program; however, the opinions, beliefs and viewpoints expressed by the authors do not necessarily reflect those of Blue Cross Blue Shield of Michigan or any of its employees.
Footnotes
Disclosures:
Devraj Sukul reports no relevant disclosures.
Milan Seth reports no relevant financial disclosures.
James M. Dupree receives grant support from Blue Cross Blue Shield of Michigan for his roles with the Michigan Value Collaborative and the Michigan Urological Surgery Improvement Collaborative.
John D. Syrjamaki receives salary support from Blue Cross Blue Shield of Michigan for his role with the Michigan Value Collaborative.
Andrew M. Ryan reports no relevant financial disclosures.
Brahmajee K. Nallamothu receives support from the American Heart Association for his role as editor in chief of Circulation: Cardiovascular Quality & Outcomes and has previously served on the scientific cardiac advisory board for United Healthcare; no support from any organization for the submitted work; no financial relationships with any organizations that might have an interest in the submitted work in the previous three years; no other relationships or activities that could appear to have influenced the submitted work.
Hitinder S. Gurm reports research funding from the National Institutes of Health and as a consultant for Osprey Medical.
References
- 1.Benjamin EJ, Blaha MJ, Chiuve SE, Cushman M, Das SR, Deo R, de Ferranti SD, Floyd J, Fornage M, Gillespie C, Isasi CR, Jimenez MC, Jordan LC, Judd SE, Lackland D, Lichtman JH, Lisabeth L, Liu S, Longenecker CT, Mackey RH, Matsushita K, Mozaffarian D, Mussolino ME, Nasir K, Neumar RW, Palaniappan L, Pandey DK, Thiagarajan RR, Reeves MJ, Ritchey M, Rodriguez CJ, Roth GA, Rosamond WD, Sasson C, Towfighi A, Tsao CW, Turner MB, Virani SS, Voeks JH, Willey JZ, Wilkins JT, Wu JH, Alger HM, Wong SS, Muntner P, American Heart Association Statistics C and Stroke Statistics S. Heart Disease and Stroke Statistics-2017 Update: A Report From the American Heart Association. Circulation. 2017;135:e146–e603. [DOI] [PMC free article] [PubMed] [Google Scholar]
- 2.Advisory Board. Commercial bundled payment tracker. 2013. Available at: https://www.advisory.com/Research/Health-Care-Advisory-Board/Resources/2013/Commercial-Bundled-Payment-Tracker. Accessed November 28, 2017.
- 3.Farmer SA, Darling ML, George M, Casale PN, Hagan E and McClellan MB. Existing and Emerging Payment and Delivery Reforms in Cardiology. JAMA Cardiol. 2017;2:210–217. [DOI] [PMC free article] [PubMed] [Google Scholar]
- 4.Integrated Healthcare Association. Bundled Payment. Available at: http://www.iha.org/our-work/insights/bundled-payment. Accessed November 29, 2017.
- 5.CMS.gov. Centers for Medicare & Medicaid Services. Bundled Payments for Care Improvement (BPCI) initiative. April 18, 2016. Available at: https://innovation.cms.gov/initiatives/bundled-payments/. Accessed November 15, 2017.
- 6.Arkansas Department of Human Services. Episode of Care: coronary arterial bypass graft (CABG) episode design summary. June 2, 2016. Available at: http://www.paymentinitiative.org/Websites/paymentinitiative/images/EpisodeDesignSummary-CABG-2016-06-02-Final.pdf. Accessed November 25, 2017.
- 7.CMS.gov. Readmissions Reductions Program. November 21, 2017. Available at: https://www.cms.gov/Medicare/Medicare-Fee-for-Service-Payment/AcuteInpatientPPS/Readmissions-Reduction-Program.html. Accessed November 29, 2017.
- 8.Shih T, Chen LM and Nallamothu BK. Will Bundled Payments Change Health Care? Examining the Evidence Thus Far in Cardiovascular Care. Circulation. 2015;131:2151–8. [DOI] [PMC free article] [PubMed] [Google Scholar]
- 9.CMS.gov. BPCI Advanced. Available at: https://innovation.cms.gov/initiatives/bpci-advanced. Accessed January 11, 2018.
- 10.Quality Payment Program. Merit-based Incentive Payment System (MIPS): Episode-Based Cost Measure Field Test Reports Fact Sheet. 2017. Available at: https://www.cms.gov/Medicare/Quality-Initiatives-Patient-Assessment-Instruments/Value-Based-Programs/MACRA-MIPS-and-APMs/Cost-Measures-Field-Test-Fact-Sheet.pdf. Accessed November 29, 2017.
- 11.Miller DC, Gust C, Dimick JB, Birkmeyer N, Skinner J and Birkmeyer JD. Large variations in Medicare payments for surgery highlight savings potential from bundled payment programs. Health affairs. 2011;30:2107–15. [DOI] [PMC free article] [PubMed] [Google Scholar]
- 12.Birkmeyer JD, Gust C, Baser O, Dimick JB, Sutherland JM and Skinner JS. Medicare payments for common inpatient procedures: implications for episode-based payment bundling. Health Serv Res. 2010;45:1783–95. [DOI] [PMC free article] [PubMed] [Google Scholar]
- 13.Guduguntla V, Syrjamaki JD, Ellimoottil C, Miller DC, Prager RL, Norton EC, Theurer P, Likosky DS and Dupree JM. Drivers of Payment Variation in 90-Day Coronary Artery Bypass Grafting Episodes . JAMA surgery. 2017;153:14–19. [DOI] [PMC free article] [PubMed] [Google Scholar]
- 14.Ellimoottil C, Li J, Ye Z, Dupree JM, Min HS, Kaye D, Herrel LA and Miller DC. Episode-Based Payment Variation for Urological Cancer Surgery. Urology. 2017;111:78–85. [DOI] [PMC free article] [PubMed] [Google Scholar]
- 15.Herrel LA, Syrjamaki JD, Linsell SM, Miller DC and Dupree JM. Identifying Drivers of Episode Cost Variation with Radical Prostatectomy. Urology. 2016;97:105–110. [DOI] [PubMed] [Google Scholar]
- 16.Kline-Rogers E, Share D, Bondie D, Rogers B, Karavite D, Kanten S, Wren P, Bodurka C, Fisk C, McGinnity J, Wright S, Fox S, Eagle KA, Moscucci M and Blue Cross Blue Shield of Michigan Cardiovascular C. Development of a multicenter interventional cardiology database: the Blue Cross Blue Shield of Michigan Cardiovascular Consortium (BMC2) experience. Journal of interventional cardiology. 2002;15:387–92. [DOI] [PubMed] [Google Scholar]
- 17.Moscucci M, Rogers EK, Montoye C, Smith DE, Share D, O’Donnell M, Maxwell-Eward A, Meengs WL, De Franco AC, Patel K, McNamara R, McGinnity JG, Jani SM, Khanal S and Eagle KA. Association of a continuous quality improvement initiative with practice and outcome variations of contemporary percutaneous coronary interventions. Circulation. 2006;113:814–22. [DOI] [PubMed] [Google Scholar]
- 18.Ellimoottil C, Syrjamaki JD, Voit B, Guduguntla V, Miller DC and Dupree JM. Validation of a claims-based algorithm to characterize episodes of care. Am J Manag Care. 2017;23:e382–e386. [PubMed] [Google Scholar]
- 19.Federal Register: Medicare Program; Advancing Care Coordination Through Episode Payment Models (EPMs); Cardiac Rehabilitation Incentive Payment Model; and Changes to the Comprehensive Care for Joint Replacement Model (CJR). January 3, 2017. Available at: https://www.federalregister.gov/documents/2017/01/03/2016-30746/medicare-program-advancing-care-coordination-through-episode-payment-models-epms-cardiac. Accessed January 12, 2017. [PubMed]
- 20.Brennan JM, Peterson ED, Messenger JC, Rumsfeld JS, Weintraub WS, Anstrom KJ, Eisenstein EL, Milford-Beland S, Grau-Sepulveda MV, Booth ME, Dokholyan RS, Douglas PS and Duke Clinical Research Institute DT. Linking the National Cardiovascular Data Registry CathPCI Registry with Medicare claims data: validation of a longitudinal cohort of elderly patients undergoing cardiac catheterization. Circ Cardiovasc Qual Outcomes. 2012;5:134–40. [DOI] [PubMed] [Google Scholar]
- 21.CMS.gov. Berenson-Eggers Type of Service (BETOS) Codes. Available at: https://www.cms.gov/Research-Statistics-Data-and-Systems/Statistics-Trends-and-Reports/MedicareFeeforSvcPartsAB/downloads/betosdesccodes.pdf. Accessed January 8, 2018.
- 22.NCDR CathPCI Registry v4.4 Coder’s Data Dictionary. Available at: https://www.ncdr.com/WebNCDR/docs/public-data-collection-documents/cathpci_v4_codersdictionary_4-4.pdf. Accessed July 28, 2016.
- 23.Vora AN, Dai D, Gurm H, Amin AP, Messenger JC, Mahmud E, Mauri L, Wang TY, Roe MT, Curtis J, Patel MR, Dauerman HL, Peterson ED and Rao SV. Temporal Trends in the Risk Profile of Patients Undergoing Outpatient Percutaneous Coronary Intervention: A Report from the National Cardiovascular Data Registry’s CathPCI Registry. Circulation Cardiovascular interventions. 2016;9:e003070. [DOI] [PubMed] [Google Scholar]
- 24.Austin PC. Using the Standardized Difference to Compare the Prevalence of a Binary Variable Between Two Groups in Observational Research. Communications in Statistics - Simulation and Computation. 2009;38:1228–1234. [Google Scholar]
- 25.R: A language and environment for statistical computing [computer program]. Vienna, Austria: R Foundation for Statistical Computing; 2015. [Google Scholar]
- 26.Tsai TC, Greaves F, Zheng J, Orav EJ, Zinner MJ and Jha AK. Better Patient Care At High-Quality Hospitals May Save Medicare Money And Bolster Episode-Based Payment Models. Health affairs. 2016;35:1681–9. [DOI] [PubMed] [Google Scholar]
- 27.Wasfy JH, Strom JB, Waldo SW, O’Brien C, Wimmer NJ, Zai AH, Luttrell J, Spertus JA, Kennedy KF, Normand SL, Mauri L and Yeh RW. Clinical preventability of 30-day readmission after percutaneous coronary intervention. J Am Heart Assoc. 2014;3:e001290. [DOI] [PMC free article] [PubMed] [Google Scholar]
- 28.Tanguturi VK, Temin E, Yeh RW, Thompson RW, Rao SK, Mallick A, Cavallo E, Ferris TG and Wasfy JH. Clinical Interventions to Reduce Preventable Hospital Readmission After Percutaneous Coronary Intervention. Circ Cardiovasc Qual Outcomes. 2016;9:600–604. [DOI] [PubMed] [Google Scholar]
- 29.Society for Cardiovascular Angiography and Interventions: Cardiovascular Comment on the Centers for Medicare Medicaid Services (CMS) Proposed Rule: Medicare Program: Advancing Care Coordination Through Episode Payment Models (EPMs); Cardiac Rehabilitation Incentive Payment Model; and Changes to the Comprehensive Care for Joint Replacement Model. Available at: https://www.regulations.gov/contentStreamer?documentId=CMS-2016-0135-0013&attachmentNumber=1&contentType=pdf. Accessed January 10, 2018.
- 30.The Lewin Group. CMS Bundled Payments for Care Improvement Initiative Models 2–4: Year 3 Evaluation & Monitoring Annual Report. October 2017. Available at: https://downloads.cms.gov/files/cmmi/bpci-models2-4yr3evalrpt.pdf. Accessed January 16, 2018.
- 31.Levine GN, Bates ER, Blankenship JC, Bailey SR, Bittl JA, Cercek B, Chambers CE, Ellis SG, Guyton RA, Hollenberg SM, Khot UN, Lange RA, Mauri L, Mehran R, Moussa ID, Mukherjee D, Nallamothu BK, Ting HH, American College of Cardiology F, American Heart Association Task Force on Practice G, Society for Cardiovascular A and Interventions. 2011 ACCF/AHA/SCAI Guideline for Percutaneous Coronary Intervention. A report of the American College of Cardiology Foundation/American Heart Association Task Force on Practice Guidelines and the Society for Cardiovascular Angiography and Interventions. Journal of the American College of Cardiology. 2011;58:e44–122. [DOI] [PubMed] [Google Scholar]
- 32.Anderson L, Oldridge N, Thompson DR, Zwisler AD, Rees K, Martin N and Taylor RS. Exercise-Based Cardiac Rehabilitation for Coronary Heart Disease: Cochrane Systematic Review and Meta-Analysis. Journal of the American College of Cardiology. 2016;67:1–12. [DOI] [PubMed] [Google Scholar]
- 33.CMS.gov. MACRA. Available at: https://www.cms.gov/Medicare/Quality-Initiatives-Patient-Assessment-Instruments/Value-Based-Programs/MACRA-MIPS-and-APMs/MACRA-MIPS-and-APMs.html. Accessed November 29, 2017.
- 34.Quality Payment Program. MIPS Overview. 2017. Available at: https://qualitypaymentprogram.cms.gov/mips/overview. Accessed November 29, 2017.
- 35.Quality Payment Program. APMs Overview. 2017. Available at: https://qualitypaymentprogram.cms.gov/apms/overview. Accessed November 25, 2017.
- 36.The Lewin Group. CMS Bundled Payments for Care Improvement (BPCI) Initiative Models 2–4: Year 1 Evaluation & Monitoring Annual Report February 2015. Available at: https://innovation.cms.gov/Files/reports/BPCI-EvalRpt1.pdf. Accessed November 29, 2017.
- 37.Blue Cross Blue Shield of Michigan. Value Partnerships. Available at: http://www.valuepartnerships.com/. Accessed November 27, 2017.
- 38.Share DA, Campbell DA, Birkmeyer N, Prager RL, Gurm HS, Moscucci M, Udow-Phillips M and Birkmeyer JD. How a regional collaborative of hospitals and physicians in Michigan cut costs and improved the quality of care. Health affairs. 2011;30:636–45. [DOI] [PubMed] [Google Scholar]
Associated Data
This section collects any data citations, data availability statements, or supplementary materials included in this article.