

Why was the cohort set up?
The National Longitudinal Study of Adolescent Health (Add Health) was developed in the 1990s in response to a mandate from the United States Congress to fund a study of adolescent health, and was designed by a team of multidisciplinary investigators from the social, behavioural and biomedical sciences. The original purpose of Add Health was to understand the causes of adolescent health and health behaviour, with special emphasis on the multiple contexts of adolescent life. To achieve this scientific goal, Add Health sampled the school and family environments in which young people live their lives, which included data on peer relationship dyads, parents, siblings, neighbourhoods and communities, and provides independent and direct measurement of these complex environments over time. As the cohort transitioned into adulthood, research objectives turned to understanding how adolescent experiences, behaviours and contexts are linked to health and achievement outcomes in adulthood, and the name of the study was officially changed to The National Longitudinal Study of Adolescent to Adult Health in 2014.
Add Health is housed at the Carolina Population Center at the University of North Carolina (UNC) and has been led by two principal investigators and project directors: J Richard Udry from 1994–2004; and Kathleen Mullan Harris from 2004 to the present.
Who is in the cohort?
Add Health is a nationally representative cohort study of more than 20 000 adolescents in grades 7–12 (aged 12–19) in the USA in 1994–95, who have been followed through adolescence and into adulthood with five in-home interviews in 1995 (Wave I), 1996 (Wave II), 2001–02 (Wave III), 2008–09 (Wave IV) and 2016–18 (Wave V).1Figure 1 displays the sampling design for selecting the original cohort. A school-based design selected 80 high schools and a paired feeder school from a list of all high schools in the USA in 1994. An in-school questionnaire was administered to more than 90 000 students in grades 7–12, who attended these schools during the 1994–95 school year, and school administrators also filled out a questionnaire about the school.
Figure 1.

Sampling structure.
School rosters from the 1993–94 school year provided the sampling frame for a second level of sampling for a 90-min in-home interview with an adolescent and a 30-min interview with one parent. A grade- and gender-stratified core sample was selected from each school pair, representing a self-weighting nationally representative sample of 12 105 American adolescents in grades 7–12 in 1995. Based on responses to the in-school survey, specific subpopulations were oversampled for purposes of providing sufficient numbers for research on vulnerable and otherwise rare populations, including ethnic (Cuban, Puerto Rican and Chinese), genetic relatedness to siblings (identical/fraternal twins, full/half siblings and unrelated adolescents living in the same household), adoption status and disability samples. Black adolescents with highly educated parents were also oversampled. For two large schools and fourteen small schools, interviews with all enrolled students were attempted to create a special saturation sample. The core sample plus the special samples yield a total of 20 745 adolescents. This Wave I in-home sample represents the national cohort of adolescents in grades 7–12 in the USA in 1995, which is followed prospectively. Because school rosters from the year preceding sample selection were used as the sampling frame for the prospective cohort, high school dropouts over 2 years (e.g. 1993–94; 1994–95) were eligible for sample selection, resulting in little bias due to high school dropouts.2 For more details on design, see Harris 2010 and Harris et al., 2013.3,4
How often have they been followed up?
Figure 2 shows the longitudinal design of Add Health. The Wave I in-home adolescent cohort has been followed up with four subsequent waves spanning 20+ years. In 1996, all adolescents in grades 7 through 11 in Wave I (plus 12th graders who were part of the genetic and adopted sample) were re-interviewed for Wave II (n = 14 738); the decision not to follow up the seniors who were in grade 12 at Wave I was design-based. The Wave II sample were in grades 8 through 12. A follow-up school administrator interview measured change in school context from 1995 to 1996.
Figure 2.

Longitudinal design.
The original cohort was followed through their transition to early adulthood with a Wave III in-home interview in 2001–02 when the sample was aged 18–26 years (n = 15 197). A sample of 1507 partners were randomly selected during the in-home interview and interviewed, filling quota samples of about 500 married, 500 cohabiting and 500 dating partners. Wave IV re-interviewed the original cohort as they settled into young adulthood in 2008–09 when the cohort was aged 24–32 years (n = 15 701). Wave V followed the cohort to the end of young adulthood when they were aged 32–42, with continuous interviewing using a mixed-mode protocol during 2016–18. Finally, the Add Health Parent Study completed a 20-year follow-up of a subset of the parents of Add Health respondents during 2015–17 (n = 3006). Add Health uses state-of-the-art methods and techniques for panel maintenance and tracing to locate and schedule an interview with all living eligible respondents, including those who may have been non-responsive in a preceding wave.
Table 1 presents response rates for the eligible sample at each completed wave of interviews. Response rates have been quite high, highest when the interval between interview waves is short but remarkably high even when the interval is over 5 years at Waves III and IV. The transition from adolescence to early adulthood and the young adult period is an especially transient phase of the life course and it is difficult to track and locate young people. Add Health has done exceptionally well, with response rates of 77.4% and 80.3% at Waves III and IV.
Table 1.
Response rates in Add Health for the eligible sample at each wave of in-home interviews
| Year | Total eligible | Number interviewed | Response ratec | |
|---|---|---|---|---|
| Wave I | 1995 | 26 271 | 20 745 | 79.0% |
| Wave IIa | 1996 | 16 642 | 14 738 | 88.6% |
| Wave III | 2001-02 | 19 600 | 15 197b | 77.4% |
| Wave IV | 2008-09 | 19 560 | 15 701 | 80.3% |
By design, respondents who were in the 12th grade at Wave I and who were not part of the genetic sample were not interviewed at Wave II.
Response rate at Wave III is based on 15 170 respondents who had data at Wave I. An additional 27 respondents without Wave I data were included at Wave III as part of the genetic subsample.
Wave V response rates are not provided because data collection is ongoing, and only a subset of Wave V respondents completed in-home interviews.
There has been differential attrition by gender, age, socioeconomic status, urban residence, immigrant status and race across time, with higher response rates for female, younger, higher socioeconomic status, urban, native-born and White respondents at Waves III and IV. These attrition patterns are consistent with most longitudinal cohort studies. Add Health response rates exceed other national studies with multiple year intervals between waves (e.g. National Survey of Families and Households 2001–03 wave had a 55% response rate; Midlife in the United States 2004–06 interview had a 75% retention rate).5,6
At each wave, Add Health analysed whether patterns of attrition pose any bias to estimates of survey outcomes.7–10 In general, non-response analyses compare respondents and non-respondents on a range of demographic, health, behavioural and attitudinal indicators measured at baseline, and estimate the extent to which differences between respondents and non-respondents introduce bias in study results. Results indicated that total and relative biases, remaining after study estimates were adjusted with final sampling weights, were minimal and that the sample at each wave adequately represented the same population as the Wave I sample. Analysis of bias due to attrition at Wave IV indicated low rates of bias that rarely exceeded 1%, which is small relative to the 20% to 80% prevalence rates for most of the baseline indicators. Despite common patterns of attrition over time, the design strategy to re-interview the original Wave I cohort at each follow-up wave minimizes non-response bias and continues to adequately represent the original cohort of 7-12th graders in US schools in 1995.
What has been measured?
Add Health contains unprecedented environmental, behavioural, psychosocial, biological and genetic data from early adolescence into adulthood on a large, nationally representative sample with extensive racial, ethnic, socioeconomic and geographical diversity.4 Longitudinal survey data on respondents’ social, economic, psychological and physical well-being is combined with contextual data on family, neighbourhood, community, school, friendships, peer groups and romantic relationships, providing unique opportunities to study how psychological characteristics, social environments and behaviours beginning in early adolescence are linked to health and well-being in adulthood. Extensive longitudinal life histories of health-related behaviour are available, including physical activity, risk behaviour, substance use, sexual behaviour, civic engagement, education and multiple longitudinal indicators of health status, such as general health, chronic illness, overweight status and obesity, mental health, disability, health promotion and sleep. Objective measures of health were collected across all waves, including anthropometrics, sexually transmitted infection (STI) test results [including human immunodeficiency virus (HIV)], DNA and an expanded set of biomarkers in adulthood (Waves IV and V) (including blood pressure and pulse, measures of glucose homeostasis, lipid metabolism, inflammation, immune and renal function and a medications inventory). Below we describe the innovative multilevel data that have provided unprecedented research opportunities for a multidisciplinary scientific community.
The clustered design of Add Health makes possible unique contextual levels of measurement, shown in Table 2. School-context data come from school administrator reports on school policies, health services and other school characteristics and from the in-school interviews of students whose aggregated responses represent school census measures. From respondent reports of colleges attended, college context data have been linked to individual records. Family-context data come from parent questionnaires, adolescent in-school and in-home questionnaires and interviews with siblings and additional adolescents living in the same household.
Table 2.
Contextual levels of measurement in Add Health
| Contexts |
|||||||||||||||||||||||||
|---|---|---|---|---|---|---|---|---|---|---|---|---|---|---|---|---|---|---|---|---|---|---|---|---|---|
| Family |
Dyadic relationships |
Peer/social networks |
School/college/workplace |
Neighbourhood/community/state |
|||||||||||||||||||||
| W1 | W2 | W3 | W4 | W5 | W1 | W2 | W3 | W4 | W5 | W1 | W2 | W3 | W4 | W5 | W1 | W2 | W3 | W4 | W5 | W1 | W2 | W3 | W4 | W5 | |
| Social | |||||||||||||||||||||||||
| Household composition, roster, marital status | + | + | + | + | + | + | + | + | + | + | + | + | + | + | + | + | + | o | |||||||
| Relationships: parent, sibling, peer and partner | + | + | + | + | + | + | + | + | + | + | + | + | + | + | + | + | + | + | + | ||||||
| Economic/work | |||||||||||||||||||||||||
| Income, unemployment | + | + | + | + | + | + | + | + | + | + | + | + | + | + | + | + | o | ||||||||
| School/education, school type, attainment | + | + | + | + | + | + | + | + | + | + | + | + | + | + | + | + | + | o | o | ||||||
| Race/ethnic/sex composition integration, discrimination | + | + | + | + | + | + | + | + | + | + | + | + | + | + | + | + | + | + | + | o | |||||
| Legal, crime, policy | + | + | + | + | + | + | + | + | + | + | + | + | o | + | + | + | + | o | |||||||
| Health | |||||||||||||||||||||||||
| Health care facilities, programmes and utilization | + | + | + | + | + | + | + | + | + | + | + | + | + | + | + | + | o | ||||||||
| Fertility, morbidity and mortality, STD incidence | + | + | + | + | + | + | + | + | + | + | + | + | + | + | + | + | + | o | o | ||||||
| Alcohol and tobacco availability, prevention and control | + | + | + | + | + | + | + | + | + | + | + | + | + | + | + | + | + | + | |||||||
| Health behaviour, peer/parent substance use | + | + | + | + | + | + | + | o | + | + | + | o | + | + | o | o | o | o | o | ||||||
| Physical environment | |||||||||||||||||||||||||
| Natural environment, distance to parks, day length | + | + | + | + | + | + | + | + | + | + | o | ||||||||||||||
| Built environment, urbanicity, street connectivity | + | + | + | + | + | + | + | + | + | + | + | + | o | ||||||||||||
| Air quality, pollution | + | + | + | ||||||||||||||||||||||
| Housing type and quality | + | + | + | + | + | + | + | + | + | + | + | + | + | + | + | + | + | + | o | ||||||
W1 = adolescent in- school and in-home, parent and school administrator surveys, geocodes. W2 = adolescent in-home, school administrator and geocodes. W3 = young adult in-home and partner sample surveys, geocodes, biomarkers. W4 = young adult in-home, biomarkers, geocodes. W5 = adult survey, biomarkers, geocodes. Additional variables from administrative datasets (e.g. US Census, Centers for Disease Control and Prevention, National Center for Health Statistics, Federal Bureau of Investigation, National Council of Churches, Common Core of Data, Private School Survey).
, variable available; o, planned variable construction.
Adolescents were asked to nominate friends and sexual and romantic partners from the school rosters in the in-school and in-home surveys at Waves I and II. Peer networks characteristics can be constructed by linking friends’ data and constructing variables based on friends’ responses, and similar measures can be constructed for linked romantic and sexual partners. These peer- and dyad-context measures constitute the social network data, including information on friendship networks, sexual networks and friendship and relationship dyads.
Respondents’ home residences have been geocoded at each interview wave, and contextual data on the neighbourhood, community and state have been merged to all individual records. Nearly 12 000 environmental data elements at multiple geographical levels are available across waves. This includes such information as race, ethnic, foreign-born and religious denomination composition, poverty rates, crime statistics, STI prevalence, divorce and child support laws, welfare policies, cigarette taxes, the proximity and number of parks, sidewalks, recreation centres, fast food restaurants, alcohol outlets and other physical and social characteristics of the environments in which young people live.
Table 3 shows the array of survey and biological data in Add Health. The top panel lists the domains covered by the survey instruments at each wave, including individual-level data on household and family structure, personality, religiosity and spirituality, relationships, sexual behaviour, contraception, pregnancy, children and parenting, sleep patterns, physical activity, diet, substance use/abuse, violence, delinquency, involvement with the criminal justice system, education history, work experiences, military service, chronic and disabling conditions, injury, mental health, suicide and health service access and use. Even though respondents were first interviewed in early adolescence, there are data on infancy (birthweight) and childhood (e.g. maltreatment, chronic conditions, attention deficit hyperactivity disorder) and complete data on fertility outcomes (there were more than 14 500 births to Add Health respondents by Wave IV).
Table 3.
Survey and biomarker domains across Waves I-V in Add Health
| Adolescence | Young Adulthood | Adulthood | Adulthood |
|---|---|---|---|
| Wave I-II (ages 12-19) | Wave III (ages 18-26) | Wave IV (ages 24-32) | Wave V (ages 32-42) |
| Questionnaire data | |||
| Demographic | Demographic | Demographic | Demographic |
| Family, siblings, friends | Family, siblings, friends | Family, siblings, friends | Family, siblings, friends |
| Education, work | Education, work | Education, work, military records | Education, work, military |
| Physical and mental health | Physical and mental health | Physical and mental health | Physical and mental health |
| Daily activities and sleep | Daily activities and sleep | Daily activities and sleep | Daily activities and sleep |
| Relationships | Relationships | Relationships | Relationships |
| Sexual and fertility histories | Sexual and fertility histories | Sexual and fertility histories | Sexual and fertility histories |
| Substance use | Substance use | Substance use and abuse | Substance use and abuse |
| Delinquency and violence | Involvement criminal justice | Involvement criminal justice | Involvement criminal justice |
| Attitudes, religion | Attitudes, religion | Work attitudes and characteristics, religion | Work attitudes and characteristics, religion |
| Economics, expectations | Economics, expectations | Economics, expectations | Economics, expectations |
| Psychological, personality | Psychological, personality | Big 5 Personality, stressors | Personality, stressors |
| Children and parenting | Children and parenting | Children and parenting | |
| Civic participation | Civic participation | Civic participation | |
| Gambling | Cognitive function | Psychosocial factors, cognition | |
| Mentoring | Psychosocial factors | Retrospective child health and socioeconomic status | |
| Family health history | |||
| Administrative linkages (in progress) | |||
| Biological data | |||
| Embedded genetic sample of 3000 ----------------------------------------------▸ | |||
| Physical development | |||
| Height, weight | Height, weight | Height, weight, waist | Height, weight, waist |
| STI tests (urine) | Metabolic (lipids, HbA1c, glucose) | Metabolic (lipids, HbA1c, glucose) | |
| HIV test (saliva) | Cardiovascular (blood pressure, pulse) | Cardiovascular (blood pressure, pulse) | |
| DNA (buccal cell) | Inflammation (hsCRP) | Inflammation (hsCRP) | |
| DNA (buccal cell); GWAS | mRNA; DNAm (venous blood) | ||
| Immune function (EBV) | Renal (creatinine, cystatin C) | ||
| Medications | Medications | ||
The bottom panel of Table 3 shows the biological measures available across waves. The original study design included important features for understanding biological processes in health and developmental trajectories across the life course, including an embedded genetic sample with more than 3000 pairs of adolescents with varying biological resemblance (see Figure 1) and measurement of height and weight to track the obesity epidemic. At Wave III, urine and saliva samples were collected to test for STI and HIV,11,12 and buccal cell saliva was collected from twins and full siblings in the genetic subsample for DNA extraction.13 An expanded set of biological measures were collected at Wave IV, including biomarkers of cardiovascular health (blood pressure, pulse), metabolic processes (waist circumference, glycosylated haemoglobin, blood glucose, lipids), immune function (Epstein-Barr virus), inflammation (C-reactive protein) and a medications inventory. Repeat biomarker measures were collected at Wave V, including new markers of renal disease. Saliva DNA was collected from the full sample at Wave IV. Candidate loci in the dopamine and serotonin pathways have been genotyped and disseminated to the scientific community.14 Genome-wide genotyping was completed on 10 974 Wave IV respondents who consented to archive their specimens for further testing, and genome-wide association study (GWAS) data are available from the database of Genotypes and Phenotypes (dbGaP). Add Health maintains a biospecimen archive available for ancillary studies.
What has it found? Key findings and publications
Add Health has a large and multidisciplinary user base of more than 50 000 researchers around the world, who have published over 3500 peer-reviewed articles in more than 750 different disciplinary journals, and has been the data source for more than 800 master’s theses and dissertations. Publications are listed at [https://www.cpc.unc.edu/projects/addhealth/publications].
Early publications focused on the role of social context in the development of adolescent health, behaviour, expectations and attainment, finding important influences of family and school connectedness,15 peer influence,16–18 romantic relationships,19 and neighbourhoods.20–22 For example, adolescents with a greater number and higher quality of connections to their school and family had better physical and mental health and higher attainment than youth with fewer connections.15 Adolescents whose friendship networks included friends with highly involved parents were less likely than those whose friends had uninvolved parents to binge-drink, smoke cigarettes or use marijuana.23 Other studies report that romantic relationships in adolescence can increase depression among adolescent girls,19 and neighbourhood disadvantage is associated with higher rates of aggression, non-marital childbearing, obesity and weight gain in adulthood.20,22,24
Recent publications documented an alarming emergence of chronic disease among young adults, including a 19% prevalence of hypertension25 and 6% prevalence of diabetes.26 Exploiting the longitudinal data, researchers have investigated the developmental and health pathways leading to young adult outcomes.27,28 Add Health data support longitudinal studies of obesity,29 intimate partner violence,30 substance use31 and health disparities during the early life course from adolescence into young adulthood.32,33
Add Health has mapped the obesity epidemic and documented long-term outcomes for obese adolescents. In adolescence (1995–96), 11% of the sample were obese; in 2001–02 when the cohort was aged 18–26, the percentage doubled to 22%; in 2008–09, 37% of the cohort at ages 24–32 was obese.3,34,35 Building on these longitudinal data, The and colleagues29 demonstrated the long-term impact of obesity early in life, reporting that obese adolescents were more likely to develop severe obesity in young adulthood [body mass index (BMI) ≥40.0] compared with normal-weight or overweight adolescents, by a risk ratio of 16 to 1. Harris3 categorized individual obesity trajectories from adolescence at Wave II to young adulthood at Wave III into three groups: not obese (those who were never obese or lost weight, 82%); become obese (those who became obese during the transition to young adulthood, 10%); and always obese (those who were obese throughout adolescence and young adulthood, 8%). As shown in Figure 3, greater exposure to obesity during adolescence and young adulthood is associated with a higher likelihood of diabetes, hypertension, high cholesterol and sleep problems in adulthood.
Figure 3.
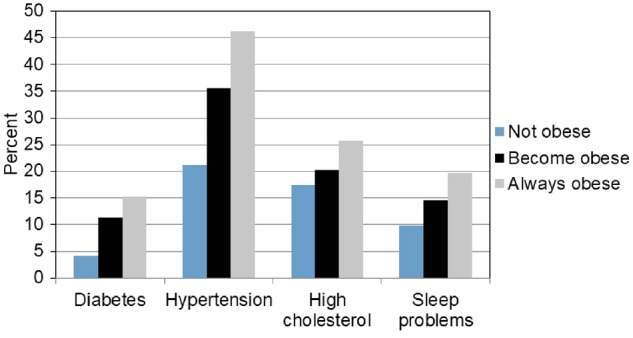
Obesity trajectory from adolescence to young adulthood associated with multiple health outcomes in adulthood (n ∼10 000).
The unique design and diversity of the sample made possible health disparities research on special populations including the disabled,36–40 adopted youth,41–47 youth living with surrogate parents or relatives,48,49 multiracial youth,50–52 sexual minorities53–57 and immigrants.58,59 Findings show that: adopted adolescents are more likely to attempt suicide than their non-adopted peers47; mixed-race adolescents are at higher health risk on a range of indicators compared with adolescents who report only one race52; and bisexual women report more depressive symptoms and perceived stress than heterosexual women.60
There is a large and growing body of genomic research that integrates the genetic data with the longitudinal environmental data to explore the influence of gene-by-environment interactions (GxE), gene-environment correlations (rGE) and polygenic scores (PGS) in health and behavioural outcomes. Hundreds of genetic research articles have explored these associations on a wide range of topics, including risk behaviour,61 substance use,62–65 depression,66 sexual behaviour,67 BMI and obesity,68–70 educational attainment,71 friendship networks,72 conduct problems, delinquency,73,74 violence73–75, and subjective well-being.76
Genome-wide association study (GWAS) data were generated for both the sibling pairs sample77 and Wave IV archive sample,78 enabling the construction of a large number of PGSs.79 These scores facilitated the following new research: sibling differences in the education PGS and educational attainment80; moderating effects of school environments in the education PGS association with educational and occupational attainments (GxE)81; family structure and reproductive timing (rGE)82; education PGS’s role in intergenerational social mobility83; and cohort differences in the genetic relationship between education and smoking.84 In addition, innovative new research is providing human evidence of ‘social genetic effects’ in which the genes of one’s peers influence individual behaviour, controlling for one’s own genes (Sotoudeh, Harris, and Conley: unpublished).85
Figure 4 illustrates findings for social genetic effects of schoolmates and friends on educational attainment, BMI and height.85 The blue (dark grey) bars show the effect of mean school and friend PGS, net of one’s own PGS, for educational attainment in the top panel, BMI in the second panel and height in the third panel. The red dashed line is the baseline effect of own PGS on outcomes in a null model with no other predictors, and the light grey bars represent the effect adjusted for individual-level covariates. The results indicate that the genetics of an individual’s schoolmates and friends predict the individual’s own educational attainment, whereas an individual’s height is unassociated with the height genetics of peers. Add Health has participated in several consortia for new GWAS, including educational attainment, height and alcohol use.86–88
Figure 4.
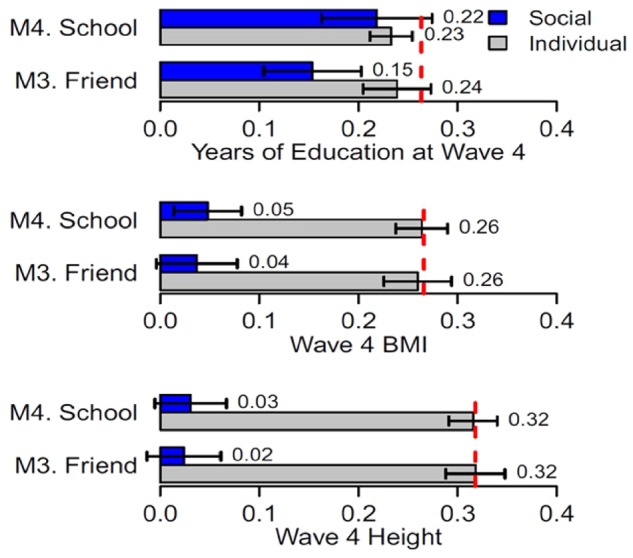
Social genetic effects.
Integrative Add Health research uses biomarker data to link social and behavioural factors with objective measures of health. Illustrative research has examined the associations between a virginity pledge, childhood abuse and race/ethnicity with: STI risks12,89,90; social status and obesity91,92; birthweight, breastfeeding and inflammation93; and life course exposures of neighbourhood disadvantage, social adversity and stressful life events for cardiometabolic risk.94–98 The significant role of social interactions and social context in pre-disease pathways was documented for the first time among young adults, emphasizing the tremendous potential for intervening in the environment early in life before disease symptoms and biological damage are manifest. Social integration, exposure to family instability and urban residence protect young adults from disease risk,99–101 whereas social mobility is associated with mental health benefits but physical health costs for racial/ethnic minorities young adults compared with Whites.102
What are the main strengths and weaknesses?
The major strengths of Add Health emanate from its contextual and national design. The adolescent social context and peer network data, in particular, are unique because they do not rely on inherently biased self-reports to generate an image of an adolescent’s environment. Overall strengths include: (i) national representation of people who live in all 50 states and come from every race, ethnic, immigrant, geographical and socioeconomic subgroup; (ii) racial and ethnic diversity with sufficient numbers to allow within-group analysis of nine separate groups: Mexican, Cuban, Puerto Rican, Central-South American, Chinese, Filipino, African and African American, and European; (iii) understudied and vulnerable populations including individuals with disabilities, foster children and adopted children, mixed-race individuals, immigrants and sexual minorities; (iv) genetic sample of over 3000 pairs of individuals with varying biological resemblance; (v) multigenerational and longitudinal data from respondents and their parents; (vi) longitudinal social, behavioural and biological data beginning in early adolescence and extending into adulthood; (vii) extensive longitudinal multilevel data beginning in early adolescence on respondents' life circumstances and social and physical environments, including family, school, friends, neighbourhood, community and social relationships; (viii) objective measures of health including blood pressure, pulse rate, cholesterol, glucose, high-sensitivity C-reactive protein [hsCRP], Epstein-Barr virus [EBV], waist circumference, BMI, creatinine and cystatin C, and DNA on almost 16 000 participants; (ix) candidate gene and genome-wide genotyping on the full sample at Wave IV; and (x) repeated collection of DNA on twins and full siblings. New omics data will be available in the future including both transcriptome and methylation data (see Table 3).
Weaknesses include: (i) a lack of qualitative data; (ii) the wide breadth of survey data precluding in-depth measurement of specific standard scales; and (iii) a fairly long periodicity for repeated survey and biomarker measures.
Can I get hold of the data? Where can I find out more?
Datasets are available to researchers in several forms: (i) public-use, representing a subset of respondents; (ii) restricted-use and high security restricted-use, which are distributed only to authorized researchers; (iii) geocodes which can only be used in a secure data facility to link Add Health data to other spatially defined data; and (iv) high school transcript data, which are available in secure data enclaves. Data access limitations protect the confidentiality and identities of respondents while allowing data access to a wide range of researchers.
More information, including data access guidelines, study description, publications, documentation files and codebooks can be accessed at [http://www.cpc.unc.edu/projects/addhealth]. GWAS data can be accessed via dbGaP (Study Accession phs001367.v1.p1).
Profile in a nutshell
Add Health is an ongoing longitudinal study of a nationally representative US cohort of 20 745 adolescents in grades 7-12 (aged 12-19 years) in 1994-95.
Follow-up includes four in-home interviews in 1996, 2001-02, 2008-09, 2016–18.
Sample attrition has been low, with response rates ranging from 77% to 89% across follow-up waves, and attrition bias has been minimal.
The study obtains unprecedented environmental, behavioural, psychosocial, biological and genetic data from early adolescence into adulthood with extensive racial, ethnic, socioeconomic and geographical diversity.
Add Health has a large, multidisciplinary user base of over 50 000 researchers around the world, who have published over 3500 research articles.
Key findings show the Add Health cohort at the forefront of the obesity epidemic with profound consequences for cardiometabolic health risks, and significant social genetic effects of schoolmates and peers on health and behaviour.
Add Health datasets are distributed according to a tiered data disclosure plan according to the degree of confidential information and security requirements needed in use of the data: see [http://www.cpc.unc.edu/projects/addhealth/data].
Funding
Add Health is supported by the Eunice Kennedy Shriver National Institute of Child Health and Human Development [P01 HD031921] with co-funding from 23 other federal agencies and foundations. The full list of co-funders can be found at [http://www.cpc.unc.edu/projects/addhealth/about/funders].
Acknowledgements
This research uses data from Add Health, a programme project directed by Kathleen Mullan Harris and designed by J Richard Udry, Peter S Bearman, and Kathleen Mullan Harris. at the University of North Carolina at Chapel Hill, and funded by grant P01-HD31921 from the Eunice Kennedy Shriver National Institute of Child Health and Human Development, with cooperative funding from 23 other federal agencies and foundations. Special acknowledgment is due to Ronald R Rindfuss and Barbara Entwistle for assistance in the original design. We would also like to acknowledge GWAS data funding from Eunice Kennedy Shriver National Institute of Child Health and Human Development (NICHD) Grants R01 HD073342 to Kathleen Mullan Harris and R01 HD060726 to Kathleen Mullan Harris, J.D.B. and M.B.M.
Conflict of interest: None declared.
References
- 1. Harris KM. The Add Health study: design and accomplishments. Carolina Population Center, University of North Carolina 2013.
- 2. Udry JR, Chantala K.. Missing school dropouts in surveys does not bias risk estimates. Soc Sci Res 2003;32:294–311. [Google Scholar]
- 3. Harris KM. An integrative approach to health. Demography 2010;47:1–22. [DOI] [PMC free article] [PubMed] [Google Scholar]
- 4. Harris KM, Halpern CT, Hussey J. et al. Social, behavioral, and genetic linkages from adolescence into adulthood. Am J Public Health 2013;103:S25–S32. [DOI] [PMC free article] [PubMed] [Google Scholar]
- 5. Wright D. National survey of families and households: Wave 3 field report. University of Wisconsin Survey Center 2003.
- 6.MIDUS Mid-Life in the United States: A national study of health and well-being. Advancing knowledge of factors that promote positive health and resilience. MIDUS Newsletter [Internet]; 2007. Available from: http://www.midus.wisc.edu/newsletter/MIDUS_Final.pdf.
- 7. Kalsbeek WD, Yang J, Agans RP (eds). Predictors of nonresponse in a longitudinal survey of adolescents. In: Proceedings of the Annual Meeting of the American Statistical Association; 2002, 10-12 July. Chena Hot Springs, AK, USA.
- 8. Kalsbeek WD, Morris CB, Vaughn BJ (eds). Effects of nonresponse on the mean squared error of estimates from a longitudinal study. In: Proceedings of the Annual Meeting of the American Statistical Association; 2001. Aug 5-9. St Louis, MO, USA.
- 9. Chantala K, Kalsbeek WD, Andraca E.. Non-response in Wave III of the Add Health Study. University of North Carolina-Chapel Hill: Carolina Population Center; 2005. [Google Scholar]
- 10. Brownstein N, Kalsbeek WD, Tabor J, Entzel P, Daza E, Harris Kathleen M. Non-response in Wave IV of the National Longitudinal Study of Adolescent Health.
- 11. Morris M, Handcock MS, Miller WC. et al. Prevalence of HIV infection among young adults in the United States: results from the Add Health study. Am J Public Health 2006;96:1091–97. [DOI] [PMC free article] [PubMed] [Google Scholar]
- 12. Miller WC, Ford CA, Morris M. et al. Prevalence of chlamydial and gonococcal infections among young adults in the United States. JAMA 2004;291:2229–36. [DOI] [PubMed] [Google Scholar]
- 13. Harris KM, Halpern CT, Haberstick BC, Smolen A.. The National Longitudinal Study of Adolescent Health (Add Health) sibling pairs data. Twin Res Hum Genet 2013;16:391–98. [DOI] [PMC free article] [PubMed] [Google Scholar]
- 14. Smolen A, Whitsel EA, Tabor J. et al. Add Health Wave IV documentation: candidate genes. Carolina Population Center, University of North Carolina at Chapel Hill; 2013. [Google Scholar]
- 15. Resnick MD, Bearman PS, Blum R. et al. Protecting adolescents from harm: Findings from the National Longitudinal Study on Adolescent Health. JAMA 1997;278:823–32. [DOI] [PubMed] [Google Scholar]
- 16. Bearman PS, Bruckner H, Power in Numbers: Peer Effects on Adolescent Girls' Sexual Debut and Pregnancy. Washington, DC: National Campaign to Prevent Teen Pregnancy, 1999. [Google Scholar]
- 17. Haynie DL, Haynie DL.. Delinquent peers revisited: Does network structure matter? Am J Sociol 2001;10:1013–57. [Google Scholar]
- 18. Moody J. Peer influence groups: identifying dense clusters in large networks. Social Networks 2001;23:261–83. [Google Scholar]
- 19. Joyner K, Udry JR.. You don't bring me anything but down: Adolescent romance and depression. J Health Soc Behav 2000;41:369–91. [PubMed] [Google Scholar]
- 20. Cleveland HH. Disadvantaged neighborhoods and adolescent aggression: Behavioral genetic evidence of contextual effects. J Res Adolesc 2003;13:211–38. [Google Scholar]
- 21. Duncan GJ, Boisjoly J, Harris KM.. Sibling, peer, neighbor, and schoolmate correlations as indicators of the importance of context for adolescent development. Demography 2001;38:437–47. [DOI] [PubMed] [Google Scholar]
- 22. Harding DJ. Cultural context, sexual behavior, and romantic relationships in disadvantaged neighborhoods. Am Sociol Rev 2007;72:341–64. [Google Scholar]
- 23. Shakya HB, Christakis NA, Fowler JH.. Parental influence on substance use in adolescent social networks. Arch Pediatr Adolesc Med 2012;166:1132–39. [DOI] [PMC free article] [PubMed] [Google Scholar]
- 24. Burdette AM, Needham BL.. Neighborhood environment and body mass index trajectories from adolescence to adulthood. J Adolesc Health 2012;50:30–37. [DOI] [PubMed] [Google Scholar]
- 25. Nguyen QC, Tabor JW, Entzel PP. et al. Discordance in national estimates of hypertension among young adults. Epidemiology 2011;22:532–41. [DOI] [PMC free article] [PubMed] [Google Scholar]
- 26. Nguyen QC, Whitsel EA, Tabor JW. et al. Blood spot–based measures of glucose homeostasis and diabetes prevalence in a nationally representative population of young US adults. Ann Epidemiol 2014;24:903–09.e1. [DOI] [PMC free article] [PubMed] [Google Scholar]
- 27. Halpern CT, Waller MW, Spriggs A, Hallfors DD.. Adolescent predictors of emerging adult sexual patterns. J Adolesc Health 2006;39:926.e1–e10. [DOI] [PubMed] [Google Scholar]
- 28. Fletcher JM, Richards MR.. Diabetes's ‘health shock’ to schooling and earnings: Increased dropout rates and lower wages and employment in young adults. Health Aff (Millwood) 2012;31:27–34. [DOI] [PubMed] [Google Scholar]
- 29. Suchindran C, North KE, Popkin BM, Gordon-Larsen P.. Association of adolescent obesity with risk of severe obesity in adulthood. JAMA 2010;304:2042–47. [DOI] [PMC free article] [PubMed] [Google Scholar]
- 30. Halpern CT, Spriggs AL, Martin SL, Kupper LL.. Patterns of intimate partner violence victimization from adolescence to young adulthood in a nationally representative sample. J Adolesc Health 2009;45:508–16. [DOI] [PMC free article] [PubMed] [Google Scholar]
- 31. Kandel DB, Kiros GE, Schaffran C, Hu MC.. Racial/ethnic differences in cigarette smoking initiation and progression to daily smoking: A multilevel analysis. Am J Public Health 2004;94:128–35. [DOI] [PMC free article] [PubMed] [Google Scholar]
- 32. Harris KM, Gordon-Larsen P, Chantala K, Udry JR.. Longitudinal trends in race/ethnic disparities in leading health indicators from adolescence to young adulthood. Arch Pediatr Adolesc Med 2006;160:74–81. [DOI] [PubMed] [Google Scholar]
- 33. Richardson LJ, Hussey JM, Strutz KL.. Origins of disparities in cardiovascular disease: Birth weight, body mass index, and young adult systolic blood pressure in the National Longitudinal Study of Adolescent Health. Ann Epidemiol 2011;21:598–607. [DOI] [PMC free article] [PubMed] [Google Scholar]
- 34. Hussey JM, Nguyen QC, Whitsel EA. et al. The reliability of in-home measures of height and weight in large cohort studies: evidence from Add Health. Demres 2015;32:1081–97. [DOI] [PMC free article] [PubMed] [Google Scholar]
- 35. Gordon-Larsen P, Adair LS.. Longitudinal trends in obesity in the United States from adolescence to the third decade of life. Obesity (Silver Spring) 2010;18:1801–804. [DOI] [PMC free article] [PubMed] [Google Scholar]
- 36. Blum RW, Kelly A, Ireland M.. Health-risk behaviors and protective factors among adolescents with mobility impairments and learning and emotional disabilities. J Adolesc Health 2001;28:481–90. [DOI] [PubMed] [Google Scholar]
- 37. Cheng MM, Udry JR.. Sexual behaviors of physically disabled adolescents in the United States. J Adolesc Health 2002;31:48–58. [DOI] [PubMed] [Google Scholar]
- 38. Cheng MM, Udry JR.. Sexual experiences of adolescents with low cognitive abilities in the US. J Dev Phys Disabil 2005;17:155–72. [Google Scholar]
- 39. Cheng MM, Udry JR.. How much do mentally disabled adolescents know about sex and birth control? Adolesc Family Health 2003;3:28–38. [Google Scholar]
- 40. Svetaz MV, Ireland M, Blum R.. Adolescents with learning disabilities: Risk and protective factors associated with emotional well-being: Findings from the National Longitudinal Study of Adolescent Health. J Adolesc Health 2000;27:340–48. [DOI] [PubMed] [Google Scholar]
- 41. Feigelman W. Comparing adolescents in diverging family structures. Adoption Q 2001;5:5–37. [Google Scholar]
- 42. Feigelman W, Finley GE.. Youth problems among adoptees living in one-parent homes: A comparison with others from one-parent biological families. Am J Orthopsychiatry 2004;74:305–15. [DOI] [PubMed] [Google Scholar]
- 43. Miller BC, Bayley BK, Christensen M. et al. Who is adopted? Adoption Q 2001;5:23–43. [Google Scholar]
- 44. Miller BC, Fan XT, Christensen M, Grotevant HD, van Dulmen M.. Comparisons of adopted and nonadopted adolescents in a large, nationally representative sample. Child Dev 2000;71:1458–73. [DOI] [PubMed] [Google Scholar]
- 45. Miller BC, Fan XT, Grotevant HD, Christensen M, Coyl D, van Dulmen M.. Adopted adolescents' overrepresentation in mental health counseling: adoptees' problems or parents' lower threshold for referral? J Am Acad Child Adolesc Psychiatry 2000;39:1504–11. [DOI] [PubMed] [Google Scholar]
- 46. Neiss M, Rowe DC.. Parental education and child's verbal IQ in adoptive and biological families in the National Longitudinal Study of Adolescent Health. Behav Genet 2000;30:487–95. [DOI] [PubMed] [Google Scholar]
- 47. Slap G, Goodman E, Huang B.. Adoption as a risk factor for attempted suicide during adolescence. Pediatrics 2001;108:E30. [DOI] [PubMed] [Google Scholar]
- 48. Heard HE. The family structure trajectory and adolescent school performance - Differential effects by race and ethnicity. J Family Issues 2007;28:319–54. [Google Scholar]
- 49. Kirby JB, Kaneda T.. Health insurance and family structure: the case of adolescents in skipped-generation families. Med Care Res Rev 2002;59:146–65. [DOI] [PubMed] [Google Scholar]
- 50. Harris DR, Sim JJ.. Who is multiracial? Assessing the complexity of lived race. Am Sociol Rev 2002;67:614–27. [Google Scholar]
- 51. Radina ME, Cooney TM.. Relationship quality between multiracial adolescents and their biological parents. Am J Orthopsychiatry 2000;70:445–54. [DOI] [PubMed] [Google Scholar]
- 52. Udry JR, Li RM, Hendrickson-Smith J.. Health and behavior risks of adolescents with mixed-race identity. Am J Public Health 2003;93:1865–70. [DOI] [PMC free article] [PubMed] [Google Scholar]
- 53. Halpern CT, Young ML, Waller MW, Martin SL, Kupper LL.. Prevalence of partner violence in same-sex romantic and sexual relationships in a National Sample of Adolescents. J Adolesc Health 2004;35:124–31. [DOI] [PubMed] [Google Scholar]
- 54. Russell ST, Driscoll AK, Truong N.. Adolescent same-sex romantic attractions and relationships: implications for substance use and abuse. Am J Public Health 2002;92:198–202. [DOI] [PMC free article] [PubMed] [Google Scholar]
- 55. Udry JR, Chantala K.. Risk assessment of adolescents with same-sex relationships. J Adolesc Health 2002;31:84–92. [DOI] [PubMed] [Google Scholar]
- 56. Udry JR, Chantala K.. Risk factors differ according to same-sex and opposite-sex interest. J Biosoc Sci 2005;37:481–97. [DOI] [PubMed] [Google Scholar]
- 57. Russell ST. Sexual minority youth and suicide risk. Am Behav Sci 2003;46:1241–57. [Google Scholar]
- 58. Hernandez DJ. The Health Status and Risk Behaviors of Adolescents in Immigrant Families. Washington, DC: National Academies Press, 2000. [Google Scholar]
- 59. M. Hussey J, D. Hallfors D, W. Waller M, J. Iritani B, T. Halpern C, J. Bauer D.. Sexual behavior and drug use among Asian and Latino adolescents: Association with immigrant status. J Immigrant Health 2007;9:85–94. [DOI] [PubMed] [Google Scholar]
- 60. Lindley LL, Walsemann KM, Carter JW.. The association of sexual orientation measures with young adults' health-related outcomes. Am J Public Health 2012;102:1177–85. [DOI] [PMC free article] [PubMed] [Google Scholar]
- 61. Guo G, Cai TJ, Guo R, Wang HY, Harris KM.. The dopamine transporter gene, a spectrum of most common risky behaviors, and the legal status of the behaviors. PLoS One 2010;5:e9352. [DOI] [PMC free article] [PubMed] [Google Scholar]
- 62. Boardman JD, Saint Onge JM, Haberstick BC, Timberlake DS, Hewitt JK.. Do schools moderate the genetic determinants of smoking?. Behav Genet 2008;38:234–46. [DOI] [PMC free article] [PubMed] [Google Scholar]
- 63. Daw J, Shanahan M, Harris KM, Smolen A, Haberstick B, Boardman JD.. Genetic sensitivity to peer behaviors: 5HTTLPR, smoking, and alcohol consumption. J Health Soc Behav 2013;54:92–108. [DOI] [PMC free article] [PubMed] [Google Scholar]
- 64. Timberlake DS, Rhee SH, Haberstick BC. et al. The moderating effects of religiosity on the genetic and environmental determinants of smoking initiation. Nicotine Tob Res 2006;8:123–33. [DOI] [PubMed] [Google Scholar]
- 65. Timberlake DS, Haberstick BC, Lessem JM. et al. An association between the DAT1 polymorphism and smoking behavior in young adults from the national longitudinal study of adolescent health. Health Psychol 2006;25:190–97. [DOI] [PubMed] [Google Scholar]
- 66. Marmorstein NR, Hart D.. Interactions between MAOA genotype and receipt of public assistance: Predicting change in depressive symptoms and body mass index. J Res Adolesc 2011;21:619–30. [DOI] [PMC free article] [PubMed] [Google Scholar]
- 67. Halpern CT, Kaestle CE, Guo G, Hallfors DD.. Gene-environment contributions to young adult sexual partnering. Arch Sex Behav 2007;36:543–54. [DOI] [PubMed] [Google Scholar]
- 68. Fuemmeler BF, Agurs-Collins TD, McClernon FJ. et al. Genes implicated in serotonergic and dopaminergic functioning predict BMI categories. Obesity 2008;16:348–55. [DOI] [PMC free article] [PubMed] [Google Scholar]
- 69. Haberstick BC, Lessem JM, McQueen MB. et al. Stable genes and changing environments: Body mass index across adolescence and young adulthood. Behav Genet 2010;40:495–504. [DOI] [PMC free article] [PubMed] [Google Scholar]
- 70. Richardson AS, North KE, Graff M. et al. Moderate to vigorous physical activity interactions with genetic variants and body mass index in a large US ethnically diverse cohort. Pediatr Obes 2014;9:E35–E46. [DOI] [PMC free article] [PubMed] [Google Scholar]
- 71. Shanahan MJ, Vaisey S, Erickson LD, Smolen A.. Environmental contingencies and genetic propensities: Social capital, educational continuation, and dopamine receptor gene DRD2. Am J Sociol 2008;114:S260– 86. [DOI] [PubMed] [Google Scholar]
- 72. Boardman JD, Domingue BW, Fletcher JM.. How social and genetic factors predict friendship networks. Proc Natl Acad Sci U S A 2012;109:17377–81. [DOI] [PMC free article] [PubMed] [Google Scholar]
- 73. Li Y, Liu H, Guo G.. Does marriage moderate genetic effects on delinquency and violence? J Marriage Fam 2015;77:1217–33. [DOI] [PMC free article] [PubMed] [Google Scholar]
- 74. Liu HX, Li Y, Guo G.. Gene by social-environment interaction for youth delinquency and violence: thirty-nine aggression-related genes. Soc Forces 2015;93:881–903. [DOI] [PMC free article] [PubMed] [Google Scholar]
- 75. Schulz-Heik RJ, Rhee SH, Silvern LE. et al. The association between conduct problems and maltreatment: testing genetic and environmental mediation. Behav Genet 2010;40:338–48. [DOI] [PMC free article] [PubMed] [Google Scholar]
- 76. De Neve JE. Functional polymorphism (5-HTTLPR) in the serotonin transporter gene is associated with subjective well-being: Evidence from a US nationally representative sample. J Hum Genet 2011;56:456–59. [DOI] [PubMed] [Google Scholar]
- 77. McQueen MB, Boardman JD, Domingue BW. et al. The National Longitudinal Study of Adolescent to Adult Health (Add Health) sibling pairs genome-wide data. Behav Genet 2015;45:12–23. [DOI] [PMC free article] [PubMed] [Google Scholar]
- 78. Highland HM, Avery CL, Qing D, Yun L, Harris KM, Quality control analysis of Add Health GWAS data Carolina Population Center, University of North Carolina at Chapel Hill; 2018. [Google Scholar]
- 79. Braudt DB, Harris KM.. Polygenic scores (PGSs) in the National Longitudinal Study of Adolescent to Adult Health (Add Health) - Release 1. Carolina Population Center, University of North Carolina at Chapel Hill; 2018. [Google Scholar]
- 80. Domingue BW, Belsky D, Conley D, Harris KM.. Polygenic influence on educational attainment: new evidence from The National Longitudinal Study of Adolescent to Adult Health. AERA Open 2015;1:1–13. [DOI] [PMC free article] [PubMed] [Google Scholar]
- 81. Trejo S, Belsky D, Boardman J. et al. Schools as moderators of genetic associations with life course attainments: evidence from the WLS and Add Heath. Sociol Sci 2018;5:513–40. [DOI] [PMC free article] [PubMed] [Google Scholar]
- 82. Gaydosh L, Belsky DW, Domingue BW, Boardman JD, Harris KM.. Father absence and accelerated reproductive development in non-Hispanic white women in the United States. Demography 2018;55:1245–67. [DOI] [PMC free article] [PubMed] [Google Scholar]
- 83. Belsky DW, Domingue BW, Wedow R. et al. Genetic analysis of social-class mobility in five longitudinal studies. Proc Natl Acad Sci U S A 2018;115:E7275.. [DOI] [PMC free article] [PubMed] [Google Scholar]
- 84. Wedow R, Zacher M, Huibregtse BM, Harris KM, Domingue BW, Boardman JD.. Education, smoking, and cohort change: Forwarding a multidimensional theory of the environmental moderation of genetic effects. Am Sociol Rev 2018;83:802–32. [DOI] [PMC free article] [PubMed] [Google Scholar]
- 85. Domingue BW, Belsky DW, Fletcher JM, Conley D, Boardman JD, Harris KM.. The social genome of friends and schoolmates in the National Longitudinal Study of Adolescent to Adult Health. Proc Natl Acad Sci U S A 2018;115:702–07. [DOI] [PMC free article] [PubMed] [Google Scholar]
- 86. Liu M, Yu J, Wedow R. et al. Association studies of up to 1.2 million individuals yield new insights in the genetic etiology of tobacco and alcohol use. Nat Genet 2019;51:237–44. [DOI] [PMC free article] [PubMed] [Google Scholar]
- 87. Lee JJ, Wedow R, Okbay A. et al. Gene discovery and polygenic prediction from a genome-wide association study of educational attainment in 1.1 million individuals. Nat Genet 2018;50:1112–21. [DOI] [PMC free article] [PubMed] [Google Scholar]
- 88. Marouli E, Graff M, Medina-Gomez C. et al. Rare and low-frequency coding variants alter human adult height. Nature 2017;542:186–90. [DOI] [PMC free article] [PubMed] [Google Scholar]
- 89. Bruckner H, Bearman P.. After the promise: the STD consequences of adolescent virginity pledges. J Adolesc Health 2005;36:271–78. [DOI] [PubMed] [Google Scholar]
- 90. Haydon AA, Hussey JM, Halpern CT.. Childhood abuse and neglect and the risk of STDs in early adulthood. Perspect Sex Reprod Health 2011;43:16–22. [DOI] [PMC free article] [PubMed] [Google Scholar]
- 91. Lee H, Harris KM, Gordon-Larsen P.. Life course perspectives on the links between poverty and obesity during the transition to young adulthood. Popul Res Policy Rev 2009;28:505–32. [DOI] [PMC free article] [PubMed] [Google Scholar]
- 92. Gordon-Larsen P. Entry into romantic partnership is associated with obesity. Obesity (Silver Spring) 2009;17:1441–47. [DOI] [PMC free article] [PubMed] [Google Scholar]
- 93. McDade TW, Metzger MW, Chyu L, Duncan GJ, Garfield C, Adam EK.. Long-term effects of birth weight and breastfeeding duration on inflammation in early adulthood. Proc Biol Sci 2014;281:20133116. [DOI] [PMC free article] [PubMed] [Google Scholar]
- 94. Lippert AM, Lippert AM, Evans CR, Razak F, Subramanian SV.. Associations of continuity and change in early neighborhood poverty with adult cardiometabolic biomarkers in the United States: Results from the National Longitudinal Study of Adolescent to Adult Health. Am J Epidemiol 2017;185:765–76. [DOI] [PMC free article] [PubMed] [Google Scholar]
- 95. Yang YC, Gerken K, Schorpp K, Boen C, Harris KM.. Early-life socioeconomic status and adult physiological functioning: A life course examination of biosocial mechanisms. Biodemography Soc Biol 2017;63:87–103. [DOI] [PMC free article] [PubMed] [Google Scholar]
- 96. Wickrama KAS, Bae D, O'Neal CW.. Black-white disparity in young adults' disease risk: An investigation of variation in the vulnerability of black young adults to early and later adversity. J Adolesc Health 2016;59:209–14. [DOI] [PubMed] [Google Scholar]
- 97. Walsemann KM, Goosby BJ, Farr D.. Life course SES and cardiovascular risk: Heterogeneity across race/ethnicity and gender. Soc Sci Med 2016;152:147–55. [DOI] [PMC free article] [PubMed] [Google Scholar]
- 98. Hatzenbuehler ML, Slopen N, McLaughlin KA.. Stressful life events, sexual orientation, and cardiometabolic risk among young adults in the United States. Health Psychol 2014;33:1185–94. [DOI] [PMC free article] [PubMed] [Google Scholar]
- 99. Yang YC, Boen C, Gerken K, Li T, Schorpp K, Harris KM.. Social relationships and physiological determinants of longevity across the human life span. Proc Natl Acad Sci U S A 2016;113:578–83. [DOI] [PMC free article] [PubMed] [Google Scholar]
- 100. Gaydosh L, Gaydosh L, Harris Kathleen M.. Childhood family instability and young adult health. J Health Soc Behav 2018;59:371–90. [DOI] [PMC free article] [PubMed] [Google Scholar]
- 101. Lawrence E, Hummer RA, Harris KM.. The cardiovascular health of young adults: disparities along the urban-rural continuum. Ann Am Acad Pol Soc Sci 2017;672:257–81. [DOI] [PMC free article] [PubMed] [Google Scholar]
- 102. Gaydosh L, Schorpp KM, Chen E, Miller GE, Harris KM.. College completion predicts lower depression but higher metabolic syndrome among disadvantaged minorities in young adulthood. Proc Natl Acad Sci U S A 2018;115:109–14. [DOI] [PMC free article] [PubMed] [Google Scholar]