Summary
Although glucose-sensing neurons were discovered more than 50 years ago, the physiological role of glucose sensing in metazoans remains unclear. Here, we identify a pair of glucose-sensing neurons (dubbed CN neurons) in the Drosophila brain with bifurcating axons whereby one axon branch projects to insulin-producing cells (IPCs) to trigger the release of Drosophila insulin-like peptide 2 (dilp2), and the other one extends to adipokinetic hormone (AKH)–producing cells to inhibit the secretion of AKH, fly’s analog of glucagon. These axonal branches undergo synaptic remodeling in response to changes in their internal energy status. Silencing of CN neurons largely disabled IPCs’ response to glucose and dilp2 secretion, and disinhibited AKH secretion in corpora cardiaca (CC), and caused hyperglycemia, a hallmark feature of diabetes mellitus. We propose that CN neurons maintain glucose homeostasis by promoting the secretion of dilp2 and suppressing the release of AKH when hemolymph glucose levels are high.
Glucose-sensing neurons respond to glucose or its metabolite that act as a signaling cue to regulate their neuronal activity. According to the glucostatic hypothesis proposed in 1953, feeding and related behaviors are regulated by neurons in the brain that sense changes in glucose levels in the blood1. Despite of the discovery of glucose-sensing neurons in the hypothalamus through electrophysiological methods eleven years later2, the physiological role of these neurons remained unclear3,4, however, until recently, when a population of glucose-excited neurons in the Drosophila brain were determined to function as an internal nutrient sensor to mediate the animal’s consumption of sugar5. A large number of glucose-sensing neurons appear to be present in animals6; we speculated that these neurons mediate physiological functions that are critical for the wellbeing of the animal, including glucose homeostasis. We report herein the discovery of a pair of glucose-excited neurons in the Drosophila brain that maintain glucose homeostasis by coordinating the activity of the two key hormones involved in that process: insulin and glucagon.
CN neurons project to the PI and CC
In our search for neurons that respond to sugar according to its nutritional value, we used a two-choice assay7 to screen Vienna tiles (VT)-Gal4 lines8 that had been crossed to UAS-Kir2.1, tub-Gal80ts flies for defects in their ability to select nutritive D-glucose over nonnutritive L-glucose (Extended Data Fig.1 a, see Methods). We isolated two independent Gal4 lines, VT58471- and VT43147-Gal4, that failed to select D-glucose after periods of starvation and appeared to contain identical dorsolateral cells that are labeled by corazonin (Crz)-Gal4 line9 (Extended Data Fig.1b-c, arrowheads). Flies in which Crz-Gal4 expressing neurons had been inactivated failed to select D-glucose even when starved (Extended Data Fig.1d). These results suggest that the dorsolateral neurons labeled by the Crz and two candidate Gal4 lines mediate the behavioral response to sugar.
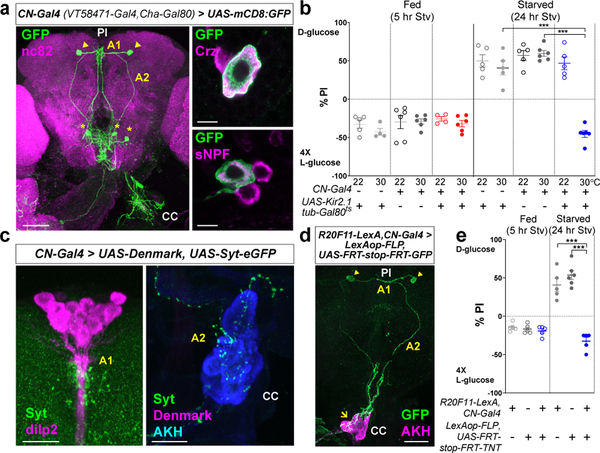
We used anti-Crz antibody to confirm the identity of the dorsolateral neurons (Fig. 1a, upper right). A previous study demonstrated that a subset of Crz-expressing neurons also express sNPF10. Immuno-labeling revealed that the dorsolateral neurons expressing Crz also express sNPF (Fig. 1a, lower right). In the light of these findings, we named these CN (Crz+, sNPF+) neurons. To restrict Gal4 expression to few cells that include the dorsolateral neurons, we crossed VT58471-Gal4 to cholinergic-Gal80, named CN-Gal4, which illustrated unambiguous labeling of a pair of CN neurons when crossed to UAS-mCD8:GFP (Fig. 1a, left-arrowheads). Flies in which these dorsolateral neurons were inactivated using CN-Gal4 failed to select D-glucose when starved (Fig. 1b). A CN cell body projects an axon that bifurcates to form two major branches (Fig. 1a). One branch (axon 1) projects to the pars intercerebralis (PI) region of the brain and the other branch (axon 2) projects ventrolaterally toward the CC11,12 (Fig. 1a, c, and Extended Data Fig. 2a). We used an intersectional approach to define these projections further, thereby validating that axon 1 innervates the PI and axon 2 projects to the CC (Fig. 1d and Extended Data Fig. 2b, c, see Methods). We also used this approach to induce the expression of tetanus toxin (TNT)13 to silence a pair of CN neurons. These flies failed to choose D-glucose even after starvation when CN neurons were inactivated (Fig. 1e, see Methods). This provided more evidence of the contribution of the pair of the dorsolateral CN neurons to glucose-evoked behavior.
Figure 1.
A pair of glucose-sensing neurons in the brain, CN neurons, show a unique projection pattern. a, CN neurons marked by GFP (green) counterstained with nc82 (magenta) antibody in the brain and CC. CN neurons (arrowheads) extend their neurites centrally (A1) and ventrolaterally (A2). Asterisks denote unrelated cells labeled by CN-Gal4. Scale bar, 50 μm. CN cell bodies labeled by GFP (green) co-stained with anti-Crz (magenta, upper right) and anti-sNPF antibodies (magenta, lower right). Scale bar, 5 pm. b, Inactivation of CN neurons by expressing UAS-Kir2.1, tub-Gal80ts under the control of CN-Gal4 at 30 °C blunts a preference for D-glucose in starved flies. c, CN axons innervate IPCs, stained with anti-dilp2 (magenta) antibody, via A1 (left) and AKH-producing cells, stained with anti-AKH (cyan) antibody, via A2 (right). CN axons and dendrites are stained with anti-GFP (green) and anti-dsRed (Denmark, magenta) antibodies, respectively. Scale bar, 20 μm. d, Intersectional labeling of CN neurons by GFP (green), co-stained with anti-AKH (magenta) antibody. Scale bar, 50 μm. e, Intersectional silencing of CN neurons blunts a preference for D-glucose in starved flies. Z-stacked projections are shown, except the right panels of (a). In this and subsequent figures, all the plots represent mean ± s.e.m. ***P < 0.001; one-way ANOVA with Tukey post hoc test. See Supplementary Table 1 for the sample sizes and statistical analyses.
CN neurons are glucose-excited
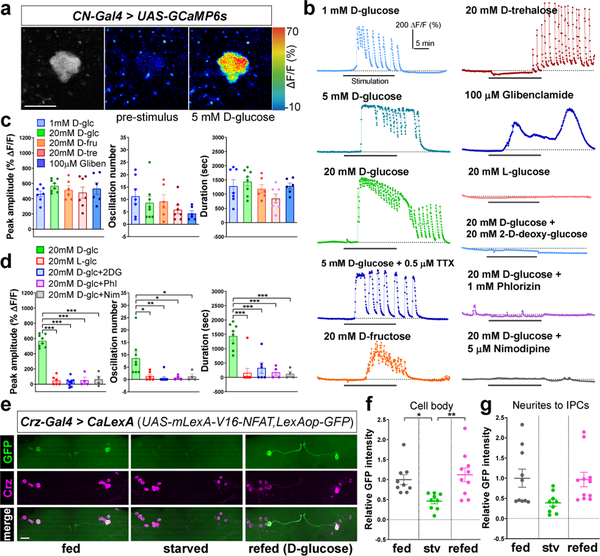
We next sought to determine whether CN neurons respond to glucose and other sugars. Calcium imaging studies using ex vivo brain preparations of flies carrying the calcium indicator UAS-GCaMP6s14 and CN-Gal4 revealed that CN neurons were robustly activated by D-glucose with substantial calcium oscillations (Fig. 2a-c and Extended Data Fig. 3a-e). CN neurons also responded to D-trehalose and D-fructose, which are found in the hemolymph, but failed to respond to (1) nonnutritive sugar, L-glucose (Fig. 2b, d); (2) non-hemolymph sugar, sucrose; (3) non-sugar nutrients, amino acids (Extended Data Fig. 3f-j). D-glucose and D-trehalose are key sugars in the hemolymph, although D-trehalose stimulates the activity of CN neurons only after a substantial delay (−12 min), possibly because it requires additional metabolic steps to produce glucose from trehalose. d-fructose at 20 mM activated CN neurons, even though the concentration of D-fructose in the hemolymph is much lower (< 2 mM)15. These findings suggest that the pair of CN neurons only respond to D-glucose under normal physiological conditions.
Figure 2.
CN neurons are activated by nutritive sugars, but not by nonnutritive sugars. a, CN neurons expressing GCaMP before (middle) and after (right) D-glucose application. Scale bar, 5 μm. b-d, Representative traces (b) and quantifications (c-d) of calcium responses of CN neurons to D-glucose (D-glc), D-fructose (D-fru), D-trehalose (D-tre), and glibenclamide (Gliben) (c) and L-glucose (L-glc), and D-glucose mixed with 2-D-deoxy-glucose (2DG), phlorizin (Phl), or nimodipine (Nim) (d). e-g, Representative images revealed by native CaLexA-driven GFP and anti-Crz staining (e), and quantifications (f-g) of GFP intensity from CN cell bodies (f) and neurites to IPCs (g) of fed, starved, or refed flies carrying Crz-Gal4 and CaLexA; see Methods. Scale bar, 20 μm. Z-stacked projections are shown. *P < 0.05, **P < 0.01, ***P < 0.001; one-way ANOVA with Tukey post hoc test. See Supplementary Table 1 for the sample sizes and statistical analyses.
We next determined whether activation of CN neurons by D-glucose requires glucose metabolism inside the cell. Exposing the brain to D-glucose mixed with 2-D-deoxy-glucose (2DG), phlorizin, or nimodipine, which inhibits glycolysis, glucose transporter, or voltage-gated calcium channel, respectively, blunted the glucose-induced stimulation of CN neurons (Fig. 2b, d). In the presence of pyruvate (an end product of glycolysis), the CN neurons demonstrated activity similar to that seen in the presence of other hemolymph sugars (Extended Data Fig. 3f-j). An application of ATP-sensitive potassium (KATP)16 channel blocker, glibenclamide17, resulted in activation of CN neurons (Fig. 2b-c). Furthermore, glucose-induced calcium transients of these neurons were not abrogated by the application of a sodium-channel blocker, tetrodotoxin (TTX) (Fig. 2b). We also determined using RNAi lines that glucose transporter 1 (Glutl), hexokinase C (Hex-C), a subunit of KATP channel (SUR1), and voltage-gated calcium channel are required in CN neurons for the two-choice behavior (Extended Data Fig. 4a-c). Consistent with the behavioral results, glucose-induced calcium response of CN neurons requires Glutl, SUR1, and a voltage-gated calcium channel (Extended Data Fig. 4d-h), further substantiating the role of the intracellular glucose metabolic pathway in stimulating CN neuronal activity.
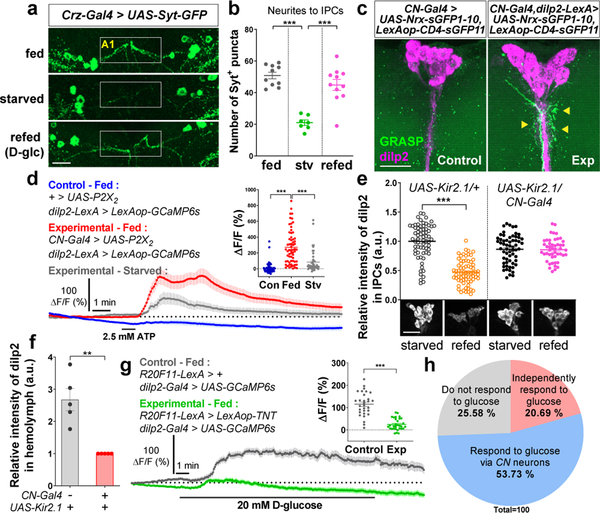
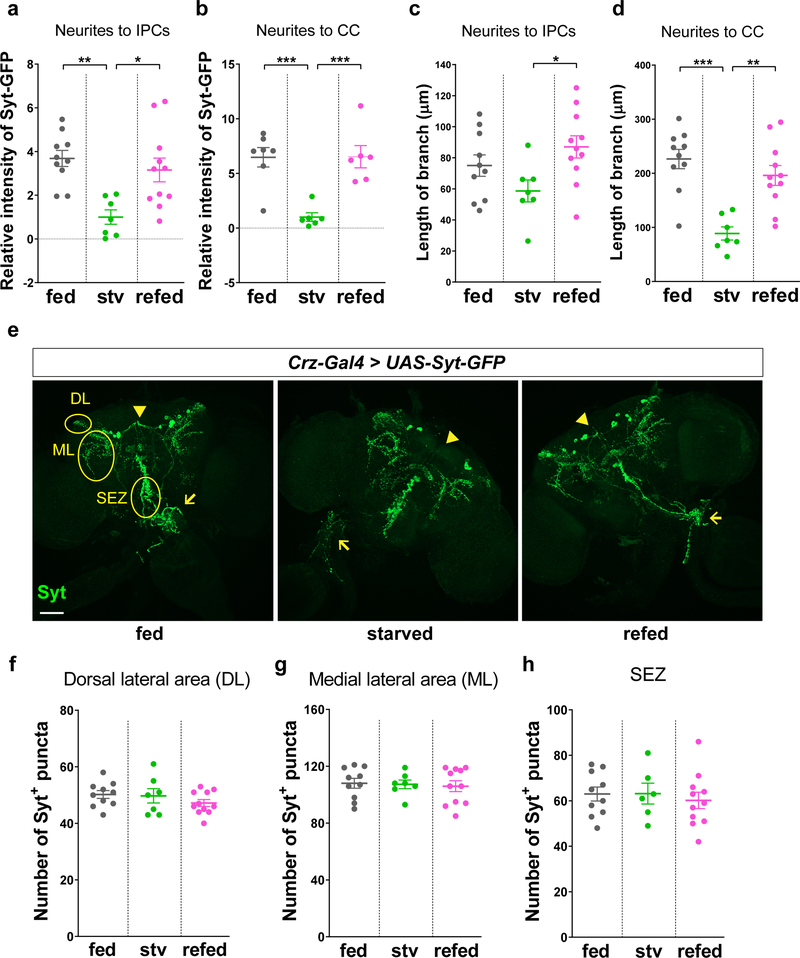
We next used the calcium-dependent nuclear import of LexA (CaLexA) system18 to measure cellular activity in CN neurons in intact flies, and found that GFP signal driven by the CaLexA system in starved flies was significantly reduced compared to the signal in fed flies, and the signal was restored when starved flies were refed D-glucose (Fig. 2e-g and Extended Data Fig. 4i-j). These results suggest that the activity of CN neurons in live animals is stimulated by the increase in glucose levels observed under fed conditions. In addition to the altered CaLexA signals, we evaluated the effect of glucose on the number and intensity of synaptotagmin (Syt)19-GPF+ puncta in starved and refed animals. In starved animals, these parameters were decreased significantly in axon 1; after they were refed D-glucose, the parameters were restored to normal levels (Fig. 3a-b and Extended Data Fig. 5a, c). This nutrient-dependent plasticity, however, was not observed in Crz-Gal4-labeled axonal processes that did not originate from the dorsolateral CN neurons (Extended Data Fig. 5e-h).
Figure 3.
IPCs’ activity and dilp2 secretion require an excitatory signal from CN neurons. a-b, Representative images (a) and quantifications of the number of Syt-GFP+ puncta (green) (b) in axon 1 (A1) of CN neurons in fed, starved, or refed flies carrying Crz-Gal4 and UAS-Syt-GFP. White box denotes CN axonal projections to IPCs. c, Native GRASP-induced fluorescence (green, arrowheads), co-stained with anti-dilp2 (magenta) antibody. d, Average GCaMP traces and ΔF/F (max) quantifications from IPCs of fed or starved flies in which CN neurons were stimulated, or those of control fed flies. e-f, Relative intensities of dilp2 immunoreactivity in IPCs (e) and tryptic peptide of dilp2 B chain from fed hemolymph (f) of flies in which CN neurons were inactivated, or those of control flies. g, Average GCaMP traces and ΔF/F (max) quantifications from IPCs of fed flies in which CN neurons were silenced by TNT in response to D-glucose, or those of control flies. h, IPCs comprise three sub-populations according to their response to glucose; see Methods. All the scale bars, 20 μm. Z-stacked projections are shown. **P < 0.01, ***P < 0.001; one-way ANOVA with Tukey post hoc test for (b, d) and unpaired two-tailed t test for (e, f, g). See Supplementary Table 1 for the sample sizes and statistical analyses.
CN neurons promote dilp2 release from IPC
We next sought to determine whether CN neurons are coupled with I PCs20 at the synaptic level. To this end, we used a modified GFP Reconstitution Across Synaptic Partners (GRASP) method21 and found that the GRASP signals were visible around the synapse between CN neurons and IPCs (Fig. 3c). This indicates the presence of physical coupling between CN neurons and IPCs.
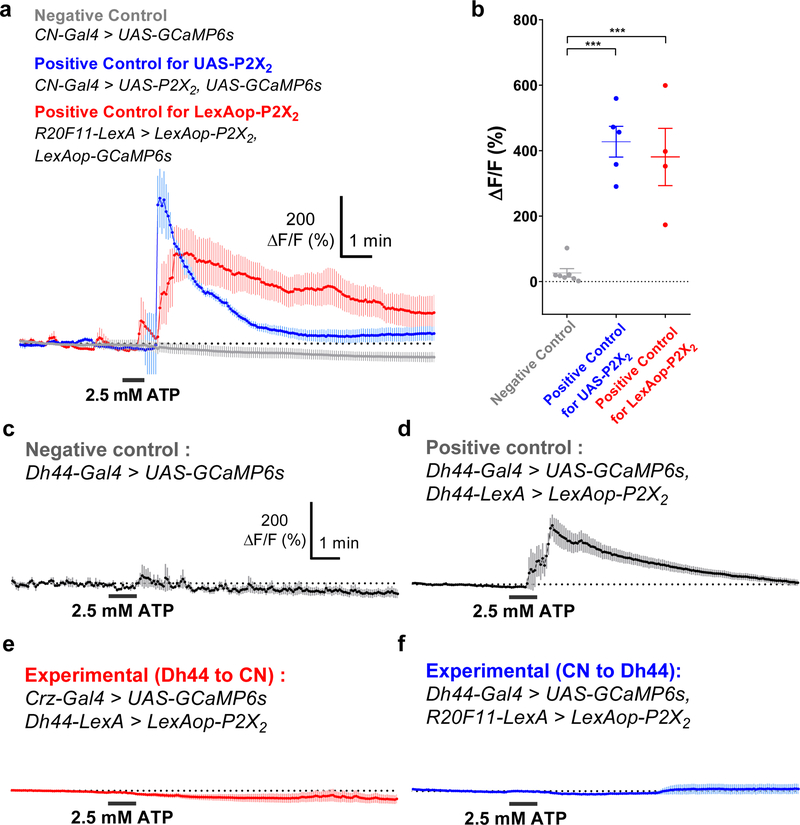
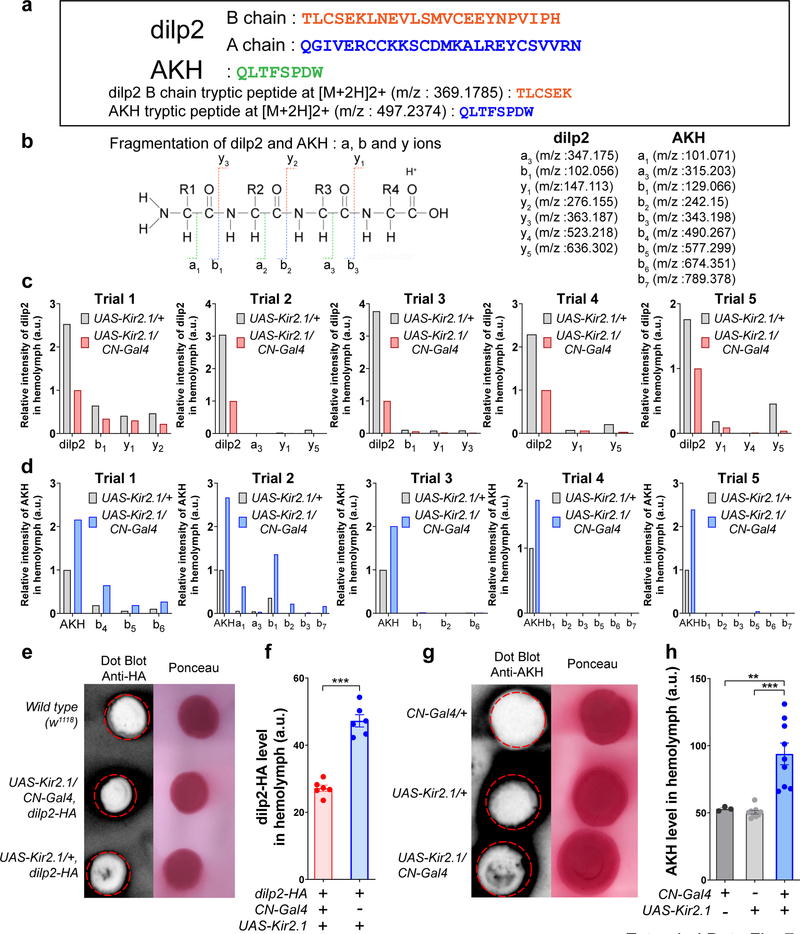
To determine whether the coupling between CN neurons and IPCs is functional, we expressed ATP-gated P2X2 receptors22 in CN neurons and GCaMP6s14 in IPCs, and then stimulated CN neurons using ATP while recording from the IPCs. As shown in Fig. 3d, ATP-induced CN neuronal activity was accompanied by a significant increase in the amplitude of GCaMP6 signals in the IPCs in fed flies; this effect was reduced in starved flies (Fig. 3d and Extended Data Fig. 6a-b). This finding supports the hypothesis that the nutrient-dependent synaptic changes observed between CN neurons and IPCs indeed have functional consequences. The CN neurons did not appear to be functionally coupled to glucose-excited Dh44 neurons5 (Extended Data Fig. 6c-f). Furthermore, we investigated whether CN neuronal activity is required for dilp2 secretion from IPCs. We observed a significant reduction in the intensity of dilp2 immunoreactivity in the IPCs of fed control flies, but not in fed flies in which CN neurons had been inactivated (Fig. 3e). These results suggest that an excitatory signal from the CN neurons is important for the secretion of dilp2 from IPCs in response to increased glucose levels. Using mass spectrometry and dot blot assay, we further validated that the flies carrying CN-Gal4 and UAS-Kir2.1 had lower dilp2 levels circulating in hemolymph in contrast to the higher dilp2 levels found in IPCs (Fig. 3f and Extended Data Fig. 7a-c, e-f).
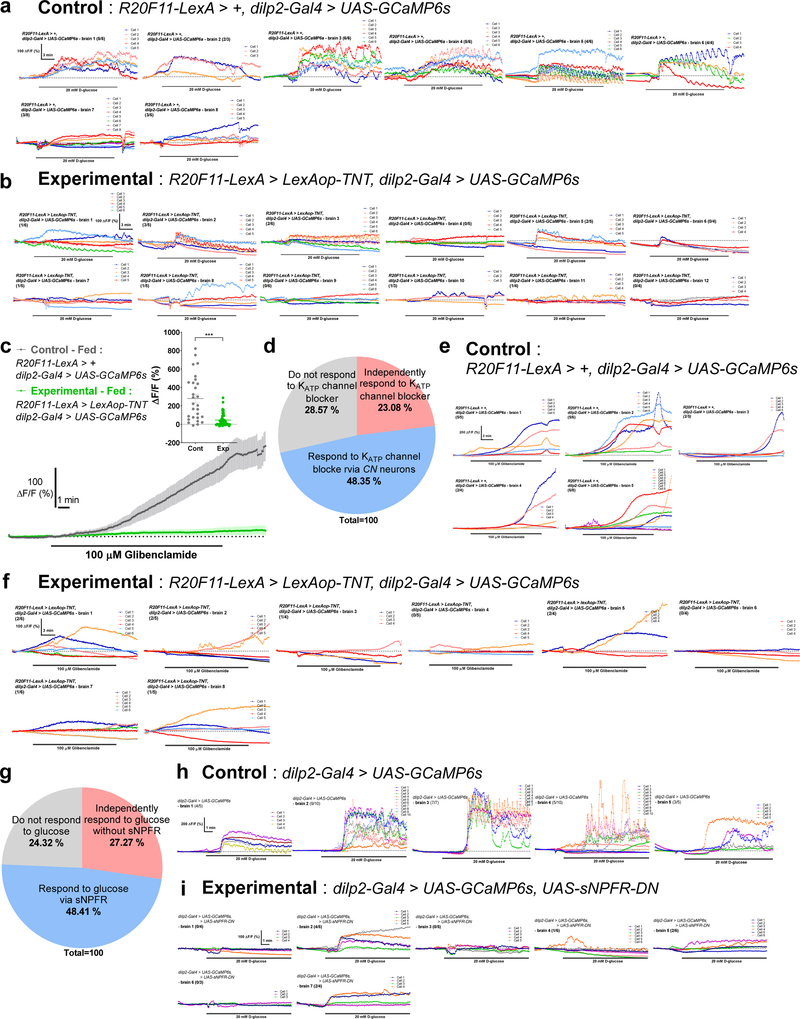
To further clarify the role of CN neurons in mediating glucose-evoked activity in IPCs, we inactivated CN neurons by expressing TNT13 and then examined the responsiveness of IPCs to glucose. Remarkably, the amplitude of calcium signals in IPCs that had been exposed to D-glucose was significantly reduced when the CN neurons were inactivated (Fig. 3g). Furthermore, we found that IPCs harbor at least three sub-populations of neurons with distinct responses to glucose or KATP channel blocker (Fig. 3h and Extended Data Fig. 8a-f). These findings suggest that CN neuronal activity is required for the majority of IPCs to respond to glucose.
CN neurons inhibit AKH secretion from CC
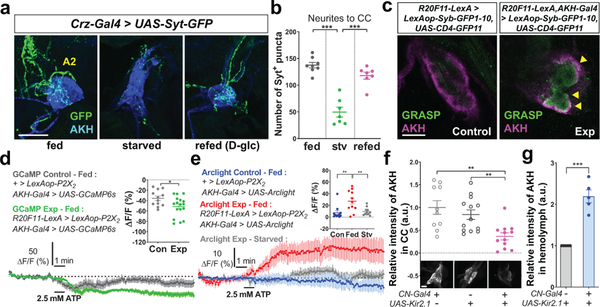
To determine whether nutrient-dependent plasticity also occurs in axon 2 of the CN neurons, we monitored the number and intensity of Syt-GFP+ puncta before and after feeding flies with D-glucose. We observed a significant reduction in these parameters in starved flies and a restoration to normal levels after refeeding starved flies D-glucose (Fig. 4a-b and Extended Data Fig. 5b, d). This raised a possibility of coupling between CN neurons and AKH-producing cells. Using a modified GRASP method23, we observed notable GRASP fluorescent signals around AKH-producing cells (Fig. 4c). To determine whether there is any functional connectivity between these cells, we activated the CN neurons while monitoring the activity of AKH-producing cells and found that calcium transients in the AKH-producing cells appeared to decrease during CN neuronal activation (Fig. 4d).
Figure 4.
AKH retention in AKH-producing cells requires an inhibitory signal from CN neurons. a-b, Representatives images stained with anti-GFP and anti-AKH antibodies (a) and quantifications of the number of Syt-GFP+ puncta (green) (b) in axon 2 (A2) of CN neurons in fed, starved, or refed flies carrying Crz-Gal4 and UAS-Syt-GFP. Scale bar, 50 μm. c, Synaptic GRASP-induced GFP signals (arrowheads) co-stained with anti-AKH (magenta) antibody. Scale bar, 20 μm. d-e, Average GCaMP traces and ΔF/F (min) quantifications (d), and average Arclight traces and ΔF/F (max) quantifications (e) from AKH-producing cells of fed or starved flies in which CN neurons were activated, or those of control flies. f-g, Relative intensities of AKH immunoreactivity in AKH-producing cells (f) and tryptic peptide of AKH from hemolymph (g) of fed flies in which CN neurons were inactivated, or those of control flies. Scale bar, 20 μm. Z-stacked projections are shown except (c). *P < 0.05, **P < 0.01, ***P < 0.001; one-way ANOVA with Tukey post hoc test (b, e, f) and unpaired two-tailed t test for (d, g). See Supplementary Table 1 for the sample sizes and statistical analyses.
To probe this observation further, we expressed the Arclight receptor24, which increases fluorescent signals when cells become hyperpolarized, in AKH-producing cells and P2X2 receptors in CN neurons. When the CN neurons were activated using ATP, the Arclight fluorescent intensity in fed flies increased significantly compared to that in starved flies (Fig. 4e), validating that nutrient-dependent changes occurred in the synapses between CN neurons and AKH-producing cells. Notably, when CN neurons were inactivated, the intracellular AKH levels decreased significantly compared with controls (Fig. 4f). Using mass spectrometry and dot blot assay, we confirmed significantly higher levels of AKH in hemolymph of flies carrying CN-Gal4 and UAS-Kir2.1 compared with those in control flies (Fig. 4g and Extended Data Fig. 7d, g-h). These findings suggest that CN neuronal activity inhibits the release of AKH from the CC, and the increase of AKH levels in hemolymph.
sNPF is the functional neurotransmitter
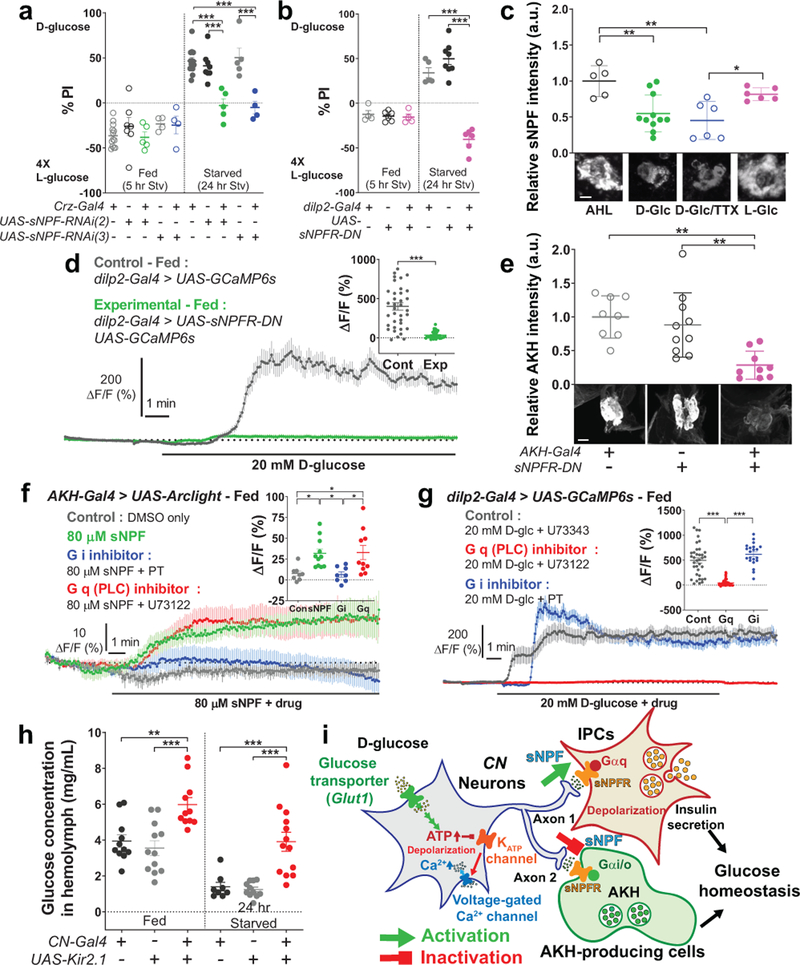
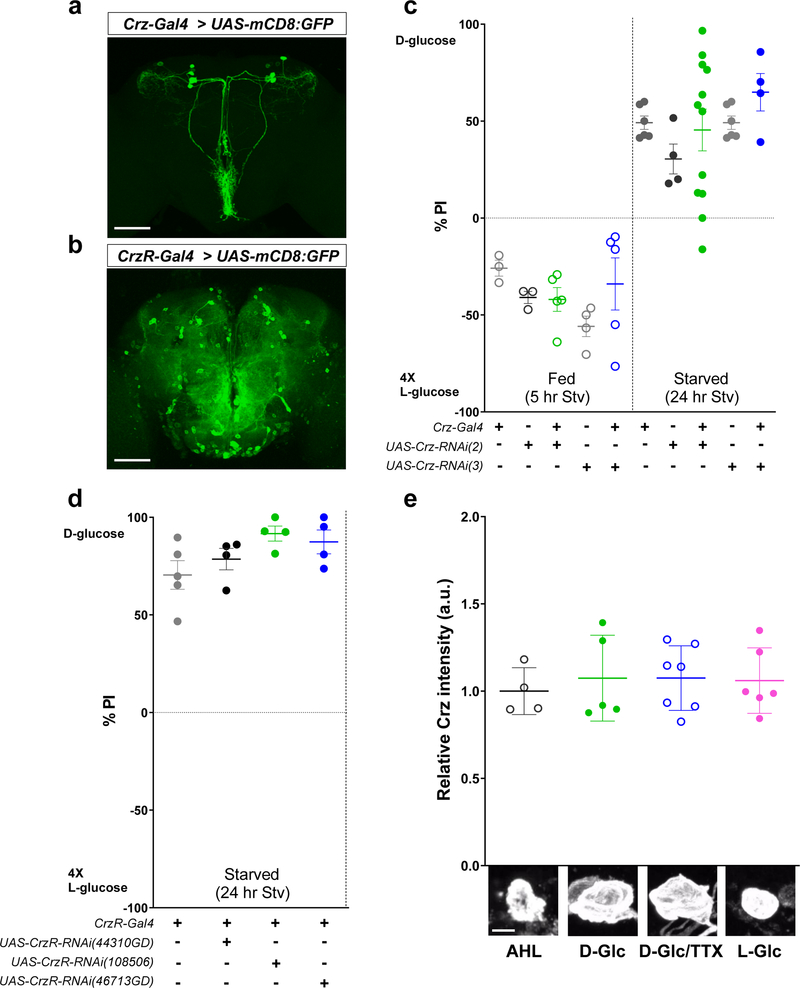
We next inquired which neurotransmitter(s) in axon 1 and axon 2 are important for regulating the functionally opposing synaptic activities. We tested the role for Crz and sNPF in the two-choice behavior using RNAi lines and found that sNPF in CN neurons and sNPF receptor in the postsynaptic IPCs, but not Crz or its receptor, are important (Fig. 5a-b and Extended Data Fig. 9a-d). We also found that sNPF, but not Crz, in CN neurons was significantly reduced when CN neurons were exposed to D-glucose (Fig. 5c and Extended Data Fig. 9e). We observed that approximately a half of the IPCs that had responded to glucose failed to respond glucose when the dominate negative allele of sNPF receptor25 was expressed in IPCs (Fig. 5d and Extended Data Fig. 8g-i). Furthermore, we observed that intracellular AKH levels remained high in AKH-producing cells in fed control flies, but declined significantly in fed flies in which the function of sNPF receptor25 was inhibited in AKH-producing cells (Fig. 5e).
Figure 5.
sNPF is the functional neurotransmitter of CN neurons. a, Knock-down of sNPF in flies carrying Crz-Gal4 and UAS-sNPF-RNAis abolishes a preference for D-glucose in starved flies. b, Expression of UAS-sNPFR-DN by dilp2-Gal4 blunts a preference for D-glucose in starved flies. c, Immunoreactivity of intracellular sNPF in CN neurons when the brains were incubated in 80 mM sucrose (AHL), D-glucose (D-GIc), D-glucose mixed with 0.5 μM TTX (D-GIc/TTX), or L-glucose (L-GIc). Scale bar, 5 μm. d, Average GCaMP traces and ΔF/F (max) quantifications from IPCs of fed flies in which UAS-sNPFR-DN was expressed in IPCs in response to D-glucose, or those of control flies. e, Immunoreactivity of intracellular AKH in CC of flies carrying UAS-sNPFR-DN and AKH-Gal4, or those of control flies. Scale bar, 20 μm. f, Average Arclight traces and ΔF/F (max) quantifications from CC in response to sNPF mixed with Gi inhibitor, pertussis toxin (PT), or Gq (phospholipase C, PLC) inhibitor, U73122, or the DMSO only controls. g, Average GCaMP traces and ΔF/F (max) quantifications from IPCs in response to D-glucose mixed with U73122, PT, or U73343, a non-functional enantiomer of h, Circulating glucose levels of flies in which CN neurons were silenced, or those in control flies. i, Schematics of the functional connectivity among CN neurons, IPCs, and AKH-producing cells. Z-stacked projections are shown. *P < 0.05, **P < 0.01, ***P < 0.001; one-way ANOVA with Tukey post hoc test and unpaired two-tailed t test only for (d). See Supplementary Table 1 for the sample sizes and statistical analyses.
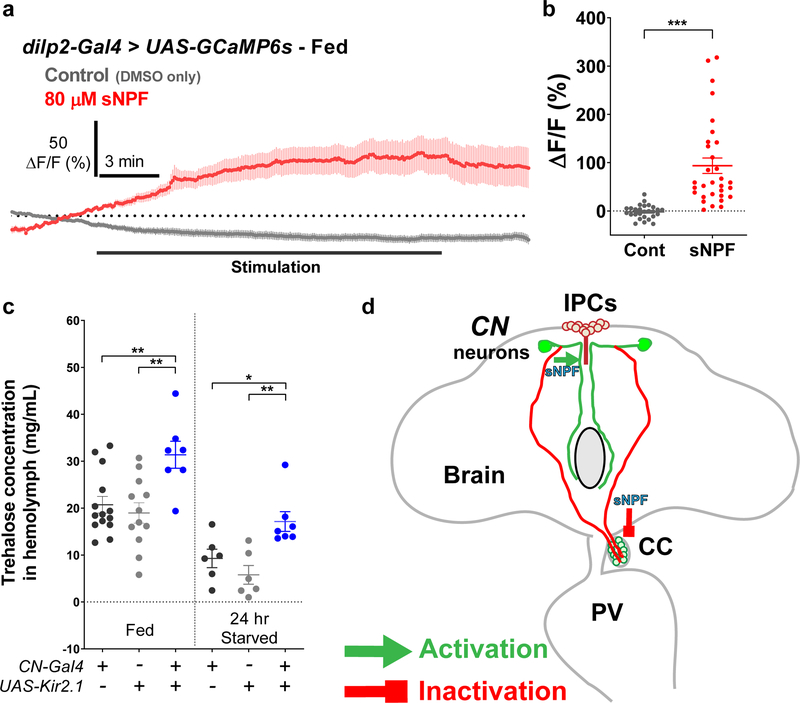
Finally, we determined whether sNPF alters IPCs or/and CC activity. The activity of IPCs was stimulated substantially by the application of sNPF (Extended Data Fig. 10a-b)26, whereas the CC activity was significantly inhibited by sNPF (Fig. 5f). These functionally opposing effects of sNPF are mediated likely by Gq in IPCs and Gi/o in AKH-producing cells through sNPF receptor, which is a G protein coupled receptor27. Exposing the brain to U73122, a PLC inhibitor that inhibits the Gq pathway, eliminated the glucose-evoked activation of IPCs, but had no effect on sNPF-induced inhibition of AKH-expressing cells (Fig. 5f-g). Conversely, exposing the brain to pertussis toxin, a Gi inhibitor, blunted the sNPF-induced inhibition of AKH-producing cells, but had no effect on the glucose-evoked activation of IPCs (Fig. 5f-g). These results indicated that axon 1 and axon 2 can have opposing synaptic activities through a mechanism involving the same neurotransmitter and receptor but with distinct downstream factors coupled with opposing outputs.
To determine whether CN neuronal activity can alter circulating sugar levels in flies, we monitored circulating concentrations of glucose and trehalose in hemolymph, and found that they were significantly increased in flies in which CN neurons were inactivated compared with controls (Fig. 5h and Extended Data Fig. 10c). This finding illustrates that dysfunctional CN neuronal input to IPCs and AKH-producing cells results in a defect in glucose homeostasis.
Discussion
We identified and characterized a pair of glucose-sensing neurons in the Drosophila brain that play an essential role in maintaining glucose homeostasis. This was achieved by counterbalancing the activities of Drosophila equivalents of insulin-and glucagon-producing cells. When food consumption leads to a rise in hemolymph sugar levels, CN neurons excite the IPCs through sNPF and its receptor, which appear to be coupled to the Gq signaling cascade to induce the secretion of dilp2, while suppressing the release of AKH by using the same sNPF receptor, but is coupled with Gi signaling pathway (Fig. 5i and Extended Data Fig. 10d). We speculate that precise control of these opposing functions is further possible because the accompanied nutrient-dependent plastic changes arise from a single cell.
This study represents the discovery of how the activity of the two key endocrine systems is coordinated in metazoans and that their coordination is under the direct control of glucose-sensing neurons. It has been speculated that such coordination may be carried out in mammals through the sympathetic and parasympathetic nerves that connect the pancreatic islets with glucose-sensing neurons in the hypothalamus and hindbrain28. The finding that a large proportion of IPCs respond to glucose through CN neurons in insects raises an intriguing possibility that both direct and indirect mechanisms control endocrine function in mammals29,30. Finally, this work may shed light on the function of glucose-sensing neurons and further research is needed to understand how these regulatory processes are affected by excessive nutrition and other metabolic disturbances, including obesity.
Methods
Fly strains
Flies were raised on standard cornmeal-molasses food (940 mL water, 9 g agar, 15 g yeast, 36 g cornmeal, 36 mL molasses, 1.12 g tegosept, 3.8 mL propionic acid, total 1 L of fly food) at 23 °C with 12/12 hours light-dark cycles. Fly strains were obtained as described in Supplementary Table 2. All the lines used for behavioral testing were backcrossed into w1118 (Bloomington #6326) background for at least 5 generations.
Two-choice assay
The two-choice preference assay was performed as previously described7. Briefly, approximately 30–40 male flies (1–3 days old) were collected under CO2 anesthesia and allowed to recover for 2–3 more days. The flies were starved in an empty vial with wetted Kimwipe with 2–3 mL of distilled water for 5 hours (fed condition) or 24 hours (starved condition). They were introduced into a two-choice arena containing two food sources, 50 mM D-glucose and 200 mM L-glucose, that were colored with a tasteless food dye (1 % of red food dye and 0.7 % of green food dye, McCORMICK) where flies were allowed to feed for 2 hours in the dark. The majority of the flies preferred the sweeter L-glucose (200 mM) when fed, but chose nutritive D-glucose (50 mM) when starved5,7. For experiments using UAS-Kir2.1, tub-Gal80ts, flies were raised at 18 °C before transferring to 30 °C for 48–72 hours to inactivate Gal80 in order to express Kir2.1. Following behavioral testing was conducted at 23 °C. For experiments using flies that do not bear tub-Gal80ts, behavioral testing was conducted at 23 °C. All sugars (D-glucose, D-trehalose, and D-fructose) were purchased from Sigma except L-glucose (Carbosynth). Statistical analyses were performed using GraphPad Prism 8.1.1. Food preference was scored as a percentage of Preference Index (% PI), calculated as shown below:
Two-choice behavioral screening using Vienna Tiles (VT)-Gal4 drives
We ordered over 100 Gal4 drives from the Vienna Drosophila RNAi Center (VDRC, Vienna Tiles (VT)-library)8 for the screening. We conducted two-choice assay screening using 95 VT-Gal4 drivers, which were crossed with UAS-Kir2.1, tub-Gal80ts (inward-rectifier potassium ion channel allele, Kir2.1, with tubulin-temperature sensitive Gal80). Then we found 18 candidate Gal4 drivers, which prefer L-glucose more when they were starved, and inspected the expression pattern of each Gal4 driver. Among those candidates, we narrowed down two Gal4 drivers, VT58471 and VT43147, because a pair of neurons in dorsal-lateral area in the brain were clearly overlapped in those two candidate Gal4 drivers.
Intersectional approach to define CN neurons in a single cell resolution
To define CN neurons in a single cell resolution, we combined LexA-driven flippase (LexAop-FLP) with UAS-FRT-stop-FRT-effector to limit the expression of effector in the areas in which Gal4 and LexA lines overlap. This induced the expression of UAS-FRT-stop-FRT-smGFP31, under the control of CN-Gal4 and another independent R20F11-LexA line. R20F11-LexA also labels CN neurons and exhibited a defect when crossed to LexAop-TNT (tetanus toxin) in the two-choice assay. We also used this approach to induce the expression of UAS-FRT-stop-FRT-TNT, under the control of CN-Gal4 and R20F11-LexA, to silence a pair of CN neurons.
Immunostaining
Immunohistochemistry of the brain, the ventral nerve cord (VNC), corpora cardiaca (CC), and the foregut was conducted as previously described5. Briefly, the brains were dissected in PBS (1.86 mM NaH2PO4, 8.41 mM Na2HPO4, 175 mM NaCl) and fixed in 4 % paraformaldehyde (PFA)/PBS for 30 min at 23 °C. After washing in PBST (PBS + 0.3 % Triton X-100, Invitrogen) (3 times, 10 min each), the brains were blocked in 10 % normal goat serum (NGS, Jackson Immunoresearch, T-005–000-121)/PBST for 1 hour at 23 °C, and then incubated with primary antibodies for 12–48 hours at 4 °C. After washing in PBST (3 times, 10 min each), the sample brains were incubated with secondary antibodies for 12–24 hours at 4 °C and washed again using PBST (3 times, 10 min each). The primary antibodies used as follows: chicken anti-GFP (1:500; Invitrogen, A10262), rabbit anti-GFP (1:500; Invitrogen, A-11122), mouse anti-GFP (1:100; Sigma, G6539, use for synaptobrevin-GRASP), mouse anti-nc82 (1:25; Development Studies Hybridoma Bank, DSHB, AB-2314866), rabbit anti-dsRed (1:500; Clontech, 632496), rabbit anti-corazonin (Crz) (1:500; a gift from Jan Veenstra, Université de Bordeaux, France), rabbit anti-sNPF (1:500; a gift from Jan Veenstra, Université de Bordeaux, France), rabbit anti-dilp2 (1:500; a gift from Ernst Hafen, Institute for Molecular Systems Biology, Zürich, Switzerland), and rabbit anti-AKH (1:500; gifts from Jae H. Park, University of Tennessee, Knoxville, TN, and Seung K. Kim, Stanford University, CA) antibodies. Secondary antibodies used as follows: Alexa Fluor 633 goat anti-rabbit IgG (1:500; Invitrogen, A-21070), Alexa Fluor 555 goat anti-mouse IgG (1:500; Invitrogen, A-21127), Alexa Fluor 555 goat anti-rabbit IgG (1:500; Invitrogen, A27039), Alexa Fluor 488 goat anti-rabbit IgG (1:500; Invitrogen, A27034), Alexa Fluor 488 goat anti-mouse IgG (1:500; Invitrogen), and Alexa Fluor 488 goat anti-chicken IgG (1:500; Invitrogen, A28175). We used Vectashield (Vector Labs, H1000) for mounting the samples. All Images were acquired using a Zeiss LSM 800 confocal microscope (Zeiss) with 25X lens at a 1,024 X 1,024 resolution. Z-stacked images were constructed using ZEN image analyzing software (Carl Zeiss, ZEN 2.3 SP1 FP1, version: 14.0.12.201). Quantifications and statistical analyses were conducted using ImageJ and GraphPad Prism 8.1.1, respectively.
Ex vivo GCaMP and Arclight imaging
Ex vivo calcium imaging using GCaMP6s was performed as described5. Adult male fly brains or corpora cardiaca (CC) cells in the foregut were dissected with artificial hemolymph-like solution (AHL: 108 mM NaCl, 8.2 mM MgCl2, 4 mM NaHCO3,1 mM NaH2PO4, 2 mM CaCl2, 5 mM KCl, 5 mM HEPES, appropriate amount of sucrose to balance osmolarity, the pH was adjusted to 7.3 with 1 M NaOH) and were immobilized by tissue holder (Warner Instruments) on a Sylgard-based perfusion chamber. Sugars (D-glucose, D-trehalose, D-fructose, and sucrose), 2-D-deoxy-glucose, phlorizin, pyruvate, and L-essential amino acids (1 X L-(10)-EAAs: 0.6 mM L-Arg, 0.2 mM L-His, 0.4 mM L-Ile, 0.4 mM L-Leu, 0.4 mM L-Lys, 0.1 mM L-Met, 0.2 mM L-Phe, 0.4 mM L-Thr, 0.05 mM L-Trp, and 0.4 mM L-Val) were purchased from Sigma. Tetanus toxin (TTX), glibenclamide, and nimodipine were purchased from Tocris. We mixed 20 mM D-glucose contained AHL with 0.5 μM TTX, 20 mM 2-D-deoxy-glucose, 1 mM phlorizin, or 5 μM nimodipine. The concentrations of TTX, glibenclamide, 2-D-deoxy-glucose, phlorizin, nimodipine, sucrose, pyruvate, and L-essential amino acids (1 X L-(10)-EAAs) that were used in the experiments were determined based on the pilot experiments. Ex vivo Arclight imaging was performed as previously described with a modification32. Each brain was recorded for 200–500 frames in total (512 X 512 pixels; each frame, 5 sec). After imaging, the condition of the cells was checked by treating 80 mM KCl contained AHL solution. Exchange of different solutions was automatically controlled by a ValveBank controller (AutoMate Scientific). Changes in fluorescent intensity were recorded using a Prairie two-photon microscope and Prairie view software v4.3.2.18 (Prairie Technologies Inc.) with a 40X water immersion lens (Olympus). All Image analyses were conducted using ImageJ. A region of interest (ROI) was centered using StackReg plugin in ImageJ.
Peak amplitude (% ΔF/F) was obtained by subtracting the amplitude of prestimulation baseline (average of 30 frames, 1 frame = 5 sec) from the stimulation-evoked peak amplitude. Oscillation number refers to the total number of calcium oscillations during stimulation. Duration is the length of calcium response during stimulation. Oscillation frequency is a ratio of oscillation numbers/duration. Max ΔF/F (%) = ((Fmax-F0)/F0)*100; Fmax, maximum fluorescence observed during stimulation; F0, average fluorescence of 30 baseline slides. Min ΔF/F (%) = ((Fmin-F0)/F0)*100; Fmin, minimum fluorescence observed during stimulation. Max ΔF/F (%) was used when we calculated the increasing amount of fluorescent signal of cells during stimulation and Min ΔF/F (%) was used when we calculated the decreasing amount of fluorescent signal of cells during stimulation. Min ΔF/F (%) was only used in Fig. 4d. Statistical analyses were conducted with GraphPad Prism 8.1.1.
In vivo GCaMP imaging
In vivo calcium imaging using GCaMP6s was modified from the previous study33. Adult male flies were collected (1–2 days old) and recovered in standard fly food for two more days. They were then fixed on the Sylgard-based perfusion chamber using Epoxy resin (Devcon) and their head cuticles were removed to make a window in order to conduct in vivo calcium imaging. Other procedures are similar with those of ex vivo calcium imaging.
CaLexA measurement
Adult male flies carrying Crz-Gal4 (or CN-Gal4) and CaLexA (UAS-mLexA-VP16-NFAT, LexAop-GFP) were collected 1–2 days after eclosion and recovered for 2–3 more days in standard fly food at 23 °C. A group of flies were dissected and their brains were fixed with 4% PFA/PBS fixation for 20 min without antibody staining (fed flies). Another group of flies after 24 hours of starvation (wet starvation) were dissected and their brains were fixed similarly (starved flies). We refed some of the starved flies with 200 mM D-glucose (with 1 % agar) for 24 hours and their brains were fixed similarly (refed flies). Native CaLexA-driven GFP signals were captured using confocal microscopy (LSM800, Zeiss, 25X lens). The brains were co-stained with anti-Crz antibody. The intensity of CaLexA-driven GFP signal was normalized by the intensity of anti-Crz staining in CN neurons. The CaLexA-driven GFP signal was measured and normalized using corrected total fluorescence (CTF) method34, calculated by subtracting the background endogenous fluorescence from the integrated GFP signal of an area of interest. Z-stacked images were constructed using ZEN software (Zeiss) and analyzed using ImageJ.
Measurement of nutrient-dependent plasticity
To measure nutrient-dependent plasticity of CN axons and presynaptic terminals, adult male flies carrying Crz-Gal4 (or CN-Gal4) and UAS-synaptotagmin (Syt)-GFP were collected 1–2 days after eclosion and recovered for 2–3 more days in standard fly food at 23°C. A group of flies were dissected and their brains were stained by using anti-GFP antibody (fed flies). Another group of flies after 24 hours of starvation (wet starvation) were dissected and their brains were stained similarly (starved flies). We refed some of the starved flies with 200 mM D-glucose (with 1 % agar) for 24 hours and their brains were stained similarly (refed flies). We measured and quantified the number of Syt-GFP+ puncta and the length of axons as described in previous study35. The intensity of Syt-GFP signal was measured and normalized using corrected total fluorescence (CTF) method34, calculated by subtracting the background endogenous fluorescence from the integrated GFP signal of an area of interest. Images were captured by Zeiss LSM 800 confocal microscopy (Zeiss) and were analyzed using ImageJ. Statistical analyses were conducted with GraphPad Prism 8.1.1.
GRASP analysis
In Fig. 3c, experimental flies carrying CN-Gal4, UAS-Neurexin (Nrx)-sGFP1–10, R20F11-LexA, and LexAop-CD4-sGFP11 and control flies carrying CN-Gal4, UAS-Neurexin (Nrx)-sGFP1–10, and LexAop-CD4-sGFP11 were used to examine the physical connectivity between CN neurons and IPCs. We expressed one component of the split-GFP with the presynaptic marker, neurexin, in the CN neurons and another component in the IPCs. In Fig. 4c, experimental flies carrying R20F11-LexA, LexAop-Synaptobrevin (Syb)-GFP1–10, AKH-Gal4, and UAS-CD4GFP11 and control flies carrying R20F11-LexA, LexAop-Syb-GFP1–10, and UAS-CD4-GFP11 were used to examine the physical connectivity between CN neurons and AKH-producing cells. We expressed one component of the split-GFP with the presynaptic marker, synaptobrevin, in the CN neurons and another component in the AKH-producing cells. To measure native GRASP-induced GFP signals, adult male flies were collected 3–5 days after eclosion and their brains were dissected in ice-cold PBS and fixed in 4 % PFA/PBS for 20 min at 23 °C and washed in PBST (3 times, 10 min each). Then the brains were mounted in Vectashield medium (Vector Labs, H1000) without an antibody staining. To measure the synaptobrevin-GRASP23-induced GFP signals, adult male flies were collected 3–5 days after eclosion and their brains were dissected in PBS and fixed in 4 % PFA/PBS for 30 min at 23 °C. These brains were then blocked using 10 % NGS/PBST (1 hour at 23 °C), and washed in PBST (3 times, 10 min each) before subsequent immune-labeling with mouse anti-GFP antibody to probe GFP signals as previously described23. The brains were mounted in Vectashield medium (Vector Labs, H1000) after finishing the primary and secondary antibody staining processes.
Functional connectivity using P2X2 system
1) Experimental flies carrying dilp2-LexA, LexAop-GCaMP6s, CN-Gal4, and UAS-P2X2 and control flies carrying dilp2-LexA, LexAop-GCaMP6s, and UAS-P2X2 were used to examine the functional connectivity between CN neurons and IPCs. 2) Experimental flies harboring R20F11-LexA, LexAop-P2X2, AKH-Gal4, and UAS-GCaMP6s and control flies bearing LexAop-P2X2, AKH-Gal4, and UAS-GCaMP6s, and experimental flies carrying R20F11-LexA, LexAop-P2X2, AKH-Gal4, and UAS-Arclight and control flies harboring LexAop-P2X2, AKH-Gal4, and UAS-Arclight were used to examine the functional connectivity between CN neurons and AKH-producing cells. To clarify the nutrient dependent changes in synapse between CN neurons and IPCs, and between CN neurons and AKH-producing cells, we used normal fly food fed experimental flies, 24-hour-starved (wet starvation) experimental flies, or normal fly food fed control flies. We applied 2.5 mM ATP (Sigma, A26209) for 50 seconds (10 slides, 5 sec in each slide) in AHL saline to excite P2X2 receptor expressing cells. Changes in fluorescent intensity were recorded using a Prairie two-photon microscope with a 40X water immersion lens (Olympus). Image analyses were conducted using ImageJ. A region of interest (ROI) was centered using StackReg plugin in ImageJ. Plotting graphs and statistical analyses were conducted with GraphPad Prism 8.1.1.
Dilp2 and AKH secretion assay
To measure dilp2 secretion/retention, adult male flies (1–3 days old) were collected under CO2 anesthesia and allowed to recover for 2–3 more days in standard fly food. A group of flies were starved with water (wet starvation) for 24 hours. Their brains were dissected and stained using anti-dilp2 antibody. Some of the starved flies were refed with 200 mM D-glucose (with 1 % agar) for 24 hours, and their brains were dissected and stained using anti-dilp2 antibody. All the processes were conducted at 23 °C. To measure AKH secretion/retention, adult male flies (1–3 days old) were collected under CO2 anesthesia and allowed to recover for 2–3 more days in standard fly food. Their brains were dissected and stained using anti-AKH antibody as described. The analysis of Z-stacked images was performed using ZEN software (Zeiss) and ImageJ.
Quantitation of Drosophila insulin-like peptide 2 (dilp2) and adipokinetic hormone (AKH) by Parallel Reaction Monitoring (PRM) mass spectrometry
Hemolymph of 500–600 flies that were fed with standard fly food was collected and pooled as previously described36. Dilp2 and AKH were extracted from the control (UAS-Kir2.1/+) and experimental (UAS-Kir2.1/CN-Gal4, CN silenced) samples using two volumes of cold ethanol following as a previously described method with modification37; 100 μL of hemolymph was mixed with 200 μL of ice cold ethanol (Fisher Scientific, 90 % ethyl alcohol (v/v) with 5 % isopropanol and 5 % methanol) and incubated at −20 °C for 30 min, then centrifuged at 15,000 X g for 20 min. Supernatants were carefully removed and dried to a small droplet by vacuum centrifugation. Extracts were solubilized in 100 μL of 100 mM ammonium bicarbonate and disulfide bonds reduced with 500 mM dithiothreitol to a final concentration of 10 mM DTT for 1 hour at 37 °C. Cysteines were alkylated with iodoacetamide (200 mM) to a final concentration of 40 mM at 37 °C for 1 hour in the dark. Excess iodoacetamide was quenched by adding DTT to a final concentration of 40 mM with incubation for 30 min, in the dark, at room temperature. Samples were each digested with 800 ng-1 μg of Trypsin (Trypsin Gold, Mass Spectrometry Grade, Promega) overnight, and after acidification with 10 % formic acid (final concentration of 0.5–1 % formic acid), resulting peptides were desalted using hand packed reversed phase Empore C18 Extraction Disks (3M, St. Paul, MN, USA) using a previously described method38. Desalted peptides were concentrated to a small droplet by vacuum centrifugation and reconstituted in 10 μL 0.1 % formic acid in water. 10 % of the peptide material was used for data-dependent-acquisition (DDA) and 50 % used for targeted parallel reaction monitoring (PRM) liquid chromatography followed by tandem mass spectrometry (LC-MS/MS). A Q Exactive HF mass spectrometer was coupled directly to an EASY-nLC 1000 (Thermo Fisher Scientific, Waltham, MA, USA) equipped with a self-packed 75 μm x 20 cm reverse phase column (ReproSil-Pur C18, 3 μM, Dr. Maisch GmbH, Germany) for peptide separation. Analytical column temperature was maintained at 50 °C by a column oven (Sonation GmBH, Germany). Peptides were eluted with a 3–40 % acetonitrile gradient over 110 min at a flow rate of 250 nL/min. For DDA, the mass spectrometer was operated in DDA mode with survey scans acquired at a resolution of 120,000 (at m/z 200) over a scan range of 300–1750 m/z. Up to 15 most abundant precursors from the survey scan were selected with an isolation window of 1.6 Th and fragmented by higher-energy collisional dissociation with normalized collision energy (NCE) of 27. The maximum injection time for the survey and MS/MS scans was 60 ms and the ion target value (AGC) for both scan modes was set to 3e6. For PRM analysis, 1 full MS scan was acquired at 60,000 resolution followed by MS/MS of 9 target precursor m/z loaded as the inclusion list. Each PRM target peptide was analyzed at resolution 15,000 with isolation window of 1.4 Th. The ion target value was set to 5e5.
Mass spectrometry data processing.
RAW files generated from the DDA experiments were analyzed by MaxQuant proteomics software39 (version 1.5.7.0) using a Drosophila fasta (19,694 entries) database. Files from PRM experiments were analyzed with Thermo Scientific Xcalibur (version 4.1.31.9) software. Layouts containing target precursor and fragment masses were created with a mass accuracy set to 5 ppm. At specific events when MS1 and MS/MS fragments were aligned, the intensity of each specific precursor and fragment were extracted and noted. Additional confirmation of the analysis was carried out using Skyline (version 4.10.18169) Proteomics software40. Ion intensity extraction and alignment of spectra were visually inspected and confirmed in each case. Processed intensities of dilp2 B chain, AKH, and those fragment ions were normalized by the estimated total protein level (top 3 precursor intensity of top 99 proteins) in the hemolymph. Normalization of precursor peptide and fragment intensities were done by analyzing the DDA spectra from each set of replicate control and experimental samples by MaxQuant label-free quantitative analysis; intensities of top three peptides from proteins found in both samples were summed and compared (see Supplementary Table 3). The nomenclature for peptide fragmentation during mass spectrometry was described in previous studies41,42.
Note: We also performed several experiments using methanol to extract peptides from the hemolymph43. The dilp2 and AKH quantitation results from those PRM experiments were consistent with results obtained using the ethanol extracted materials presented in this manuscript, but contained additional contaminants that interfered with liquid chromatography (data not shown).
Dot blot assay
Hemolymph of 60–80 flies that were fed with standard fly food was collected as previously described36. The total protein in the hemolymph was measured by Bradford (Bio-Rad) and the concentration is adjusted to 1 mg/mL in PBS44. 10 μL of hemolymph was dropped on 0.2 μm nitrocellulose membrane (GE Healthcare, Uppsala, CA, USA) and left at room temperature until to be dried. The membrane was then boiled in PBS for 3 min and subsequently fixed in 4 % PFA/PBS for another 20 min. The membrane was blocked with 3% bovine serum albumin (BSA) in PBS for 1 hour at room temperature (21 °C) and then incubated with mouse anti-HA (1:500; Covance, 901501) antibody or purified rabbit anti-AKH antibody (1:500; a gift from Seung K. Kim, Stanford University, CA.) in 3 % BSA/PBS at 4 °C for overnight followed by incubation with HRP-conjugated secondary antibodies in 3 % BSA/PBS for 1 hour at room temperature (21 °C). Pdilp2-dilp2-HA36 line was used for detecting dilp2 in the hemolymph. The membrane was developed using Chemidoc M (Bio-Rad, Hercules, CA, USA). The black dots intensity was considered the levels of dilp2 and AKH in flies. Ponceau staining was utilized as loading control. The quantification and analysis of dot blot results were conducted using Fiji software and GraphPad Prism 8.1.1, respectively. For gel source data, see Supplementary Figure 1.
Measurement of intracellular sNPF and Crz levels in CN neurons
Intracellular sNPF and Crz levels after incubating with sugars were measured as previously described5. The brains of 18-hour-starved flies in which UAS-mCD8:GFP was expressed in the Crz-expressing neurons (Crz-Gal4 > UAS-mCD8:GFP) were dissected in cold AHL (sugar free), incubated in 80 mM sucrose (AHL), 80 mM D-glucose (D-Glc), 80 mM D-glucose mixed with 0.5 μM TTX (D-Glc/TTX), or 80 mM L-glucose (L-Glc) contained AHL for 30 min and then fixed with 4 % PFA/PBS and stained with anti-sNPF or anti-Crz antibodies as described earlier. All Images were acquired using a Zeiss LSM 800 confocal microscope (Zeiss) with 25X lens at a 1,024 X 1,024 resolution. Z-stacked images were constructed using ZEN image analyzing software (Zeiss). Quantifications and statistical analyses were conducted using ImageJ and GraphPad Prism 8.1.1, respectively.
Classification of the IPCs into three sub-populations
When Max ΔF/F (%) of a cell is higher than 50 % of average Max ΔF/F (%) of control brains, we counted the cell as an “activated” cell by the stimulation. We classified the IPCs into “activated” or “inactivated” cells after treating D-glucose or KATP channel blocker with or without the function of CN neurons or sNPF receptor in IPCs. Using this calculation, we categorized IPCs into three sub-populations. In Fig. 3h, 74.42 % of IPCs (32/43 cells) in control flies carrying R20F11-LexA, dilp2-Gal4, and UAS-GCaMP6s responded to D-glucose, whereas 25.58 % of the IPCs (1¼3 cells) failed to respond to D-glucose. 20.69 % of IPCs (12/58 cells) responded to D-glucose in experimental flies carrying R20F11-LexA, LexAop-TNT, dilp2-Gal4, and UAS-GCaMP6s, whereas 53.73 % of the IPCs failed to respond to glucose. In Extended Data Fig. 8d, 71.43 % of IPCs (20/28 cells) in control flies carrying R20F11-LexA, dilp2-Gal4, and UAS-GCaMP6s responded to glibenclamide, whereas 28.57 % of the IPCs (8/28 cells) failed to respond to glibenclamide. 23.08 % of IPCs (9/39 cells) in experimental flies carrying R20F11-LexA, LexAop-TNT, dilp2-Gal4, and UAS-GCaMP6s responded to glibenclamide, whereas 48.35 % of the IPCs failed to respond to glibenclamide. In Extended Data Fig. 8g, 75.68 % of IPCs (28/37 cells) in control flies carrying dilp2-Gal4 and UAS-GCaMP6s responded to D-glucose, whereas 24.32 % of the IPCs (9/37 cells) failed to respond. 27.27 % of IPCs (9/33 cells) responded to D-glucose in experimental flies carrying dilp2-Gal4, UAS-sNPFR-DN, and UAS-GCaMP6s, whereas 48.41 % of the IPCs failed to respond.
sNPF neuropeptide treatment to the IPCs and CC
sNPF neuropeptide was administrated to IPCs and CC using a modified method from a previous study26. sNPF was purchased from Thermo Fisher Scientific (sequence: AQRSPSLRLRF, purity > 95 %, unmodified). We made 50 mM stock solution of sNPF in DMSO (Sigma, D2650) and keep it at −80 °C. Pertussis toxin (Tocris, 3097), U73122 (Tocris, 1268), or U73343 (Tocris, 4133) was mixed with D-glucose or sNPF and treated to IPCs in the brain or AKH-producing cells in CC. We mixed 80 μM sNPF or 20 mM d-glucose contained AHL with 1 ng/μL pertussis toxin (PT), 1 μM U73122, or 1 μM U73343 (a non-functional enantiomer of U73122). The concentrations of PT, U73122, and U73343 that were used in the experiments were determined based on the pilot experiments.
Hemolymph glycemia measurement
Hemolymph glucose and trehalose levels were measured as previously described5. Briefly, 30–40 flies starved with water for 24 hours (starved) or fed with standard fly food (fed) were decapitated and their hemolymph was collected with a capillary pipette (0.25 μL Microcaps, Drummond). 0.25 μL of the hemolymph was mixed with 50 μL of Glucose (HK) Assay Kit (Sigma, GAHK20) and incubated for 20 min at 23 °C, and then measured the absorbance at 340 nm using a Nanodrop spectrophotometer (Thermo Scientific). To measure trehalose concentrations in the hemolymph, pig kidney trehalase (1:500, Sigma, T8778) was added to the mixture of Glucose Assay Kit and incubated for 16–20 hours at 37 °C, and then measured the absorbance at 340 nm. Standard curves (D-glucose and D-trehalose) were generated for each trial. Plotting graphs and statistical analyses were conducted with GraphPad Prism 8.1.1.
Statistics and reproducibility
All statistical analyses were conducted with GraphPad Prism 8.1.1 (provided by NYU School of Medicine). For comparing two normally distributed groups, unpaired two-tailed t tests were used. For multiple comparisons between normally distributed groups, oneway ANOVAs followed by Tukey’s post hoc test were used (see Supplementary Table 1). Without an asterisk means non-significant (P > 0.05). The statistical analyses presented in this manuscript were assisted by a statistics expert (Dr. Xiaochun Li) in NYU. For the two-choice behavioral data (Figs. 1b, e, 5a, b, Extended Data Figs. 1a, d, 2c, 4a-c), each data point (dot) represents a biological replicate bearing 30~40 male flies for a trial. For ex vivo imaging data using GCaMP6s or Arclight (Figs. 2c, d, 3d, g, 4d, e, 5d, f, g, Extended Data Figs. 3b-e, 3g-j, 4e-h, 6b, 8c, 10b), each data point (dot) represents a biological replicate of maximum or minimum amplitudes of ΔF/F (%) during the experimental period. In Extended Data Fig. 6c-f, each average trace contains at least three biological replicates. For confocal fluorescent image of the brains or CCs stained with antibodies (Figs. 2e-g, 3a, b, c, e, 4a, b, c, f, 5c, e, Extended Data Figs. 4i, j, 5, 9e), we present the exact number of biological replicates in Supplementary Table 1. Moreover, the representative images (Figs. 1a, c, d, 2a, 3c, 4c, Extended data Figs. 1c, 2a, b, 9a, b) were independently replicated more than five times. For the mass spectrophotometry and dot blot assay (Figs. 3f, 4g, Extended Data Fig. 7g-j), each data point (dot) or a trial represents a biological replicate bearing 500~600 flies for mass spectrophotometry and 60~80 flies for the dot blot assay. For the two-choice behavioral and ex vivo imaging experiments, we repeated more than 3 times based on our pilot experiments. For the behavioral experiments, we did not include two or three independent pilot experiments because the experimental setups were not clearly controlled. However, they had qualitatively similar results; yet, the standard deviations were substantially high.
Extended Data
Extended Data Figure 1.
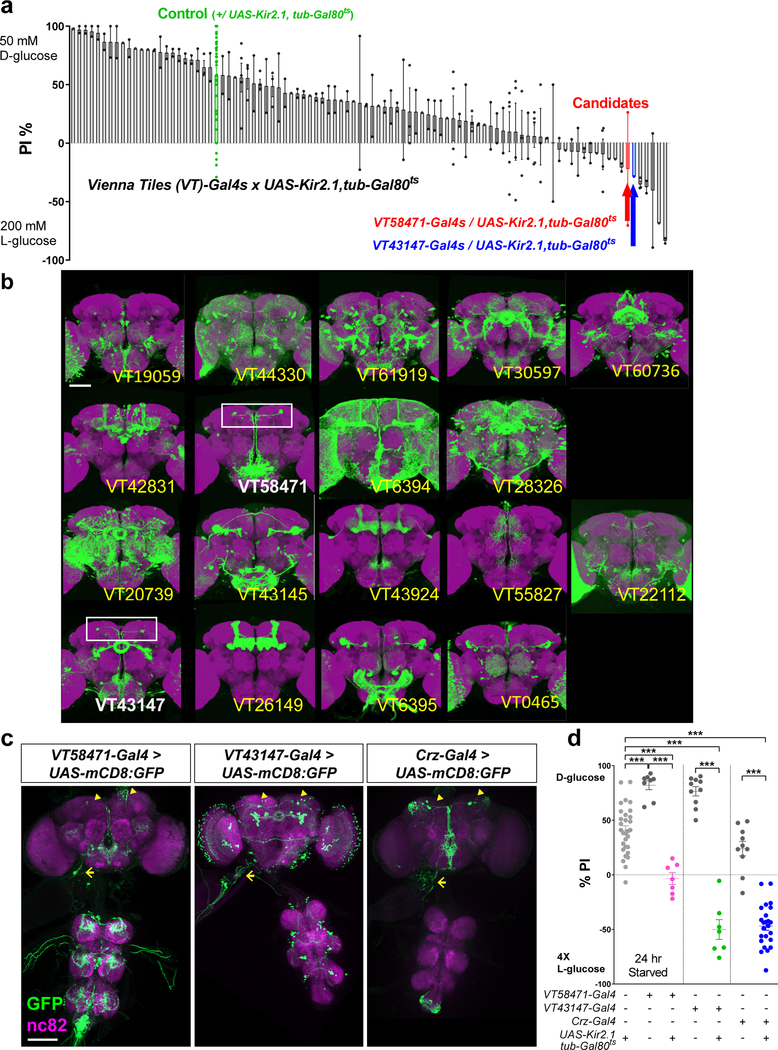
Identification of neurons that are required for the starvation-induced nutrient selection. a, The result of a screen for Vienna tiles (VT)-Gal4 lines when bearing UAS-Kir2.1, tub-Gal80ts that failed to select D-glucose after 24 hours of starvation. b, Expression patterns of 18 candidate Gal4 lines isolated from the screen. Scale bar, 100 μm. Brain images from FlyLight Gal4/LexA collection are shown. White boxes denote a pair of the dorsolateral cells. c, Expression patterns of VT58471-Gal4 > UAS-mCD8:GFP line, VT43147-Gal4 > UAS-mCD8:GFP line, and Crz-Gal4 > UAS-mCD8:GFP line in the brain, the ventral nerve cord (VNC), and a part of the foregut, stained with anti-GFP (green) antibody. Neuropil is stained with nc82 (anti-bruchpilot, magenta) antibody. Cell bodies of candidate neurons (arrowheads) and their projections to the foregut (arrows) are shown. Scale bar, 100 μm. Z-stacked projections are shown. d, Inactivation of the candidate neurons by expressing UAS-Kir2.1, tub-Gal80ts under the control of VT58471-Gal4, VT43147-Gal4, or Crz-Gal4 at 30 °C blunts a preference for D-glucose in starved flies. ***P < 0.001; one-way ANOVA with Tukey post hoc test. See Supplementary Table 1 for the sample sizes and statistical analyses.
Extended Data Figure 2.
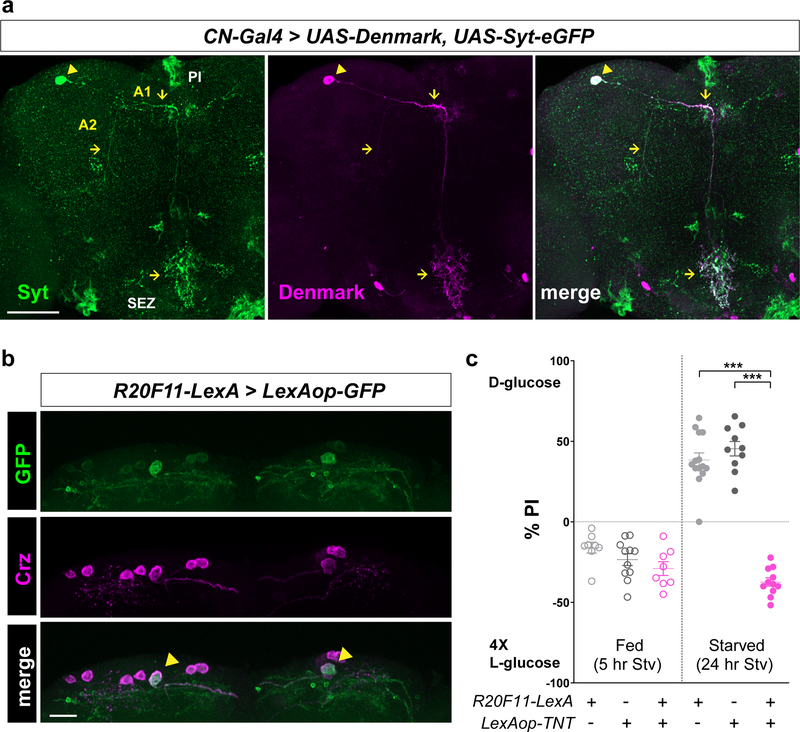
Axons and dendrites of CN neurons and a functional LexA line that can label a pair of CN neurons. a, Axons and dendrites of CN neurons in the brain visualized by an axonal marker, UAS-Syt-eGFP, and a dendritic marker, UAS-Denmark, under the control of CN-Gal4, stained with anti-GFP (green) and anti-dsRed (Denmark, magenta) antibodies. Arrowheads denote CN cell bodies, and arrows indicates CN axons (left) and dendrites (middle). b, The brain of a fly carrying R20F11-LexA and LexAop-GFP, stained with anti-GFP (green) antibody. Cell bodies of CN neurons are stained with anti-Crz (magenta) antibody. Arrowheads indicate cell bodies of the dorsolateral CN neurons. Scale bar, 20 μm. c, Inactivation of CN neurons by expressing LexAop-TNT under the control of R20F11-LexA blunts a preference for D-glucose in starved flies. A1, Axon 1; A2, Axon 2; SEZ, subesophageal zone; PI, pars intercerebralis. Scale bar, 50 μm. Z-stacked projections are shown. ***P < 0.001; one-way ANOVA with Tukey post hoc test. See Supplementary Table 1 for the sample sizes and statistical analyses.
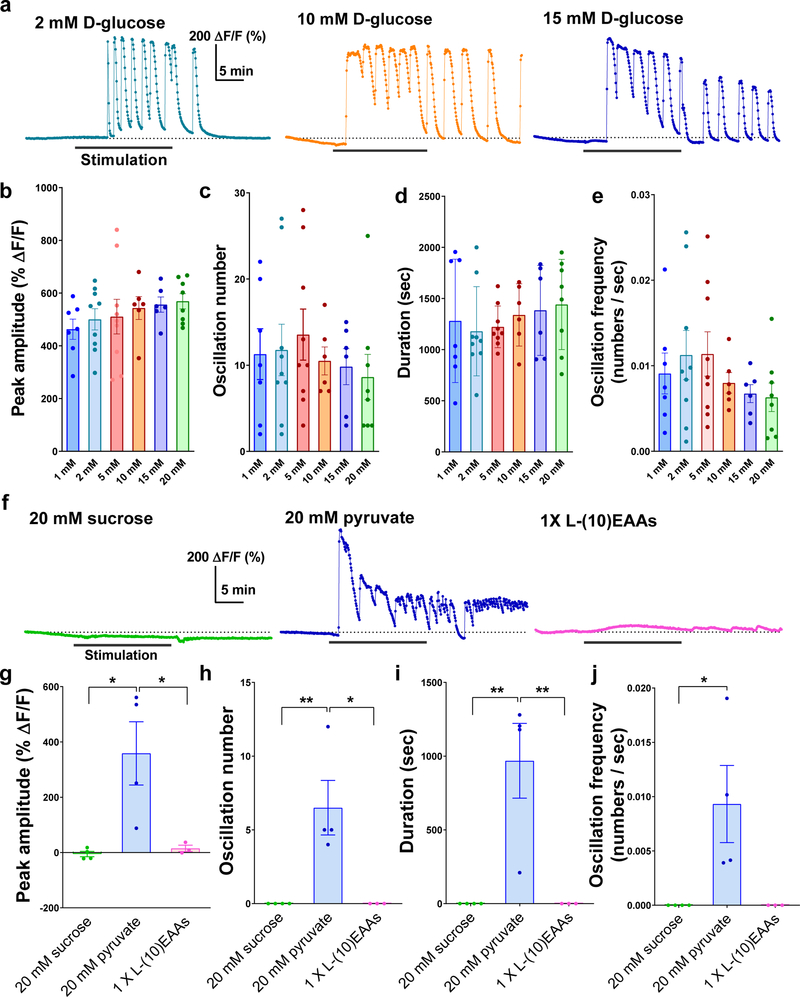
Extended Data Figure 3.
The activity of CN neurons is stimulated by glucose or pyruvate, but not by sucrose or a mixture of 10 essential amino acids. a, Representative traces of CN neuronal activity in response to 2 mM, 10 mM, and 15 mM D-glucose. b-e, Quantifications of CN responses to 1 mM, 2 mM, 5 mM, 10 mM, 15 mM, and 20 mM D-glucose. When 1 to 5 mM D-glucose were applied, all the parameters were increased. When higher concentrations of D-glucose (10 to 20 mM D-glucose) were applied, the oscillation number (c) and oscillation frequency (e) were decreased while the peak amplitude (b) and duration (d) were increased. f, Representative traces of CN neuronal activity in response to 20 mM sucrose, 20 mM pyruvate, and a mixture of 1X L-(10)-essential amino acids (EAAs). g-j, Quantifications of CN neuronal responses to 20 mM sucrose, 20 mM pyruvate, and a mixture of 1 X L-(10)-EAAs. *P < 0.05, **P < 0.01; oneway ANOVA with Tukey post hoc. See Supplementary Table 1 for the sample sizes and statistical analyses.
Extended Data Figure 4.
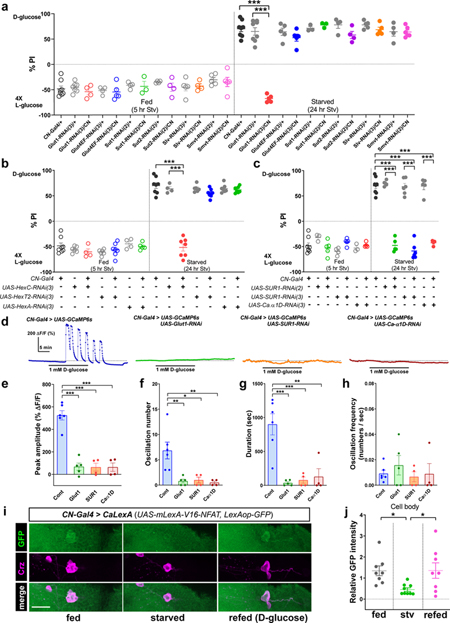
Glucose transporter 1 (Glutl), Hexokinase C (Hex-C), KATP channel, and voltage-gated calcium channel are required in CN neurons for sensing glucose and the activity of CN neuron is determined by the internal energy state in live animals. a, Inactivation of glucose transporter 1 (Glutl) by expressing UAS-Glut1-RNAi under the control of CN-Gal4 blunts a preference for D-glucose in starved flies, but not other glucose transporters. b, Inactivation of Hex-C by expressing UAS-HexC-RNAi under the control of CN-Gal4 blunts a preference for D-glucose in starved flies, but not other hexokinases (Hex-T2 and Hex-A). c, Inactivation of KATP channel or voltage-gated calcium channel by expressing UAS-SUR1-RNAi or UAS-Ca-α1D-RNAi by CN-Gal4 blunts a preference for D-glucose in starved flies. d-h, Representative traces (d) and quantifications (e-h) of calcium responses to 1 mM glucose by CN neurons of flies in which glucose transporter 1 (Glutl), KATP channel subunit (SURI), or voltage-gated calcium channel subunit (Ca-α1D) was knocked-down by expressing each RNAi line, or those of control flies. i-j, Representative images (i) and quantifications of native CaLexA-driven GFP intensity from Cn cell bodies (j) of fed, starved, or refed flies carrying CN-Gal4 and CaLexA (UAS-mLexA-VP16-NFAT, LexAop-GFP). Cell bodies of CN neurons are stained with anti-Crz (magenta) antibody. Scale bar, 20 μm. Z-stacked projections are shown. *P < 0.05, **P < 0.01, ***P < 0.001; one-way ANOVA with Tukey post hoc test. See Supplementary Table 1 for the sample sizes and statistical analyses.
Extended Data Figure 5.
Nutrient-dependent plasticity does not occur in neurons other than a pair of the dorsolateral CN neurons. a-d, The relative fluorescent intensities of Syt-GFP signal (a, b) and the branch lengths of (c, d) axon 1 (neurite to IPCs, a, c) and axon 2 (neurite to CC, b, d) in fed, starved, or refed flies carrying Crz-Ga4 and UAS-Syt-GFP. e-h, Representative images (e) and quantifications (f-h) of the number of Syt-GFP+ puncta in fed, starved, or refed flies carrying Crz-Gal4 and UAS-Syt-GFP in the dorsal lateral area (DL, f), the medial lateral area (ML, g), and the subesophageal zone (SEZ, h). Arrowheads and arrows indicate Syt-GFP+ puncta on axon 1 and axon 2, respectively. Scale bar, 50 μm. Z-stacked projections are shown. *P < 0.05, **P < 0.01, ***P < 0.001; one-way ANOVA with Tukey post hoc test. See Supplementary Table 1 for the sample sizes and statistical analyses.
Extended Data Figure 6.
CN neurons expressing P2X2 receptor can be readily activated by ATP application and Dh44 neurons and CN neurons are not functionally coupled. a-b, Average GCaMP traces (a) and their ΔF/F (max) quantifications (b) of CN neurons when exposed to 2.5 mM ATP. c, Average GCaMP trace of flies carrying Dh44-Gal4 and UAS-GCaMP6s in response to ATP. d, Average GCaMP trace of flies carrying Dh44-Gal4, UAS-GCaMP6s, Dh44-LexA, and LexAop-P2X2 in response to ATP. e, Average GCaMP trace of flies carrying Crz-Gal4, UAS-GCaMP6s, Dh44-LexA, and LexAop-P2X2 in response to ATP. f, Average GCaMP trace of flies carrying Dh44-Gal4, UASGCaMP6s, R20F11-LexA, and LexAop-P2X2 in response to ATP. ***P < 0.001; one-way ANOVA with Tukey post hoc test. See Supplementary Table 1 for the sample sizes and statistical analyses.
Extended Data Figure 7.
The circulating levels of dilp2 and AKH in hemolymph are measured by mass spectrometry and dot blot assay. a, Sequences of dilp2, AKH, tryptic peptide of dilp2 B chain, and tryptic peptide of AKH. We detected dilp2 B chain at m/z (mass to charge ratio): 369.1785 (“TLCSEK”, M2H+: 369.1785) and AKH at m/z: 497.2374 (“QLTFSPDW”, M2H+: 497.2374). b, Nomenclature and m/z values of fragment ions (N-terminal directed “a” and “b” ions, as well as, C-terminal directed “y” ions) which is driven by dilp2 B chain and AKH. c-d, Relative extracted ion intensities for the dilp2 B chain and its fragment ions in each trial (c), and AKH and its fragment ions in each trial (d) generated from the hemolymph of fed flies in which CN neurons were inactivated, or those of control flies; see Methods. e-f, A dot blot (e) and its quantification (f) show the levels of dilp2 in the hemolymph of wild type (w1118), UAS-Kir2.1/CN-Gal4; dilp2-HA, and UAS-Kir2.1/+; dilp2-HA flies, probed with anti-HA antibody to detect dilp2. Because w1118 flies do not express dilp2-HA, they were used as a negative control. g-h, A dot blot (g) and its quantification (h) show the levels of AKH in the hemolymph of CN-Gal4/+, UAS-Kir2.1/+, and UAS-Kir2.1/CN-Gal4 flies, probed with anti-AKH antibody. The intensity of black dots in red dotted circle represents the quantity of dilp2 or AKH level that was later normalized to Ponceau staining. For gel source data, see Supplementary Figure 1. **P < 0.01, ***P < 0.001; unpaired two-tailed t test for (f) and one-way ANOVA with Tukey post hoc test for (h). See Supplementary Table 1 for the sample sizes and statistical analyses.
Extended Data Figure 8.
Calcium responses of IPCs to D-glucose or KATP channel blocker in flies with inactivated CN neurons or with non-functional sNPF receptor. a-b, Individual traces of the IPCs in control flies carrying R20F11-LexA, dilp2-Gal4, and UAS-GCaMP6s (a) and in experimental flies carrying R20F11-LexA, LexAop-TNT, dilp2-Gal4, and UAS-GCaMP6s (b) responding to D-glucose. c, Average GCaMP traces and ΔF/F (max) quantifications from the IPCs of fed flies in which CN neurons were inactivated by TNT in response to KATP channel blocker, glibenclamide, or those of control flies. d, IPCs comprise three sub-populations according to their response to glibenclamide; see Methods. e-f, Individual traces of the IPCs in control flies (e) and in flies in which CN neurons were inactivated by TNT (f) responding to glibenclamide. Because a saturating concentration of D-glucose (20 mM) was used to quantify the populations of IPCs, 100 μM glibenclamide, a saturating concentration for glibenclamide according to our control experiments, was also used. g, IPCs comprise three sub-populations according to their response to glucose with our without sNPF receptor; see Methods. h-i, Individual traces of IPCs in control flies (h) and in flies in which sNPF receptor was rendered non-functional by expressing dominant negative allele of sNPF receptor in the IPC (i) responding to d-glucose. ***P < 0.001; unpaired two-tailed t test for (c). See Supplementary Table 1 for the sample sizes and statistical analyses.
Extended Data Figure 9.
Crz neuropeptide is not required in CN neurons for the two-choice behavior. a-b, Expression of Gfp in the brains of the flies carrying Crz-Gal4 and UAS-mCD8:GFP (a), or CrzR (Crz receptor)-Gal4 and UAS-mCD8:GFP (b). Scale bar, 100 μm. c-d, Knock-down of Crz or Crz receptor in flies carrying Crz-Gal4 and UAS-Crz-RNAis (c), or CrzR-Gal4 and UAS-CrzR-RNAis (d), respectively, does not eliminate the selection of D-glucose in starved flies. e, Immunoreactivity of intracellular Crz in CN neurons, probed with anti-Crz antibody, when the brains were incubated in 80 mM sucrose (AHL), 80 mM D-glucose (D-Glc), 80 mM D-glucose mixed with 0.5 μM TTX (D-Glc/TTX), or 80mM L-glucose (L-Glc) contained AHL. Scale bar, 5 μm. Z-stacked projections are shown. One-way ANOVA with Tukey post hoc test for (c, e) and unpaired two-tailed t test for (d). See Supplementary Table 1 for the sample sizes and statistical analyses.
Extended Data Figure 10.
The activity of IPCs were stimulated by sNPF application and the circulating trehalose level in which CN neurons were inactivated was reduced. a-b, Average GCaMP traces (a) and ΔF/F (max) quantifications (b) from the IPCs in response to 80 μM sNPF contained AHL, or those of the DMSO contained AHL. c, An increase in circulating trehalose level in fed or starved flies in which CN neurons were inactivated. The levels of circulating trehalose in flies carrying CN-Gal4 and UAS-Kir2.1 and its heterozygote controls (CN-Gal4/+ and UAS-Kir2.1/+) when they are fed or starved. d, A working model of the anatomic connectivities between CN neurons and IPCs (green), and between CN neurons and AKH-producing cells (red). CN neurons regulates glucose homeostasis by counter-balancing the activities of IPCs and AKH-producing cells through sNPF neurotransmitter that activates the IPCs and inactivates the AKH-producing cells. *P < 0.05, **P < 0.01, ***P < 0.001; unpaired two-tailed t test for (b) and one-way ANOVA with Tukey post hoc test for (c). See Supplementary Table 1 for the sample sizes and statistical analyses.
Supplementary Material
Acknowledgements
We thank Drs. Makoto Kanai and Jin-Yong Park for providing expertise on the two-choice behavior assay and physiology. We also thank Drs. Seung K. Kim, Jan Veenstra, Jae H. Park, and Ernst Hafen for providing antibodies used in this study; Drs. Barry Levin, Gary Schwartz, Hail Kim, and the Suh lab members for stimulating discussion. This work is supported by NIH R01 grants (R01DK116294, R01DK106636 to G.S.B.S. and NINDS P30NS050276 to T.A.N.), KAIST Chancellor’s fund and a grant from Samsung Science & Technology Foundation (G.S.B.S).
Footnotes
Competing interests
The authors declare no competing interests.
Data availability
Raw mass spectrometry files have been deposited in the MassIVE database (https://massive.ucsd.edu/ProteoSAFe/static/massive.jsp); with MassIVE accession ID: MSV000083796. All other raw data are available from the corresponding author on reasonable request.
References
- 1.Mayer J Glucostatic mechanism of regulation of food intake. N. Engl. J. Med. 249, 13–16 (1953). [DOI] [PubMed] [Google Scholar]
- 2.Oomura Y et al. Reciprocal activities of the ventromedial and lateral hypothalamic areas of cats. Science 143, 484–485 (1964). [DOI] [PubMed] [Google Scholar]
- 3.Parton LE et al. Glucose sensing by POMC neurons regulates glucose homeostasis and is impaired in obesity. Nature 449, 228–232 (2007). [DOI] [PubMed] [Google Scholar]
- 4.Levin BE Neuronal glucose sensing: still a physiological orphan? Cell Metab. 6, 252–254 (2007). [DOI] [PubMed] [Google Scholar]
- 5.Dus M et al. Nutrient sensor in the brain directs the action of the brain-gut axis in Drosophila. Neuron 87, 139–151 (2015). [DOI] [PMC free article] [PubMed] [Google Scholar]
- 6.López-Gambero AJ, Martínez F, Salazar K, Cifuentes M & Nualart F Brain glucose-sensing mechanism and energy homeostasis. Mol. Neurobiol. 56, 769796 (2019). [DOI] [PubMed] [Google Scholar]
- 7.Dus M, Min S, Keene AC, Lee GY & Suh GSB Taste-independent detection of the caloric content of sugar in Drosophila. Proc. Natl. Acad. Sci. USA 108, 11644–11649 (2011). [DOI] [PMC free article] [PubMed] [Google Scholar]
- 8.Pfeiffer BD et al. Tools for neuroanatomy and neurogenetics in Drosophila. Proc. Natl. Acad. Sci. USA 105, 9715–9720 (2008). [DOI] [PMC free article] [PubMed] [Google Scholar]
- 9.Tayler TD, Pacheco DA, Hergarden AC, Murthy M & Anderson DJ A neuropeptide circuit that coordinates sperm transfer and copulation duration in Drosophila. Proc. Natl. Acad. Sci. USA 109, 20697–20702 (2012). [DOI] [PMC free article] [PubMed] [Google Scholar]
- 10.Kapan N, Lushchak OV, Luo J & Nässel DR Identified peptidergic neurons in the Drosophila brain regulate insulin-producing cells, stress responses and metabolism by coexpressed short neuropeptide F and corazonin. Cell. Mol. Life Sci. 69, 4051–4066 (2012). [DOI] [PMC free article] [PubMed] [Google Scholar]
- 11.Kim SK & Rulifson EJ Conserved mechanisms of glucose sensing and regulation by Drosophila corpora cardiaca cells. Nature 431, 316–320 (2004). [DOI] [PubMed] [Google Scholar]
- 12.Lee G & Park JH Hemolymph sugar homeostasis and starvation-induced hyperactivity affected by genetic manipulations of the adipokinetic hormoneencoding gene in Drosophila melanogaster. Genetics 167, 311–323 (2004). [DOI] [PMC free article] [PubMed] [Google Scholar]
- 13.Sweeney ST, Broadie K, Keane J, Niemann H & O’Kane CJ Targeted expression of tetanus toxin light chain in Drosophila specifically eliminates synaptic transmission and causes behavioral defects. Neuron 14, 341–351 (1995). [DOI] [PubMed] [Google Scholar]
- 14.Chen T-W et al. Ultrasensitive fluorescent proteins for imaging neuronal activity. Nature 499, 295 (2013). [DOI] [PMC free article] [PubMed] [Google Scholar]
- 15.Miyamoto T, Slone J, Song X & Amrein H A fructose receptor functions as a nutrient sensor in the Drosophila brain. Cell 151, 1113–1125 (2012). [DOI] [PMC free article] [PubMed] [Google Scholar]
- 16.Ashcroft FM & Rorsman P Katp channels and islet hormone secretion: new insights and controversies. Nat. Rev. Endocrinol. 9, 660–669 (2013). [DOI] [PMC free article] [PubMed] [Google Scholar]
- 17.Bryan J & Aguilar-Bryan L The ABCs of ATP-sensitive potassium channels: more pieces of the puzzle. Curr. Opin. Cell Biol. 9, 553–559 (1997). [DOI] [PubMed] [Google Scholar]
- 18.Masuyama K, Zhang Y, Rao Y & Wang JW Mapping neural circuits with activity-dependent nuclear import of a transcription factor. J. Neurogenet. 26, 89102 (2012). [DOI] [PMC free article] [PubMed] [Google Scholar]
- 19.Zhang YQ, Rodesch CK & Broadie K Living synaptic vesicle marker: synaptotagmin-GFP. Genesis 34, 142–145 (2002). [DOI] [PubMed] [Google Scholar]
- 20.Rulifson EJ, Kim SK & Nusse R Ablation of insulin-producing neurons in flies: growth and diabetic phenotypes. Science 296, 1118–1120 (2002). [DOI] [PubMed] [Google Scholar]
- 21.Feinberg EH et al. GFP reconstitution across synaptic partners (GRASP) defines cell contacts and synapses in living nervous systems. Neuron 57, 353–363 (2008). [DOI] [PubMed] [Google Scholar]
- 22.Lima SQ & Miesenböck G Remote control of behavior through genetically targeted photostimulation of neurons. Cell 121, 141–152 (2005). [DOI] [PubMed] [Google Scholar]
- 23.Macpherson LJ et al. Dynamic labelling of neural connections in multiple colours by trans-synaptic fluorescence complementation. Nat. Comm. 6 (2015). [DOI] [PMC free article] [PubMed] [Google Scholar]
- 24.Cao G et al. Genetically targeted optical electrophysiology in intact neural circuits. Cell 154, 904–913 (2013). [DOI] [PMC free article] [PubMed] [Google Scholar]
- 25.Lee K-S et al. Drosophila short neuropeptide F signalling regulates growth by ERK-mediated insulin signalling. Nat. Cell Biol. 10, 468 (2008). [DOI] [PubMed] [Google Scholar]
- 26.Shang Y et al. Short neuropeptide F is a sleep-promoting inhibitory modulator. Neuron 80, 171–183 (2013). [DOI] [PMC free article] [PubMed] [Google Scholar]
- 27.Garczynski SF, Brown MR, Shen P, Murray TF & Crim JW Characterization of a functional neuropeptide F receptor from Drosophila melanogaster. Peptides 23, 773–780 (2002). [DOI] [PubMed] [Google Scholar]
- 28.Thorens B Neural regulation of pancreatic islet cell mass and function. Diabetes Obes. Metab. 16, 87–95 (2014). [DOI] [PubMed] [Google Scholar]
- 29.Pipeleers DG Heterogeneity in pancreatic β-cell population. Diabetes 41, 777781 (1992). [DOI] [PubMed] [Google Scholar]
- 30.Bonner-Weir S & Aguayo-Mazzucato C Pancreatic β-cell heterogeneity revisited. Nature 535, 365–366 (2016). [DOI] [PubMed] [Google Scholar]
- 31.Nern A, Pfeiffer BD & Rubin GM Optimized tools for multicolor stochastic labeling reveal diverse stereotyped cell arrangements in the fly visual system. Proc. Natl. Acad. Sci. USA 112, E2967-E2976 (2015). [DOI] [PMC free article] [PubMed] [Google Scholar]
- 32.Jourjine N, Mullaney BC, Mann K & Scott K Coupled sensing of hunger and thirst signals balances sugar and water consumption. Cell 166, 855–866 (2016). [DOI] [PMC free article] [PubMed] [Google Scholar]
- 33.Ai M et al. Acid sensing by the Drosophila olfactory system. Nature 468, 691–695 (2010). [DOI] [PMC free article] [PubMed] [Google Scholar]
- 34.Burgess A et al. Loss of human greatwall results in G2 arrest and multiple mitotic defects due to deregulation of the cyclin B-Cdc2/PP2A balance. Proc. Natl. Acad. Sci. USA 107, 12564–12569 (2010). [DOI] [PMC free article] [PubMed] [Google Scholar]
- 35.Liu Q et al. Branch-specific plasticity of a bifunctional dopamine circuit encodes protein hunger. Science 356, 534–539 (2017). [DOI] [PMC free article] [PubMed] [Google Scholar]
- 36.Park S et al. A genetic strategy to measure circulating Drosophila insulin reveals genes regulating insulin production and secretion. PLoS Genet. 10, e1004555 (2014). [DOI] [PMC free article] [PubMed] [Google Scholar]
- 37.Chen W, Hwang YY, Gleaton JW, Titus JK & Hamlin NJ Optimization of a peptide extraction and LC-MS protocol for quantitative analysis of antimicrobial peptides. Future Sci. OA 5, FSO348 (2019). [DOI] [PMC free article] [PubMed] [Google Scholar]
- 38.Rappsilber J, Mann M & Ishihama Y Protocol for micro-purification, enrichment, pre-fractionation and storage of peptides for proteomics using StageTips. Nat. Protoc. 2, 1896 (2007). [DOI] [PubMed] [Google Scholar]
- 39.Cox J et al. Andromeda: a peptide search engine integrated into the MaxQuant environment. J. Proteome Res. 10, 1794–1805 (2011). [DOI] [PubMed] [Google Scholar]
- 40.MacLean B et al. Skyline: an open source document editor for creating and analyzing targeted proteomics experiments. Bioinformatics 26, 966–968 (2010). [DOI] [PMC free article] [PubMed] [Google Scholar]
- 41.Johnson RS, Martin SA, Biemann K, Stults JT & Watson JT Novel fragmentation process of peptides by collision-induced decomposition in a tandem mass spectrometer: differentiation of leucine and isoleucine. Anal. Chem. 59, 2621–2625 (1987). [DOI] [PubMed] [Google Scholar]
- 42.Roepstorff P & Fohlman J Proposal for a common nomenclature for sequence ions in mass spectra of peptides. Biol. Mass Spectrom. 11, 601 (1984). [DOI] [PubMed] [Google Scholar]
- 43.Gáliková M et al. Energy homeostasis control in Drosophila adipokinetic hormone mutants. Genetics 201, 665–683 (2015). [DOI] [PMC free article] [PubMed] [Google Scholar]
- 44.Saadipour K et al. The transmembrane domain of the p75 neurotrophin receptor stimulates phosphorylation of the TrkB tyrosine kinase receptor. J. Biol. Chem. 292, 16594–16604 (2017). [DOI] [PMC free article] [PubMed] [Google Scholar]
Associated Data
This section collects any data citations, data availability statements, or supplementary materials included in this article.


