Abstract
Objective:
The main objective of this study is to improve the classification performance of melanoma using deep learning based automatic skin lesion segmentation. It can be assist medical experts on early diagnosis of melanoma on dermoscopy images.
Methods:
First A Convolutional Neural Network (CNN) based U-net algorithm is used for segmentation process. Then extract color, texture and shape features from the segmented image using Local Binary Pattern ( LBP), Edge Histogram (EH), Histogram of Oriented Gradients (HOG) and Gabor method. Finally all the features extracted from these methods were fed into the Support Vector Machine (SVM), Random Forest (RF), K-Nearest Neighbor (KNN) and Naïve Bayes (NB) classifiers to diagnose the skin image which is either melanoma or benign lesions.
Results:
Experimental results show the effectiveness of the proposed method. The Dice co-efficiency value of 77.5% is achieved for image segmentation and SVM classifier produced 85.19% of accuracy.
Conclusion:
In deep learning environment, U-Net segmentation algorithm is found to be the best method for segmentation and it helps to improve the classification performance.
Keywords: Melanoma, deep learning, dermoscopy, segmentation, classification
Introduction
Melanoma is the most serious form of skin cancer and grows very quickly if untreated. It begins in melanocytes–the cells that produce the pigment melanin which is responsible for the color of the skin. It can spread to the lower part of our skin (dermis) enter the blood stream and then spread to other parts of the body. Melanoma that occurs on the skin called cutaneous melanoma, is the most common type of melanoma. Sometimes it develops from a mole, so early detection of melanoma can be effectively treated.
Without computer based assistance, clinical diagnosis accuracy for melanoma detection is reported to be between 65 and 80% Argenziano et al., (2001). Use of dermoscopic images improves diagnostic accuracy of skin lesion by 49% Kittler et al., (2002). However, the visual differences between melanoma and benign skin lesions can be very subtle (Figure 1), making it difficult to distinguish the two cases, even for trained medical experts.
Figure 1.
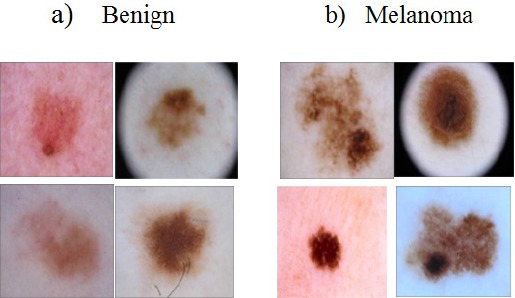
Visual Similarities between Melanoma and Non-Melanoma Lesions From ISIC Dataset Dermoscopy Images
For the reason described above, an intelligent medical imaging based skin lesion diagnosis system can be a precious tool to support a physician in classifying skin lesions.
In order to improve the diagnosis of melanoma, Dermoscopy is a noninvasive skin imaging technique of acquiring a magnified and illuminated image of a region of skin for increased clarity of the spots on the skin. Binder et al., (1995) Dermoscopy evaluation is widely used in the diagnosis of melanoma and obtains much in higher accuracy rates than evaluation by naked eyes Silveira et al., (2009).
Nevertheless the manual inspection from dermoscopy images made by a dermatologist is usually time consuming, error-prone and subjective (even well trained dermatologist may produce widely varying diagnostic results). In this regard automated recognition approaches are highly demanded.
In this paper, a Deep Convolutional Neural Networks (CNN’s) for accurate skin lesion segmentation using U-net algorithm is proposed. It is a combination of Deconvolutional network and Fully Connected Network (FCN). A series of color, texture and shape features from the segmented images extracted using some efficient feature extraction techniques. Local Binary Pattern (LBP) method is used for texture analysis. It has been found to be a very efficient texture operator. Edge histogram, Gabor and Histogram of Oriented Gradients (HOG) methods are used for shape feature extraction. Then the extracted features are fed into the Support Vector Machine (SVM), Random Forest (RF), K-Nearest Neighbors (KNN) and Naïve Bayes (NB) classifiers for classification.
Related Works
Garnavi et al., (2012) used Border and Wavelet based texture methods for computer-aided melanoma diagnosis. The texture, border and geometry features are extracted using wavelet-decomposition, boundary-series model and shape indexes. Classification is done through four classifiers namely Support vector machine, Random forest, Logistic model tree, and Hidden Naïve bayes method. Ramezane et al., (2014) proposed a melanoma recognition system using Support vector machine classifier, and the features detected are based on asymmetry, border irregularity, color variation, diameter and texture of the lesion. Romero et al., (2017) focused on the problem of skin lesion classification of melanoma, is built around the VGG net convolutional neural network architecture and uses the Transfer learning paradigm.
Barata et al., (2014) proposed two methods for detection of melanoma in dermoscopy images based on global and local features. The global method uses segmentation and wavelets, and the linear filters followed by a gradient histogram are used to extract features such as texture, shape and color from the entire lesion. After that a binary classifier is trained from the data. The second method of local features uses a Bag of Features classifier for image processing.
Xie et al., (2017) proposed classifying melanocytic tumors as benign or malignant by the analysis of digital dermoscopy images. It is done by three steps. First lesions are extracted using a Self Generating Neural Networks (SGNN), Second color, texture and border features are extracted, and the third lesion objects are classified using a network ensemble classifier that combines back propagation neural network with fuzzy neural networks to achieve improved performance.
Yu et al., (2017) present a hybrid classification framework for dermoscopy image assessment by combining deep convolutional neural network (CNN), Fisher vector (FV) and linear Support Vector Machine (SVM). Codella et al., (2017) report new state of–the art performance using Convolutional Neural Networks to extract image descriptors by using a pre-trained model from the Image Large Scale Visual Recognition Challenge (ILSVRC) 2012 dataset. They also investigate the most recent network structure called Deep Residual Network.
Thompson et al., (2017) proposed vector based pattern analysis and classification approach for dermoscopy images. Lesion is segmented using region based statistical region merging (SRM) algorithm. Scale invariant based Speeded Up Robust Features (SURF) technique is used for feature point detection and description. It uses Hessian matrix approximation for feature point detection and Haar-wavelet response for feature descriptions. The pattern detected is classified using Multi SVM classifier.
Behara et al., (2011) proposed Heuristic Hybrid Rough Set Particle swarm optimization (HRSPSO) algorithm for partitioning a digital image into different segments that is more meaningful and easier to analyze segmentation and classification. Bi et al., (2017) proposed multi scale integration approach for segmentation and introduced three classification approaches Multiclass classification, Binary classification and ensemble model. Arasi et al., (2017) used Discrete Wavelet Transform for feature extraction and texture analysis. These extracted features were the input to Stack Auto Encoders (SAEs) for training and testing the lesions as malignant or benign. Codella et al., (2015) proposed to integrate Convolutional Neural Networks (CNNs), Sparse coding and Support Vector Machine (SVM) for melanoma recognition.
Silveria et al., (2009) proposed the early diagnosis of melanoma, but their interpretation is time consuming and subjective, even for trained dermotologists. Six different segmentation methods are Adaptive Thresholding, Gradient vector flow, Adaptive snake, Level set method of Chan et.al, Expectation-maximization level set, Fuzzy based split and merge algorithm were compared and evaluated by four metrics, (HM, TDR, FDR,HD). Out of the six segmentation methods, only AS and EM-LS methods are robust and useful for the lesion segmentation to assist the clinical diagnosis of the dermotologists.
Materials and Methods
In this section, the proposed approach for melanoma classification is described. A brief conceptual block diagram is illustrated in Figure 2. As an initial step, the skin lesion region is segmented from the surrounding healthy skin by applying deep learning based U-Net algorithm and then extract the series of color, texture and shape features from the segmented image. LBP method is used to extract texture feature and Edge histogram, HOG and Gabor method are used to extract shape features. All the features extracted from these methods are fed in to the SVM, RF, KNN and NB classifiers for classification. The SVM, RF, KNN and NB classifiers are trained on a dataset comprised of both melanoma and other benign skin lesion images. Finally the trained SVM,RF, KNN and NB models are used to classify each lesion in a dermoscopic image as a benign or melanoma lesion. From these classifiers, SVM classifier produces a better result than the other classifiers based on Accuracy and F1-score.
Figure 2.
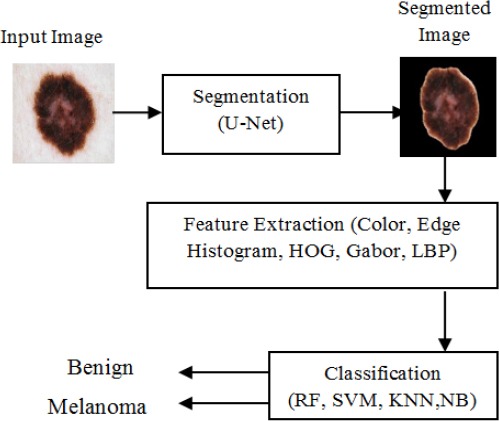
Block Diagram
Lesion Segmentation
Lesion Segmentation is meant to segment the detection of the lesion area in a skin image. Here U-net algorithm has been adopted. The U-net is specially designed to solve Biomedical Image Segmentation problems. The network merges a convolutional network architecture with a deconvolutional architecture to output the semantic segmentation. It is a combination of deconvolutional network and Fully Connected Network (FCN).
U-Net
Figure 3 shows the U-net architecture. It consists of a contracting path and an expansive path. The contracting path follows the typical architecture of a convolutional neural network. It consists of repeated applications of two 3 x 3 convolutions (Unpadded convolutions), each followed by a rectified linear unit (ReLU) and a 2 x 2 maxpooling operation with stride2 for down sampling. At each downsampling step the number of feature channels are doubled.
Figure 3.
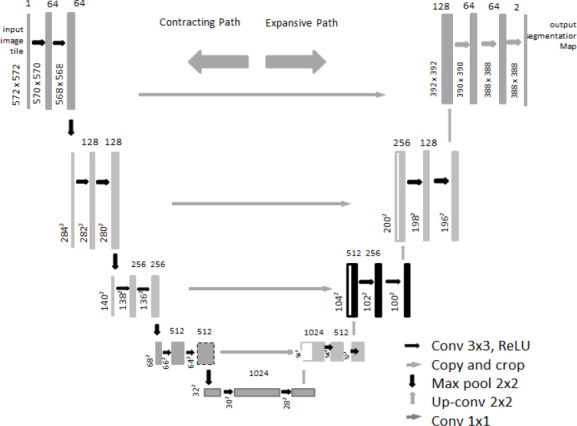
Illustration of U-Net Architecture
Every step in the expansive path consists of an upsampling of the feature map followed by 2 x 2 convolution (“up–convolution”) that halves the number of feature channels, a concatenation with the correspondingly cropped feature map from the contracting path. This concatenated image is then sent to a convolutional and ReLU layer. Cropping is necessary due to the loss of border pixels in every convolution. At the final layer, a 1 x 1 convolution is used to map each 64 component feature vector to the desired number of classes.
Feature Extraction
Feature extraction is a method to extract the unique feature of the skin lesion from the Region of Interest (ROI) to differentiate malignant melanoma from benign. By feature extraction a large data is reduced down to a relevant narrow set which makes the classification easier with high accuracy. In some other articles color, lesion boundary and texture features were studied to improve the performance of the system. In this proposed method color, texture and shape features are used.
Color feature
Initially R,G,B components of ROI were separated and zero values were removed from matrix and normalized. Mean, min, standard deviation, skewness and kurtosis were calculated for each of R, G, B and L, U, V components.
Texture feature
Local Binary Patterns
The LBP operator was introduced by Ojala et al., (2002) for texture classification. Given a center pixel in the image, LBP value is computed by comparing its gray value with its neighbors


where gc is the gray value of the center pixel, gi|R is the gray value of the neighbor at radius R from the center pixel (gc), P is the number of neighbors at a distance, (radius) R form the center pixel (gc) in an image. For the local pattern with P neighboring pixels, there are 2p (0 to 2p-1) possible values for LBP, resulting in a feature vector of length 2p. After identifying the local binary pattern, the whole image is represented by building a histogram of bin size 2p.
Shape Features
Gabor Filter
The Gabor filter is basically a Gaussian (with variances Sx and Sy along with x and y-axes respectively) modulated by a complex sinusoid (with center frequencies U and V along with x and y-axes respectively). Gabor filters have been used in many applications, such as quality segmentation, target detection, fractal dimension management, document analysis, edge detection, retina identification, image coding and image representation Pavlovicova., (2010). A Gabor filter can be viewed as a sinusoidal plane of particular frequency and orientation, modulated by a Gaussian envelope.
Thus the 2D Gabor filter can be written as in equation 1

The frequency response of the filter is:
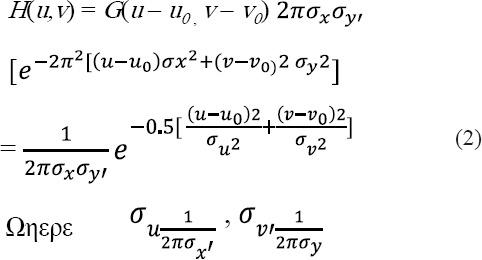
This is equivalent to translating the Gaussian function by (u0 , v0) in the frequency domain. Thus the Gabor function can be thought of as being a Gaussian function shifted in frequency to position (u0 ,v0) i.e. at a distance of  from the origin
  . In the above equations (1) and (2), u0 and v0 are referred to as the Gabor filter spatial central frequency. The parameters σx,σy are the standard deviation of the Gaussian envelope along with X and Y directions and determine the filter bandwidth.
Edge Histogram (EH)
The edge histogram descriptor is one of the widely used methods to shape detection. It basically represents the relative frequency of occurrence of 5 types of edges in each local area called a sub-image or image block. The sub image is defined by partitioning the image space into 4 x 4 non-overlapping blocks. So the partition of image definitely creates 16 equal sized blocks regardless of the size of the original image. To define the characteristics of the image block, a histogram of edge distribution for each image block is generated. The edges of the image block are categorized into 5 types: Vertical, Horizontal, 45-degree diagonal, 135-degree diagonal and non-directional edges, as shown in Figure 4.
Figure 4.
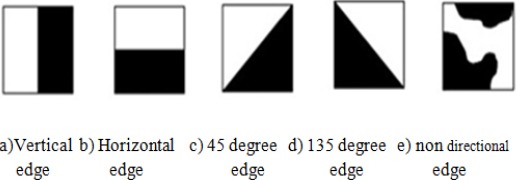
Five Types of Edges in the EHD
Thus the histogram for each image block represents the relative distribution of the 5 types of edges in the corresponding sub-image.
Semantics of Local Edge Histogram
A simple method to extract an edge histogram in the image block is to be applied digital filters in the spatial domain. The average gray levels for the four sub blocks are represented at(I,j) image block as a1(I,j), a2(I,j), and a3(I,j) respectively. Also, filter coefficients for vertical, horizontal, 45-degree diagonal, 135-degree diagonal, and non-directional edges can be represented as fv(k), fh(k), fd45(k), fd135(k), and fnd(k) respectively, where k=0,….,3 represents the location of the sub blocks. Coefficients of the vertical edge filter as shown in Figure 5-a). are identified. Similarly, we can represent the filter coefficients for other edge filters as shown in Figure 5-b), c), d), and e) are represented.
Figure 5.
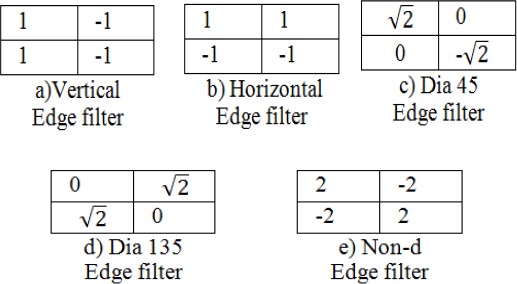
Filters for Edge Detection
Histogram of Oriented Gradient (HOG)
HOG Dalal and Triggs, (2005) is used in this study because local shape information such gaits is often well described by the distribution of local intensity gradients or edge directions. The first step of calculation is to compute a gradient value on each pixel in Bi. To do this, Bi is filtered to obtain x and y derivatives of pixels by using the following spatial filter masks. Actually the more complex spatial filter masks such as 3x3 sobel Vincent and Folorunso., (2009) masks can be adopted. However they generally do not exhibit better performances in practice.

Therefore, the x derivative(Ix) and the y derivative (Iy) of Bi are calculated as:

Then, the magnitude (| Bi (x, y, t) |hog) and the orientation (_hogBi (x, y, t) of the gradient are computed as :

The second step of calculation is to create cell histograms. The a orientation bins ({Oj}a j=1) are used for [0° , 360°] interval. Thus the a bins are defined as:

For each pixel orientation <hogBi (x, y, t), the corresponding orientation bin is found and the orientation’s magnitude |Bi(x,y,t)|hog is voted to this bin, as:

where

The last step is a process of histogram normalization. L2- norm normalization is applied on the histogram to generate the a-bin HOG descriptor as:

Classification
Classifier is used to classify the image into two categories (i.e., Benign and Melanoma).
Support Vector Machine(SVM )Classification
The support vector machine training is mainly used for the optimization of a classification cost. The important advantage of SVM is that it provides a unified framework in which different learning machine architectures can be generated through an appropriate choice of kernel. Statistical and structural risk minimization is the principle used in SVM which minimizes the upper bound on the generalization error.
Random Forest Classification
Random Forest is a flexible, easy to use algorithm that produces a great result most of the time. The Random Forest consists of a number of trees, with each tree grown using some form of randomization and other tasks that operate by constructing a multitude of decision trees at training time and outputting the class that is the mode of the classes or mean prediction of the individual trees.
K-Nearest Neighbors Classification
K-Nearest neighbor algorithm (K-NN) is an approach to data classification that estimates how likely a data point is to be a member of one group or the other depending on what group the data points nearest to it are in.
Naïve Bayes Classification
Naïve Bayes classifier is a algorithm that uses Bayes theorem to classify objects. NB classifiers assume strong, or Naïve Independence between attributes of data points. Popular uses of Naïve Bayes classifiers include spam filters, text analysis and medical diagnosis.
Results
Dataset
Experiments are achieved to evaluate the method on a public challenge dataset of skin lesion Analysis towards Melanoma detection released with ISBI 2016 (Gutman et al., 2016). This dataset is released by the International Skin Imaging Collaboration (ISIC).The challenge consists of three parts Part 1, part 2 and part 3. The challenge was further divided into sub challenges for each task involved in image analysis including segmentation, feature extraction and classification.
This experiment is carried out with 900 dermoscopic images taken from part1 as training image for segmentation with ground truth. Another 900 images from part3 is held out as test dataset for segmentation. From the 900 segmented images 90% of the images are used as training data for classification. Remaining 10% images held out as test data to predict the result.
Performance Metrics
For performance evaluation, the values obtained by the proposed technique are quantitatively assessed in terms of four commonly used performance metrics namely, Sensitivity, Specificity, Accuracy and Dice co-efficiency. These four metrics are defined as follows.
sensitivity refers to the ability to positively identify the case with melanoma, that is the percentage of patients who have been diagnosed correctly as patients.

where TP and FN represent the number of patients who have been diagnosed correctly as patient and incorrectly as healthy, respectively.
Specificity (also called true negative rate) is the possibility that a non-diseased patient has a negative test result that is the percentage of healthy people who are correctly diagnosed as healthy.

where TN and FP represent the number of healthy people who have been diagnosed correctly as healthy and incorrectly as patients.
Accuracy is the probability that the diagnostic test yields the correct determination that is the percentage of patients and healthy individuals who have been diagnosed correctly.

Dice co-efficient measures the similarities between pixels of two images. It can be measured by the following formula.

where X , Y are the number of pixels in each image. X∩Y are common pixels in two images.
F1-Score is the weighted average of Precision and Recall. Therefore, this score takes both false positive and false negative into account. Intuitively it is not as easy to understand as accuracy, but F1 is usually more useful than accuracy especially if one has an uneven class distribution.

Experimental Results
Performance of Classification with deep learning based segmented image is produced better result than the unsegment images. Several deep learning based segmentation methods available. Here U-Net has been adopted which is specifically designed for segmentation process. The Dice co-efficiency value 77.59% is obtained for segmentation . From the segmented images extract color feature with size 30, LBP histogram with size 256 for texture feature and Edge Histogram with size 256, HOG and Gabor with size 80 for shape features. These three features were fed into the classifiers. SVM classifier produces 85.19% accuracy.
It is observed that classification with segmented image achieves much better result than directly using the original dermoscopy images without segmentation. This is because unsegment image size is very large and artifacts in images. Deep learning based segmented images can generate more discriminate features for better recognition. It is valuable to point out the segmentation and classification stages are integrated in this study and the recognition process is performed in an automated way without any manual interaction.
Table 1 shows the experimental results of classification methods for the extracted features. By comparing the values listed in this table, it is observed that, SVM classifier achieves much better result than the other classifiers. SVM predicts accuracy of (85.19%) Recall of (50%), and F1_scoreof (46%).Naïve Bays classification predicts Precision of (45.62%).
Table 1.
Results of Classification for the Proposed Methods
| RF | SVM | KNN | NB | |
|---|---|---|---|---|
| Accuracy | 82.22 | 85.19 | 79.26 | 65.93 |
| Precision | 42.37 | 42.59 | 45.04 | 45.62 |
| Recall | 48.26 | 50 | 47.55 | 43.86 |
| F1_Score | 45.12 | 46 | 45.92 | 44.4 |
The Figure 6, describes the Accuracy percentage of the proposed system for the test image. It shows that SVM classifier predicts better accuracy (85.19) result.
Figure 6.

Accuracy Chart
The Figure 7, describes the Precision percentage of the proposed system for the test image. Here, Naïve Bays produce better precision of (45.62%).
Figure 7.
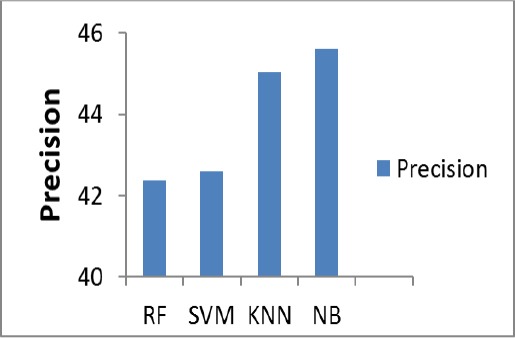
Precision Chart
The Figure 8, shows the Recall percentage of the proposed system for the test image. SVM gives (50%) of Recall value.
Figure 8.
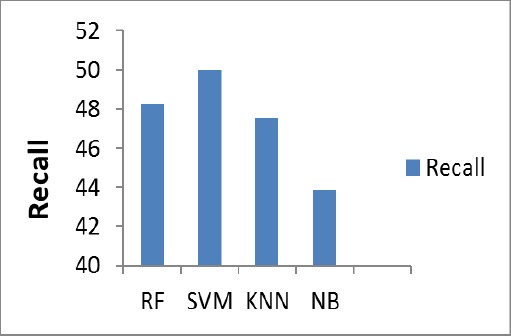
Recall Chart
The Figure 9, describes the F1_Score percentage of the various classifiers of the proposed system for the test image. It shows that SVM predicts (46%) of F1_score.
Figure 9.
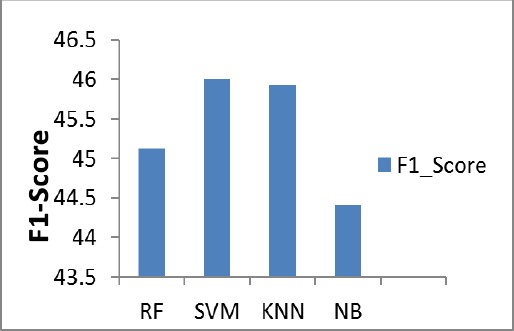
F1_Score Chart
Discussion
In this paper a U-Net based segmentation is proposed to achieve the challenges of automated melanoma classification in dermoscopy images. It consists of three steps: Segmentation, Feature Extraction and Classification which form an automated framework without need of manual interaction are faultlessly connected. First the lesion region is segmented by applying U-Net algorithm which is based on Deep learning methods. Then series of color, texture and shape features are extracted from the segmented images using LBP, Edge Histogram, HOG and Gabor methods. Finally all the extracted features are fed into the SVM, RF,KNN and NB classifiers. Based on the values of accuracy and F1 score SVM classifier produces best result compared to other classifiers. This experiment conducted on the open challenge dataset of Skin Lesion Analysis Towards Melanoma Detection on ISBI 2016. It is believed that the proposed melanoma classification system can be used as a part of a more complex framework for skin lesion analysis. In future this notion can be extended to further improve the accuracy of this method by working in deep learning concept for both segmentation and classification.
References
- Arasi AM, El-Horbaty ME, Salem MA, El-Dahshan AE. Stack Auto encoders approach for Malignant Melanoma diagnosis in Dermoscopy Images. ICICIS. 2017:403–9. [Google Scholar]
- Argenziano G, Soyer HP. Dermoscopy of Pigmented skin lesions- a valuable tool for early diagnosis of melanoma. Lancet Oncol. 2001;2:443–9. doi: 10.1016/s1470-2045(00)00422-8. [DOI] [PubMed] [Google Scholar]
- Barata C, Ruela M, Francisco M, Mendonca T, Marques SJ. Two systems for the detection of melanomas in dermoscopy images using texture and color features. IEEE Syst J. 2014;8:965–79. [Google Scholar]
- Behara. Segmentation and classification using heuristic HRSPSO. IJSCE. 2011;1:66–9. [Google Scholar]
- Bi L, Kim J, Ahn E, Feng D. Autometic skin lesion analysis using large scale dermoscopy images and deep residual networks. arXiv.1703.04197v2. 2017;1 [Google Scholar]
- Binder M, Schwarz M, Wrinkler A, et al. Epiluminescence microscopy:a useful tool for the diagnosis of pigmented skin lesions for formally trained dermatologist. Arch Dermatol. 1995;131:286–91. doi: 10.1001/archderm.131.3.286. [DOI] [PubMed] [Google Scholar]
- Codella N, Garnavi R, Haplern A, et al. Deep Learning, sparse coding, and SVM for melanoma recognition in dermoscopy images in Machine learning in Medical Imaging. Springer. 2015:118–26. [Google Scholar]
- Codella NCF, Nguyen QB, Pankanti S, Gutman DA, et al. Deep learning ensembles for melanoma recognition in dermoscopy images. IBM J Res Dev. 2017;61.5.1:15. [Google Scholar]
- Dalal N, Triggs B. Histograms of oriented gradients for human detection. IEEE Int Conf Comput Vis Pattern Recognit (CVPR) 2005:886–93. [Google Scholar]
- Garnavi R, Aldeen M, Bailey J. Computer-aided diagnosis of melanoma using border- and wavelet-based texture analysis. IEEE Trans Inf Technnol Biomed. 2012;16:1239–52. doi: 10.1109/TITB.2012.2212282. [DOI] [PubMed] [Google Scholar]
- Gutman AD, Codella N, Celebi ME, et al. Skin lesion analysis toward melanoma detection:A challenge at the International Symposium on Biomedical Imaging (ISBI) 2016, hosted by the International Skin Imaging Collaboration (ISIC) arXiv 1605.013971. 2016 [Google Scholar]
- Kittler H, Pehamberger H, Wolff K, Binder M. Diagnostic accuracy of dermoscopy. Lancet Oncol. 2002;3:159–65. doi: 10.1016/s1470-2045(02)00679-4. [DOI] [PubMed] [Google Scholar]
- Ojala T, Pietikainen M, Maenpaa T. Multiresolution gray-scale and rotation invariant texture classification with local binary patterns. IEEE Trans Pattern Anal Mach Intell. 2002;24:971–87. [Google Scholar]
- Pavlovicova J, Oravec M, Osadsky M. An application of Gabor filters for texture classification. Proceedings ELMAR-2010. 2010:23–6. [Google Scholar]
- Ramezani M, Karimian A, Moallem P. Automatic detection of malignant melanoma using macroscopic images. J Med Signals and Sens. 2014;4:281–90. [PMC free article] [PubMed] [Google Scholar]
- Romero A, Giro-i-Nieto X, Burdick J, Marques O. Skin lesion classification from dermoscopic images using Deep Learning Techniques. IASTED International Conference on Biomedical Engineering. 2017:49–54. [Google Scholar]
- Silveira M, Nascimento CA, Marques SJ, et al. Comparison of segmentation methods for melanoma diagnosis in dermoscopy images. IEEE J Sel Topics signal Process. 2009;3:35–45. [Google Scholar]
- Thompson F, Jeyakumar MK. Vector based classification of dermoscopic images using SURF. IJAER. 2017;12:1758–64. [Google Scholar]
- Vincent OR, Folorunso O. A descriptive algorithm for sobel image edge detection. In Proc Inform Sci Inform. Tech Educ Conf. 2009:97–107. [Google Scholar]
- Xie F, Fan H, Li Y, Jiang Z, et al. Melanoma classification on dermoscopy images using a neural network ensemble model. IEEE Trans Med Imaging. 2017;36:847–58. doi: 10.1109/TMI.2016.2633551. [DOI] [PubMed] [Google Scholar]
- Yu Z, Ni D, Chen S, Qin J, et al. Hybrid dermoscopy image classification framework based on deep convolutional neural network and fisher vector. IEEE 14th International Symposium on Biomedical Imaging. 2017:301–4. [Google Scholar]


