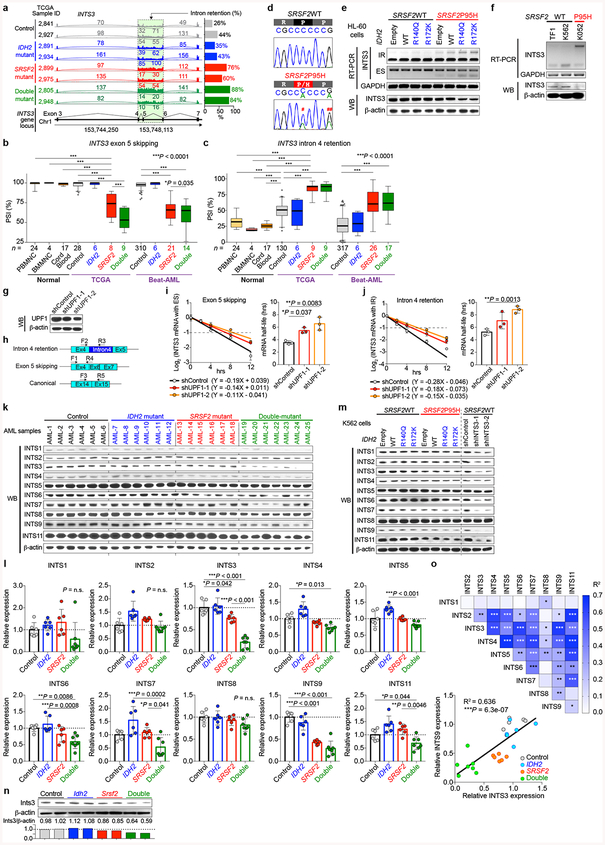
Extended Data Fig. 6 |. Aberrant INTS3 transcripts undergo nonsense-mediated decay and impact of INTS3 loss extends to other members of the Integrator complex.
a, Representative Sashimi plots of RNA-seq data from the TCGA showing intron retention in INTS3. b, c, PSI values for INTS3 exon 5 skipping (b) and intron 4 retention (c) in normal PBMNC (GSE5833541), BMMNC (GSE6141041), cord blood CD34+ cells (GSE4884642), and AML samples with indicated genotypes (the number of RNA-seq samples analyzed is indicated; PSI and P-values adjusted for multiple comparisons were calculated using PSI-Sigma; the mean value is represented by the line inside the box and the box expands from the 25th to 75th percentiles with whiskers drawn to 2.5 and 97.5 percentiles; samples below 2.5 percentile and above 97.5 percentile are shown as plots; one-way ANOVA with Tukey’s multiple comparison test). d, Sanger sequencing of cDNA showing WT or mutant SRSF2 expression in isogenic K562 knock-in cells (# a nonsynonymous mutation that alters P95. ## a synonymous mutation that does not change the amino acid). e, RT-PCR and WB analysis of INTS3 in isogeneic HL-60 cells with various combinations of IDH2/SRSF2 mutations (IR: intron retention; ES: exon skipping; representative results from three biologically independent experiments with similar results). f, RT-PCR and WB of INTS3 in non-isogenic myeloid leukemia cell lines. SRSF2 genotypes are shown together (representative results from three independent experiments with similar results). g, WB analysis of K562 SRSF2P95H knock-in cells transduced with shRNAs against UPF1 (representative results from three biologically independent experiments with similar results). h, Primers used to specifically measure INTS3 isoform with intron 4 retention and exon 5 skipping, and those for the normal INTS3 isoform. i, j, Half-life of INTS3 transcripts with exon 5 skipping (i) and intron 4 retention (j) were measured by qPCR (n = 3; the mean ± s.d.; a two-sided Student’s t-test). k, l, WB analysis of protein lysates from AML patient samples with indicated IDH2/SRSF2 genotypes (k). Expression level of each Integrator subunit was quantified using ImageJ and relative expression levels are shown in l where the mean expression levels of control samples were set as 1 (n = 6 for control, IDH2 single-mutant, and SRSF2 single-mutant AML, and n = 7 for IDH2/SRSF2 double-mutant AML; Detailed information of the primary patient samples used for this analysis is provided in Supplementary Table 23; the mean ± s.d.; one-way ANOVA with Tukey’s multiple comparison test). m, WB analysis of protein lysates from isogenic K562 cells with indicated IDH2/SRSF2 genotypes (left) or with INTS3 knockdown (right) (representative results from three biologically independent experiments are shown). n, WB analysis of murine Lin−cKit+ BM cells at 12 weeks post-pIpC based on Idh2/Srsf2 mutant genotypes. (expression level of Ints3 was quantified using ImageJ and relative expression levels are shown below; n = 2 animals per genotype were analyzed). o, Correlation among indicated Integrator subunits and P-value were calculated in Excel(15.40) and R2 values are visualized as a Heatmap generated by Prism 7 (top). Correlation between INTS3 and INTS9 protein expression is shown (bottom) (n = 25 from k; the Pearson correlation coefficient (R2) and P-values (two-tailed) were calculated in Excel(15.40)). *P < 0.05; **P < 0.01; ***P < 0.001.

