

Abstract
Objectives:
Saliva contains biomarkers for systemic as well as oral diseases. This study was undertaken to assess the variability in the sources of such biomarkers (plasma, cells), and attempted to identify saliva deterioration markers in order to improve saliva diagnostic outcomes.
Materials and Methods:
Inter- and intra-subject variation in salivary gingival crevicular fluid levels were determined by measuring salivary albumin and transferrin levels. The purity of collected glandular secretions was determined by bacterial culture, and the variability in epithelial cell numbers by cell counting and optical density measurement. Saliva sample deterioration markers were identified by RP-HPLC and LC-ESI-MS/MS.
Results:
Ten-fold variations were observed in plasma-derived albumin and transferrin levels, emphasizing the need for biomarker normalization with respect to plasma contributions to saliva. Epithelial cell levels varied 50-fold in samples collected before and after a meal. Salivary fungal levels varied within subjects, and among subjects from 0 to >1,000 colony-forming units per milliliter. In saliva samples incubated for various time intervals at 37°C, five peptides were identified that steadily increased in intensity over time and which could be explored as “deterioration markers”.
Conclusion:
Taking saliva characteristics appropriately into account will help realize the promise that this body fluid is suitable to be exploited for reliable health care monitoring and surveillance.
Keywords: Plasma, Gingival fluid, Albumin, Proteases, Diagnostic, Quality control
Introduction
There is a sustained interest in the use of saliva, or oral fluid, as the body fluid for the diagnosis of oral as well as systemic diseases (Tabak, 2007, Miller et al., 2010, Spielmann & Wong, 2011, Zhang et al., 2016). Using saliva for the diagnosis of systemic diseases is feasible primarily because saliva contains a small amount of plasma (Oppenheim, 1970, Oppenheim & Hay, 1972). The detectability of plasma-derived biomarkers in saliva facilitates not only the monitoring of disease processes restricted to the oral cavity but also of diseases manifested elsewhere in the human body (Kaufman & Lamster, 2002, Schafer et al., 2014). The major plasma components present in saliva are derived from gingival crevicular fluid (GCF), which enters the oral cavity through the gingival sulcus or a periodontal pocket, and to a much lesser extent through para-cellular seepage from the vasculature of the salivary gland tissue (Oppenheim, 1970, Oppenheim & Hay, 1972, Kaufman & Lamster, 2002). Via the gingival sulcus there is a direct connection with the circulation and this provides the unique opportunity to measure, in saliva, biomarkers for systemic disease.
The serumnal component in saliva is not the only fraction that contains biomarkers for systemic disease. Another source of such markers is the epithelial cells that line the inside of the oral cavity (e.g. buccal, palatal, lingual epithelium) and cells that form the salivary acini and the glandular ducts. Examples of oral cell-derived biomarkers that have shown correlation with systemic disease (e.g. pancreatic cancer) are salivary exosomes and non-coding mRNAs (Zhang et al., 2016).
Saliva is also being explored for diagnosing disease processes ongoing locally in the oral cavity. In such cases, there is a direct physical connection between the diseased location and the components in saliva. Examples of oral diseases and conditions for which salivary biomarkers have been pursued and identified are oral cancer (reviewed in Yakob et al., 2014), lichen planus (Cheng et al., 2014, Byun et al., 2015), Sjögren’s syndrome (an inflammatory disorder of the salivary glands; Ryu et al., 2006, Hu et al., 2007, 2010, Ambatipudi et al., 2012), parotid gland tumors (Matse et al., 2013), following irradiation (Laheij et al., 2015), periodontal disease (Ramseier et al., 2009), aphthous stomatitis (Kim et al., 2016), and caries (Denny et al., 2007).
The presence of plasma in saliva has long been recognized. In fact, it was originally believed that saliva represents a diluted form of plasma, and to some extent this is true, since GCF is diluted in the large volume of oral fluid. However, many studies on the whole saliva proteome have subsequently shown that the predominant portion of the proteins present is not plasma-derived but is synthesized by acinar cells of the various salivary glands (Azen, 1978). These proteins are for the most part unique in their structures and functions and are not found in plasma. Thus, saliva is clearly more than just diluted plasma. The dilution of GCF in oral fluid has significant implications for saliva diagnostics. It means that diagnostic tests must be of sufficient sensitivity to be able to detect the GCF-derived biomarkers in their very diluted state. Whether saliva is employed for diagnosing oral or systemic disease, it is a challenging body fluid to work with, and in many respects more challenging than plasma or serum. Saliva, in contrast to plasma, contains contributions from both exocrine as well as non-exocrine sources. The exocrine fraction is derived from the salivary glands, and is subject to variations in flow rate. The flow rate shows inter- and intra-subject variability, and circadian rhythm patterns over the course of the day, contributing to compositional fluctuations (Dawes, 1972, Dawes & Ong, 1973). Whole saliva (WS) also contains desquamated epithelial cells at approximately 4×10⁵ cells/ml (Dawes, 2003), some neutrophils and over 108 microorganisms/ml (Dewhirst et al., 2010). Neutrophils and bacteria secrete a wide variety of proteolytic and other enzymes that are released and active in saliva (Helmerhorst & Oppenheim, 2007). This creates an environment where the integrity of salivary biomarkers, especially in saliva samples stored for prolonged periods of time, could be compromised (Helmerhorst & Oppenheim, 2007, Schipper et al., 2007b, de Jong et al., 2011, Siqueira & Dawes, 2011, Thomadaki et al., 2011). Taken together, the use of saliva for diagnostics requires consideration of the native characteristics of this body fluid. Here the variability in the plasma component was determined, and methods for normalization of biomarkers with respect to albumin or transferrin levels are proposed. The variability of cells in saliva (epithelial cells, fungal cells) was also investigated. Lastly, since saliva undergoes extensive putrefaction upon collection if not stored properly, we aimed to identify markers that could potentially help determine the quality of the saliva sample before its use in diagnostic analyses.
Materials and Methods
Whole saliva collection
The study involved human subjects and was approved by the Institutional Review Board at Boston University, protocol numbers H-23709 (EJH), H32808 (EJH) and H-23046 (FO). The experiments were undertaken with the understanding and written consent of each subject and according to the World Medical Association Declaration of Helsinki. All saliva samples were collected at least one hour after consumption of food and beverages. The donor pool represented generally healthy subjects, but they were not evaluated for gingival health status. Unstimulated whole saliva was collected from donors expectorating the naturally accumulating saliva in a graduated tube placed on ice. Stimulated whole saliva was collected from donors chewing on a bolus derived from a piece of four square inches (6.45 cm2) of Parafilm at a rate of one stroke per second. Salivary sediments and supernatants were obtained by centrifugation of the samples for 5 min at 14,000 × g.
Parotid secretion collection and plating
Parotid secretion was collected from one subject by placing a Curby cup over the orifice of a Stensen’s duct. The flow of the secretion was stimulated with sour lozenges. The first few drops of the secretion were discarded. To assess whole saliva contamination in the collected parotid secretion, aliquots of 25 µl were plated on Brucella agar, which is a blood agar containing haemin and vitamin K, and bacterial growth was assessed after 48 h incubation at 37°C under anaerobic conditions. The numbers of cells were compared with those in 25 µl aliquots of diluted whole saliva from the same individual.
Epithelial cell counting and OD measurement
The number of epithelial cells in undiluted whole saliva samples from eight subjects were determined using a hemocytometer (Hausser Scientific, Horsham, PA). The samples were diluted two- to four-fold in saliva ion buffer if the number of cells exceeded 200 per square unit. The optical density of the samples was determined by adding 100 µl of 5–10-fold diluted samples to a microtiter plate and reading the OD620 using a plate reader (Genios, Männedorf, Switzerland).
Fungal cell counting
The number of fungal cells was determined in whole saliva from 13 healthy subjects by spreading the cell sediment from a 1 ml aliquot, suspended in 100 µl of sterile PBS, on Sabouraud dextrose agar plates (Difco). The numbers of cells were counted after 48 h incubation of the plates at 30°C.
Transferrin ELISA
The transferrin levels in whole saliva samples from 39 subjects were determined in unstimulated whole saliva supernatant samples using a commercial EIA assay (Salimetrix, Carlsbad, CA) according to the manufacturer’s instructions.
Visualization of albumin in whole saliva
Stimulated whole saliva samples (100 µl) from 8 subjects were analyzed by Ornstein-Davis gel electrophoresis (Ornstein, 1964, Campese et al., 2009). The albumin band was visualized by comparison with an albumin standard (20 µg) analyzed on the same gel.
Autolysis in whole saliva
To determine endogenous whole-saliva-associated proteolytic activities, whole saliva was collected from 5 subjects, pooled and incubated in a 37°C water bath. After, t = 0, 30 min, 2 h, 4 and 8 h, 2 ml aliquots were removed, mixed with 2 ml deionized water and filtered over a 5 kDa filter (Millipore). The filtrate was dried and resuspended in 0.1% trifluoroacetic acid. The samples were then analyzed by RP-HPLC using elution conditions as previously described (Helmerhorst et al., 2006).
Mass spectrometric analysis
Selected peaks from the whole saliva autolysis digest were collected, dried, and analyzed by LC-ESI-MS/MS. Peptide fragments were sequenced and identified by searching against an in-house-generated database of the salivary proteome containing 589 entries. Filter criteria applied were DeltaCN >0.1, peptide probability <0.1, and Xcorr values of +2 and +3 of 3.0 and 3.5 without enzyme specification as described (Helmerhorst et al., 2008).
Results
Variability in the plasma component in saliva
Many of the diagnostic markers of interest in saliva are plasma-derived. We aimed to determine the inter-individual variation of the plasma fraction in whole saliva by measuring salivary albumin levels. As shown in Fig. 1A, albumin, the major plasma protein, can readily be detected after electrophoresis and staining with Amido-black. Albumin is detectable, even after GCF dilution in the whole saliva volume, because of the difference in protein concentration between GCF (70 mg/ml) and saliva (1–4 mg/ml) (Dawes et al., 2015). It is readily evident from the results that the salivary albumin levels show considerable variation among subjects. By densitometric analysis, it was found that the albumin band shows approximately 10-fold differences in levels among subjects.
Fig. 1.
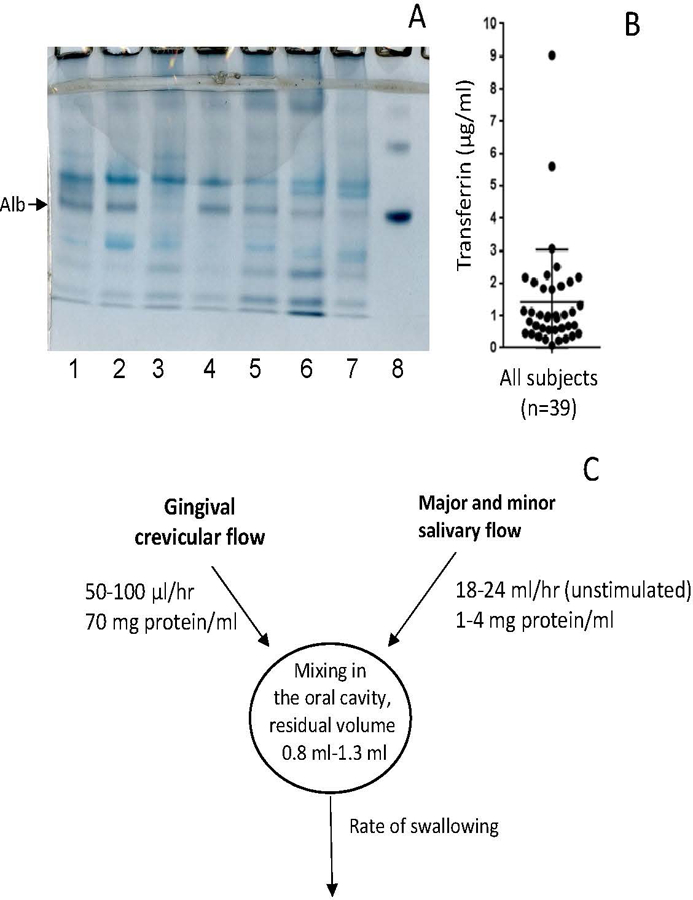
Plasma contributions to whole saliva. A, albumin levels in saliva from healthy subjects. Aliquots of 100 μl saliva were analyzed by anionic PAGE followed by Amido Black staining. Lanes 1–7: subjects 1–7; lane 8: 20 µg albumin. The arrow points to the position of albumin (monomer). B, Salivary transferrin levels in 39 donors, determined by ELISA; C, Physiological variables affecting plasma levels in WS: rate of plasma output, rate of glandular output, and the residual volume (the volume left after a swallow) in the oral cavity.
To gain insight into the variation in plasma levels and to quantitate the differences, the concentration of another major plasma protein, transferrin, was measured in whole saliva from 39 donors (Fig. 1B). While most donors exhibited concentrations of 1 to 3 µg transferrin/ml, there were a few significant outliers with much higher values of 9 µg/ml.
Since the reference interval (natural variation) of albumin levels in human plasma varies only within a relatively narrow range of 35–40 mg/ml, the varying concentrations of albumin and transferrin in saliva are due to inter-individual variations in the plasma fraction in saliva. Figure 1C summarizes the physiological factors that affect the final plasma concentration in whole saliva. Firstly, salivary plasma concentrations are determined by the rate at which GCF is released into the oral cavity, typically a few µl/hr, and at increased rates during periodontal inflammation (Oppenheim, 2008). Secondly, they are determined by the dilution rate of GCF in saliva in the oral cavity, which is dependent on the salivary flow rate. The flow rate, in turn, is dependent on the level of stimulation (Dawes, 1972, 2008). The experimental data shown in Fig. 1A show that plasma, and therefore the biomarkers it contains, is diluted by at least a factor of 1,000 after entry into the oral cavity. The extent of dilution is determined by the factors summarized in Fig. 1C.
Purity of collected glandular secretions
Given the sensitivity of mass spectrometric protein identification methodologies, glandular secretions must be collected without whole saliva contamination to be able to assign the biomarkers identified as being gland-derived. If collected properly, salivary glandular secretion should not show evidence for bacterial growth. The principle of the method is shown in Fig. 2. In the imperfectly collected parotid secretion sample the extent of contamination with whole saliva (the source of the bacteria) was determined by comparing the cell numbers in the parotid sample with the cell numbers in a dilution series of whole saliva collected from the same donor. In the example shown, the contamination with whole saliva was established to be 0.01% (v/v). This method is recommended if the glandular source of a biomarker is to be proven.
Fig. 2.
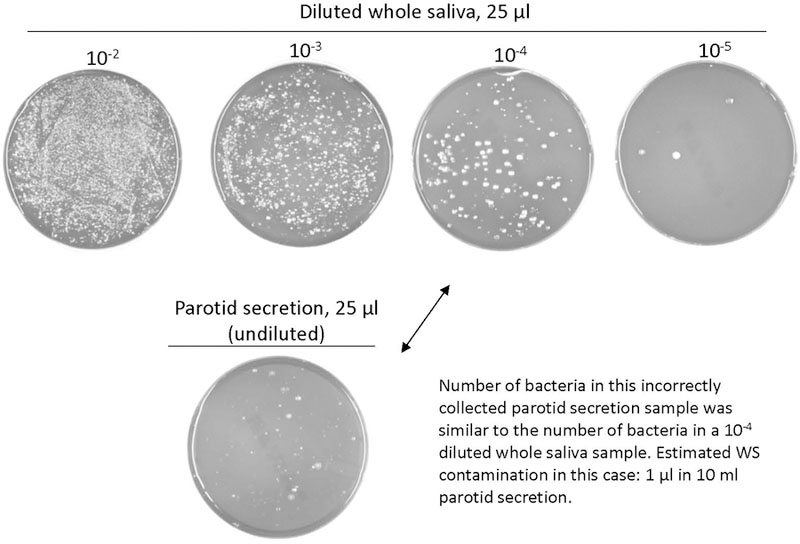
Method for assessing the extent of whole saliva contamination in a collected glandular salivary secretion sample. An aliquot of 25 µl parotid secretion is plated on blood agar containing haemin and vitamin K and incubated anaerobically. If bacterial growth is observed, the secretion collected was contaminated with whole saliva. The extent of contamination can be determined by comparison with the number of cells in 25 µl of a dilution series of whole saliva collected from the same donor. In the example shown, the contamination was 1 µl whole saliva in 10 ml collected parotid secretion, or 0.01% (v/v).
Variability in epithelial cell numbers
The natural variation in epithelial cell numbers was determined with a hemocytometer (Fig. 3). Results showed approximately nine-fold differences among subjects, ranging from 1 to 9×10⁵ cells per ml (Fig. 3A). The intra-subject variation was substantial, depending on the time of day of sampling (Fig. 3C, D). The lowest values were consistently observed in the samples collected immediately after lunch. This can be explained by the mechanical activity of chewing, promoting an increased shedding of the outermost epithelial cells from the oral mucosal surfaces. A good coefficient of determination (R2 0.89) was observed between the epithelial cell numbers and the optical density of the saliva sample (Fig. 3B). This result suggests that the desquamated epithelial cells in saliva are the major determinant of the absorbance of a saliva sample, and that OD measurement is a suitable method to gain a first impression of inter-subject variations in epithelial cell numbers in saliva used for diagnostic investigations.
Fig. 3.
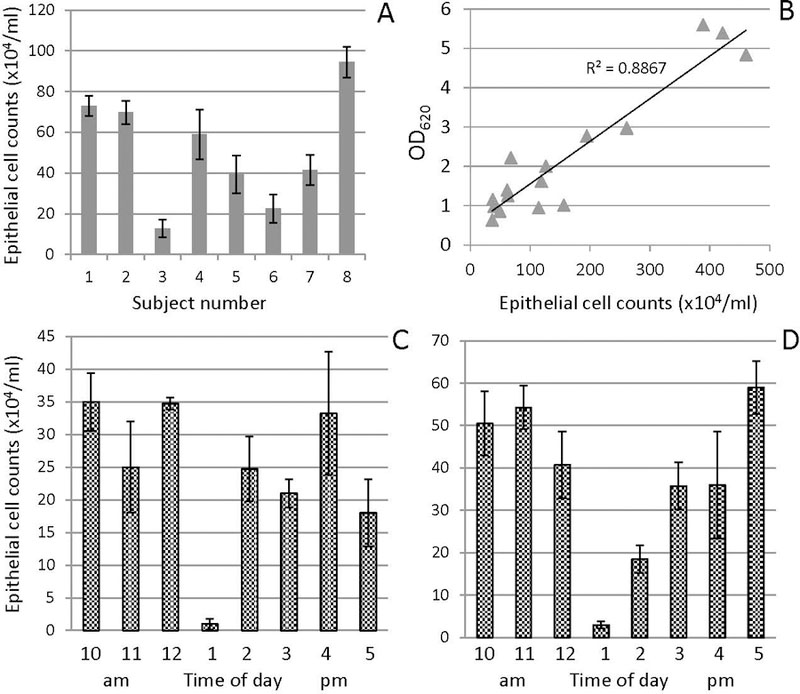
Measurements on epithelial cells in saliva. A, inter-subject variation in the numbers of epithelial cells in saliva samples collected from 8 donors at 10 a.m.; B, relationship between the epithelial cell count determined with a hemocytometer and the OD620 determined with a spectrophotometer using a 5 to 10-fold diluted sample; C and D, daily variation in the numbers of epithelial cells in saliva from a single subject sampled hourly for 8 h on two days.
Variability in fungal cell numbers
To determine the inter- and intra-subject variation in the levels of C. albicans, an opportunistic oral fungus, whole saliva was collected from 13 subjects on 22 consecutive days (Table 1). All samples were collected in the morning. The variation in cell numbers observed in the 1 ml sample aliquots were 0 cells (non-carrier) to >1,000 C. albicans cells (high carrier). Based on the results obtained, donors could be divided into non, low, medium and high carriers. The donor status remained fairly consistent over the 22 days period. However, significant intra-subject variation was observed. For instance, the numbers for subject 4 ranged from 38 to 747 CFU/ml. This longitudinal study result indicates that repeat sampling is needed to obtain an accurate average value of oral Candida levels in an individual subject.
Table 1.
Candida carriage (CFU/ml) in saliva from 13 subjects sampled over a 2 to 3 week time interval.
| Subject Number/Carrier status1 |
|||||||||||||
|---|---|---|---|---|---|---|---|---|---|---|---|---|---|
| Subject # | 1 | 2 | 3 | 4 | 5 | 6 | 7 | 8 | 9 | 10 | 11 | 12 | 13 |
| Day | LC | LC | MC | MC | MC | LC | NC | NC | LC | LC | NC | NC | LC |
| 1 | 1±0 | 3±2 | 19.5±2.5 | 137.5±2.5 | 52.5±13.5 | 0 | 0 | 0 | 2±1 | 15±3 | 0 | 0 | 327±96 |
| 3 | 0 | 0 | 0 | 0 | 0 | 0 | 817±75 | ||||||
| 4 | 0.5±0.5 | 1 | 158±7 | 220±10 | 5.5±1.5 | 3±3 | |||||||
| 5 | 0 | 0 | 0.5±0.5 | 0 | 0 | 0 | 344.5±8.5 | ||||||
| 6 | 0 | 0 | 51.5±20.5 | 727±127 | 12.5±1.5 | 0 | |||||||
| 8 | 1.5±0.5 | 0.5±0.5 | 25.5±1.5 | 63±9 | 7.5±0.5 | 0 | |||||||
| 10 | 0 | 0 | 0 | 0 | 0 | 0 | >1000 | ||||||
| 11 | 0 | 0 | 15.5±0.5 | 62±9 | 59±2 | 0 | |||||||
| 12 | 0 | 0 | 0 | 0 | 0 | 0 | >1000 | ||||||
| 13 | 0 | 0 | 19.5±1.5 | 38±2 | 25±1 | 0 | |||||||
| 14 | 0 | 0 | 88±3 | 115.5±9.5 | 14±3 | 0 | |||||||
| 15 | 0 | 0 | 0 | 0 | 0 | 0 | 335±20 | ||||||
| 18 | 0 | 92±5 | 63.5±23.5 | 18±3 | 0 | ||||||||
| 20 | 0 | 17.5±2.5 | 40±6 | 8±5 | 0 | ||||||||
| 22 | 0 | 126.5±9.5 | 88.5±14.5 | 2±1 | 0.5±0.5 | ||||||||
NC,non-carrier; LC, low carrier; MC, medium carrier; HC, high carrier.
Deterioration markers in whole saliva
Proteolytic degradation of biomarkers is probably one of the biggest challenges in oral fluid diagnostics. Naturally, the composition of human whole saliva is highly dynamic due to the various enzymes it contains (reviewed in Helmerhorst & Oppenheim, 2007)). When saliva is collected, its composition reflects the in vivo protein modification status at the time of collection. An expectorated saliva sample is not stable and will continue to degrade proteins and other organic components such as exosomes in the collection tube (Siqueira & Dawes, 2011). To study this degradation process in an accelerated way, a pooled whole saliva sample was incubated at 37°C. After various time intervals, aliquots were analyzed by RP-HPLC. The amount of the peptides in the < 5 kDa fraction increased with incubation time (Fig. 4). This fragmentation pattern resulted from the enzymatic activity inherent to whole saliva, and the underlying mechanisms depend on differences in enzyme specificities and velocities of cleavage. At the 4 h time point the larger peaks started to decrease in intensity, while other small peaks, indicated with arrows, continued to increase. The sequences of these peptides were identified by LC-ESI MS/MS and are shown in Fig. 4B. Most of the peptides were derived from salivary proline-rich proteins and many contained large stretches of proline-residues. These peptides may represent stable final products that could be explored as whole saliva “deterioration markers”.
Fig. 4.
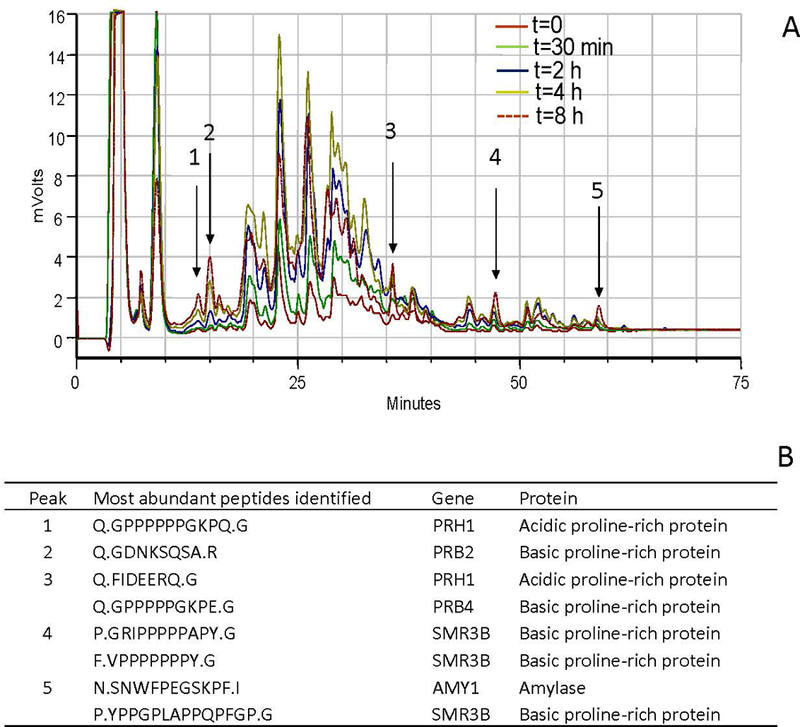
Identification of saliva deterioration markers. A, RP-HPLC chromatograms of the < 5 kDa fraction of a mixed WS sample incubated for 0–8 h at 37°C. Samples were collected at t=0, 30 min, 2 h, 4 h and 8 h. Note that the intensity of most peptides increased up to 4 h, then decreased. The peptides indicated with arrows steadily increased over the entire time frame, and were collected. B, identification of the collected peptides. These peptides could potentially serve as saliva deterioration markers.
Discussion
Salivary diagnostics relies, to a significant extent, on biomarkers that are derived from the GCF fraction in saliva. In earlier studies, the GCF contribution to whole saliva was shown in a quantitative way by two methods (Oppenheim, 1970). In the first, the volume of GCF released from the gingival crevice from an entire dental arch was determined by pumping saline using an individually fabricated collection device to allow the forced flow restricted to the total sulcular orifice area of an entire dental arch. The quantitation of plasma-derived proteins such as albumin in the wash solution yielded the total volume of GCF in plasma equivalents (30 – 60 µl) to be released into the oral cavity in gingivally healthy subjects. The second approach made use of an individually fabricated acrylic shielding device covering the entire gingival margins of the oral cavity, followed by whole saliva collection with and without the shielding devices in place. The albumin levels of the whole saliva collected with the shielding devices in place were drastically lower than those collected without any coverage of the gingival margins.
Our results demonstrated inter-individual variations in salivary plasma levels. These could have been due to differences in gingival health, but our donor pool was not defined in this respect. Regardless of the source of the variation, the present study stresses the need for taking these gingival plasma contributions into account when using whole saliva for diagnostic investigation. One condition that affects the GCF flow rate, and its composition, is the periodontal health status of the donor (Silva-Boghossian et al., 2013). This has been demonstrated in an experimental gingivitis study, where the concentration of plasma-derived albumin increased upon cessation of oral hygiene and returned to baseline levels upon resumption of oral hygiene (Oppenheim, 2008). Salivary plasma levels are also negatively affected by the state of dentition of the donor. This is because GCF emanates through the gingival sulcus or periodontal pockets, where the continuity in the epithelium is weakened by the thin and fragile junctional epithelial cell layer (Schroeder & Listgarten, 2003). In fully edentulous subjects there is no junctional epithelium and therefore no discontinuity of the oral epithelium, thereby eliminating the presence of GCF. The plasma levels in whole saliva from edentulous subjects are extremely low and are on average five to six fold lower than those in the dentate adult population (Terrapon et al., 1996). These very low plasma contributions are probably derived from leakage through the salivary glandular apparatus as is evidenced by the small amounts of albumin found in salivary secretions. Thus, the periodontal health status, the absence or presence of teeth, and a whole host of other oral lesions, could have an impact on the levels of plasma-derived biomarkers in saliva.
Without exception, saliva diagnostic tests that have been marketed thus far measure the presence of small molecules (e.g. hormones, and drugs of abuse), or antibodies. These are all contained in the plasma component of saliva. Most successful are saliva diagnostic tests that are based on measuring single analyte biomarkers (e.g. antibodies) with clear cut-off values indicating health or disease. For instance, antibodies to HIV, which would either be absent or present in a person’s serum, and therefore in a person’s saliva. For some diseases, however, the variation in biomarker concentrations are much more informative. For instance, the variation in the levels of C-reactive protein in the saliva of patients suffering from ischemic heart disease relative to healthy subjects (Miller et al., 2014). In those instances, it will be much more critical to normalize properly the obtained biomarker values in saliva to the plasma fraction in saliva.
For any study involving GCF-derived biomarkers, it will be beneficial to collect saliva that is enriched in the plasma component. It can be envisioned that this can be achieved with a collection device that is swabbed over or near those regions that are close to the gingival margin. Indeed, the OraQuick device utilized for HIV diagnosis in saliva uses an absorbent pad which is swiped over both the upper and lower buccal gingival areas, and it is likely that this will result in the collection of a fluid that is enriched in the GCF fraction. It should be pointed out that the OraQuick saliva collection device is used strictly to measure the presence or absence of disease and is not aimed to provide a quantitative value of the biomarker. The method of collection, however, could potentially be useful for other biomarkers that depend on precise quantitation, such as levels of hormones, as long as the biomarker is normalized with respect to plasma components not affected by the condition or disease.
The stability of the components in a collected saliva sample is an important parameter in saliva diagnostics. Oral fluid proteolysis has been well recognized to be of potential concern (Henson & Wong, 2010, de Jong et al., 2011, Thomadaki et al., 2011, Siqueira & Dawes, 2011). A variety of methods for saliva collection and processing have been explored, and various protease inhibitors and cocktails have been investigated (Schipper et al., 2007a, Thomadaki et al., 2013). While some showed a reduction in enzyme activities, none were able to inhibit fully the proteolytic activities in saliva (Schipper et al., 2007a, 2007b, Thomadaki et al., 2011). Acidification or alkalization of a saliva sample, or boiling immediately after sample collection are effective, but could impact on protein composition and conformation. Saliva is a challenging fluid to stabilize, even when stored at −80°C (Schipper et al., 2007b). Our studies have now elucidated a set of peptide markers that could potentially be used to determine the extent of deterioration of a stored saliva sample. Interestingly, these “deterioration marker” peptides were virtually all derived from the proline-rich protein family, and many contained large amino acid sequences of 5–7 prolines in a row. It is likely that these peptides are not further degraded in the oral environment, and this could be further investigated with synthetic peptides.
In conclusion, when compared with plasma or serum, saliva as a diagnostic biofluid has several advantages and disadvantages. The advantages relate to the ease of whole saliva collection. The disadvantages relate to the biochemical properties and the complexity of saliva fluid itself. With the proper collection and normalization procedures in place, especially regarding plasma contributions, and quality control of the collected sample, oral fluid diagnostics remains a highly attractive and promising field for certain applications.
Acknowledgements
The authors thank Drs. Y. Zhong, H. Hanasab and M. Campese for contributing to the data in this article. The authors are grateful for NIH support from grants DE16699, DE18132, and AI101067 to EJH, and DE05672, DE07652, DE017788 and DE014950 to FO.
References cited
- Ambatipudi KS, Swatkoski S, Moresco JJ, Tu PG, Coca A, Anolik JH, Gucek M, Sanz I, Yates JR 3rd and Melvin JE (2012). Quantitative proteomics of parotid saliva in primary Sjögren’s syndrome. Proteomics 12: 3113–20. [DOI] [PMC free article] [PubMed] [Google Scholar]
- Azen EA (1978). Genetic protein polymorphisms in human saliva: an interpretive review. Biochem Genet 16: 79–99. [DOI] [PubMed] [Google Scholar]
- Byun JS, Hong SH, Choi JK, Jung JK and Lee HJ (2015). Diagnostic profiling of salivary exosomal microRNAs in oral lichen planus patients. Oral Dis 21: 987–93. [DOI] [PubMed] [Google Scholar]
- Campese M, Sun X, Bosch JA, Oppenheim FG and Helmerhorst EJ (2009). Concentration and fate of histatins and acidic proline-rich proteins in the oral environment. Archives of oral biology 54: 345–53. [DOI] [PMC free article] [PubMed] [Google Scholar]
- Cheng YS, Jordan L, Rees T, Chen HS, Oxford L, Brinkmann O and Wong D (2014). Levels of potential oral cancer salivary mRNA biomarkers in oral cancer patients in remission and oral lichen planus patients. Clinical oral investigations 18: 985–93. [DOI] [PMC free article] [PubMed] [Google Scholar]
- Dawes C (1972). Circadian rhythms in human salivary flow rate and composition. J Physiol 220: 529–45. [DOI] [PMC free article] [PubMed] [Google Scholar]
- Dawes C (2003). Estimates, from salivary analyses, of the turnover time of the oral mucosal epithelium in humans and the number of bacteria in an edentulous mouth. Archives of oral biology 48: 329–36. [DOI] [PubMed] [Google Scholar]
- Dawes C (2008). Salivary flow patterns and the health of hard and soft oral tissues. Journal of the American Dental Association 139 Suppl: 18S–24S. [DOI] [PubMed] [Google Scholar]
- Dawes C and Ong BY (1973). Circadian rhythms in the concentrations of protein and the main electrolytes in human unstimulated parotid saliva. Archives of oral biology 18: 1233–42. [DOI] [PubMed] [Google Scholar]
- Dawes C, Pedersen AM, Villa A, Ekström J, Proctor GB, Vissink A, Aframian D, McGowan R, Aliko A, Narayana N, Sia YW, Joshi RK, Jensen SB, Kerr AR and Wolff A (2015). The functions of human saliva: A review sponsored by the World Workshop on Oral Medicine VI. Archives of oral biology 60: 863–74. [DOI] [PubMed] [Google Scholar]
- de Jong EP, van Riper SK, Koopmeiners JS, Carlis JV and Griffin TJ (2011). Sample collection and handling considerations for peptidomic studies in whole saliva; implications for biomarker discovery. Clin Chim Acta 412: 2284–8. [DOI] [PMC free article] [PubMed] [Google Scholar]
- Denny PC, Denny PA, Takashima J, Galligan J and Navazesh M (2007). A novel caries risk test. Annals of the New York Academy of Sciences 1098: 204–15. [DOI] [PubMed] [Google Scholar]
- Dewhirst FE, Chen T, Izard J, Paster BJ, Tanner AC, Yu WH, Lakshmanan A and Wade WG (2010). The human oral microbiome. Journal of bacteriology 192: 5002–17. [DOI] [PMC free article] [PubMed] [Google Scholar]
- Helmerhorst EJ, Alagl AS, Siqueira WL and Oppenheim FG (2006). Oral fluid proteolytic effects on histatin 5 structure and function. Archives of oral biology 51: 1061–70. [DOI] [PubMed] [Google Scholar]
- Helmerhorst EJ and Oppenheim FG (2007). Saliva: a dynamic proteome. Journal of dental research 86: 680–93. [DOI] [PubMed] [Google Scholar]
- Helmerhorst EJ, Sun X, Salih E and Oppenheim FG (2008). Identification of Lys-Pro-Gln as a novel cleavage site specificity of saliva-associated proteases. The Journal of biological chemistry 283: 19957–66. [DOI] [PMC free article] [PubMed] [Google Scholar]
- Henson BS and Wong DT (2010). Collection, storage, and processing of saliva samples for downstream molecular applications. Methods in molecular biology (Clifton, N.J 666: 21–30). [DOI] [PubMed] [Google Scholar]
- Hu S, Gao K, Pollard R, Arellano-Garcia M, Zhou H, Zhang L, Elashoff D, Kallenberg CG, Vissink A and Wong DT (2010). Preclinical validation of salivary biomarkers for primary Sjögren’s syndrome. Arthritis care & research 62: 1633–8. [DOI] [PMC free article] [PubMed] [Google Scholar]
- Hu S, Wang J, Meijer J, Ieong S, Xie Y, Yu T, Zhou H, Henry S, Vissink A, Pijpe J, Kallenberg C, Elashoff D, Loo JA and Wong DT (2007). Salivary proteomic and genomic biomarkers for primary Sjögren’s syndrome. Arthritis and rheumatism 56: 3588–600. [DOI] [PMC free article] [PubMed] [Google Scholar]
- Kaufman E and Lamster IB (2002). The diagnostic applications of saliva--a review. Crit Rev Oral Biol Med 13: 197–212. [DOI] [PubMed] [Google Scholar]
- Kim YJ, Choi YS, Baek KJ, Yoon SH, Park HK and Choi Y (2016). Mucosal and salivary microbiota associated with recurrent aphthous stomatitis. BMC microbiology 16 Suppl 1: 57. [DOI] [PMC free article] [PubMed] [Google Scholar]
- Laheij AM, Rasch CN, Brandt BW, de Soet JJ, Schipper RG, Loof A, Silletti E and van Loveren C (2015). Proteins and peptides in parotid saliva of irradiated patients compared to that of healthy controls using SELDI-TOF-MS. BMC research notes 8: 639. [DOI] [PMC free article] [PubMed] [Google Scholar]
- Matse JH, Yoshizawa J, Wang X, Elashoff D, Bolscher JG, Veerman EC, Bloemena E and Wong DT (2013). Discovery and prevalidation of salivary extracellular microRNA biomarkers panel for the noninvasive detection of benign and malignant parotid gland tumors. Clinical cancer research : an official journal of the American Association for Cancer Research 19: 3032–8. [DOI] [PubMed] [Google Scholar]
- Miller CS, Foley JD 3rd, Floriano PN, Christodoulides N, Ebersole JL, Campbell CL, Bailey AL, Rose BG, Kinane DF, Novak MJ, McDevitt JT, Ding X and Kryscio RJ (2014). Utility of salivary biomarkers for demonstrating acute myocardial infarction. Journal of dental research 93: 72S–79S. [DOI] [PMC free article] [PubMed] [Google Scholar]
- Miller CS, Foley JD, Bailey AL, Campell CL, Humphries RL, Christodoulides N, Floriano PN, Simmons G, Bhagwandin B, Jacobson JW, Redding SW, Ebersole JL and McDevitt JT (2010). Current developments in salivary diagnostics. Biomarkers in medicine 4: 171–89. [DOI] [PMC free article] [PubMed] [Google Scholar]
- Oppenheim FG (1970). Preliminary observations on the presence and origin of serum albumin in human saliva. Helv Odontol Acta 14: 10–7. [PubMed] [Google Scholar]
- Oppenheim FG (2008). Historical perspectives and present. In: Salivary diagnostics Ed. Wong DT: 79–92. [Google Scholar]
- Oppenheim FG and Hay DI (1972). Further studies of human serum albumin in oral fluid. Helv Odontol Acta 16: 22–6. [PubMed] [Google Scholar]
- Ornstein L (1964). Disc Electrophoresis. I. Background and Theory. Annals of the New York Academy of Sciences 121: 321–49. [DOI] [PubMed] [Google Scholar]
- Ramseier CA, Kinney JS, Herr AE, Braun T, Sugai JV, Shelburne CA, Rayburn LA, Tran HM, Singh AK and Giannobile WV (2009). Identification of pathogen and host-response markers correlated with periodontal disease. Journal of periodontology 80: 436–46. [DOI] [PMC free article] [PubMed] [Google Scholar]
- Ryu OH, Atkinson JC, Hoehn GT, Illei GG and Hart TC (2006). Identification of parotid salivary biomarkers in Sjögren’s syndrome by surface-enhanced laser desorption/ionization time-of-flight mass spectrometry and two-dimensional difference gel electrophoresis. Rheumatology 45: 1077–86. [DOI] [PubMed] [Google Scholar]
- Schafer CA, Schafer JJ, Yakob M, Lima P, Camargo P and Wong DT (2014). Saliva diagnostics: utilizing oral fluids to determine health status. Monographs in oral science 24: 88–98. [DOI] [PubMed] [Google Scholar]
- Schipper R, Loof A, de Groot J, Harthoorn L, Dransfield E and van Heerde W (2007a). SELDI-TOF-MS of saliva: methodology and pre-treatment effects. Journal of chromatography 847: 45–53. [DOI] [PubMed] [Google Scholar]
- Schipper RG, Silletti E and Vingerhoeds MH (2007b). Saliva as research material: biochemical, physicochemical and practical aspects. Archives of oral biology 52: 1114–35. [DOI] [PubMed] [Google Scholar]
- Schroeder HE and Listgarten MA (2003). The junctional epithelium: from strength to defense. Journal of dental research 82: 158–61. [DOI] [PubMed] [Google Scholar]
- Silva-Boghossian CM, Colombo AP, Tanaka M, Rayo C, Xiao Y and Siqueira WL (2013). Quantitative proteomic analysis of gingival crevicular fluid in different periodontal conditions. PloS one 8: e75898. [DOI] [PMC free article] [PubMed] [Google Scholar]
- Siqueira WL and Dawes C (2011). The salivary proteome: challenges and perspectives. Proteomics 5: 575–9. [DOI] [PubMed] [Google Scholar]
- Spielmann N and Wong DT (2011). Saliva: diagnostics and therapeutic perspectives. Oral Dis 17: 345–54. [DOI] [PMC free article] [PubMed] [Google Scholar]
- Tabak LA (2007). Point-of-care diagnostics enter the mouth. Annals of the New York Academy of Sciences 1098: 7–14. [DOI] [PubMed] [Google Scholar]
- Terrapon B, Mojon P, Mensi N and Cimasoni G (1996). Salivary albumin of edentulous patients. Archives of oral biology 41: 1183–5. [DOI] [PubMed] [Google Scholar]
- Thomadaki K, Bosch J, Oppenheim F and Helmerhorst E (2013). The diagnostic potential of salivary protease activities in periodontal health and disease. Oral Dis 19: 781–8. [DOI] [PMC free article] [PubMed] [Google Scholar]
- Thomadaki K, Helmerhorst EJ, Tian N, Sun X, Siqueira WL, Walt DR and Oppenheim FG (2011). Whole-saliva proteolysis and its impact on salivary diagnostics. Journal of dental research 90: 1325–30. [DOI] [PMC free article] [PubMed] [Google Scholar]
- Yakob M, Fuentes L, Wang MB, Abemayor E and Wong DT (2014). Salivary biomarkers for detection of oral squamous cell carcinoma - current state and recent advances. Current oral health reports 1: 133–141. [DOI] [PMC free article] [PubMed] [Google Scholar]
- Zhang Y, Sun J, Lin CC, Abemayor E, Wang MB and Wong DT (2016). The emerging landscape of salivary diagnostics. Periodontology 2000 70: 38–52. [DOI] [PubMed] [Google Scholar]