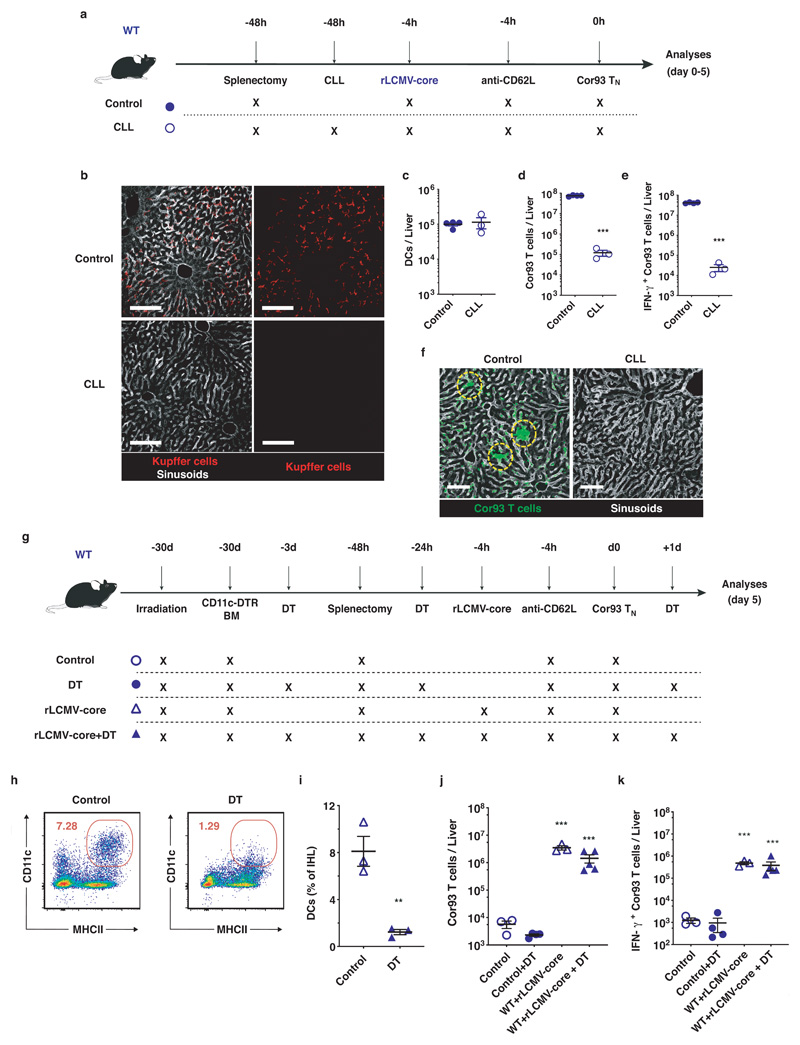
Extended Data Fig. 3. Kupffer cells, but not dendritic cells, promote CD8+ T cell effector differentiation upon rLCMV injection.
(a) Schematic representation of the experimental setup. 5 x 10⁶ Cor93 TN were transferred into C57BL/6 (WT) recipients. Mice were splenectomized and treated with anti-CD62L 48 hours and 4 hours prior to cell transfer, respectively and injected with 2.5 x 10⁵ infectious units of non-replicating rLCMV-core 4 hours prior to Cor93 TN transfer. Where indicated, mice were treated with clodronate liposomes (CLL) 48 hours prior to Cor93 TN transfer. (b) Confocal microscopy of liver sections from control mice (left panels) and clodronate liposomes-treated mice (right panels). Kupffer cells are depicted in red in all panels, while sinusoids are depicted in grey only in the first and third panel. Scale bars represent 100 μm. (c) Absolute numbers of CD11c+ MHC-IIhigh dendritic cells (DCs) in the livers of the indicated mice. (d-e) Absolute numbers of total (d) and of IFN-γ producing (e) Cor93 T cells in the livers of the indicated mice five days after Cor93 TN transfer. n = 4 (Control), 3 (CLL). Results are expressed as mean ± SEM. Means among groups were compared with two-tailed t test. (f) Confocal immunofluorescence micrographs of liver sections from the indicated mice five days after Cor93 TN transfer. Scale bars represent 100 μm. (g) Schematic representation of the experimental setup. WT mice were lethally irradiated and reconstituted with CD11c-DTR bone marrow (BM). 1 x 10⁶ Cor93 TN were transferred into recipients. Mice were injected with 2.5 x 10⁵ infectious units of non-replicating rLCMV-core 4 hours prior to Cor93 TN transfer. Indicated mice were treated with 400 ng of diphtheria toxin three days before, one day before and one day after T cell transfer. Livers were collected and analysed five days after Cor93 TN transfer. (h) Representative flow cytometry plots in the liver of control (left) or DT-treated (right) mice. (i) CD11c+ MHC-II+ DCs (expressed as percentage of the total intrahepatic leukocyte population, IHL) in the livers of the indicated mice. n = 3. Results are expressed as mean ± SEM. Means among groups were compared with two-tailed t test. (j-k) Absolute numbers of total (j) and of IFN-γ-producing (k) Cor93 T cells in the livers of the indicated mice five days after Cor93 TN transfer. n = 3 (Control and WT + rLCMV-core), 4 (Control + DT), 5 (WT + rLCMV-core + DT). Results are expressed as mean ± SEM. Means among groups were compared with one-way ANOVA with Bonferroni post-test.
Data are representative of 3 independent experiments. ** p value < 0.01, *** p value < 0.001. Mouse drawings were adapted from reference 69.

