Abstract
Tetraploid emmer wheat (Triticum turgidum subsp. dicoccon) is a progenitor of the world’s most widely grown crop, hexaploid bread wheat (T. aestivum), as well as the direct ancestor of tetraploid durum wheat (T. turgidum subsp. turgidum). Emmer was one of the first cereals domesticated in the old world, cultivated from around 9700 BCE in the Levant1,2 and subsequently in South-Western Asia, Northern Africa, and Europe with the spread of Neolithic agriculture3,4. Here we report whole genome sequence from a museum specimen of Egyptian emmer wheat chaff, 14C-dated to the New Kingdom 1,130 – 1,000 BCE. Its genome shares haplotypes with modern domesticated emmer at shattering, seed size, and germination loci, and within other putative domestication loci, suggesting these traits share a common origin prior to emmer’s introduction to Egypt. Its genome is otherwise unusual, carrying haplotypes that are absent from modern emmer. Genetic similarity with modern Arabian and Indian emmer landraces connects ancient Egyptian emmer with early South-Eastern dispersals, while inferred gene flow with wild emmer from the Southern Levant signals a later connection. Our results show the importance of museum collections as sources of genetic data to uncover the history and diversity of ancient cereals.
Keywords: archaeobotany, ancient DNA, museum specimens, emmer wheat
Ancient DNA sequences can reveal dispersal and domestication histories. In crops, exome sequencing of barley5 from 4000 BCE suggests population continuity for Southern Levantine barley. In maize, targeted capture and whole genome sequencing of samples from up to 4000 BCE showed that some domestication alleles were not yet fixed6–8. Sorghum genomes as old as 195CE reveal a decline in genetic diversity since this date9. Thus far in wheat, archaeogenetic studies have primarily targeted single genes, such as glutenin10,11. Despite their importance, we are not aware of any analyses of whole genome sequence from ancient wheat.
The quintessential cereal domestication trait is non-shattering; spikes retain their seeds, making harvest easier but hindering natural dispersal12. Shattering variation in emmer wheat is largely explained by quantitative trait loci (QTL) on chromosomes 3A and 3B containing homologues of the barley brittle rachis gene13–15. Loss of dormancy and increased seed size are also associated with domestication16–18. In wild emmer, each spikelet contains two seeds, one of which is smaller and remains dormant for over a year after shedding19. The paired grains in domesticated emmer and durum spikelets are the same size and germinate readily17. Both traits are controlled by a QTL on chromosome 4B20.
Archaeobotanical evidence suggests that emmer was domesticated over several millennia, with non-shattering fixed across the Northern and Southern Levant from 6300BCE1,3,21. Emmer was cultivated in Egypt from the earliest settlements (5500-4500 BCE)22,23. Hulled emmer wheat is harder to process than free-threshing durum and bread wheats but may be preferred for cultural reasons, hardiness, or because the grain is better protected from pests during storage24. Free-threshing tetraploid durum and hexaploid bread wheats were increasingly cultivated in Egypt as cultural practices shifted following Alexander the Great’s conquest in 332BCE24,25. Today, emmer cultivation is rare in Egypt but it remains an important crop in Ethiopia, Yemen, and parts of India26.
We sequenced a museum specimen of emmer wheat and compared its genome against the wild emmer wheat reference and modern exonic variants13, and addressed five questions: Do museum crop specimens – here stored in suboptimal conditions for decades – still contain useful endogenous DNA? What are the biogeographical relationships between ancient Egyptian and modern emmer wheat, and the likely history of its dispersal to and from Egypt? Does this sample contain haplotypes absent from sequenced modern accessions, due to either incomplete sampling of the modern emmer gene pool or the historical loss of alleles? Is there evidence of gene flow from wild emmer? Lastly, does ancient Egyptian emmer preferentially resemble modern domesticated accessions at loci associated with domestication?
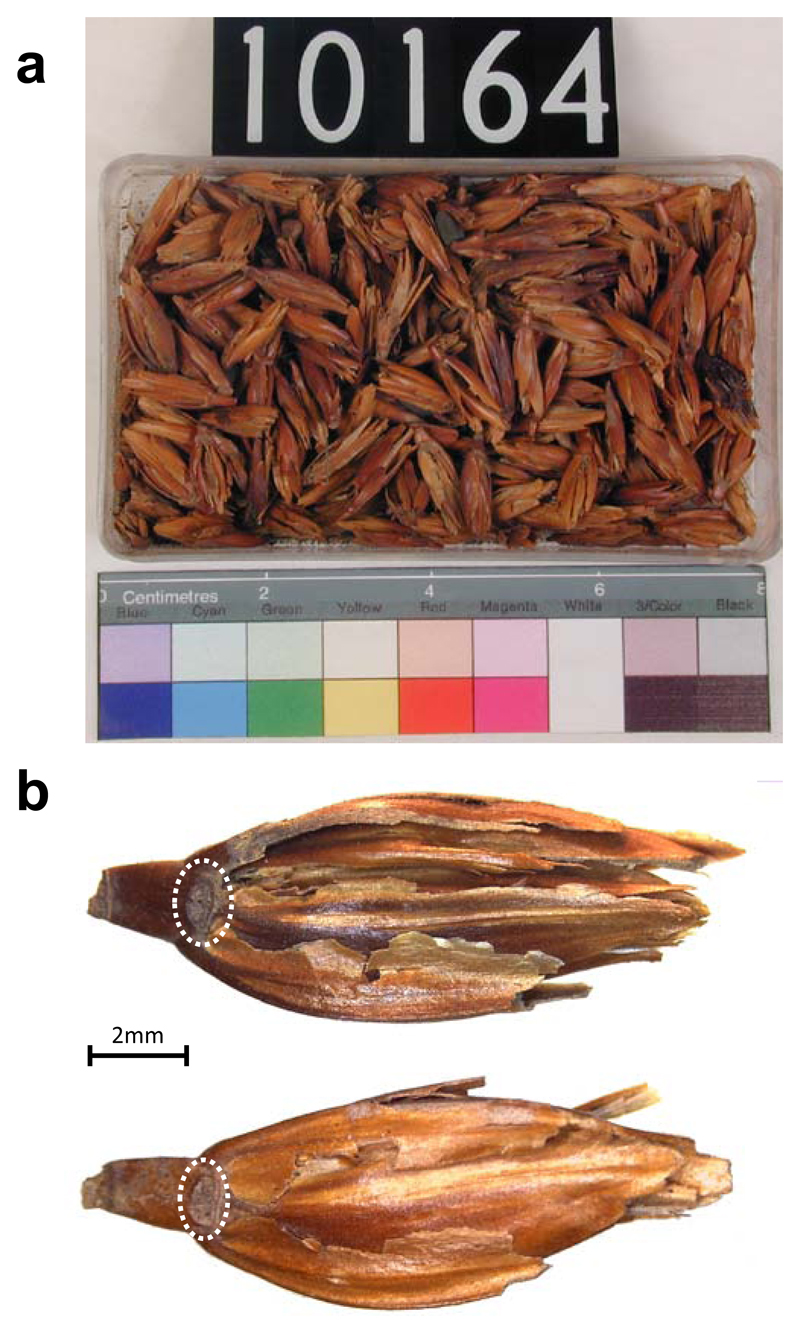
We obtained whole genome sequence from an accession of ancient Emmer wheat chaff (hereafter UC10164), which was collected by Brunton and Caton-Thomson from the Hememiah North Spur archaeological site in the 1920s27 and is now stored at the UCL Petrie Museum of Egyptian Archaeology (Figure 1a). AMS 14C dating of two seeds placed this accession in the New Kingdom’s Late Ramesside period, Dyn. 20, 1,130 – 1,000 cal. BCE, representing a mature ancient Egyptian agricultural period (Extended Data 1). Two specimens were chosen for sequencing (hereafter S1 and S2), both of which had the non-shattering domestication trait based on visual inspection (Figure 1b). S1 had a high endogenous content: 66% of 861M reads were alignable to the Zavitan v2 modern wild emmer wheat reference genome13, including ambiguous and duplicate alignments. S2 yielded lower endogenous content (only 33% of reads were alignable) and was sequenced to lower depth (59.3M reads), and hence was only used for comparison with S1.
Figure 1. Emmer wheat husks in accession UC10164 and the sequenced specimens.
a, An image of accession UC10164 of emmer wheat husks as stored. Scale is indicated by the ruler at the bottom. Photograph courtesy of the Petrie Museum of Egyptian Archaeology, UCL. b, The specimens that we used for sequencing; rough disarticulation scars, which are diagnostic of the non-shattering phenotype, are indicated by circles. Scale bar, 2 mm.
In order to mitigate variant-calling errors arising from low complexity regions, we attempted to call genotypes only at 1.6M Single Nucleotide Polymorphism (SNP) sites segregating among 64 modern wild and domestic emmer accessions, identified using exome capture13. We obtained 0.48x coverage of these SNP sites after excluding sequences <35bp, alignments with mapping quality scores less than 30, and duplicate alignments. We then applied further quality control filters to mitigate biases from the alignment of short reads28 and required at least two alignments to cover each site in S1, resulting in 99,078 called SNP genotypes, on which we based our analyses.
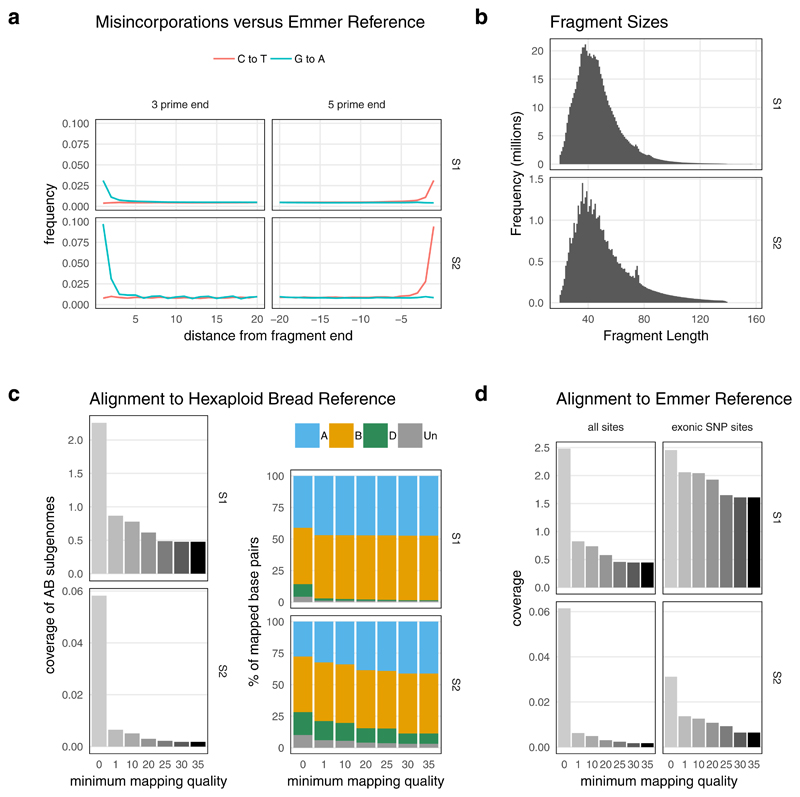
Multiple lines of evidence indicate these data are from ancient material and are reliable: First, the small fragment sizes and the deamination patterns, assessed using MapDamage29, are characteristic of authentically ancient DNA (Extended Data 2). After trimming bases potentially affected by deamination, UC10164 does not show an excess of deamination-related substitutions, falling within the distribution of the modern samples (Supplementary Table 5). In addition, to rule out contamination by modern hexaploid bread wheat (T. aestivum), we assessed cross-mapped alignments against the bread wheat reference30. 99.4% of S1 alignments with mapping quality scores of at least 30 were to the A or B subgenomes, which derive from emmer wheat (Extended Data 2) and only 0.6% to the D genome which is absent from emmer. 7.6% of S2 alignments were to the D subgenome. We called low confidence genotypes from S2 without filtering on coverage depth and found 184 sites that overlapped with S1, of which 172 (93.5%) matched the genotype calls from S1. Thus, concordance between S1 and S2 is higher than between S1 and any modern accession (mean 80.7%, sd 2.6%, maximum 87.4%).
The number of heterozygous calls in UC10164 (S1) was consistent with emmer’s outcrossing rate of less than 1%31. Among modern accessions, heterozygosity at called sites was between 0.4% and 4.1% (mean 1.4%, sd 0.6%). We estimated heterozygosity in UC10164 to be 1.2%, using only the 3,160 SNP sites covered by four sequences. Finally, as described below, we found large genomic segments, sometimes extending over tens of Mb, over which UC10164 shares a haplotype with one or more wild and/or domesticated modern emmer accessions. That long haplotypes of UC10164 are almost identical to a modern accession suggests our genotype calls are accurate.
We next sought to place UC10164 in its historical dispersal context, specifically its relation to the early Eastwards dispersal of emmer into the Indus valley by ~6000 BCE and the Southern Arabian peninsula by 2500 BCE32,33. Emmer was introduced in the Nile valley from around 4500 BCE probably via the Southern Levant24 (Extended Data 1). Modern wild emmers divide into two subgroups (Northern Levant and Southern Levant) and modern domesticated emmer into four genetic subgroups of domesticated emmer (Mediterranean, Caucasus, Eastern European, and Indian Ocean)13.
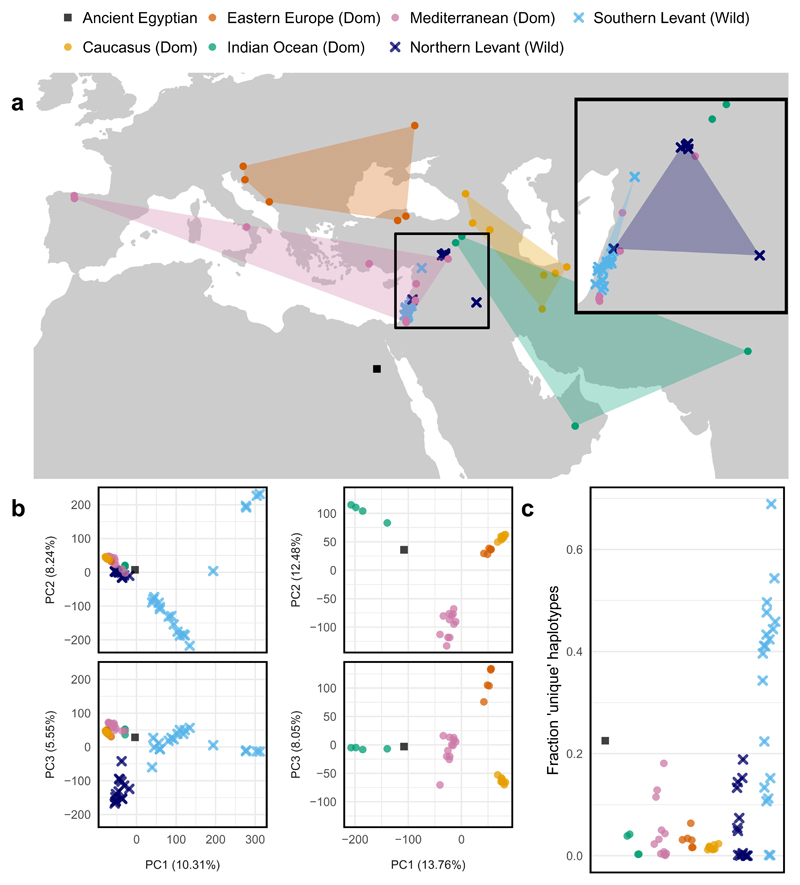
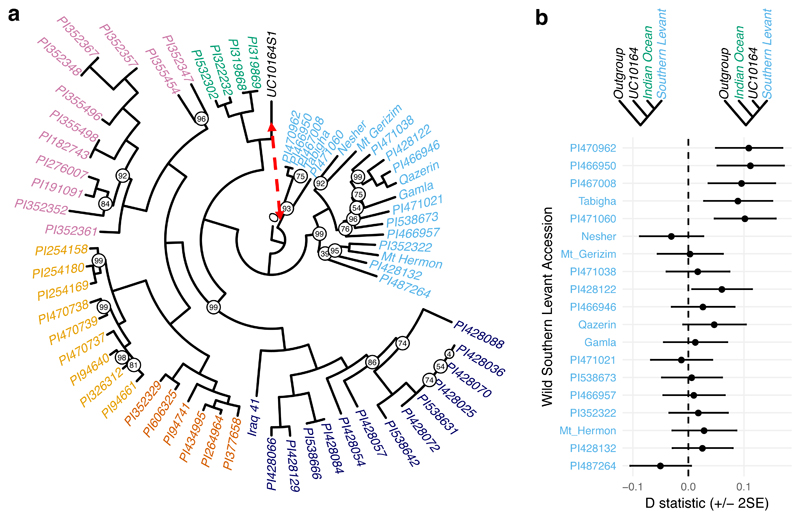
Based on the 99,078 SNPs, we used several methods to map genome-wide similarity between UC10164 and modern accessions, which all confirm that UC10164 is genetically closest to domesticated accessions and specifically to the domesticated Indian Ocean subgroup. First, identity by state at these SNPs shows UC10164 is most concordant (86.4%-87.4%) with the Indian Ocean subgroup, compared to other domesticated accessions (mean 81.7%, sd 1.8%) or wild accessions (mean 79.1%, sd 1.6%), Supplementary Table 2. Second, UC10164 is closest to the Indian Ocean accessions in a Principal Components Analysis (PCA) visualization of genetic similarity among accessions, Figure 2b. Third, phylogenetic analysis (Figure 3a) shows UC10164 branches closest to (but not within) the Indian Ocean clade. Finally, ADMIXTURE34 source population inference indicates that UC10164 shares most ancestry with the Indian Ocean subgroup (Extended Data 3b). The Indian Ocean subgroup consists of one accession from each of Oman and India, and two from Turkey (Figure 2a). Thus, UC10164 resembles domesticated emmers that dispersed to the East and South from the Levant.
Figure 2. The relationship between UC10164 and modern emmer wheat.
a–c, The geographical (a) and genetic (b,c) relationships between UC10164 and 64 modern accessions of emmer wheat. The filled areas in a indicate the geographical area enclosed by the domesticated (Dom) accessions in each subgroup. Inset: a zoom of the region from which most of the wild accessions originate. The legend in a applies to all panels. b. The first three principal components are shown for a PCA using all samples (left) and only domesticated samples (right). UC10164 clusters with the modern domesticated emmers, which are all closer to wild Northern Levant emmers than they are to wild Southern Levant emmers. Of the modern domesticated emmers, UC10164 is closest to the Indian Ocean subgroup (green). c, The fractions of unique haplotypes in each accession. Haplotypes were defined using 50-SNP sliding windows. Unique haplotypes have less than 95% genotypic similarity with each of the other accessions. For b and c, the 99,078 SNP sites called in UC10164 were used.
Figure 3. Phylogenetic analysis of UC10164 and 64 modern emmer wheat accessions.
a, Maximum Lilkelihood tree with bootstrap support displayed on nodes where it is less than 100. b, D statistics for 19 wild accessions in the Southern Levant subgroup using the phylogeny: (outgroup, (Southern Levant accession, (Indian Ocean subgroup, UC10164))). Displayed s.e. were calculated using a jackknife with blocks of 5Mb. Positive D statistics indicate an excess of derived alleles are shared between the wild Southern Levant accession and UC10164. The red dashed arrow in a indicates a putative gene flow event that could lead to the observed pattern of derived allele sharing.
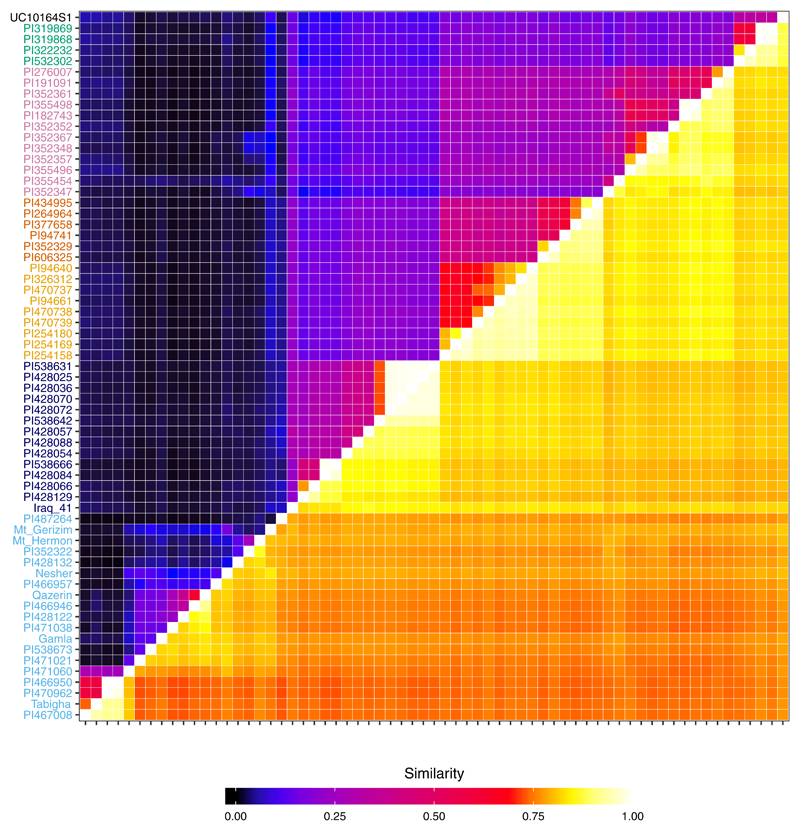
Overall, the genotype of UC10164 is distinct from modern emmers. It is most concordant (87.4%) with the modern accession PI319868, from the Indian Ocean subgroup, Supplementary Table 2. Only one modern domesticate is less concordant with other accessions (PI352347, with maximum concordance of 86.6% with PI355454, both of which are in the Mediterranean subgroup; Extended Data 4). UC10164 falls closest to, but outside, the cluster of Indian Ocean accessions on the three main principal components (Figure 2b) and it is outside their phylogenetic clade (Figure 3a). Furthermore, UC10164 has many unique haplotypes, defined using sliding windows of 50 SNPs (Figure 2c). These might represent lost alleles or possibly incomplete sampling of modern emmer (few of the sequenced modern emmers are in the Indian Ocean subgroup, and none are from Africa). Emmer cultivation all but disappeared in the Nile valley since the Roman era35,36 and so it is likely much ancient Egyptian emmer diversity has been lost.
Compared to modern domesticates, UC10164 has high concordance with wild Southern Levant emmers (Extended Data 4), falls closer to them in the PCA (Figure 2b) and shares ancestry with them as inferred from ADMIXTURE source population inference (Extended Data 3b). We tested for gene-flow between wild Southern Levant emmer wheat and UC10164 using a four-population test37. As with our phylogenetic analysis (Figure 3a, Extended Data 3a), we constructed an outgroup genotype using reads from the diploid species Triticum urartu and Aegilops speltoides, which are likely progenitors of emmer38, to call variants on the A and B subgenomes, respectively. Then, using D statistics, we compared the frequency of derived alleles that each wild Southern Levant accession shares with UC10164 versus the domesticated Indian Ocean subgroup37. Five wild Southern Levant emmers share a significant excess of alleles with UC10164, with Z scores between 2.076-4.775 (P<0.05 against the null hypothesis that UC10164 and the Indian Ocean subgroup share an equal fraction of derived alleles with these Southern Levant wild accessions), calculated using block jackknife sizes ranging from 100kb-50mb, (Supplementary Table 3). We conclude that gene flow likely occurred between the ancestors of UC10164 and Southern Levant wild emmers (Figure 3).
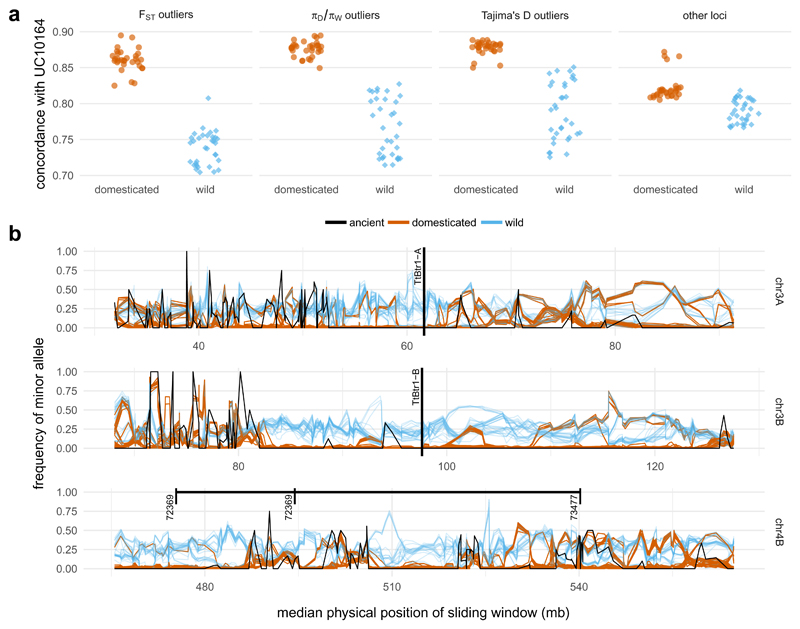
We next asked whether UC10164 shared a common history of selection under domestication with modern domesticates. We initially focused on well-characterized QTL for domestication traits. For shattering, QTLs on chromosomes 3A and 3B contain putative loss-of-function insertion/deletion mutations in the TtBtr1-A and TtBtr1-B genes13. At these QTLs, all domesticated accessions are very similar, while genetic diversity among wild accessions remains high (Figure 4), indicative of selective sweeps. From the size of these regions (4Mb and 5.5Mb), we estimated selection coefficients39,40 in the ranges of 0.002-0.020 and 0.003-0.027 assuming crossover rates of 0.1-0.5cM/Mb13, a selfing rate of 0.99-0.99531. A QTL on chromosome 4B has major effects on grain size and seed dormancy20 and a 3Mb (509-512Mb) signal of a selective sweep among domesticated accessions, implying a selection coefficient in the range of 0.0007-0.0060 (assuming a lower crossover rate of 0.05-0.2cM/Mb in this region13). Although the density of genotyped SNPs in the ancient specimen – exaggerating the variance in minor allele frequency – UC10164 carries the same allele as in the majority of domesticated accessions at 98 of 99 SNPs called within these three QTLs (Figure 4b, Extended Data 5).
Figure 4. Haplotype sharing between UC10164 and modern emmer wheat within loci associated with selection under domestication.
a, Increased concordance between UC10164 and domesticated accessions (brown) compared to wild accessions (blue), within regions that show putative signatures of selection under domestication, as defined by FST, domesticated/wild nucleotide diversity (πD/πW) and Tajima’s D compared with other non-selected loci. b, The minor allele frequency of all of the samples within 100-SNP sliding windows (moved in 50-SNP intervals) in the regions containing QTLs identified for the following key domestication traits: shattering (chromosomes 3A and 3B) and grain size and seed dormancy (chromosome 4B). The position of putative loss-of-function mutations in TtBr1-A and TtBr1-B is labelled. The range on chromosome 4B shows the maximum extent of plausible positions found for the markers (72369 and 73477) that flank the QTL peak on chromosome 4B. All three cases contain regions in which all of the modern domesticated accessions (brown) and UC10164 (black) have reduced diversity and carry the major allele, which is defined here relative to modern domesticated accessions. Wild accessions are plotted in blue.
We then examined a wider set of loci previously hypothesised to have been selected during domestication in modern accessions13, but with unknown phenotypic effects. We used the most extreme 5% of loci (2Mb sliding windows), as determined on the basis of the fraction of total genetic variance due to differences between domesticated vs wild accessions (FST, n=505), domesticated:wild nucleotide diversity πD/πW (n=503), and Tajima’s D in domesticated emmer (n=505). These comprise 1,155 unique loci after accounting for overlaps between selection scans. The concordance of UC10164 with domesticated accessions outside these loci resembled the genome-wide average, with a markedly elevated concordance between UC10164 and the four Indian Ocean accessions (Figure 4a). However, within the 1,155 loci, UC10164 is significantly (P<0.001, based on a locus randomization test) more concordant with all the modern domesticated than modern wild accessions. Of the 1,155 loci, only seven overlap with selective sweeps for shattering, seed size, and germination. Thus, the shared selection history between UC10164 and modern domesticated emmers extends well beyond these well-characterized QTLs.
Across loci associated with selection under domestication, UC10164 is enriched for alleles characteristic of modern domesticated emmer. At QTL for key domestication traits – shattering, seed dormancy and seed size – all modern domesticated emmers share a haplotype with UC10164. Therefore, selection at these loci probably occurred during domestication in the Near East, between 9700 and 6300 BCE and prior to the introduction of emmer into Egypt (5500-4500 BCE), consistent with archaeological evidence21,41.
UC10164 most closely resembles modern domesticated emmer from India, Oman, and Turkey. RFLPs and karyotypes42,43 suggest modern landraces from Yemen and Ethiopia should also resemble UC10164. Our data indicate a connection between early eastward and southward dispersals of emmer, distinct from northward and westward dispersals. This connects the arrival of cereal agriculture across the Iranian Plateau and into the Indus valley by 6000 BCE with its dispersal into the Nile Valley around 4500 BCE32,33,44, and then into northern Sudan within a few centuries45 (Extended Data 1).
We found evidence of gene flow between wild Southern Levant emmers and ancient Egyptian emmer, possibly during cultivation within the range of wild emmer prior to its introduction to Egypt24,25, or during a later period of Egyptian interaction with or occupation of the Levant (e.g., 1300-1185 BCE)46. Hybridization between modern wild and domesticated emmer growing together in the Southern Levant has been proposed42,43,47,48, and similar signals are found in this study (‘Mediterranean’ accessions PI355454 and PI52347, Extended Data 3b). These results highlight the geographically extensive nature of wild progenitor contributions to crop diversity47,48.
Emmer wheat cultivation in Egypt was extensive in antiquity but has since dramatically declined24. It is therefore not unexpected that UC10164 is relatively distinct compared to sequenced modern emmer. This may represent incomplete sampling (particularly from Africa and Arabia) or extinct ancient variation. As has been recently suggested49, ancient alleles lost in modern domesticates might be targeted for re-introduction from the wild to boost crop improvement.
Wheat genomic resources13,30 now permit the analysis of whole-genome sequence data, in this case from emmer chaff harvested over 3,000 years ago. Genomes of older, Neolithic, wheats might determine when domestication alleles accumulated and/or pinpoint gene flow events between crops and wild relatives48. Importantly, material excavated about 90 years ago and since then stored without climate control can yield usable DNA, which accentuates the great potential of archaeobotanical museum specimens for genetic analysis.
Online Methods
Plant material, radiocarbon dating and morphological analysis
The emmer wheat samples were excavated from the Hememiah North Spur archaeological site in Egypt from 1921 onwards27. The plant material in this study was collected from the west side of the site. Even though the seeds were initially ascribed to the Predynastic Badarian period, the authors report intrusive burials from the Old Kingdom at the site. Furthermore, it is doubtful that extensive cultivation occurred in this area in the Badarian44. The plant material was originally identified as emmer wheat by Dr. John Percival and subsequently confirmed by Dorian Fuller and Chris Stevens in the UCL archaeobotany laboratory.
The accession used in the present study comprises uncarbonized chaff stored at the Petrie Museum of Egyptian Archaeology, University College London, under collection number UC10164 (Figure 1a). Two samples were chosen (S1 and S2) (Figure 1b), both of which have rough disarticulation scars visible below and above the internode (Figure 1b). These disarticulation scars are the most reliable diagnostic elements for domesticated forms of emmer wheat50 and indicate that the specimens came from ears that did not readily shatter. Replicated Accelerator Mass Spectrometry 14C dating was performed on two further specimens from the accession at the Beta Analytic Inc. laboratory in Miami, Fl. USA and the results are given in Supplementary Table 4. The two-sigma calibration of the combined dates is 1130-1000 Cal. BCE as calculated in OxCal v.3.1051 using IntCal1352.
Archaeobotanical database
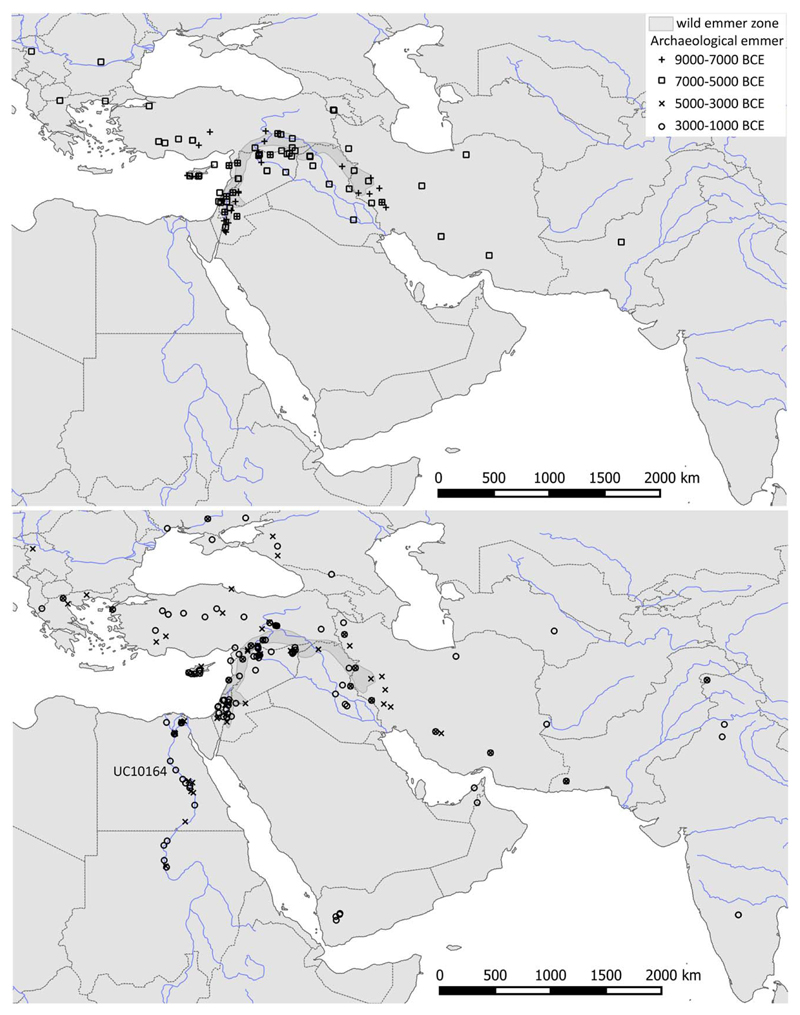
The archaeobotanical evidence for the occurrences of emmer wheat over time in the Middle East, Egypt and around the Indian Ocean was compiled from the Old World Crops Database generated at UCL as part of the European Research Council research project on “Comparative Pathways to Agriculture” (ERC #323842). These data track the dispersal of emmer wheat eastwards from the Levant prior to the occurrence of these cereals in the Nile Valley33. The distribution of emmer based on median archaeological ages is shown in Extended Data 1.
DNA extraction and sequencing
DNA extraction was carried out within the UCL clean-room ancient DNA research facilities, in which no previous extractions of wheat had been performed. Sample S1 was briefly immersed in 0.5% bleach whereas sample S2 was not, both samples were thoroughly rinsed and crushed to powder. They were then immersed in 2% CTAB buffer (containing 1% polyvinylpyrrolidone) and incubated at 37°C for 6 days. DNA was extracted first with chloroform:isoamyl-alcohol 24:1 and purified using the DNEasy Plant Mini Kit (Qiagen) with a single modification to binding buffer amount (3x elutant volume as opposed to suggested 1.5x) and second with 300 μl of acetone instead of AW2 buffer to reduce material loss.
Genomic sequencing libraries were prepared at the Natural History Museum, London, as in53, and partially uracil-DNA-gylcosylase (UDG) treated as described previously54. UDG treatment removes nucleotide misincorporations that are associated with aDNA. After partial UDG treatment, a small fraction of these misincorporations should be retained in the terminal nucleotides of each fragment, which can be used to authenticate the ancient origin of the DNA. The same library preparation procedure was performed for extraction and library preparation controls. Tapestation and Qubit results indicated that there were negligible amounts of DNA present in these controls. Sequencing was performed at the UCL Institute of Neurology High Throughput Sequencing centre on an Illumina NextSeq 500. Controls were spiked into a sequencing lane for an unrelated pooled library. Samples S1 and S2 were barcoded and initially pooled with other libraries, yielding 2x77million and 2x54million 75bp reads, respectively. Sample S1 was then re-sequenced twice without pooling, yielding a further 2x378million and 2x361million 75bp reads (2x861million reads in total). Sequencing and alignment statistics are summarised in Supplementary Table 1.
Alignment
Adapters were removed from the raw reads using AdapterRemoval v2.2.255 with options --trimns and --trimqualities to remove low quality and ambiguous bases from the ends of reads, and to collapse overlapping paired reads into a single sequence for each read pair. We only used sequences that could be successfully collapsed for further analysis and discarded sequences <20bp. The length distribution of the resulting 649M S1 sequences and 46M S2 sequences is shown in Extended Data 2b. From the library preparation control, only 14 sequences (3.3%) remained after adapter removal.
These sequences were aligned to the Zavitan v2 reference genome for emmer wheat13 using bwa aln (with options -l 16500, -n 0.01 -o 2, which set the number of seeds, maximum fraction of missing alignments, and maximum number of gap opens, respectively) and bwa samse56, as in57. Patterns of nucleotide mis-incorporation, particularly driven by cytosine deamination, are often used to authenticate the ancient origin of next-generation sequencing reads29,58. After partial UDG treatment, we expect a small excess of thymine base-calls relative to the Zavitan wild emmer wheat reference genome at the 5’ end and a small excess of cytosine base-calls at the 3’ end. We confirmed this expected pattern in the first and last 2 bp of the sequence fragments using MapDamage v2.0 software29, which also shows that the fragment interior is negligibly affected, see Extended Data 2a.
We trimmed the first and last 2 bp of each read from the fastq sequence files using the fastX toolkit 0.0.13 (http://hannonlab.cshl.edu/fastx_toolkit/index.html) and re-aligned the reads to the reference genome. We used GATK59 (v4.0.5.2) MarkDuplicates, which marked ~37% of all S1 alignments as duplicates that would later be ignored during genotype calling. Alignment statistics after these steps are summarised in Extended Data 2 and Supplementary Table 1.
For the controls, we obtained 2x422 75bp reads from the library preparation control only, of which only fourteen collapsed sequences remained after adapter removal. Only one sequence could be aligned to the emmer wheat reference genome. This alignment would have failed several of our quality control filters (see below): the mapping quality was 0 (threshold 30), the length was 24bp (threshold 35bp), and the alignments were to non-exonic regions. Visual inspection of this sequence indicated that it was likely to be adapter sequence that was not successfully removed. Given that the controls yielded negligible DNA and that the sequences that were obtained were predominantly from adapters, the controls do not provide evidence of biological contamination.
Genotyping
We only attempted to call genotypes at 1.6M exonic SNP sites previously identified as polymorphic among modern accessions by13. These exonic sites are relatively non-repetitive so the proportion of ambiguous alignments is much lower (Supplementary Table1 and Extended Data 2d). Furthermore, these positions were filtered on the basis of heterozygosity across samples to remove variant sites likely to be affected by read mis-alignment, e.g., between homeologs60.
We used the quality control filters described in28, which are designed to mitigate biases caused by the alignment of short ancient DNA fragments to a reference genome with a single allele. Briefly, all reads were realigned to a modified-reference genome, which had a randomly-chosen third nucleotide at each SNP site (neither the reference or non-reference SNP allele). In addition, all the reads aligned to SNP sites were modified such that they carried the other allele and then realigned. This step also required the removal of all alignments with gaps. We then discarded all alignments with a mapping quality score below 30. Reads were only retained for variant calling if they re-aligned to the same position after both modifications (modified reference genome and modified reads).
We called genotypes using GATK HaplotypeCaller in GENOTYPE_GIVEN_ALLELES and EMIT_ALL_SITES mode with --interval-padding 100, using only sequences of minimum length 35bp and maximum length 150bp (--min-read-length and --max-read-length). Calling a single random allele from the alignments at those 99k genotyped sites yielded the same proportion of non-reference alleles (21.94% using a random allele calling method and 21.90% using GATK).
S2 had higher levels of subgenome misalignment (Extended Data 2c), a lower percentage of endogenous alignments and was sequenced to lower depth. Therefore, genotypes called for S2 were only used for comparison with sample S1 and were not filtered further. We only used genotypes called from S1 for our main analysis and only included SNP sites with a coverage depth of at least two aligned sequences and a maximum of 35, filtered using bcftools61 (v1.9). After these quality filters, we called 99,078 SNP genotypes.
Outgroup Construction
To construct an outgroup genotype at the SNP sites of interest, we downloaded short read sequences for T. urartu (SRR4010671 and SRR4010672, representing the emmer A subgenome outgroup) and A. speltoides (SAMEA2342530, representing the emmer B subgenome outgroup) from the European Nucleotide Archive. We aligned 257M 2x250bp reads (T. urartu) and 1.1B 2x100bp reads (A. speltoides) to the emmer reference13 using bwa mem56. SNP genotypes were called as above. VCFtools62 (v0.1.15) was used to discard any SNP sites not on the A subgenome for T. urartu or not on the B subgenome for A. speltoides. The A subgenome calls from T. urartu and B subgenome calls from A. speltoides were then combined and SNP sites were discarded if they were covered by less than five or more than 130 reads. After filtering, we obtained an outgroup genotype at 932,461 SNP sites.
Transition / Transversion ratio
In order to determine whether there was still an excess of C > T and G > A substitutions caused by postmortem damage deaminations, we compared the Transition / Transversion (Ti/Tv) ratio between the ancient and modern samples. We oriented the SNP genotypes against the outgroup genotype, excluding calls that were heterozygous or missing from the outgroup. The Ti/Tv ratio from the ancient sample (2.14) is the same as the average Ti / Tv of modern samples (2.07 – 2.20, mean 2.15, sd 0.030, Supplementary Table 5). The proportion of C > T and G > A substitutions in the ancient sample is 0.391, which also falls within the range observed in modern samples (0.374 – 0.395, mean 0.386, sd 0.0039), Supplementary Table 5.
Genome-wide population structure
Modern accessions were assigned to subgroups using the information from the phylogeny in13. We re-assigned two accessions (PI487264, from Syria, and Mt. Gerizim, from central Israel) from the Northern Levant to the Southern Levant subgroup. The re-assigned Mt. Gerizim accession is found within the range of the other Southern Levant subgroup accessions. Nevertheless, there is one Northern Levant subgroup accession that remains within the range of the Southern Levant accessions (PI428129, from central Lebanon), Figure 2a. Our re-assignment makes the Northern Levant clade monophyletic both in the original phylogeny13 and in our phylogeny. Based on their locations of origin, we related these genetically-defined subgroups to subspecies groups defined by N. Vavilov from phenotypic/geographic information: abyssinicum Vav. (Indian Ocean), dicoccum (Mediterranean), and asiaticum Vav., within which there are convarieties serbicum (A. Schulz) Flaksb. (Eastern Europe) and transcaucasicum Flaksb. (Caucasus)26,63.
We performed a Principal Components Analysis (PCA) using the 99,078 UC10164 SNP sites. VCFtools and PLINK64 (v1.90b6.3) were used to prepare calls for import into R65 (v3.5.1). Any calls that were missing in the modern accessions were replaced with the median call among modern accessions. We performed PCA using just the modern accessions using the R prcomp() function. The genotype of UC10164 was then projected onto these PCs using the R predict() function. We repeated this procedure excluding modern wild accessions.
We further assessed population structure using ADMIXTURE v1.3.034. Because the ADMIXTURE model does not explicitly consider linkage disequilibrium, we first thinned the genotype calls34. We used the --indep-pairwise 200 10 0.9 option in PLINK, which considers sliding windows of 200 SNPs, in steps of 10 SNPs, and removes SNPs that have an R2 value of more than 0.9 with any other SNP in the window, which left 60,478 SNPs. We ran ADMIXTURE 50 times for K parameters varying from 2 to 7 and chose the run with the highest maximum likelihood. The cross-validation procedure implemented in ADMIXTURE (--cv) suggested that K=5 had the lowest cross-validation error (CV error values: 0.706, 0.671, 0.666, 0.665, 0.672, 0.676).
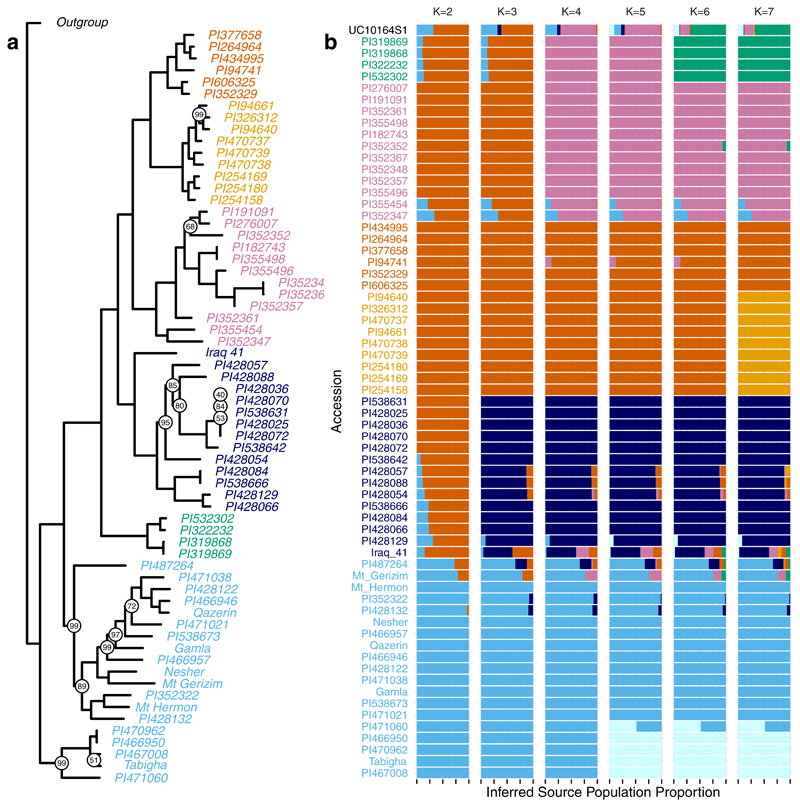
We used the SNPhylo pipeline66 (version 20140701) to construct phylogenetic trees, first removing SNPs at which the minimum depth of coverage for any of the modern emmer accessions was less than two, leaving 41,425 SNPs. Next, we removed SNPs with a Minor Allele Frequency (MAF) less than 10% or with more than 10% missing data, which left 13,105 SNPs. Finally, SNPs were pruned for Linkage Disequilibrium (LD) using a threshold of 0.1, leaving 5,431 SNPs. We then produced a maximum likelihood phylogenetic tree and performed a bootstrap analysis with 1000 bootstraps. To confirm that the overall structure of the resulting phylogenetic tree was not biased by the inclusion of U10164 and by restriction to the subset of SNPs that were called in U10164, we excluded UC10164 and repeated this analysis using the full set of SNP sites. We used the same filtering criteria as above, leaving 252,436 SNPs after filtering for coverage, 72,348 SNPs after filtering on MAF and missingness, and 10,237 SNPs after pruning for LD. We replicated most nodes in Figure 3a, see Extended Data 3a. Notably, nodes that define the relationship between subgroups all replicated. Thus, this SNP-based method does not support a monophyletic clade of domesticated emmer wheats, as presented in13. However, in the phylogeny in13, the node supporting the clade of domesticated emmer wheats has low bootstrap support (51) such that replication may not be expected.
We calculated D statistics using AdmixTools37 (v5.1). Genotypes were converted to EIGENSTRAT format using the convertf function and then the qpDstat function was used to calculate the D statistics displayed in Figure 3. Standard errors were calculated using a block jackknife with a specified block size varied from 100kb to 5mb. The resulting standard errors are shown in Supplementary Table 3.
Haplotype structure
We calculated the fraction of similar haplotypes between each pair of samples at sites called in UC10164. We excluded sites at which the focal sample was heterozygous or missing and then analysed all possible overlapping 50-SNP windows moved in intervals of one SNP. We used a 95% threshold to classify haplotypes as ‘similar’ and confirmed this was representative threshold by repeating this analysis for thresholds of 90% to 99%, over which results were broadly the same. For example, among domesticated accessions, UC10164 has either the highest or second highest fraction of unique haplotypes across this range of thresholds, Figure 2c.
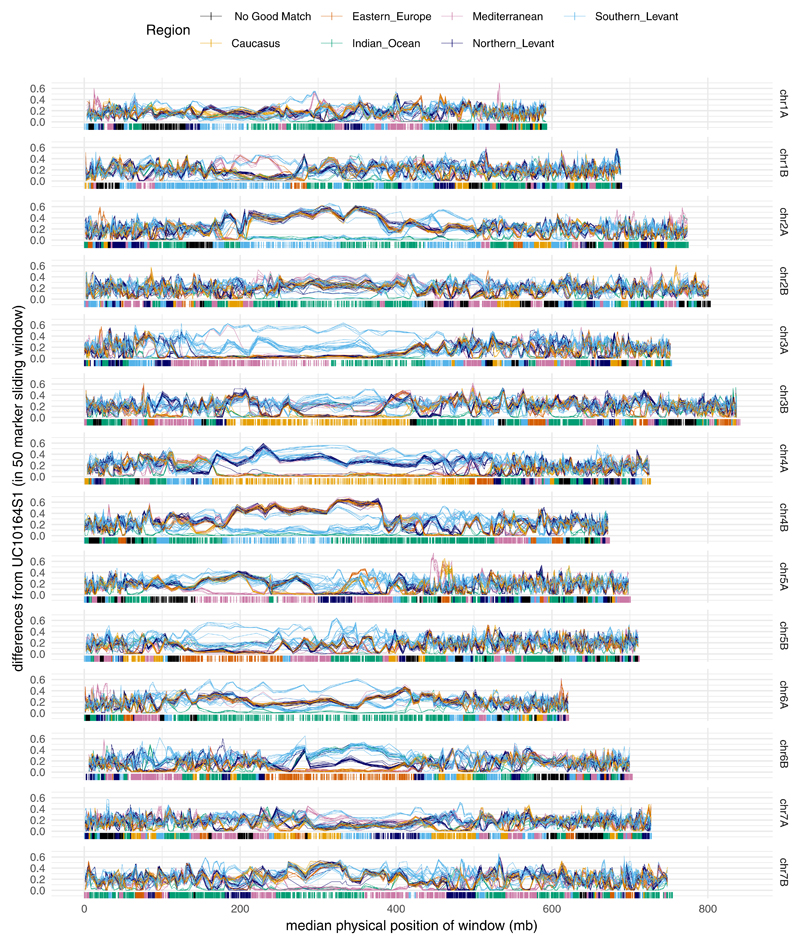
We also examined haplotype sharing by defining haplotype mosaics in UC10164. We excluded the 440 SNP sites at which UC10164 was heterozygous. We then used sliding windows of 50 SNPs (moved by steps of 25 SNPs) and plotted the fraction of calls that differ between the ancient Egyptian accession and each modern emmer wheat accession (Extended Data 5). We then estimated the genomic mosaic carried by UC10164 in terms of the modern genomes using a dynamic programming algorithm. Our algorithm calculates a mosaic of genotypes from modern accessions that minimizes the number of differences from the genotype of UC10164. This estimated mosaic is thus similar to the Viterbi path in a hidden Markov model. To prevent inferring excessive mosaic breakpoints due to sequencing errors, the algorithm incorporates a transition penalty for changing haplotype (equivalent to 2.5 SNP differences in the analysis shown). Furthermore, in some regions, UC10164 might carry a haplotype absent from any modern emmer wheat accession. Therefore, we introduced a dummy accession that differs from the ancient accession by a fixed threshold amount (7.5% in the analysis shown) at every site. That is, where UC10164 is inferred to carry this dummy haplotype, its average dissimilarity to any modern accession in the dataset exceeds this threshold across the region.
Known Domestication Loci
We examined two QTLs that were associated with shattering on chromosomes 3A and 3B13. By comparing the emmer reference with a durum wheat sequence, mutations in TtBtr1-A and TtBtr1-B that appear to cause loss of function were identified by 13. Specifically, the domesticated allele of TtBtr1-A has a 2bp deletion and the domesticated ‘Svevo’ allele of TtBtr1-B has a 4kb insertion. In order to have a full non-shattering phenotype both mutations need to be present as homozygotes. Insertions and deletions are difficult to detect using alignments of short reads obtained from ancient samples. Nevertheless, we examined the haplotype of UC10164 using the called SNPs in the region of these mutations, Figure 4.
We also examined a QTL associated with grain size and seed dormancy in which the causal gene is unknown20. In this case, flanking sequence for the markers either side of the QTL peak were obtained from cerealsDB (www.cerealsdb.uk.net/cerealgenomics/CerealsDB). We aligned these flanking sequences to the emmer reference using BLASTN67 (version 2.6.0). As putative physical map positions for the variation detected in the mapping population, we considered hits to chromosome 4B only. Marker IWB72369 had three significant hits on chromosome 4B and is therefore ambiguously localised. We excluded the blast hit for IWB72369 that was outside the chromosome 4B blast hit for the next marker in the genetic map, IWB43529. This left two possible locations for IWB72369: the resulting physical map positions and plausible range for the QTL peak are plotted in Figure 4b.
Selective Sweeps
Within these QTL, there are regions where all domesticated accessions share a haplotype, indicative of a selective sweep. We defined selective sweep regions using 1Mb sliding windows, within which we required each domesticated accession to carry the ‘domesticated allele’ (major allele among modern domesticated accessions) at 95% of SNPs. For each QTL, we then chose the longest continuous region with high haplotype similarity. Within these loci, the fraction of ‘non-domesticated’ genotype calls carried by modern domesticated accessions was 0.14%-1.18% (mean 0.5%, sd 0.28%). The ancient sample carries the ‘non-domesticated’ allele at 1/99 SNPs called within these loci.
We estimated selection coefficients s from the size of selective sweep regions as which is a function of the recombination rate (c) and the distance between a selected site sites and hitchhiking neutral sites (d)40,68. Because neutral sites will hitchhike on either side of the selected locus, we used half of the length of the region that shows high similarity among all domesticated accessions to estimate d. We used a range of plausible recombination rate parameters (cM/Mb) taken from in13, which we converted to recombination rates using Haldane’s map function69. We then calculated the “effective recombination rate” (c*) by adjusting a range of plausible selfing rates (η) by using equation 9.44 in40, which was used to estimate s.
Concordance between Accessions
UC10164 tends to have elevated concordance with modern domesticated accessions (versus modern wild accessions) within regions identified as putative ‘outliers’ in tests of selection13, Figure 4a. As a test statistic, we used the average difference in concordance with UC10164 between domesticated and wild emmer wheats. To assess significance, we used randomization procedure that retained the position of the outlier windows relative to one another. We ‘circularized’ the genome and then performed 1,000 permutations of the positions of the outlier windows by random rotation70. In all three types of outliers, the true average difference was the most extreme of 1000 replicates). Thus, within loci putatively associated with selection under domestication, UC10164 is significantly enriched for the alleles that are present in modern domesticated accessions.
Extended Data
Extended Data Fig. 1. Map showing archaeobotanical observations of emmer wheat from 9000 – 1000 BCE in Northeast Africa and South West Asia.
Map showing archaeobotanical observations of emmer wheat from 9000 – 1000 BCE in Northeast Africa and South West Asia. The collection location for the sequenced accession (UC10164) is labelled.
Extended Data Fig. 2. Summary of sequencing data from UC10164 samples S1 and S2.
Summary of sequencing data from UC10164 samples S1 and S2. Panel A shows the C to T and G to A misincorporations of alignments against the emmer wheat reference genome as output by MapDamage. Both samples show a small excess of these misincorporations in the 2bp at each fragment end, as expected for partially UDG treated aDNA libraries. Panel B shows the distribution of fragment sizes after the overlapping paired-end reads were collapsed and adapter sequence was removed using AdapterRemoval. Panel C shows coverage and subgenome representation for different minimum mapping quality scores after these fragments were aligned to the hexaploid bread wheat reference genome. Panel D shows the coverage obtained from alignment to the emmer wheat reference genome, split by minimum mapping quality filters. The exonic SNP sites (at which genotypes are called) have a much lower percentage of ambiguous alignments with low mapping quality scores.
Extended Data Fig. 3. (a) phylogeny of modern emmer wheat accessions and (b) source population proportions inferred by the ADMIXTURE model for various number of source populations (K parameter).
(a) phylogeny of modern emmer wheat accessions and (b) Source population proportions inferred by the ADMIXTURE model for various number of source populations (K parameter). The maximum likelihood phylogeny in (a) was constructed from the full set of SNPs called among modern accessions, excluding UC10164. Bootstrap support for each node is shown where it is less than 100 (based on 1000 bootstraps). In (b), the majority of the ancestry proportion inferred for the ancient Egyptian accession (UC10164) across K values is from the same population that predominates among the “Indian Ocean” subgroup (green accession names). Furthermore, the ancient Egyptian accession has a relatively high proportion of ancestry inferred to come from population groups that are common among modern wild Southern Levant emmer wheats (light blue accession names).
Extended Data Fig. 4. Heatmap of the genotypic similarity between each pair of accessions across 86,594 SNP sites that were called in the ancient Egyptian accession (UC10164).
Heatmap of the genotypic similarity between each pair of accessions across 86,594 SNP sites that were called in the ancient Egyptian accession (UC10164). Below the diagonal, we plot similarity using identity by state. Above the diagonal, we plot haplotypic similarity, which is defined as the fraction of sliding windows of 50 SNP sites that are more than 95% concordant.
Extended Data Fig. 5. Differences between each modern accession and the ancient Egyptian accession (UC10164) across the genome.
Differences between each modern accession and the ancient Egyptian accession (UC10164) across the genome. The fraction of genotypic differences from UC10164 is calculated within sliding windows of 50 SNPs (moved in intervals of 25 SNPs). Each modern accession is plotted as a line and coloured according to its subgroup membership. Below zero we plot the ancestry mosaic inferred for each SNP site called in UC10164. The dissimilarity within sliding windows is plotted against the median physical map position of the SNPs in the sliding window. Each chromosome has a large region around the centromere that has low exonic SNP density and low recombination rate, resulting in long haplotypes.
Supplementary Material
Acknowledgements
We thank Y. Diekmann, D. O’Rourke and A. Garnett for helpful discussions. M.F.S. and R.M. are supported by RCUK BBSRC grant BB/M011585/1. R.M. is also supported by RCUK BBSRC grant BB/P024726/1; L.R.B. by the Spanish Ministry of Economy and Competitiveness Severo Ochoa Programme for Centres of Excellence in R&D 2016-2019 (SEV-2015-0533) and CERCA Programme, Generalitat de Catalunya; M.G.T. and S.B. by a Wellcome Trust Senior Research Fellowship, grant 100719/Z/12/Z. D.Q.F. and C.S. are supported by the ERC ComPag project, grant number 323842. V.E.M. and S.B. is are partially supported by the RCUK NERC grant NE/P012574/1.UCL computing infrastructure was support by BBSRC grant BB/R01356X/1.
Footnotes
Data Availability
Sequence data are deposited in the ENA with study accession number PRJEB31103. The genotype calls are also provided as the source data for Fig. 2. The database of archaeobotanical observations is provided as the source data for Extended Data Fig. 1. Source data are available for Figs. 2–4 and Extended Data Figs. 1–5.
Author Contributions
L.R.B., M.F.S., R.M., D.Q.F., C.S., A.S., and M.G.T. designed and coordinated the study. M.F.S. designed and performed data analysis. L.R.B., S.B., V.E.M. performed experiments. C.S. obtained image data. M.F.S. and R.M. co-ordinated sequencing. D.Q.F. co-ordinated carbon dating. M.G.T. supervised access to the ancient DNA laboratory. D.Q.F., A.S., C.S. collated archaeobotanical data. M.F.S., R.M. wrote the manuscript. All authors have edited and approved the manuscript.
Competing Interests Statement
The authors declare no competing interests.
References
- 1.Arranz-Otaegui A, Colledge S, Zapata L, Teira-Mayolini LC, Ibáñez JJ. Regional diversity on the timing for the initial appearance of cereal cultivation and domestication in southwest Asia. Proc Natl Acad Sci. 2016;113:14001–14006. doi: 10.1073/pnas.1612797113. [DOI] [PMC free article] [PubMed] [Google Scholar]
- 2.Fuller DQ, Willcox G, Allaby RG. Early agricultural pathways: Moving outside the ‘core area’ hypothesis in Southwest Asia. J Exp Bot. 2012;63:617–633. doi: 10.1093/jxb/err307. [DOI] [PubMed] [Google Scholar]
- 3.Fuller DQ, Lucas L. Encyclopedia of Global Archaeology. 2014. Wheats: origins and development; pp. 7812–7817. [Google Scholar]
- 4.McClatchie M, et al. Neolithic farming in north-western Europe: Archaeobotanical evidence from Ireland. J Archaeol Sci. 2014;51:206–215. [Google Scholar]
- 5.Mascher M, et al. Genomic analysis of 6,000-year-old cultivated grain illuminates the domestication history of barley. Nat Genet. 2016;48:1089–1093. doi: 10.1038/ng.3611. [DOI] [PubMed] [Google Scholar]
- 6.Ramos-Madrigal J, et al. Genome Sequence of a 5,310-Year-Old Maize Cob Provides Insights into the Early Stages of Maize Domestication. Curr Biol. 2016;26:3195–3201. doi: 10.1016/j.cub.2016.09.036. [DOI] [PubMed] [Google Scholar]
- 7.Vallebueno-Estrada M, et al. The earliest maize from San Marcos Tehuacán is a partial domesticate with genomic evidence of inbreeding. Proc Natl Acad Sci. 2016;113:14151–14156. doi: 10.1073/pnas.1609701113. [DOI] [PMC free article] [PubMed] [Google Scholar]
- 8.Kistler L, et al. Multiproxy evidence highlights a complex evolutionary legacy of maize in South America. Science. 2018;1313:1309–1313. doi: 10.1126/science.aav0207. [DOI] [PubMed] [Google Scholar]
- 9.Smith O, et al. A domestication history of dynamic adaptation and genomic deterioration in sorghum. Nat Plants. 2018;5:369–379. doi: 10.1038/s41477-019-0397-9. [DOI] [PubMed] [Google Scholar]
- 10.Palmer SA, Smith O, Allaby RG. The blossoming of plant archaeogenetics. Ann Anat. 2012;194:146–156. doi: 10.1016/j.aanat.2011.03.012. [DOI] [PubMed] [Google Scholar]
- 11.Bilgic H, Hakki EE, Pandey A, Khan MK, Akkaya MS. Ancient DNA from 8400 Year-Old Çatalhöyük Wheat: Implications for the origin of neolithic agriculture. PLoS One. 2016;11:1–18. doi: 10.1371/journal.pone.0151974. [DOI] [PMC free article] [PubMed] [Google Scholar]
- 12.Purugganan MD, Fuller DQ. The nature of selection during plant domestication. Nature. 2009;457:843–848. doi: 10.1038/nature07895. [DOI] [PubMed] [Google Scholar]
- 13.Avni R, et al. Wild emmer genome architecture and diversity elucidate wheat evolution and domestication. Science. 2017;357:93–97. doi: 10.1126/science.aan0032. [DOI] [PubMed] [Google Scholar]
- 14.Nalam VJ, Vales MI, Watson CJW, Kianian SF, Riera-Lizarazu O. Map-based analysis of genes affecting the brittle rachis character in tetraploid wheat (Triticum turgidum L.) Theor Appl Genet. 2006;112:373–381. doi: 10.1007/s00122-005-0140-y. [DOI] [PubMed] [Google Scholar]
- 15.Pourkheirandish M, et al. Evolution of the Grain Dispersal System in Barley. Cell. 2015;162:527–39. doi: 10.1016/j.cell.2015.07.002. [DOI] [PubMed] [Google Scholar]
- 16.Fuller DQ. Contrasting patterns in crop domestication and domestication rates: Recent archaeobotanical insights from the old world. Ann Bot. 2007;100:903–924. doi: 10.1093/aob/mcm048. [DOI] [PMC free article] [PubMed] [Google Scholar]
- 17.Harlan JR, de Wet JMJ, Price EG. Comparative Evolution of Cereals. Evolution (N. Y) 1973;27:311–325. doi: 10.1111/j.1558-5646.1973.tb00676.x. [DOI] [PubMed] [Google Scholar]
- 18.Salamini F, Özkan H, Brandolini A, Schäfer-Pregl R, Martin W. Genetics and geography of wild cereal domestication in the near east. Nat Rev Genet. 2002;3:429–441. doi: 10.1038/nrg817. [DOI] [PubMed] [Google Scholar]
- 19.Horovitz A. The soil seed bank of wild emmer. In: Zencirci N, Kaya Z, Anikster Y, Adams WT, editors. The Proceedings of International Symposium on In situ Conservation of Plant Genetic Diversity; Central Research Institute for Field Crops; 1998. pp. 185–188. [Google Scholar]
- 20.Nave M, Avni R, Ben-Zvi B, Hale I, Distelfeld A. QTLs for uniform grain dimensions and germination selected during wheat domestication are co-located on chromosome 4B. Theor Appl Genet. 2016;129:1303–1315. doi: 10.1007/s00122-016-2704-4. [DOI] [PubMed] [Google Scholar]
- 21.Allaby RG, Stevens C, Lucas L, Maeda O, Fuller DQ. Geographic mosaics and changing rates of cereal domestication. Philos Trans R Soc B Biol Sci. 2017:372. doi: 10.1098/rstb.2016.0429. [DOI] [PMC free article] [PubMed] [Google Scholar]
- 22.Crawford DJ. Food: Tradition and change in hellenistic Egypt. World Archaeol. 1979;11:136–146. doi: 10.1080/00438243.1979.9979757. [DOI] [PubMed] [Google Scholar]
- 23.Caton-Thompson G, Gardner EW. The desert Fayum. Royal Anthropological Institute of Great Britain and Ireland; 1934. [Google Scholar]
- 24.Nesbitt M, Samuel D. From stable crop to extinction? The archaeology and history of the hulled wheats. In: Padulosi S, Hammer K, Heller J, editors. Hulled Wheats. Promoting the Conservation and Use of Underutilized and Neglected Crops. 1996. [Google Scholar]
- 25.Wetterstrom W. Foraging and farming in Egypt: The transition from hunting and gathering to horticulture in the Nile valley. Archaeol Africa Food Met towns. 1993:165–226. [Google Scholar]
- 26.Zaharieva M, Ayana NG, Hakimi AAl, Misra SC, Monneveux P. Cultivated emmer wheat (Triticum dicoccon Schrank), an old crop with promising future: A review. Genet Resour Crop Evol. 2010;57:937–962. [Google Scholar]
- 27.Brunton G, Caton-Thompson G. The Badarian civilization and predynastic remains near Badari. British School of Archaeology in Egypt; London: 1928. [Google Scholar]
- 28.Günther T, Nettelblad C. The presence and impact of reference bias on population genomic studies of prehistoric human populations. PLoS Genet. 2019;15 doi: 10.1371/journal.pgen.1008302. 1008302. [DOI] [PMC free article] [PubMed] [Google Scholar]
- 29.Jónsson H, Ginolhac A, Schubert M, Johnson PLF, Orlando L. MapDamage2.0: Fast approximate Bayesian estimates of ancient DNA damage parameters. Bioinformatics. 2013;29:1682–1684. doi: 10.1093/bioinformatics/btt193. [DOI] [PMC free article] [PubMed] [Google Scholar]
- 30.IWGSC. Shifting the limits in wheat research and breeding using a fully annotated reference genome. Science. 2018;361:eaar7191. doi: 10.1126/science.aar7191. [DOI] [PubMed] [Google Scholar]
- 31.Golenberg EM. Outcrossing rates and their relationship to phenology in Triticum dicoccoides. Theor Appl Genet. 1988;75:937–944. [Google Scholar]
- 32.Fuller DQ. Agricultural origins and frontiers in South Asia: A working synthesis. J World Prehistory. 2006;20:1–86. [Google Scholar]
- 33.Stevens CJ, et al. Between China and South Asia: A Middle Asian corridor of crop dispersal and agricultural innovation in the Bronze Age. Holocene. 2016;26:1541–1555. doi: 10.1177/0959683616650268. [DOI] [PMC free article] [PubMed] [Google Scholar]
- 34.Alexander DH, Novembre J, Lange K. Fast model-based estimation of ancestry in unrelated individuals. Genome Res. 2009;19:1655–1664. doi: 10.1101/gr.094052.109. [DOI] [PMC free article] [PubMed] [Google Scholar]
- 35.van der Veen M. Consumption, Trade and Innovation: Exploring the Botanical Remains from the Roman and Islamic Ports at Quseir al-Qadim, Egypt. Journal of African Archaeology Monograph Series. 2012;6 [Google Scholar]
- 36.Murray MA. Cereal production and processing. In: Nicholson PT, Shaw I, editors. Ancient Egyptian Materials and Technology. Cambridge University Press; 2000. pp. 505–536. [Google Scholar]
- 37.Patterson N, et al. Ancient admixture in human history. Genetics. 2012;192:1065–93. doi: 10.1534/genetics.112.145037. [DOI] [PMC free article] [PubMed] [Google Scholar]
- 38.Marcussen T, et al. Ancient hybridizations among the ancestral genomes of bread wheat. Science. 2014;345 doi: 10.1126/science.1250092. 1250092. [DOI] [PubMed] [Google Scholar]
- 39.Olsen KM, et al. Selection under domestication: Evidence for a sweep in the rice waxy genomic region. Genetics. 2006;173:975–83. doi: 10.1534/genetics.106.056473. [DOI] [PMC free article] [PubMed] [Google Scholar]
- 40.Walsh B, Lynch M. Evolution and Selection of Quantitative Traits. Oxford University Press; 2018. [Google Scholar]
- 41.Fuller DQ, Lucas L, Gonzalez Carretero L, Stevens C. From intermediate economies to agriculture: trends in wild food use, domestication and cultivation among early villages in southwest Asia. Paleorient. 2018;44:59–74. [Google Scholar]
- 42.Badaeva ED, et al. Chromosomal passports provide new insights into diffusion of emmer wheat. PLoS One. 2015;10:1–25. doi: 10.1371/journal.pone.0128556. [DOI] [PMC free article] [PubMed] [Google Scholar]
- 43.Luo MC, et al. The structure of wild and domesticated emmer wheat populations, gene flow between them, and the site of emmer domestication. Theor Appl Genet. 2007;114:947–959. doi: 10.1007/s00122-006-0474-0. [DOI] [PubMed] [Google Scholar]
- 44.Wengro D, Dee M, Foster S, Stevenson A, Ramsey CB. Cultural convergence in the Neolithic of the Nile Valley: A prehistoric perspective on Egypt’s place in Africa. Antiquity. 2014;88:95–111. [Google Scholar]
- 45.Fuller D, Hildebrand E. Domesticating Plants in Africa. In: Mitchell P, Lane P, editors. The Oxford Handbook of African Archaeology. Oxford University Press; 2013. pp. 507–525. [Google Scholar]
- 46.Hasel MG. Domination and resistance : Egyptian military activity in the southern Levant, ca. 1300-1185 B.C. Brill; 1998. [Google Scholar]
- 47.Civáň P, Ivaničová Z, Brown TA. Reticulated origin of domesticated emmer wheat supports a dynamic model for the emergence of agriculture in the fertile crescent. PLoS One. 2013;8:e81955. doi: 10.1371/journal.pone.0081955. [DOI] [PMC free article] [PubMed] [Google Scholar]
- 48.He F, et al. Exome sequencing highlights the role of wild-relative introgression in shaping the adaptive landscape of the wheat genome. Nat Genet. 2019;51:896–904. doi: 10.1038/s41588-019-0382-2. [DOI] [PubMed] [Google Scholar]
- 49.Di Donato A, Filippone E, Ercolano MR, Frusciante L. Genome Sequencing of Ancient Plant Remains: Findings, Uses and Potential Applications for the Study and Improvement of Modern Crops. Front Plant Sci. 2018;9:441. doi: 10.3389/fpls.2018.00441. [DOI] [PMC free article] [PubMed] [Google Scholar]
- 50.Zohary D, Hopf M, Weiss E. Domestication of Plants in the Old World. Oxford University Press; 2012. [Google Scholar]
- 51.Bronk Ramsey C. Bayesian analysis of radiocarbon dates. 2009;51:337–360. [Google Scholar]
- 52.Reimer PJ, et al. Intcal13 and marine13 radiocarbon age calibration curves 0-50,000 years cal bp. Radiocarbon. 2013;55:1869–1887. [Google Scholar]
- 53.Meyer M, Kircher M. Illumina sequencing library preparation for highly multiplexed target capture and sequencing. Cold Spring Harb Protoc. 2010;6 doi: 10.1101/pdb.prot5448. [DOI] [PubMed] [Google Scholar]
- 54.Rohland N, Harney E, Mallick S, Nordenfelt S, Reich D. Partial uracil – DNA – glycosylase treatment for screening of ancient DNA. Philos Trans R Soc B Biol Sci. 2015;370 doi: 10.1098/rstb.2013.0624. 20130624. [DOI] [PMC free article] [PubMed] [Google Scholar]
- 55.Schubert M, Lindgreen S, Orlando L. AdapterRemoval v2: Rapid adapter trimming, identification, and read merging. BMC Res Notes. 2016;9:1–7. doi: 10.1186/s13104-016-1900-2. [DOI] [PMC free article] [PubMed] [Google Scholar]
- 56.Li H, Durbin R. Fast and accurate short read alignment with Burrows-Wheeler transform. Bioinformatics. 2009;25:1754–1760. doi: 10.1093/bioinformatics/btp324. [DOI] [PMC free article] [PubMed] [Google Scholar]
- 57.Meyer M, et al. A high coverage genome sequence from an archaic denisovan individual. Science. 2013;338:222–226. doi: 10.1126/science.1224344. [DOI] [PMC free article] [PubMed] [Google Scholar]
- 58.Briggs AW, et al. Patterns of damage in genomic DNA sequences from a Neandertal. Proc Natl Acad Sci. 2007;104:14616–14621. doi: 10.1073/pnas.0704665104. [DOI] [PMC free article] [PubMed] [Google Scholar]
- 59.McKenna A, et al. The Genome Analysis Toolkit: a MapReduce framework for analyzing next-generation DNA sequencing data. Genome Res. 2010;20:1297–1303. doi: 10.1101/gr.107524.110. [DOI] [PMC free article] [PubMed] [Google Scholar]
- 60.Jordan KW, et al. A haplotype map of allohexaploid wheat reveals distinct patterns of selection on homoeologous genomes. Genome Biol. 2015;16:1–18. doi: 10.1186/s13059-015-0606-4. [DOI] [PMC free article] [PubMed] [Google Scholar]
- 61.Li H. A statistical framework for SNP calling, mutation discovery, association mapping and population genetical parameter estimation from sequencing data. Bioinformatics. 2011;27:2987–2993. doi: 10.1093/bioinformatics/btr509. [DOI] [PMC free article] [PubMed] [Google Scholar]
- 62.Danecek P, et al. The variant call format and VCFtools. Bioinformatics. 2011;27:2156–2158. doi: 10.1093/bioinformatics/btr330. [DOI] [PMC free article] [PubMed] [Google Scholar]
- 63.Vavilov NI. Origin and geography of cultivated plants. Cambridge University Press; 1989. [Google Scholar]
- 64.Purcell S, et al. PLINK: A Tool Set for Whole-Genome Association and Population-Based Linkage Analyses. Am J Hum Genet. 2007;81:559–575. doi: 10.1086/519795. [DOI] [PMC free article] [PubMed] [Google Scholar]
- 65.R Core Team. R: A Language and Environment for Statistical Computing. 2016 [Google Scholar]
- 66.Lee TH, Guo H, Wang X, Kim C, Paterson AH. SNPhylo: A pipeline to construct a phylogenetic tree from huge SNP data. BMC Genomics. 2014;15:1–6. doi: 10.1186/1471-2164-15-162. [DOI] [PMC free article] [PubMed] [Google Scholar]
- 67.Camacho C, et al. BLAST+: Architecture and applications. BMC Bioinformatics. 2009;10:1–9. doi: 10.1186/1471-2105-10-421. [DOI] [PMC free article] [PubMed] [Google Scholar]
- 68.Kaplan NL, Hudson RR, Langley CH. The Hitchhiking Effect Revisited. Genetics. 1989;123:887–899. doi: 10.1093/genetics/123.4.887. [DOI] [PMC free article] [PubMed] [Google Scholar]
- 69.Haldane JBS. The combination of linkage values and the calculation of distances between the loci of linked factors. J Genet. 1919;8:299–309. [Google Scholar]
- 70.Cabrera CP, et al. Uncovering networks from genome-wide association studies via circular genomic permutation. G3. 2012;2:1067–75. doi: 10.1534/g3.112.002618. [DOI] [PMC free article] [PubMed] [Google Scholar]
Associated Data
This section collects any data citations, data availability statements, or supplementary materials included in this article.


