

Abstract
In this study we propose a novel method for identifying the locations of earliest activation in the human left ventricle from activation maps measured at the epicardial surface. Electrical activation is modeled based on the viscous Eikonal equation. The sites of earliest activation are identified by solving a minimization problem. Arbitrary initial locations are assumed, which are then modified based on a shape derivative based perturbation field until a minimal mismatch between the computed and the given activation maps on the epicardial surface is achieved. The proposed method is tested in two numerical benchmarks, a generic 2D unit-square benchmark, and an anatomically accurate MRI-derived 3D human left ventricle benchmark to demonstrate potential utility in a clinical context. For unperturbed input data, our localization method is able to accurately reconstruct the earliest activation sites in both benchmarks with deviations of only a fraction of the used spatial discretization size. Further, with the quality of the input data reduced by spatial undersampling and addition of noise, we demonstrate that an accurate identification of the sites of earliest activation is still feasible.
Keywords: Shape optimization, Nonlinear elliptic PDEs, Inverse problems, Electro physiology
Introduction
Computational models of cardiac function are increasingly considered as a clinical research tool with the perspective of being used, ultimately, as a diagnostic modality. Independently of which functional aspects are being considered, a key driving mechanism of cardiac electro–mechano–fluidic function is the sequence of electrical activation. Owing to its pivotal role, computer models intended for clinical applications must be parameterized in a patient-specific manner to approximate the electrical activation sequence in a given patient’s heart. Anatomical (Demoulin and Kulbertus 1972; Ono et al. 2009) as well as early experimental mapping studies (Durrer et al. 1970), using ex vivo human hearts provided evidence that electrical activation in the left ventricle (LV), i.e. the main pumping chamber that drives blood into the circulatory system, is initiated by the His–Purkinje system (Haissaguerre et al. 2016) at several specific sites of earliest activation (root points) which are located at the endocardial (inner) surface of the LV. In a first approximation it can be assumed that the healthy human LV is activated at these root points by a tri-fascicular conduction system (Rosenbaum et al. 1969) consisting of three major fascicles referred to as anterior, septal and posterior fascicle. Owing to the fast conduction properties of the Purkinje network tissue patches surrounding root points are activated fast enough so that their activation can be considered instantaneous. Size and location of these patches as well as the corresponding instants of their activation are key determinants shaping the activation sequence of the LV. Since the His–Purkinje system is highly variable in humans, there is significant interest in inverse methods for identifying these sites, ideally non-invasively.
In general, non-invasive electrocardiographic imaging attempts to reconstruct the spatio-temporal behavior of the electrical sources of the heart from electrocardiograms recorded from the body surface by solving the inverse problem of electrocardiography (Gulrajani et al. 1989). Solving this inverse problem is complicated by the non-uniqueness of the relation between myocardial sources and their signature outside the heart, recorded in the form of extracellular electrograms. The vast body of research found in the literature can be broadly categorized based on the regularization techniques used to rule out solutions that are unlikely on physiological grounds (Tikhonov and Arsenin 1977) and the model used for representing the cardiac sources, with the predominant source models being transmembrane voltage-based (He et al. 2003; Wang et al. 2010), extracellular-potential based (Rudy and Burnes 1999; Bear et al. 2018), and activation/recovery-based (van Dam et al. 2009; Erem et al. 2014; Han et al. 2015; Janssen et al. 2018). These models have their pros and cons in terms of verifiability with experimental data, the domains in which sources can be reconstructed—on epicardial and endocardial surfaces or transmurally throughout the myocardial wall—and their accuracy in pathological scenarios such as the presence of infarcts (Wang et al. 2013) or more complex non-physiological activation patterns such as arrhythmias (Rudy 2013). For a comprehensive overview of these aspects of ECG imaging we refer to the recent review of Cluitmans et al. (2018).
In this study we propose a novel method for identifying these sites of earliest activation from activation maps measured at the epicardial (outer) surface of the heart. Such maps can be obtained non-invasively from body surface potential maps within clinical routine using inverse mapping systems such as CardioInsight (Ramanathan et al. 2004). Epicardial activation maps depend not only on location and timing of initial activation sites, but also on the orthotropic conduction velocities within the LV wall. Therefore, in patient-specific applications, conduction velocity tensors have to be identified using fast forward computational models (Zettinig et al. 2014; Marchesseau et al. 2013a, b), or biophysically detailed models (Potse et al. 2014). The propagation of electrical wavefronts in the LV is modeled based on the viscous Eikonal equation which is able to represent activation sequences and takes into account the dependency of conduction velocity on wavefront curvature. Identification of sites of earliest activation is achieved by solving a minimization problem. Initially geometries are chosen which represent the activation sites. Then they are relocated based on a perturbation field until a minimal mismatch between the computed and the given activation maps at the epicardial surface is achieved. The perturbation field is designed to reduce the functional subject to minimization during the relocation process. The proposed method is tested in two numerical benchmarks, a generic 2D unit-square benchmark serving the sole purpose of theoretical analysis, and an anatomically accurate MRI-derived 3D human LV benchmark to demonstrate potential utility in a clinical context. For unperturbed input data, our localization method is able to accurately reconstruct earliest activation sites in both benchmarks with deviations of only a fraction of the used spatial discretization size. With the quality of the input data reduced by spatial undersampling and addition of noise, we demonstrate that an accurate identification is still feasible.
From a mathematical point of view the described problem can be interpreted as an inverse problem involving a non-linear elliptic PDE. On the activation sites , an electrical depolarization wave is initiated which travels through the heart . This is modelled by a nonlinear elliptic PDE, given by a viscous Eikonal equation, see Colli Franzone et al. (1990). The solution of the viscous Eikonal equation quantifies the arrival times of wave fronts at points in the heart or on its surface . Since the wave is initiated on the arrival time is zero on and thus the viscous Eikonal equation has zero Dirichlet boundary conditions on and Neumann boundary conditions on the rest of the boundary of . Given measurements of the arrival times on the surface of the heart the positions of the activation sites are searched for. This inverse problem can be formulated as a shape optimization problem, see Delfour and Zolesio (2011) or Sokołowski and Zolésio (1992), in which the positions of is optimized such that the misfit between the measured data and the solution of the viscous Eikonal equation on is minimal. We assume that the shape and number of activation sites is known and stays constant during the optimization. Thus only the locations of the activation sites are changed during the optimization. For the derivation of the shape derivative of the shape functional we use a technique which does not require the shape differentiability of the geometry-to-state mapping, see Ito et al. (2008) and Laurain and Sturm (2016). In order to apply this technique we first prove the wellposedness of the state equation. It is a nonlinear elliptic PDE which can be transformed to a linear one using the Hopf–Cole transformation, see Capuzzo Dolcetta (2003). The proof of the continuous dependence of the state on the data requires non-standard techniques. Furthermore we prove the wellposedness of the linearized and adjoint state equation using the weak maximum principle. In order to compute the shape derivative the averaged adjoint technique from Laurain and Sturm (2016) is used. In this manner we arrive at domain-based representation of the shape derivative, in contrast to the more common boundary-based representation, see Sokołowski and Zolésio (1992). This simplifies the numerical implementation of the shape derivative in a finite element environment, since only domain integrals need to be calculated. For the calculation of the perturbation field which is the basis for changing the geometry of the activation sites in an iterative gradient based algorithm a linear elasticity problem is solved in which the shape derivative enters as righthand side. To give a brief account of the contents of the paper, in Sect. 2 after the statement of the model on which our approach is based, we give its mathematical analysis, involving primal, tangent, and adjoint equations, and the shape derivative. The use of this information for numerical realization is described in Sect. 3. Finally Sect. 4 contains the two benchmark examples alluded to above.
Theoretical analysis
Problem statement
Let , with or , be a bounded domain with boundary, representing the cardiac domain. Within U we introduce N subdomains with boundaries , which represent the volumes of the earliest activation sites, also denoted as activation sources. The union of is denoted by and its boundary by . As such, is the surface from which activation spreads into our computational cardiac domain . We have , and thus is a bounded domain with boundary. In particular it is connected, but due to the holes it is not simply connected. Furthermore is closed. We set , and further introduce the observatory boundary , which in our application is given by epicardium of the heart. We consider the following minimization problem:
| 1 |
subject to the viscous Eikonal equation in the form
| 2 |
for some non-negative function g, and with
The function T(x) represents the activation time, while the epicardial activation input data is denoted by z(x) which is assumed to be an element of . The matrix M(x) models the squared cardiac conduction velocity (see Sect. 3.5). It is assumed to be symmetric and uniformly elliptic, i.e. there exists a such that
For the rest of this work we use the notation . The vector denotes the outer unit normal vector on .
The use of Eikonal equations is well-established to approximate the excitation process in the myocardium. We refer, for instance, to Colli Franzone et al. (1990) where a careful singular perturbation technique analysis with respect to the thickness of the myocardial wall and the time taken by the excitation wave front to cross the heart wall is carried out on the basis of the bidomain equations to arrive at various forms of Eikonal equations (Colli Franzone et al. 1990, Section 5).
Problem (1) falls in the class of inverse shape problems. For the numerical solution of (1) we require the shape derivative of J with respect to in order to use it in a gradient decent method. As prerequisite we need to prove well-posedness of the state equation (2) which arises as PDE constraint in (1), and we analyze the tangent and adjoint equations.
Well-posedness of the viscous Eikonal equation
In this section, we discuss the well-posedness of the equation
| 3 |
for some functions f, g specified later. Using the transformation this problem can be transformed into
| 4 |
which is linear in the unknown w. Let us introduce the spaces
for which are equipped with the norm
Moreover we set . For let its conjugate exponent. We introduce the positive and negative part of f defined by and as well as the embedding constant of the embedding . Next we require the following assumptions on the regularity of the data:
-
(Ai)
with , and
-
(Aii)
with , and
-
(Aiii)
with and
Lemma 1
For every (M, f, g) satisfying (Ai), (Aii) and (Aiii), there exists a unique solution of (4). Moreover the solution satisfies with if , and with if , and
where depends continuously on , , , and .
Proof
Let denote the continuous trace operator onto . Using the embedding and (Aii), it is easy to see that the integral is well defined for every . Due to the mentioned properties of the trace operator and (Aiii) we can conclude that the boundary integral is well defined. Thus we can formulate the weak form of (4) as
| 5 |
for all . To argue existence of a solution of (5) we use the Lax–Milgram theorem. To prove the required coercivity in V we estimate for any using (Aii) and (Aiii)
Thus we obtain coercivity and the existence of a unique solution w to (5). Moreover there exists a constant depending on and such that
Next we argue additional regularity of w. For this purpose we consider the terms involving fw and gw as known inhomogeneities with . We show that the functionals and are elements of with for and for . First we consider . We recall the embedding with and . We prove that . Using Hölder’s inequality with resp. we obtain
and thus
Next we consider . We recall from Adams and Fournier (2003, Theorem 5.22) that is continuous from to with . Next we verify that with . We have
since . Here the restriction is necessary. Then assumption (Aiii) implies the assertion. Finally we get
Moreover and are functionals from . A functional F from can represented in the form
with and a vector field , see Adams and Fournier (2003, Theorem 3.8). Thus the results from Troianiello (1987, Theorem 3.16) imply that holds and the existence of a constant C depending on , and such that
These results are applicable since the Dirichlet part of is closed.
In order to proof even higher regularity of w we use the following assumptions:
-
(Bi)
with and
-
(Bii)
with and
-
(Biii)
with and
for some .
Lemma 2
Let Assumptions (Bi), (Bii) and (Biii) be satisfied. Then the solution of (4) satisfies with given according to the data. Moreover there exists a constant depending continuously on , , , and such that
and holds for all .
Proof
Theorem 3.28 (ii) and 3.29 (ii) from Troianiello (1987) can be applied, since (4) can be written as
with ( ith column of M) and since and is of class . This gives us the stated regularity and the corresponding a priori estimate. Next we define and . Since we can test (5) with and get
This implies in , since . Testing (5) with . We get
This implies in . Next we introduce the variable which satisfies the equation
If the solution were constant, it has to be equal to . However, in this case we have in , which is a contradiction. We define , see above. First we assume . Then Theorem 3.27 in Troianiello (1987) is applicable which states that such a maximum cannot be achieved on . This is a contradiction. Thus and . This implies the assertion.
For the rest of this work we fix a with , and . Let
be a reflexive Banach space which embeds compactly into for some , where the range of p is defined in Lemma 1. We define the set
| 6 |
for some . Note that for conditions (Bi), (Bii) are satisfied.
Proposition 1
There exists a constant such that
for all .
Proof
We shall employ a compactness argument. For this purpose we argue that is compact in . The compact embedding of Y into implies precompactness of . Moreover is closed in . Indeed, let be a convergent sequence in with the limit point (M, f). It is easy to see that holds. There exists a subsequence such that converges for almost every to f. Thus f satisfies . On another subsequence of this subsequence there holds in Y due to the reflexivity of Y. Since is convex and closed in Y, it is weakly closed in Y. Thus we have which implies the closedness of in . Finally this implies that is a compact subset of .
Next we define
where . We observe that there exists a such that for every the set
satisfies the inclusion . For the coordinate f this is a consequence of the estimates
and hence
We remark that Lemma 1 is applicable for and thus for elements of with . Next we choose an arbitrary and . Furthermore we introduce and . The solution w exists according to Lemma 1. The function satisfies the equation
| 7 |
for all . Next we prove that is an element of . Since and , there holds
Then similar arguments as in the proof of Lemma 1 yield a constant depending on , and such that
| 8 |
where p is specified in Lemma 1. The expressions involving w are estimated in terms of , , and K. Thus there holds
| 9 |
where is a continuous function with .
Now, let be an arbitrary element in . By Lemma 2 there exists a constant such that for all . Since for and due to (9) there exists a such that
for all . The family is an open covering in of the compact set . Hence there exists a finite subcover . Then we choose
to conclude the desired result.
With the help of Lemma 2 we are able to define and calculate
Thus there holds
Moreover we have on the boundary
We are now prepared to state the existence theorem for the state equation (3).
Theorem 1
Let where is defined in (6). Then Eq. (3) has a unique solution satisfying
| 10 |
where only depends on .
Proof
Since existence of T was argued above only the estimate has to be proven. We know , and
Thus there holds
and
where is the constant from Proposition 1 and only depends on . This implies (10).
Well-posedness of the tangent and adjoint equations
Let be the solution of the state equation for a and for . Associated to the linearization of (2) we define the bilinear form by
for any . Moreover we introduce the operators and defined by
for all .
Definition 1
For we call a solution of the linearized state equation if it solves the equation or equivalently
| 11 |
Lemma 3
The mapping from endowed with the topology of to is continuous.
Proof
Let T be the solution of the state equation for M and f and for and . Let w be the solution of (4) for M, f and for and . Due to Taylor expansion of 1 / x at the partial derivative of the difference satisfies the equation
where and lies between and . Due to Proposition 1 we have
Now estimate (9) for in the proof of Proposition 1 with and Lemma 2 imply the assertion.
Proposition 2
Let and . Then the linearized state equation has a unique solution and there exists a constant such that for all
Proof
First we observe the following estimate
Then we have
for some . Now for the choice the form B is coercive relative to . It can be easily checked that B is bounded. The bilinear form B is also defined on and there holds that for any . Then Troianiello (1987, Theorem 2.4) implies that satisfies the weak maximum principle. Thus the homogenous equation has the unique solution 0. Then Troianiello (1987, Theorem 2.2) yields the existence of a unique solution of for every which satisfied the inequality
Next we discuss the dependence of on M and T. First we remark that T depends on M and f. Thus we prove that the mapping is continuous from endowed with the topology of to . Let (M, f) and be elements of and resp. the corresponding operators. Then we estimate
Thus we have
since for some and for some . Then Lemma 3 implies the continuity of from to . Thus the mapping is continuous from endowed with the topology of to . Since is compact in for some there exists a constant only depending on such that .
Finally we apply Troianiello (1987, Theorem 3.16, (iv)) which implies that and
where depends on , , and .
Definition 2
For we call a solution of the adjoint state equation if it satisfies the equation or equivalently
| 12 |
Theorem 2
Let and . Then Eq. (12) has a unique solution . Moreover there exists a constant such that for all
| 13 |
Proof
From the proof of Proposition 2 it follows that is continuous and bijective. Thus is also continuous and bijective. In particular we have . So the equation has a unique solution for every and
for some constant which is uniform in . Then we apply Troianiello (1987, Theorem 3.16, (iv)) which implies that and
where depends on , , and .
Let us note that the strong form corresponding to (12) is formally given by
| 14 |
Shape derivative of J
We follow the notation and strategy in Ito et al. (2008) and Laurain and Sturm (2016). For a field and we define the mappings by . Then we introduce the perturbed domains and the perturbed manifolds . Since h vanishes near there exists a such that for all . Moreover, let with as well as for some and with be given. The perturbed state equation has the form
for . We introduce
and define the non-linear form as
After transformation to the reference domain , the perturbed state equation can be cast as
| 15 |
with the relation between and given by . Next we discuss the differentiability of A(t) and . We shall use the notation
where stands for the kth column of M.
Lemma 4
There holds
where , and
| 16 |
Proof
Let be arbitrary. The function has the form
| 17 |
and
where are the principal minors of Dh. Thus we have
Thus the first assertion is proven. Let us turn to the differentiability of . Since and is compact it follows that is differentiable from to at . The derivative can be conveniently computed by its action on any
Now let be arbitrary and let t be so small such that . Then there holds
A similar proof shows
Utilizing the product rule on leads us to (16).
The formulas for and A also provide the following result.
Lemma 5
The mappings from to and from to are continuous in 0.
Let with and . Then Y is compactly embedded in for any and . Due to the last lemma there exists a such that and for all . Furthermore there exists a such that for all holds. Then we define the set
and get
Thus we have:
Proposition 3
The perturbed state equation has a unique solution .
Proof
This follows directly from Theorem 1.
The perturbed cost functional can be written as
| 18 |
subject to for all . Next we characterize the shape derivative
at in direction h. For this purpose we define the Lagrange functional
for some and . We shall follow Laurain and Sturm (2016) to show that
| 19 |
where solves (15) and solves the averaged adjoint equation
| 20 |
At first we characterize the right hand side of (19). First we observe that
Since and appear linearly in (20), the averaged adjoint equation amounts to
| 21 |
where .
Proposition 4
The averaged adjoint equation has a unique solution with .
Proof
We need to prove that is an element of . We know that is continuous from to with . Thus we need to show that with . This is true since and .
In order to justify (19) we need the following technical lemma.
Lemma 6
Further let and be the solutions of (15) and of (20) for . Then we have
Proof
The first result follows from Lemmas 3 and 5. Let be the solution of the averaged adjoint state equation (21) for A(t), and z. We define which solves
for all . Next we show that is an element of . This follows from the fact that and . Moreover the functional is also a functional in , since . According to the proof of Theorem 2 there holds
with independent of t. Moreover due to Theorem 2 there exists a constant depending only on such that holds. Furthermore there holds and with independent of t. This finishes the proof using Lemma 5.
We introduce the outer product for and the inner product for . Now we have all necessary ingredients to prove the main result of this subsection.
Theorem 3
The shape derivative of J defined in (18) satisfies
| 22 |
for any , where , have the form
| 23 |
| 24 |
Proof
We apply Theorem 2.1 from Laurain and Sturm (2016). Thus we need to prove that
The functional J only depends on t through . Thus we have
Thus we can estimate in the following way:
Then Lemmas 6 and 4 imply the assertion. In order to calculate
we recall Lemma 4 and in particular (16). We obtain
with
Next we give a more usable formula for the shape derivative. For convenience we suppress the superscript for and in the following. In particular we have
Practical implementation
In this section we describe the practical implementation of an algorithm utilizing the shape derivative DJ for the reconstruction of the locations of the activation sites. We assume that these sites have the form with radii and midpoints , . For these activation sites we reconstruct the midpoints .
The state and adjoint state equations
Since the state equation is of nonlinear elliptic type which in practically relevant situations is posed on domains with challenging geometry, we propose to solve it using linear finite elements and a Newton method. For convenience we recall the state equation as
| 25 |
In order to set up a Newton method we need to calculate the derivative of e, in particular we have
| 26 |
The Newton equation is well posed, see Proposition 2. For a given solution T of the state equation, the adjoint state equation in the variable has the form
| 27 |
This is a linear elliptic equation of convection-diffusion type, which we again solve by linear finite elements.
Domain perturbation
While the overall source localization algorithm requires only a displacement of the current source locations, we still calculate a vector field for the perturbation over the whole domain . This vector field h is chosen as the solution of the vector valued elliptic equation
| 28 |
where , are defined in (24) resp. (23). We remark that h is defined on U and not only on . The last equation is solved using linear finite elements. We also note that
and thus h is a decent direction for J. Since we are only interested in the shift of the midpoints of the balls , we average h over , , in order to get a shift of the midpoints.
Finite element solver implementation
The domain is discretized using tetrahedral elements and linear Ansatz functions . As such, there are three linear systems to be solved at least once in each iteration of the source localization loop:
- The linear equation in the Newton iteration , with
- The adjoint state equation , with
The linear systems are assembled and manipulated using the PETSc (Balay et al. 2017) framework. All three linear system are solved using the Boomer (Henson and Yang 2002). Algebraic Multigrid preconditioner in combination with the GMRES solver provided by PETSc. The linear solver in the Newton method is configured with a relative residual error tolerance of , while all other solvers use an absolute residual error tolerance of . The detailed solver settings are listed in the appendix.
Source localization
The goal of the source localization algorithm is to identify the midpoints , of the sources that minimize our functional J. Our shape calculus based on shape derivatives does not allow for splitting or the creation of activation sites. For this purpose one has to resort to topological derivatives.
We propose the approach depicted in Algorithm 1. Required inputs are some starting locations , a user-specified, mesh dependent step-length (usually 1-3 mesh edge-lengths), a step-length scaling parameter and a backtracking scale . The symbol denotes the Euclidean norm. The algorithm starts by initializing and . Then, while the tolerance condition on is not met, in each iteration of the while-loop it computes solutions to (27) and (28), updates the source midpoint positions and finally computes a new state solution to (25). If necessary backtracking is employed, and the next iteration begins.
For complex geometries, the step-length needs to be chosen small enough in order to prevent the sources from being moved out of . Note, that only realizes an upper bound on , but this quantity is not bounded from below. Choosing improves convergence speed, as the are scaled up to counteract the reduction of . In the case of overshooting, oscillations are reduced by backtracking.
According to the problem statement, the sources are not part of the computational domain . In each iteration k, all points of are moved based on the perturbation field , in particular the current source surface is moved. In practice it is easier to solve also the state and adjoint equations on with and apply the Dirichlet boundary values on whole . Then we only translate the logical representation of and thus the discretization of U is not perturbed. This prevents the need for re-meshing and implicitly enables the merging of any without requiring special algorithmic treatment. Once is smaller than the average FE mesh edge-length, local refinement would become necessary. This however, is not within the scope of this work.
Model parameters
The tensor parameter M contains the squared cardiac conduction velocity. In the depth of the human LV wall, conduction velocity is orthotropic due to numerous factors, with the most important ones being the geometry of myocytes and the non-uniform distribution of conduction-mediating proteins and sodium channels. The fastest propagation velocity is observed along the prevailing long axis orientation of myocytes, often referred to as “fiber orientation” . Excitation spread within a sheet and along direction , which is orthogonal to , occurs at a lower conduction velocity , and even slower in a sheet normal direction , at a velocity . Both orthotropic velocities as well as the principal axes vary in space. In general, holds where the ratios are assumed as based on experimental studies (Caldwell et al. 2009). As such, M is defined as
| 29 |
The 2D benchmark in Sect. 4.2 will feature constant fiber-and sheet-directions and with varying , while the 3D human LV benchmark in Sect. 4.3 will have constant velocities , , and heterogeneous vectors , computed by a rule-based method (Bayer et al. 2012). Further, in the human LV benchmark M(x) is an element-wise function. This makes the computation of impractical. While it would be possible to change the representation of M, this has not been pursued, since the terms involving have only a small impact on the shape derivative, see the comparisons in Sect. 4.2.
The parameter is calibrated by comparing the macroscopic velocity of propagating wavefronts generated by the viscous Eikonal model with physiological measurements such as the observed temporal delay between endocardial activation and epicardial breakthrough. Depending on a given trajectory relative to the used fiber field, macroscopic velocities fall into the range of local conduction velocities encoded in M, which themselves are based on experimental measurements (Caldwell et al. 2009).
Evaluation benchmarks
Two numerical benchmarks, a 2D wedge benchmark and a 3D LV benchmark, will be used to evaluate the proposed algorithm’s ability to identify activation sources based on input boundary data.
Evaluation criteria
In both benchmarks we measure both the convergence of the current source locations to the exact source locations , and the reduction of the functional J defined in (1). Thus the following evaluation criteria are used:
the distances to reference locations
the relative reduction with .
2D benchmark
In this benchmark, the computational domain U is given by the unit-square . We consider two activation sites whose midpoints are given by and . Thus we have . The observed data are given on the boundary of U. The domain U is discretized by 66,049 vertices and 131,072 triangles, which yields a discretization size of . Moreover we set , , and
In this example we consider the noise free case. Thus the observed data z is generated by solving the state equation for T and restricting T to . In Fig. 1 we observe that the distances between the exact midpoints and reach values below , more precisely and , after 100 iterations. These distances correspond approximately to the mesh size. On the right of this figure we can note that attains a value of about . Figure 2 shows the trajectories of the points as the iteration proceeds. We can see that the midpoints do not move in straight lines. We expect that this is caused by interaction between the two activation sites, and the influence of M. Nevertheless the exact midpoints are reached with high precision. In Fig. 3 the perturbation field and the adjoint state are displayed for . The dominant directions of the perturbation field point from regions of where is negative to regions of where attains high positive values. Moreover we see that the trajectories of the points (Fig. 2) correlate to the main directions of the perturbation field .
Fig. 1.

The evaluation criteria for the 2D benchmark. Left: distance to reference location over the iteration k. Right: relative functional reduction over the iteration k
Fig. 2.

Left: trajectory of the points and during optimization. Right: magnitude of over iterations k
Fig. 3.

Perturbation field (arrows) and adjoint state variable (background color; blue-negative and red-positive) for . The vectors are scaled for better visibility. The color of the vectors correlates with their length. (blue-short and red-long) (color figure online)
In order to study the influence of the different parts of we introduce the quantities:
We clearly see in Fig. 2 that and are the dominating summands in . Thus it is justified to omit the terms and in the following benchmark. We also carried out tests with different choices for the conductivity tensor M and found nearly identical behavior provided that M is given by (29) with orthonormal vectors and . If the choice for M violates the orthonormality condition for and , then the numerical results may depend on the directions determined by the spatial relation between the exact activation sites and the initial guess, and the directions given by and .
3D LV benchmark
The 3D LV benchmark serves to gauge the potential of the proposed method in an envisioned clinical application which is geared towards localizing earliest activation sites from epicardial activation maps. In line with early experimental mapping studies (Durrer et al. 1970) on ex vivo human hearts we assume that there are three discrete sites of earliest activation located at the endocardial surface of the LV. In anatomical terms, these sites are located higher towards the base of the LV on the anterior paraseptal wall, a central area at the septal endocardium, and a posterior paraseptal area. Therefore the conduction system activating the LV is referred to as “trifascicular” with the three fascicles being referred to as anterior fascicle , posterior fascicle and septal fascicle . Each of these fascicles can be considered as a patch of tissue composed of a tight network of Purkinje fibers which are electrically coupled to the LV myocardium through so-called Purkinje-Ventricular junctions (PVJs). Owing to the fast conduction properties of the Purkinje fibers in these patches a large number of PVJs are located which activate one after the other with very short delays. Thus, these patches appear to activate simultaneously and are considered a fascicle and not a large set of individual PVJs. Further, due the short delays and the close spatial vicinity, it is still highly challenging today, even with invasive mapping devices recording signals with electrodes located in the immediate vicinity of PVJs, to identify individual PVJs. As such we do not expect that the identification of individual PVJs using data recorded at the epicardial surface is feasible.
While the presence of three fascicles is widely accepted and there general location is assumed to be known, the inter-individual variability and their exact location, size and relative timing is significant. Based on these considerations we assume the activation map (either measured or precomputed) on the epicardial surface as given input data for the localization of the three LV fascicles which we deem a plausible and sufficiently accurate general representation of the actual activation sources. Moreover, we simplify by assuming size and timing of individual fascicles as given and focus only on the identification of their location.
The discretized model of a human LV forming the computational domain consists of 47,938 vertices and 245,611 tetrahedra, with an average discretization size of . The observable surface is formed by the epicardial surface of the LV. We refer to Fig. 4. The source surface is with . Further, based on numerical tests with varying activation sequences we chose to obtain appropriate macroscopic conduction velocities which fall into the range of local conduction velocities encoded in M (see Sect. 3.5).
Fig. 4.

a The LV geometry forming , b the surface , c the fiber directions
Motivated by real-world applications, we want to correspond to some error-prone data defined on a lower spatial resolution than the computational resolution of . To accommodate for this, the data z are generated as follows:
- A reference activation time , using the source locations
is computed. is sub-sampled at a set of 106 uniformly spaced sample points yielding .
A zero-average uniform noise is added: with .
The data z is interpolated from the perturbed samples using distance-weighted interpolation.
We compare the following cases for different data selections:
(RI) Using the reference data as input: .
(II) Using only interpolated input: z is generated as described above with .
(PI) Using perturbed and interpolated input: z is generated as described above with .
Starting at the initial locations
the source localization Algorithm 1 is applied. In order to find the best achievable results, the algorithm is configured to only stop if J cannot be further reduced. All three cases executed in approximately 250 seconds on 10 cores of a workstation PC with two Intel Xeon E5645 (2.40 GHz) CPUs.
Figure 5 shows the two evaluation criteria—the summed distances to reference location and the relative reduction of J—over the iteration count. For (RI), the algorithm terminates after 29 iterations with a relative error minimum of . The highest final distance to reference location is , which is well below the average FE edge-length of . The discrete representation of the reconstructed activation sites closely match the desired reference sites.
Fig. 5.

The evaluation criteria for the cases (RI), (II) and (PI) of the LV benchmark. Left: over the iteration k. Right: Relative functional reduction over the iteration k
In the (II) case, the algorithm stops after 29 iterations. The minimal relative error is . The highest final distance is , which is significantly larger than in the (RI) case. This indicates that the low-resolution sampling of lowers the quality of our reconstruction. Also, the interpolation induces noise which impairs the reconstruction quality.
For (PI), the algorithm terminates after 30 iterations with relative error . The are similar to the (II) case, although slightly higher, with the highest final distance . This further hints that the low-resolution sampling has a much greater effect on the source locations than the error due to noise.
For all three cases, the final displacements are smaller than 0.2 mm, and therefore only a fraction of the mesh edge-length of 1.5 mm. As such, some mesh manipulation (e.g. mesh refinement, mesh deformation) would be necessary in order to apply the source displacement on the state and adjoint state problems. Since the mesh is not adjusted in the presented paper, this leads to a stagnation of the algorithm.
Figure 6 visualizes the source localization process by displaying the trajectories of and the adjoint solution during the source localization process. By comparing figure parts A and B, we observe that the motion induced by the field h is oriented from negative to positive regions of , similar to the 2D benchmark in Sect. 4.2. Further, we see the diminishing absolute values of over the iteration count. The final locations in Fig. 6a show, that even the worst localization (PI) still offers a good approximation of the general source location, well inside the uncertainty bounds of clinical parameters. Moreover, we carried out numerical tests with varying anisotropy ratios, see Fig. 7. In the LV benchmark, the convergence trajectory of one source varied significantly between the three choices of M. Numerical tests with significantly higher anisotropy ratios indicate, that a higher FE mesh resolution is required, particularly in the case of large displacements orthogonal to .
Fig. 6.
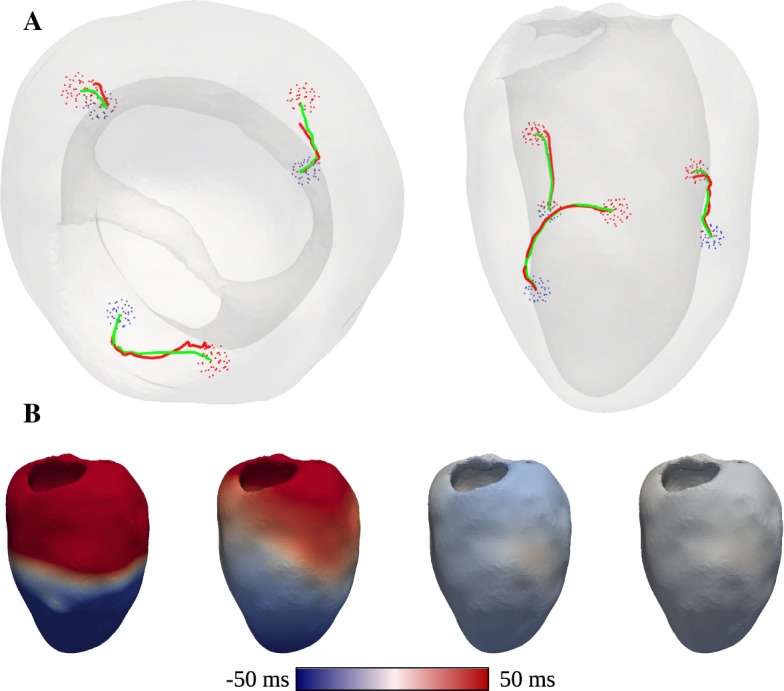
a The trajectories traveled by for the (RI) and (PI) cases. The (RI) trajectory is colored in green, while the one of the (PI) case is colored in red. The mesh vertices inside ball , used for the reference solution , are displayed in red, while those inside the initial search ball are displayed in blue. b The adjoint solution for the (RI) case, for the iterations , respectively from left to right (color figure online)
Fig. 7.

The source trajectories in the (RI) case for three different choices of M. Green: . Blue: . Red: The mesh vertices inside ball , used for the reference solution , are displayed in red, while those inside the initial search ball are displayed in blue (color figure online)
Discussion
This study presented analysis and implementation of an algorithm for identifying sites of earliest activation in the LV from epicardial activation maps. The algorithm is posed as an optimization problem, where initial activation sites are chosen first to be then iteratively perturbed in order to minimize the mismatch between computed activation times and the activation maps given at the epicardial surface. We demonstrated well-posedness of all sub-problems, namely the viscous Eikonal equation, the tangent and adjoint equations and the perturbed state equation and characterized the shape derivative.
The theoretical results were verified by solving two benchmark problems, a 2D unit-square benchmark and a 3D human LV benchmark. For unperturbed input data, the localization method was able to accurately reconstruct the sites of initial activation. The largest deviations observed were and 1 mm, respectively, for the 2D and 3D benchmark. This was significantly smaller than the respective spatial discretization sizes of and 1.5 mm used in 2D and 3D benchmark, respectively. To probe the robustness of the method, the 3D benchmark was repeated using input data of reduced quality, that is, epicardial activation were spatially under-sampled and noise was added. These benchmark results showed, that the identification of earliest activation sites was still feasible, yielding a sufficiently accurate approximation of the general locations, comparable or better than the accuracy achieved with clinically used invasive endocardial mapping systems (Gepstein et al. 1997).
Several topics suggest themselves as possible extensions of the present work. The shape gradient is already set up to allow for a more realistic representation of the activations sites than those considered in the numerical realizations of these first benchmarks. Also, it can be of interest to incorporate different activation times by introducing inhomogeneous Dirichlet boundary conditions with unknown forcing terms. To allow for additional accuracy of the reconstruction of the evolution of the activation regions local grid refinement can be considered in future algorithmic efforts. Further it can be an interesting task to carry out the asymptotic analysis for .
Limitations
While the benchmarks in this study demonstrate that the identification of sites of earliest endocardial activation from epicardial activation maps is, in principle, feasible with the proposed method, with regard to practical applications a number of restrictions apply. Out method makes various tacit assumptions which may not always hold in practice. Fiber arrangements are assumed to be known, following largely the patterns observed experimentally in the healthy LV (Streeter et al. 1969). With current technology fiber arrangements cannot be measured in vivo with sufficient spatial resolution,but suitable technologies under development (Scott et al. 2018) promise to lift this restriction in the future. Further, conduction velocities along the principal tensor axes were also assumed homogeneously throughout the LV, as velocities cannot be determined accurately in vivo, the chosen values were based on experimental observations (Caldwell et al. 2009). These values and their ratios may deviate from the experimentally estimation of , and they may not be constant throughout the myocardium. Identifying the velocity tensor fields is therefore an additional complexity which is a related research topic (Marchesseau et al. 2013a) that has not been addressed in this study. A further limitation is the assumption that three sites of earliest endocardial activation exist. While this is physiologically motivated based on the notion that three main fascicles initiate activation in the healthy human LV endocardium (Durrer et al. 1970), this may not always be the case, particularly not under pathological conditions such as a left bundle branch block where the electrical activation of the LV may follow a markedly different pattern.
Acknowledgements
: Open access funding provided by University of Graz. The authors gratefully acknowledge many useful discussions with E. Karabelas and K. Sturm.
Appendix
PETSc solver options
The following solver configuration parameters were passed at run-time to PETSc: 
Units
The results of the LV benchmark use the following units:
| Variable | Unit |
|---|---|
| ms | |
| h | mm |
| M | |
| ms |
Footnotes
Karl Kunisch was supported in part by the ERC advanced Grant 668998 (OCLOC) under the EU H2020 research program. Aurel Neic and Gernot Plank were supported in part by the Grant SFB MOBIS (FWF F3210-N18) and the BioTechMed Projekt “ILearnHeart”.
Publisher's Note
Springer Nature remains neutral with regard to jurisdictional claims in published maps and institutional affiliations.
Contributor Information
Karl Kunisch, Email: karl.kunisch@uni-graz.at.
Aurel Neic, Email: aurel.neic@medunigraz.at.
Gernot Plank, Email: gernot.plank@medunigraz.at.
Philip Trautmann, Email: philip.trautmann@uni-graz.at.
References
- Adams R, Fournier J. Sobolev spaces. Pure and Applied Mathematics. Amsterdam: Elsevier Science; 2003. [Google Scholar]
- Balay S, Abhyankar S, Adams MF, Brown J, Brune P, Buschelman K, Dalcin L, Eijkhout V, Gropp WD, Kaushik D, Knepley MG, May DA, McInnes LC, Rupp K, Smith BF, Zampini S, Zhang H, Zhang H (2017) PETSc Web page. http://www.mcs.anl.gov/petsc
- Bayer JD, Blake RC, Plank G, Trayanova NA. A novel rule-based algorithm for assigning myocardial fiber orientation to computational heart models. Ann Biomed Eng. 2012;40:2243–2254. doi: 10.1007/s10439-012-0593-5. [DOI] [PMC free article] [PubMed] [Google Scholar]
- Bear LR, Huntjens PR, Walton RD, Bernus O, Coronel R, Dubois R. Cardiac electrical dyssynchrony is accurately detected by noninvasive electrocardiographic imaging. Heart Rhythm. 2018;15:1058–1069. doi: 10.1016/j.hrthm.2018.02.024. [DOI] [PubMed] [Google Scholar]
- Caldwell BJ, Trew ML, Sands GB, Hooks DA, LeGrice IJ, Smaill BH. Three distinct directions of intramural activation reveal nonuniform side-to-side electrical coupling of ventricular myocytes. Circ Arrhythm Electrophysiol. 2009;2:433–440. doi: 10.1161/CIRCEP.108.830133. [DOI] [PubMed] [Google Scholar]
- Dolcetta Italo Capuzzo. Nonlinear Equations: Methods, Models and Applications. Basel: Birkhäuser Basel; 2003. Representations of Solutions of Hamilton-Jacobi Equations; pp. 79–90. [Google Scholar]
- Cluitmans M, Brooks DH, MacLeod R, Doessel O, Guillem MS, van Dam PM, Svehlikova J, He B, Sapp J, Wang L, Bear L. Validation and opportunities of electrocardiographic imaging: from technical achievements to clinical applications. Front Physiol. 2018;9:1305. doi: 10.3389/fphys.2018.01305. [DOI] [PMC free article] [PubMed] [Google Scholar]
- Colli Franzone P, Guerri L, Rovida S. Wavefront propagation in an activation model of the anisotropic cardiac tissue: asymptotic analysis and numerical simulations. J Math Biol. 1990;28(2):121–176. doi: 10.1007/BF00163143. [DOI] [PubMed] [Google Scholar]
- Delfour M, Zolesio J. Shapes and geometries. 2. Philadelphia: Society for Industrial and Applied Mathematics; 2011. [Google Scholar]
- Demoulin JC, Kulbertus HE. Histopathological examination of concept of left hemiblock. Brit Heart J. 1972;34:807–814. doi: 10.1136/hrt.34.8.807. [DOI] [PMC free article] [PubMed] [Google Scholar]
- Durrer D, van Dam RT, Freud GE, Janse MJ, Meijler FL, Arzbaecher RC. Total excitation of the isolated human heart. Circulation. 1970;41:899–912. doi: 10.1161/01.CIR.41.6.899. [DOI] [PubMed] [Google Scholar]
- Erem B, van Dam PM, Brooks DH. Identifying model inaccuracies and solution uncertainties in noninvasive activation-based imaging of cardiac excitation using convex relaxation. IEEE Trans Med Imaging. 2014;33:902–912. doi: 10.1109/TMI.2014.2297952. [DOI] [PMC free article] [PubMed] [Google Scholar]
- Gepstein L, Hayam G, Ben-Haim SA. A novel method for nonfluoroscopic catheter-based electroanatomical mapping of the heart. In vitro and in vivo accuracy results. Circulation. 1997;95:1611–1622. doi: 10.1161/01.CIR.95.6.1611. [DOI] [PubMed] [Google Scholar]
- Gulrajani RM, Roberge FA, Savard P (1989) Comprehensive electrocardiology, chap. In: Macfarlane PW, van Oosterom A, Pahlm O, Kligfield P, Janse M, Camm J (eds) The inverse problem of electrocardiology. Pergamon Press, New York, pp 237–288
- Haissaguerre M, Vigmond E, Stuyvers B, Hocini M, Bernus O. Ventricular arrhythmias and the His–Purkinje system. Nat Rev Cardiol. 2016;13:155–166. doi: 10.1038/nrcardio.2015.193. [DOI] [PubMed] [Google Scholar]
- Han C, Pogwizd SM, Yu L, Zhou Z, Killingsworth CR, He B. Imaging cardiac activation sequence during ventricular tachycardia in a canine model of nonischemic heart failure. Am J Physiol Heart Circ Physiol. 2015;308:H108–H114. doi: 10.1152/ajpheart.00196.2014. [DOI] [PMC free article] [PubMed] [Google Scholar]
- He B, Li G, Zhang X. Noninvasive imaging of cardiac transmembrane potentials within three-dimensional myocardium by means of a realistic geometry anisotropic heart model. IEEE Trans Biomed Eng. 2003;50:1190–1202. doi: 10.1109/TBME.2003.817637. [DOI] [PubMed] [Google Scholar]
- Henson VE, Yang UM. Boomeramg: a parallel algebraic multigrid solver and preconditioner. Appl Numer Math. 2002;41(1):155–177. doi: 10.1016/S0168-9274(01)00115-5. [DOI] [Google Scholar]
- Ito K, Kunisch K, Peichl GH. Variational approach to shape derivatives. ESAIM Control Optim Calc Var. 2008;14(3):517–539. doi: 10.1051/cocv:2008002. [DOI] [Google Scholar]
- Janssen AM, Potyagaylo D, Dössel O, Oostendorp TF. Assessment of the equivalent dipole layer source model in the reconstruction of cardiac activation times on the basis of BSPMS produced by an anisotropic model of the heart. Med Biol Eng Comput. 2018;56:1013–1025. doi: 10.1007/s11517-017-1715-x. [DOI] [PMC free article] [PubMed] [Google Scholar]
- Laurain A, Sturm K. Distributed shape derivative via averaged adjoint method and applications. ESAIM Math Model Numer Anal. 2016;50(4):1241–1267. doi: 10.1051/m2an/2015075. [DOI] [Google Scholar]
- Marchesseau S, Delingette H, Sermesant M, Ayache N. Fast parameter calibration of a cardiac electromechanical model from medical images based on the unscented transform. Biomech Model Mechanobiol. 2013;12:815–831. doi: 10.1007/s10237-012-0446-z. [DOI] [PubMed] [Google Scholar]
- Marchesseau S, Delingette H, Sermesant M, Cabrera-Lozoya R, Tobon-Gomez C, Moireau P, FiguerasiVentura RM, Lekadir K, Hernandez A, Garreau M, Donal E, Leclercq C, Duckett SG, Rhode K, Rinaldi CA, Frangi AF, Razavi R, Chapelle D, Ayache N. Personalization of a cardiac electromechanical model using reduced order unscented Kalman filtering from regional volumes. Med Image Anal. 2013;17:816–829. doi: 10.1016/j.media.2013.04.012. [DOI] [PubMed] [Google Scholar]
- Ono N, Yamaguchi T, Ishikawa H, Arakawa M, Takahashi N, Saikawa T, Shimada T. Morphological varieties of the Purkinje fiber network in mammalian hearts, as revealed by light and electron microscopy. Arch Histol Cytol. 2009;72:139–149. doi: 10.1679/aohc.72.139. [DOI] [PubMed] [Google Scholar]
- Potse M, Krause D, Kroon W, Murzilli R, Muzzarelli S, Regoli F, Caiani E, Prinzen FW, Krause R, Auricchio A. Patient-specific modelling of cardiac electrophysiology in heart-failure patients. Europac. 2014;16(Suppl 4):iv56–iv61. doi: 10.1093/europace/euu257. [DOI] [PMC free article] [PubMed] [Google Scholar]
- Ramanathan C, Ghanem RN, Jia P, Ryu K, Rudy Y. Noninvasive electrocardiographic imaging for cardiac electrophysiology and arrhythmia. Nat Med. 2004;10:422–428. doi: 10.1038/nm1011. [DOI] [PMC free article] [PubMed] [Google Scholar]
- Rosenbaum MB, Elizari MV, Lazzari JO, Nau GJ, Levi RJ, Halpern MS. Intraventricular trifascicular blocks. The syndrome of right bundle branch block with intermittent left anterior and posterior hemiblock. Am Heart J. 1969;78:306–317. doi: 10.1016/0002-8703(69)90038-6. [DOI] [PubMed] [Google Scholar]
- Rudy Y. Noninvasive electrocardiographic imaging of arrhythmogenic substrates in humans. Circ Res. 2013;112:863–874. doi: 10.1161/CIRCRESAHA.112.279315. [DOI] [PMC free article] [PubMed] [Google Scholar]
- Rudy Y, Burnes JE. Noninvasive electrocardiographic imaging. Ann Noninvasive Electrocardiol. 1999;4:340–358. doi: 10.1111/j.1542-474X.1999.tb00220.x. [DOI] [Google Scholar]
- Scott AD, Nielles-Vallespin S, Ferreira PF, Khalique Z, Gatehouse PD, Kilner P, Pennell DJ, Firmin DN. An in-vivo comparison of stimulated-echo and motion compensated spin-echo sequences for 3 T diffusion tensor cardiovascular magnetic resonance at multiple cardiac phases. J Cardiovasc Magn Reson. 2018;20:1. doi: 10.1186/s12968-017-0425-8. [DOI] [PMC free article] [PubMed] [Google Scholar]
- Sokołowski J, Zolésio JP. Introduction to shape optimization. Berlin: Springer; 1992. [Google Scholar]
- Streeter D, Spontnitz H, Patel D, Ross J, Sonnenblick E. Fiber orientation in the canine left ventricle during diastole and systole. Circ Res. 1969;24:339–347. doi: 10.1161/01.RES.24.3.339. [DOI] [PubMed] [Google Scholar]
- Tikhonov AN, Arsenin VY. Solutions of ill-posed problems. New York: Wiley; 1977. [Google Scholar]
- Troianiello GM. Elliptic differential equations and obstacle problems. New York: Plenum Press; 1987. [Google Scholar]
- van Dam PM, Oostendorp TF, Linnenbank AC, van Oosterom A. Non-invasive imaging of cardiac activation and recovery. Ann Biomed Eng. 2009;37:1739–1756. doi: 10.1007/s10439-009-9747-5. [DOI] [PMC free article] [PubMed] [Google Scholar]
- Wang L, Zhang H, Wong KCL, Liu H, Shi P. Physiological-model-constrained noninvasive reconstruction of volumetric myocardial transmembrane potentials. IEEE Trans Biomed Eng. 2010;57:296–315. doi: 10.1109/TBME.2009.2024531. [DOI] [PubMed] [Google Scholar]
- Wang L, Dawoud F, Yeung SK, Shi P, Wong KCL, Liu H, Lardo AC. Transmural imaging of ventricular action potentials and post-infarction scars in swine hearts. IEEE Trans Med Imaging. 2013;32:731–747. doi: 10.1109/TMI.2012.2236567. [DOI] [PubMed] [Google Scholar]
- Zettinig O, Mansi T, Neumann D, Georgescu B, Rapaka S, Seegerer P, Kayvanpour E, Sedaghat-Hamedani F, Amr A, Haas J, Steen H, Katus H, Meder B, Navab N, Kamen A, Comaniciu D. Data-driven estimation of cardiac electrical diffusivity from 12-lead ECG signals. Med Image Anal. 2014;18:1361–1376. doi: 10.1016/j.media.2014.04.011. [DOI] [PubMed] [Google Scholar]