

Abstract
Low exposure to microbial products, respiratory viral infections and air pollution is a major risk factor for allergic asthma, yet the mechanistic links between such conditions and host susceptibility to type 2 allergic disorders remain unclear. Through the use of single-cell RNA sequencing (scRNA-seq), we characterized lung neutrophils in mice exposed to a pro-allergic, low dose of lipopolysaccharides (LPSlo) or a protective, high dose of LPS (LPShi) before exposure to house dust mite (HDM). Unlike exposure to LPShi, exposure to LPSlo instructed recruited neutrophils to upregulate the expression of the chemokine receptor CXCR4 and to release neutrophil extracellular traps (NETs). The LPSlo-induced neutrophils and NETs potentiated the uptake of HDM by CD11b+Ly-6C+ dendritic cells (DCs) and type 2 allergic airway inflammation in response to HDM. NETs derived from CXCR4hi neutrophils were also needed to mediate allergic asthma triggered by infection with influenza virus or exposure to ozone. Our study indicates that apparently unrelated environmental risk factors can shape recruited lung neutrophils to promote the initiation of allergic asthma.
Exposure to naturally occurring aeroallergens such as HDM, pollens or animal dander can, in some predisposed individuals, lead to allergic sensitization and the development of allergic asthma, a major public-health problem with high socio-economic impacts1,2. While genome-wide studies have discovered genetic polymorphisms associated with allergic susceptibility3, the worldwide increase in the prevalence of allergies over the last decades points towards a major contribution of the environment4,5. Epidemiological studies have identified environmental risk factors for allergic asthma, including respiratory viral infections6, air pollutants7 or urban lifestyles associated with decreased exposure to microbes or their products such as bacterial endotoxins (LPS)8,9. A better understanding of the mechanisms by which pro-allergic environmental conditions shape the lung immune system to initiate allergic airway responses is an unmet and urgent need which may open novel therapeutic avenues for allergic asthma.
Allergic airway inflammation, a cardinal feature of allergic asthma, is thought to result from an aberrant type 2 immune response directed against inhaled allergens10,11. The initiation of type 2 immunity to HDM, a major allergen source in humans12, involves sensing of LPS and compounds of HDM by epithelial cells and the release of pro-allergic alarmins that instruct lung DCs to sample allergens, transport them to the draining lymph node (LN) and induce allergen-specific CD4+ T helper type 2 (TH2) cells. Upon subsequent HDM challenge, TH2 effector cells secrete type 2 cytokines such as IL-4, IL-5 and IL-13, which orchestrate features of allergic airway inflammation, including airway eosinophilia and goblet cell metaplasia through IL-5- and IL-13-dependent mechanisms, respectively11,13.
Neutrophils are known to function as first-responders specialized in pathogen clearance and as prototypic effector cells of type 17 responses. However, new evidence points to the complexity and functional diversity of neutrophils14,15. The role of neutrophils in asthma has mainly been investigated in severe asthma, which is characterized by a type 17-mediated neutrophilic inflammation16–19. In type 2 allergic asthma, the role of neutrophils has been investigated in the effector phase, but not the initiation, of type 2 responses17,20. Indeed, neutrophil-derived DNA found in NETs, which also contain modified histone proteins such as citrullinated histone H3 (Cit-H3) and granule proteins such as neutrophil elastase (NE) and myeloperoxidase (MPO)15, contributed to the manifestations of rhinovirus-induced allergic asthma exacerbations20.
Here, using single-cell RNA-sequencing (scRNA-seq) and mouse models of allergic asthma triggered by three distinct pro-allergic environmental factors, we found that locally-programmed, NET-releasing CXCR4hi lung neutrophils acted as early triggers of type 2 allergic airway inflammation. Our results indicate that phenotypically and functionally distinct tissue neutrophils act as common determinants of environment-driven allergic asthma onset in mice.
Results
Low-dose LPS exposure potentiates HDM-induced allergic asthma
To investigate the mechanisms of environment-driven initiation of allergic asthma in mice, we used a model of exposure to HDM in mice pre-exposed to a pro-allergic environmental factor, namely a low dose of LPS21. Different doses of LPS, ranging from 0.1ng to 10µg, were administered intranasally (i.n.) to groups of BALB/c mice, which were exposed 1 and 8 days later to 40 and 10 µg HDM i.n., respectively. At day 11, airway eosinophilia, a feature of type 2 allergic asthma11, was virtually absent in vehicle pre-exposed HDM-treated mice, but reached a peak in mice pre-exposed to 100ng LPS, and returned to baseline with 10µg LPS (Supplementary Fig. 1a,b). Single exposures to either 100ng or 10µg LPS were chosen to model a pro-allergic, 'hygienic' (LPSlo) or a protective22, 'non-hygienic' (LPShi) environment, respectively. LPSlo mice treated with HDM (LPSlo-HDM mice) developed features of allergic asthma 3 days after the second HDM instillation, including increased bronchial hyperreactivity to methacholine (Fig. 1a), airway eosinophilia (Fig. 1b), a higher secretion of IL-4, IL-5 and IL-13 by total LN cells restimulated with HDM (Fig. 1c), perivascular and peribronchial leukocyte infiltration (Fig. 1d,e), and increased bronchial mucus production (Fig. 1f,g) when compared to vehicle-HDM or LPShi-HDM mice. Of note, CD45+CD11bhiLy-6Ghi neutrophils, quantified by flow cytometry, were massively recruited into the lungs of LPSlo and LPShi mice between 6 and 24 h after LPS exposure (Supplementary Fig. 1c,d). Thus, low-dose exposure to LPS induced a lung environment that promoted type 2 immunity to HDM and the development of allergic asthma.
Figure 1. Pre-exposure to low-dose LPS potentiates HDM-induced type 2 allergic asthma.

a, Invasive measurement of dynamic airway resistance upon methacholine inhalation showing bronchial hyperreactivity in vehicle-HDM, LPSlo-HDM and LPShi-HDM mice, assessed 3 days after the second HDM administration. b, Eosinophil cell counts in the BALF of mice, as in a. c, ELISA measurement of cytokine production by HDM-restimulated bronchial lymph node (BLN) cells of mice as in a. d, Inflammatory score estimating perivascular and peribronchial inflammation, quantified from H&E-stained lung sections of mice as in a. e, Representative H&E staining of lung sections of mice as in a. f, Quantification of PAS-stained epithelial cells per bronchi showing airway mucus production in mice as in a. g, Representative PAS staining of lung sections of mice as in a. (a-d,f) Data show mean + s.e.m. and are pooled from (a) 2 independent experiments (n=6 mice/group) or (b-d,f) ≥3 independent experiments, each symbol representing (b,d,f) individual mice (n=12/group) or (c) independent experiments in which cells from 4 mice were pooled by group. P values were calculated using (a) a mixed effects model with Geisser greenhouse correction or (b-d,f) a one-way ANOVA with Tukey's post hoc test. *P<0.05; **P<0.01; ***P<0.001. BALF, bronchoalveolar lavage fluid; ns, not significant i.n., intranasal(ly). Scale bar = 32 µm.
scRNA-seq identifies particular neutrophils in LPSlo mice
To investigate the transcriptional diversity of lung neutrophils, we performed scRNA-seq. Twenty-four h after vehicle, LPSlo and LPShi i.n., neutrophils were first enriched from lung single-cell suspensions pooled from 3 BALB/c mice per condition by negative selection using magnetic-activated cell sorting (MACS) and were then FACS-sorted as CD45+ cells (Supplementary Fig. 2a-c). Using the 10x Genomics platform23, cells were subjected to single cell droplet encapsulation, scRNA-seq and quality control filtering (Supplementary Fig. 2d,e). A total of 1,406, 2,146 and 2,746 cells were analyzed in vehicle, LPSlo and LPShi mice, respectively. Non-linear dimensional reduction and graph-based clustering of single cells pooled from vehicle, LPSlo and LPShi mice identified 6 transcriptionally distinct clusters of neutrophils, all characterized by high expression of S100a8, S100a9 and Csf3r transcripts (cluster 0 – cluster 5; Fig. 2a and Supplementary Fig. 2f,g). Neutrophils from vehicle lungs were grouped in one cluster (cluster 0; Fig. 2b-d and Supplementary Fig. 3a-d), while neutrophils from LPSlo and LPShi mice were segregated into 5 additional clusters (clusters 1-5, Fig. 2b-d). Neutrophils in cluster 1 were almost uniquely found in lungs from LPSlo mice, while neutrophils in clusters 2, 3 and 5 were nearly exclusively present in lungs from LPShi mice and neutrophils in cluster 4 were equally distributed between LPShi and LPSlo mice (Fig. 2b-d). We performed a differential expression analysis and we defined a common, dose-independent, LPS-induced signature as the list of transcripts that were commonly upregulated in each of the clusters 1 to 5 as compared to cluster 0 (Supplementary Fig. 3e,f). We then identified LPSlo or LPShi signatures as the lists of transcripts that were upregulated in cluster 1 or clusters 2,3 and 5, respectively, as compared to cluster 0, and that were absent from the common LPS signature. Cxcr4 and Lamp-1 transcripts, which code for proteins detectable by flow cytometry, were significantly upregulated in LPSlo neutrophils as compared to LPShi neutrophils (Fig. 2e). The LPShi signature comprised 25 transcripts that were enriched in processes such as complement receptor-mediated signaling pathways (Fpr1, Fpr2) and response to type 1 or type 2 interferon (IFN) (Ifitm1, Ifitm3, Ifi47) based on Gene Ontology (GO) analysis (Fig. 2e-g). The LPSlo signature contained 97 transcripts that were enriched in genes involved in endoplasmic reticulum stress (Atf3, Atf4, Bax), reactive oxygen species synthesis (Ptgs2, Arg2, Il1b), oxidative stress (Rps3, Prdx6, Jun) and ERK1/2 signaling cascade (Cd74, C3, Hmgb1) (Fig. 2e,f,h), responses that have all been implicated in the formation and release of NETs15,24. Thus, lung neutrophils induced by a pro-allergic, low dose of LPS are transcriptionally distinct from those induced by a high LPS dose.
Figure 2. ScRNA-seq analysis of the lung neutrophil compartment 24 h after pro-allergic low or protective high LPS exposure.

a, tSNE plots depicting the transcriptional identity of lung neutrophils merged from vehicle, LPSlo and LPShi mice 24 h after treatment, analyzed by scRNA-seq (n=3 pooled mice/group). b, tSNE plots depicting the transcriptional identity of lung neutrophils from the three separate experimental conditions as in a. c, Pie charts depicting the relative contribution of each neutrophil cluster to the pool of neutrophils in lungs of mice as in a. Insets indicate average percentage of neutrophils among total lung cells. d, Absolute numbers of lung neutrophils per cluster in mice as in a. e, Volcano plot depicting the differentially expressed genes between LPShi and LPSlo lung neutrophils of mice as in a. Transcripts characteristic of the common LPS, the LPSlo- and LPShi-specific signatures are colored in black, red and blue, respectively. f, PANTHER GO enrichment tests on the genes of the LPShi (left) and LPSlo (right) signatures. g-h, Dot plots showing average expression of genes of the (g) LPShi and (h) LPSlo signatures within neutrophil clusters. Data in (d) show mean + s.e.m. (n=3 mice/group). P values were calculated using (d) a two-way ANOVA with Tukey's post hoc test, (e) a likelihood ratio test based on zero-inflated data to identify positive and negative markers of a single cluster compared to some or all other clusters or (f) a two-tailed Mann-Whitney U test with Benjamini-Hochberg False Discovery Rate (FDR) correction. The symbol ° within a given cluster in d indicates that neutrophil numbers in that cluster are significantly different from the ones of the same cluster in the two other experimental conditions. °°°P<0.001. GO, Gene Ontology.
LPSlo locally triggers NET-releasing CXCR4hi neutrophils
To validate the scRNA-seq findings and identify the neutrophils induced by LPSlo treatment in vivo, we exposed BALB/c mice to vehicle, LPSlo or LPShi treatment and assessed the expression of CXCR4 and Lamp-1 on lung CD45+CD11bhiLy-6Ghi neutrophils 24 h later. We found a significant upregulation of CXCR4 and Lamp-1 on lung neutrophils from LPSlo mice as compared to neutrophils from vehicle or LPShi mice (Fig. 3a,b). The expression of CD49d, an integrin reported to be highly expressed on CXCR4hi blood neutrophils25, was also upregulated on lung neutrophils from LPSlo mice (Fig. 3a,b). Next, we performed time-course analyses of CXCR4 expression on bone marrow (BM), blood and lung CD45+CD11bhiLy-6Ghi neutrophils isolated 6, 12, 18, 24 and 48 h after treatment in vehicle, LPSlo and LPShi mice. In the lung, CXCR4 expression on CD45+CD11bhiLy-6Ghi neutrophils started to increase 18 h after LPSlo, reached a peak at 24 h and returned to baseline after 48 h (Fig. 3c). Expression of CXCR4 on lung CD45+CD11bhiLy-6Ghi neutrophils from LPShi mice was similar to that of vehicle mice (Fig. 3c). Of note, while we detected a rhythmic oscillation in the expression of CXCR4 expression on blood neutrophils26, the oscillation was not affected by treatment with LPS, regardless of the dose (Fig. 3c). Expression of CXCR4 on BM CD45+CD11bhiLy-6Ghi neutrophils was similar in LPSlo and vehicle mice (Fig. 3c), indicating that low-dose LPS administered i.n. instructs the neutrophils locally, and not at distant sites. Morphologically, CXCR4hiCD49dhi neutrophils sorted from lungs of LPSlo mice were smaller and displayed a higher nucleus/cytoplasm ratio and a hypersegmented nucleus compared to lung CXCR4loCD49dlo neutrophils from LPShi mice (Fig. 3d and Supplementary Fig. 4a-d).
Figure 3. Pro-allergic low-dose LPS instructs lung neutrophils to upregulate CXCR4, CD49d and Lamp-1 and release NETs.

a, Representative histograms of CXCR4, CD49d and Lamp-1 expression by lung CD45+CD11b+Ly-6G+ neutrophils from vehicle, LPSlo and LPShi mice 24 h after treatment. b, MFI showing quantification of CXCR4, CD49d and Lamp-1 expression by lung CD45+CD11bhiLy-6Ghineutrophils as in a. c, Kinetic analysis of CXCR4 expression by bone marrow, blood and lung CD45+CD11b+Ly-6G+ neutrophils from mice as in a. d, Representative photographs of FACS-sorted CXCR4loCD49dlo, CXCR4loCD49dlo and CXCR4hiCD49dhi lung neutrophils from mice as in a. e, Confocal microscopy stainings of Cit-H3+MPO+DAPI+ NETs released from ex vivo-cultured neutrophils as in d. Pictures are representative of one of 4 independent sorting experiments. f, Levels of extracellular dsDNA in the BALF of vehicle, LPSlo and LPShi mice 24 h after treatment. g, ELISA measurement of NE/DNA complexes in the BALF of mice as in f. h, Representative blots of Cit-H3 and HSP90α (loading control) assessed by Western blot of lung protein extracts from mice as in f. i, Quantification of normalized Cit-H3 levels in lung protein extracts of mice as in f. j, Confocal microscopy stainings (top) and three-dimensional modeling (bottom) of Cit-H3+MPO+ NETs on lung sections of mice as in f. Pictures are representative of one of >6 lungs analyzed. k, Quantification of NET volume in lung sections of mice as in f (n= 8 mice/group). Data show mean + s.e.m and are pooled from (b,f,g,i) 3 independent experiments (b,f,g,i: n=9,9,6,6 mice/group, respectively), or (c) 2 independent experiments perand to release neutrophil extracellular traps time point analyzed (n=3 mice/time point). P values were calculated using a one-way ANOVA with Tukey's post hoc test. *P<0.05; **P<0.01; ***P<0.001. P values compare LPSlo vs. vehicle or LPShi mice in c (i.e., treatment effect). BALF, bronchoalveolar lavage fluid; OD, optical density; ns, not significant. Scale bar = 10 µm.
Lung CXCR4hiCD49dhi neutrophils sorted from LPSlo mice released NETs ex vivo, while lung CXCR4loCD49dlo neutrophils from vehicle or LPShi mice did not (Fig. 3e and Supplementary Fig. 4e-g). In addition, the amount of free double-stranded DNA (dsDNA) and of NE/DNA complexes, which are characteristic of NETs15, were higher in the broncho-alveolar lavage fluid (BALF) of LPSlo mice 24 h post-LPS as compared to vehicle and LPShi mice (Fig. 3f,g), while the amounts of Cit-H3, a modified form of histone H3 implicated in chromatin decondensation and NET formation15, were specifically increased in the lungs of LPSlo mice (Fig. 3h,i). High-resolution confocal microscopy indicated the presence of extracellular MPO+Cit-H3+ NETs in the lungs of LPSlo mice, unlike in vehicle or LPShi mice (Fig. 3j,k). Notably, neutrophil depletion with an antibody against Ly-6G was associated with an absence of NETs 24 h after LPS in the lungs of anti-Ly-6G-treated LPSlo mice (Supplementary Fig. 5), indicating that NETs were exclusively derived from neutrophils. Concordant with the upregulation of CXCR4, NETs were detected at 18 h after low-dose LPS, but not detected after 48 h (Supplementary Fig. 6a,b). These observations indicate that neutrophils recruited to the lungs of LPSlo mice had a CXCR4hiCD49dhiLamp-1hi phenotype that was only detected in the lungs, and were prone to release NETs, while lung neutrophils recruited in LPShi mice were phenotypically similar to steady-state neutrophils and did not release NETs.
CXCR4hi neutrophils and NETs trigger allergic airway inflammation in LPSlo mice
To address whether the effect of low-dose LPS on HDM-induced allergic airway inflammation was mediated by neutrophils, LPSlo-HDM mice were administered Sch527123, an antagonist of the chemokine receptor CXCR2 (anti-CXCR2)27, orally 2 h before and 4 and 8 h after LPSlo, and 2 h before and 4 h after i.n. administration of 40 µg HDM in order to inhibit the LPS-induced neutrophil recruitment to the lung28. Treatment with anti-CXCR2 significantly reduced numbers of lung CD45+CD11bhiLy-6Ghi neutrophils 24 h after LPS treatment in LPSlo mice (Fig. 4a,b). LPSlo-HDM mice treated with anti-CXCR2 had significantly reduced airway eosinophilia (Fig. 4c), HDM-specific type 2 immune responses (Fig. 4d), perivascular and peribronchial inflammation (Fig. 4e,f) and mucus cell production (Fig. 4g,h) compared to vehicle LPSlo-HDM mice. In a different approach, we isolated lung neutrophils from vehicle, LPSlo or LPShi mice by MACS negative selection and FACS CD45+ sorting 24 h post-LPS (vehicle, LPSlo and LPShi neutrophils, respectively) and adoptively transferred 5 x 10⁵ neutrophils in the trachea of naive recipients together with 40 µg HDM, which were exposed to 10 µg HDM i.n. 7 days later and analyzed 11 days after transfer. Transfer of LPSlo neutrophils was sufficient to trigger airway eosinophilia (Fig. 4i), HDM-specific type 2 immunity (Fig. 4j), peribronchial inflammation (Fig. 4k,l) and increased mucus production (Fig. 4m,n) in HDM-treated recipient mice, while all these features were significantly lower in mice that received vehicle or LPShi neutrophils.
Figure 4. LPSlo neutrophils mediate susceptibility to HDM-induced type 2 allergic airway inflammation.
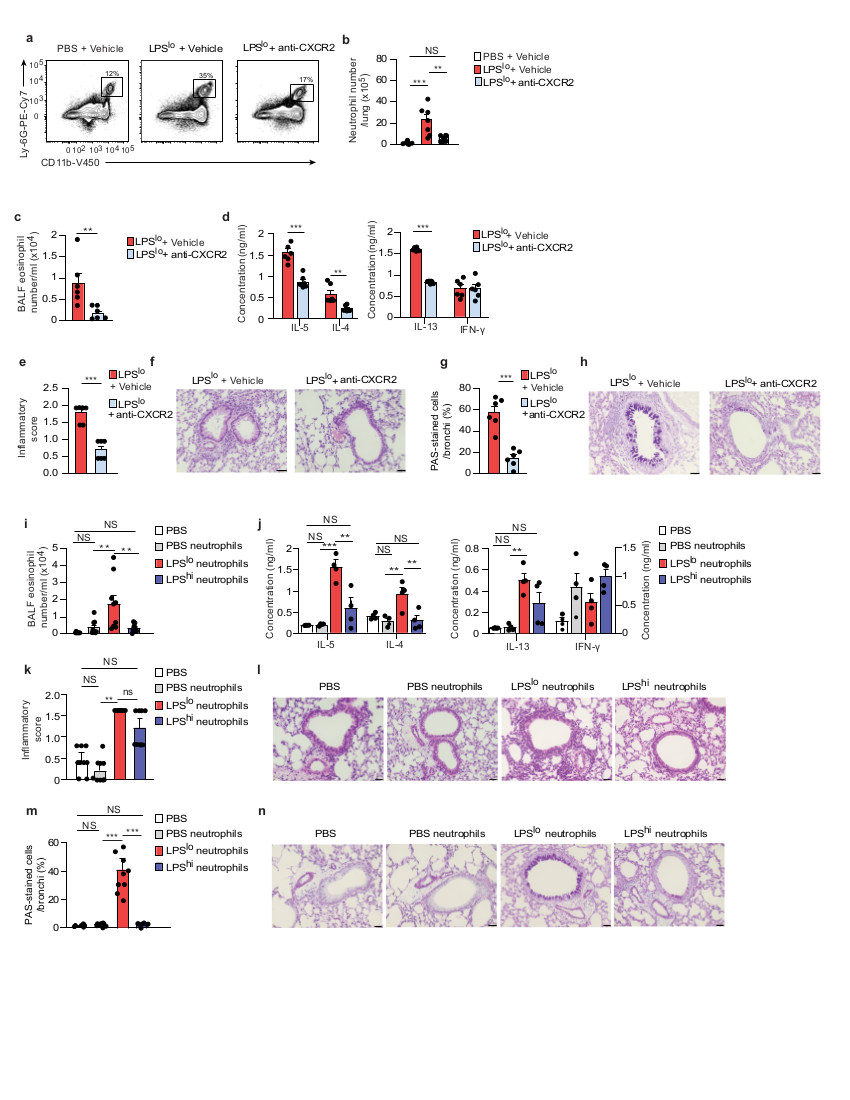
a, Representative dot plots of lung CD45+CD11b+Ly-6G+ neutrophils from vehicle or LPSlo mice treated or not with Sch527123, a CXCR2 antagonist (anti-CXCR2), 2 h before and 4, 8 and 20 h after LPS, and analyzed 24 h after LPSlo. Insets indicate % of cells within the gate. b, Absolute numbers of lung CD45+CD11b+Ly-6G+ neutrophils as in a. c, Eosinophil cell counts in the BALF, assessed 3 days after the second HDM administration in LPSlo-HDM mice treated or not with anti-CXCR2, 2 h before and 4 and 8 h after LPSlo, and 2 h before and 4 h after i.n.sensitization with HDM. d, ELISA measurement of cytokine production by HDM-restimulated BLN cells of mice as in c. e, Inflammatory score estimating perivascular and peribronchial inflammation, quantified from H&E-stained lung sections of mice as in c. f, Representative H&E staining of lung sections of mice as in c. g, Quantification of PAS-stained epithelial cells per bronchi showing airway mucus production in mice as in c. h, Representative PAS staining of lung sections of mice as in c. i, Eosinophil cell counts in the BALF, assessed 3 days after the second HDM administration in mice transferred i.t. with vehicle, LPSlo and LPShi neutrophils and exposed to HDM. j, ELISA measurement of cytokine production by HDM-restimulated BLN cells of mice as in i. k, Inflammatory score estimating perivascular and peribronchial inflammation, quantified from H&E-stained lung sections of mice as in i. l, Representative H&E staining of lung sections of mice as in i. m, Quantification of PAS-stained epithelial cells per bronchi showing airway mucus production in mice as in i. n, Representative PAS staining of lung sections of mice as in i. (b-e,g,i-k,m) Data show mean + s.e.m. and are pooled from (b-e,g) 2 independent experiments, each symbol representing individual mice (n=6/group) or (i-k,m) ≥3 independent experiments, each symbol representing (i,k,m) individual mice (n=9/group) or (j) independent experiments in which cells from 2-3 mice were pooled by group. P values were calculated using using a (b,i-k,m) one-way ANOVA with Tukey's post hoc test, (c) a two-sided unpaired Student's t test or (d-e,g) a two-sided Mann-Whitney test. *P<0.05; **P<0.01; ***P<0.001. ns, not significant. BALF, bronchoalveolar lavage fluid. i.t., intra-tracheal ns, not significant. Scale bar = 32 μm.
To test the contribution of NETs to the initiation of allergic airway inflammation in LPSlo-HDM mice, we targeted the NETs with 4 daily intraperitoneal (i.p.) injections of DNAse, which degrades NETs20,29, starting one day before LPSlo treatment, or with 8 i.p. injections of either the neutrophil elastase inhibitor GW-311616 (NEi)15 or an inhibitor of the arginine deiminase PAD4 (Cl-amidine)30, every 12 h starting one day before LPSlo treatment. Treatments with DNAse, NEi and Cl-amidine resulted in a significant decrease of NET volume in LPSlo mice 24 h post-LPS (Fig. 5a,b). Most features of type 2 allergic airway inflammation, such as airway eosinophilia (Fig. 5c), HDM-specific type 2 immunity (Fig. 5d), peribronchial inflammation (Fig. 5e,f) and increased mucus production (Fig. 5g,h) were significantly reduced in DNAse-, NEi - or Cl-amidine-treated LPSlo-HDM mice compared to vehicle LPSlo-HDM mice, except for LN production of IL-4 and IL-13, which was similar in DNAse- and NEi-treated LPSlo-HDM mice, respectively, compared to vehicle LPSlo-HDM mice (Fig. 5d), and mucus production in NEi-treated LPSlo-HDM mice compared to vehicle LPSlo-HDM mice (Fig. 5g,h). These observations indicate that lung neutrophils and NETs from LPSlo mice were mediating the pro-allergic effects of low-dose LPS on HDM-induced allergic asthma.
Figure 5. NETs mediate low-dose-LPS-triggered type 2 allergic airway inflammation to HDM.

a, Three-dimensional modeling of Cit-H3+MPO+ NETs on lung sections, assessed 24 h after LPSlo in mice treated i.p. with DNAse one day before and at the time of LPSlo treatment, or treated 4 times i.p. with NEi or Cl-amidine, every 12 h starting one day before LPSlo. Pictures are representative of one of 6 lungs analyzed. b, Quantification of NET volume in lung sections of mice as in a. c, Eosinophil cell counts in the BALF, assessed 3 days after the second HDM administration in LPSlo-HDM mice treated i.p. with 4 daily injections of DNAse, starting one day before LPSlo treatment, or treated with 8 i.p. injections of NEi or Cl-amidine, every 12 hours starting one day before LPSlo treatment. d, ELISA measurement of cytokine production by HDM-restimulated BLN cells of mice as in c. e, Inflammatory score estimating perivascular and peribronchial inflammation, quantified from H&E-stained lung sections of mice as in c. f, Representative H&E staining of lung sections of mice as in c. g, Quantification of PAS-stained epithelial cells per bronchi showing airway mucus production in mice as in c. h, Representative PAS staining of lung sections of mice as in c. (b) Data show mean + s.e.m. as well as individual mice (n=6/group). (c-e,g) Data show mean + s.e.m. and are pooled from 3-4 independent experiments, each symbol representing (c,e,g) individual mice (n=9/group) or (d) independent experiments in which cells from 2-3 mice were pooled by group. P values were calculated using a one-way ANOVA with Tukey's post hoc test. *P<0.05; **P<0.01; ***P<0.001. BALF, bronchoalveolar lavage fluid ns, not significant. Scale bars = (a) 10 μm; (f,h) 32 μm.
NETs promote HDM uptake by CD11b+Ly-6C+ DCs
Given the predominant role played by lung DCs in the induction of TH2 responses to HDM31,32, we looked at their ability to take up HDM upon exposure to vehicle, LPSlo or LPShi. Twenty-four h post-LPS, we administered 40 µg fluorescent-labeled AF647-HDM i.n. and the numbers of lung CD45+CD11chiMHC-IIhiHDM+ DCs were quantified 24 h later by flow cytometry. Lungs of LPSlo mice exposed to AF647-HDM had greater numbers of CD11b+Ly-6C+ DCs, and to a lesser extent CD11b+Ly-6C- DCs, that were AF647-HDM+ compared to lungs of vehicle or LPShi mice (Fig. 6a-c). Of note, the numbers of CD11b+Ly-6C+AF647-HDM+ DCs were significantly reduced in DNAse, NEi or Cl-amidine-treated LPSlo-AF647-HDM mice as compared to vehicle LPSlo-AF647-HDM mice (Fig. 6d), suggesting that NETs promoted HDM uptake by CD11b+Ly-6C+ DCs directly or indirectly.
Figure 6. NETs released by LPSlo neutrophils directly promote HDM uptake by CD11b+Ly-6C+ DCs.

a, Representative gating strategy delineating lung DC subsets in vehicle-AF647-HDM, LPSlo-AF647-HDM and LPShi-AF647-HDM mice, assessed 24 h after i.n. AF647-HDM. Lung cells from a LPSlo-AF647-HDM mouse is shown. DCs were defined as CD45+CD3e-CD19-NK1.1-SiglecF-MHC-II+CD11c+ cells and further divided into CD11b-CD103+, CD11b+Ly-6C- and CD11b+Ly-6C+ DCs. b, Absolute numbers of lung AF647-HDM+ DC subsets in mice as in a. c, Representative dot plots showing AF647-HDM MFI in lung CD11b+Ly-6C+ DCs from mice as in a. d, Absolute numbers of lung CD11b+Ly-6C+AF647-HDM+ DCs, assessed 24 h after i.n. AF647-HDM in LPSlo-AF647-HDM mice treated i.p. with 3 daily injections of DNAse, starting one day before LPSlo treatment, or treated with 5 i.p. injections of NEi or Cl-amidine, every 12 h starting one day before LPSlo treatment. e, Representative gating strategy delineating BMDC subsets. BMDCs were defined as MHC-II+CD11c+ cells and further divided into CD11b+Ly-6C- and CD11b+Ly-6C+ subsets. f, MFI of AF647-HDM (left), % of AF647-HDM+ cells (middle), and CD86 expression in CD11b+Ly-6C+ (top) and CD11b+Ly-6C- (bottom) BMDCs, assessed 12 h after treatment with AF647-HDM and after co-culture with vehicle, LPShi or LPSlo neutrophils in the presence or absence of DNAse. (b,d,f) Data show mean + s.e.m. and are pooled from ≥3 independent experiments, each symbol representing (b,d) independent experiments in which cells from 3-5 mice were pooled by group (b,d: n=3,6, respectively) or (f) independent co-culture experiments (BMDCs; BMDCs+AF647-HDM; BMDCs+PBS neutr.+AF647-HDM; BMDCs+LPSlo neutr.+AF647-HDM; BMDCs+LPSlo neutr.+AF647-HDM+DNAse; BMDCs+ LPShi neutr.+AF647-HDM: n=6;9;4;9;6;4, respectively). P values were calculated using (b) a two-way or (d,f) a one-way ANOVA with Tukey's post hoc test. *P<0.05; **P<0.01; ***P<0.001. BMDCs, bone marrow-derived dendritic cells; MFI, mean fluorescence intensity; ns, not significant.
To assess whether LPSlo neutrophils modulated AF647-HDM uptake by CD11b+Ly-6C+ DCs directly, we co-cultured vehicle, LPSlo or LPShi neutrophils with bone-marrow derived DCs (BMDCs), which contained both CD11b+Ly-6C+ and CD11b+Ly-6C- BMDCs (Fig. 6e) and are known to induce type 2 sensitization to HDM when pulsed with HDM and reinjected into recipient animals33. Co-culture of AF647-HDM-treated BMDCs with LPSlo neutrophils increased the uptake of AF647-HDM by CD11b+Ly-6C+ BMDCs, and to a lesser extent by CD11b+Ly-6C- BMDCs as compared to AF647-HDM-treated BMDCs alone (Fig. 6f). Co-culture of AF647-HDM-treated BMDCs with vehicle or LPShi neutrophils promoted a marginal increase in AF647-HDM uptake by CD11b+Ly-6C+ BMDCs compared to AF647-HDM-treated CD11b+Ly-6C+ BMDCs alone, which was significantly lower than that elicited by the co-culture of AF647-HDM-treated BMDCs with LPSlo neutrophils (Fig. 6f). AF647-HDM uptake, especially by CD11b+Ly-6C+ BMDCs, was significantly diminished when DNAse was added to the co-culture of BMDCs with LPSlo neutrophils (Fig. 6f), indicating that the process was dependent on NETs. Co-culture of BMDCs with LPSlo neutrophils, but not with vehicle or LPShi neutrophils, promoted the expression of the pro-TH2 co-stimulatory molecule CD8634,35 on CD11b+Ly-6C+ BMDCs, and this effect was not affected by DNAse treatment (Fig. 6f). Thus, LPSlo neutrophils acted on CD11b+Ly-6C+ DCs directly to promote AF647-HDM uptake through NET-dependent mechanisms.
Other pro-allergic factors promote allergic asthma via NETs
Next, we tested whether NET-prone CXCR4hi neutrophils were associated with additional pro-allergic conditions. Besides low exposure to microbial products, respiratory viral infections6 and air pollution7 also represent risk factors for allergic asthma in humans. In mice, acute respiratory infection with influenza virus36 or exposure to ozone37 promote allergic airway inflammation to HDM or ovalbumin, respectively. BALB/c mice infected i.n. with 5 plaque-forming units (PFU) of influenza A virus H1N1 strain PR8/34 (PR8) had decreased body weight at day 7 (Supplementary Fig. 7a,b), and increased lung viral RNA expression (Supplementary Fig. 7c) and numbers of CD45+CD11bhiLy-6Ghi neutrophils (Supplementary Fig. 7d) between 3 and 7 days after infection. Similarly, BALB/c mice exposed for 3 days to 2 ppm ozone during 3 h also had increased lung neutrophil numbers 24 h after the last exposure (Supplementary Fig. 7e,f). Seven days after PR8 or 24 h after ozone exposure, these neutrophils had increased expression of CXCR4, Lamp-1 and CD49d as compared to neutrophils from uninfected or air-exposed control mice (Fig. 7a-d), suggesting shared phenotypical similarities with LPSlo neutrophils. In addition, CXCR4hi neutrophils were only found in the lung and could not be detected in the blood or BM (Fig. 7e,f), suggesting local imprinting. NETs were also found in the lungs of mice infected with PR8 or exposed to ozone (Fig. 7g-n and Supplementary Fig. 7g-k), suggesting exposure to other pro-allergic factors triggered the accumulation of NET-prone CXCR4hi neutrophils in the lungs.
Figure 7. Influenza virus infection and ozone exposure instruct recruited lung CXCR4hi neutrophils to release NETs.

a,c, Representative histograms of CXCR4, Lamp-1 and CD49d expression by lung CD45+CD11b+Ly-6G+ neutrophils (a) 7 days after influenza virus (PR8) infection or (c) 24 h after 3 daily ozone exposures. b,d, MFI showing quantification of CXCR4, CD49d and Lamp-1 expression by lung CD45+CD11b+Ly-6G+ neutrophils as in a and c, respectively. e,f, Kinetic analysis of CXCR4 expression by bone marrow, blood and lung CD45+CD11b+Ly-6G+ neutrophils after (e) PR8 infection or (f) ozone exposure, as in a. g,k, Levels of extracellular dsDNA in the BALF of (g) PBS-injected and PR8-infected mice, 7 days after PR8, or (k) air- and ozone-exposed mice, 24 h after 3 daily ozone exposures. h,l, ELISA measurement of NE/DNA complexes in the BALF of mice as in g and k, respectively. i,m, Confocal microscopy stainings of Cit-H3+MPO+ NETs on lung sections of mice as in g and k, respectively. Pictures are representative of one of >5 lungs analyzed. j,n, Quantification of NET volume in lung sections of mice as in g and k, respectively. (b,d-i,k-m) Data show mean + s.e.m. and are pooled from (b,d,g-i,k-m) 2-3 independent experiments (b,d,g,h,i,k,l,m: n=6,6,5,5,6,8,5,6) mice/group, respectively), or (e,f) 2 independent experiments per time point analyzed (n=4 mice/time point). P values were calculated using (b,d,g-i,k-m) an unpaired two-tailed Student's t test or (e,f) a one-way ANOVA that compares PR8-infected or ozone-exposed vs. control counterparts. **P<0.01; ***P<0.001. BALF, bronchoalveolar lavage fluid; ns, not significant; OD, optical density. Scale bars = 50 µm.
Next, we instilled PR8-infected mice i.n. with 40 µg HDM 7 days after PR8 and with 10 µg HDM 7 days later (PR8-HDM). To test the contribution of NETs to PR8-triggered allergic asthma, PR8-HDM mice were treated daily for 12 days with DNAse i.p., starting 5 days after PR8. Alternatively, PR8-HDM mice were treated every 12 h with NEi or Cl-amidine i.p. for the same duration as for DNAse. Three days after the HDM challenge, we observed increased susceptibility of PR8-HDM mice to develop airway eosinophilia and HDM-specific IgG1 (Fig. 8a), HDM-specific type 2 immunity (Fig. 8b) and goblet cell hyperplasia (Fig. 8c,d), while administration of HDM without pre-exposure to PR8 did not induce features of allergic asthma, and treatments of PR8-HDM mice with DNAse, NEi and Cl-amidine resulted in a significant decrease of nearly all features of allergic asthma compared to vehicle PR8-HDM mice, except for LN production of IL-13, which was similar in DNAse-treated and vehicle PR8-HDM mice (Fig. 8b). In addition, while we observed higher numbers of lung CD11b+Ly-6C+AF647-HDM+ DCs in PR8-AF647-HDM mice compared to uninfected AF647-HDM-treated controls 24 h after AF647-HDM, these numbers were significantly decreased in DNAse, NEi- and Cl-amidine-treated PR8-AF647-HDM mice compared to vehicle PR8-AF647-HDM controls (Fig. 8e).
Figure 8. NETs mediate influenza virus- and ozone-potentiated type 2 allergic airway inflammation to HDM.

a, Eosinophil cell counts in the BALF (left) and ELISA measurement of HDM-specific IgG1 in the serum (right), assessed 3 days after the second HDM administration in vehicle-HDM and PR8-HDM mice treated daily for 12 days with DNAse i.p., starting 5 days after PR8, or treated every 12 h with NEi or Cl-amidine i.p., for the same duration as for DNAse. b, ELISA measurement of cytokine production by HDM-restimulated BLN cells of mice as in a. c, Quantification of PAS-stained epithelial cells per bronchi showing airway mucus production in mice as in a. d, Representative PAS staining of lung sections of mice as in a. e, Absolute numbers of lung CD11b+Ly-6C+AF647-HDM+ DCs assessed 8 days after PR8 and 24 h after AF647-HDM in vehicle-AF647-HDM and PR8-AF647-HDM mice treated daily for 3 days with DNAse i.p., starting 5 days after PR8, or treated every 12 h with NEi or Cl-amidine i.p., for the same duration as for DNAse. f, Eosinophil cell counts in the BALF (left) and ELISA measurement of HDM-specific IgG1 in the serum (right), assessed 3 days after the second HDM administration in vehicle-HDM and ozone-HDM mice treated daily for 4 days with DNAse i.p., starting the first day of ozone exposure, or treated every 12 h with NEi or Cl-amidine i.p., for the same duration as for DNAse. g, ELISA measurement of cytokine production by HDM-restimulated BLN cells of mice as in f. h, Quantification of PAS-stained epithelial cells per bronchi showing airway mucus production in mice as in f. i, Representative PAS staining of lung sections of mice as in f. j, Absolute numbers of lung CD11b+Ly-6C+AF647-HDM+ DCs assessed 2 days after the last ozone exposure and 24 h after AF647-HDM in mice as in f. (a-c,e,f-h,j) Data show mean + s.e.m. and are pooled from 2-3 independent experiments, each symbol representing (a,c,f,h) individual mice (a,b,e,g,h,k: n=9,9,6,6 mice/group, respectively) or (b,e,g,j) independent experiments in which cells from 2-4 mice were pooled by group. P values were calculated using a one-way ANOVA with Tukey's post hoc test. *P<0.05; **P<0.01; ***P<0.001. BALF, bronchoalveolar lavage fluid; a.u., arbitrary unit; ns, not significant. Scale bar = 32 µm.
We also instilled ozone-exposed mice i.n. with 40 µg HDM 1 day after the last ozone treatment and with 10 µg HDM 7 days later (ozone-HDM). Some ozone-HDM mice mice were also treated daily for 4 days with DNAse i.p., starting the first day of ozone exposure. Alternatively, ozone-HDM mice were treated every 12 h with NEi or Cl-amidine i.p. for the same duration as for DNAse. Three days after the HDM challenge, we observed increased susceptibility of ozone-HDM mice to develop airway eosinophilia and HDM-specific IgG1 (Fig. 8f), HDM-specific type 2 immunity (Fig. 8g), goblet cell hyperplasia (Fig. 8h,i) and peribronchial inflammation (Supplementary Fig. 8), while administration of HDM without pre-exposure to ozone did not induce features of allergic asthma, and treatments of ozone-HDM mice with DNAse, NEi and Cl-amidine resulted in a significant decrease of all the features of allergic asthma tested (Fig. 8f-i and Supplementary Fig. 8). In addition, while we observed higher numbers of lung CD11b+Ly-6C+AF647-HDM+ DCs in ozone-AF647-HDM mice compared to air-exposed AF647-HDM-treated controls 24 h after AF647-HDM, these numbers were significantly decreased in DNAse, NEi- and Cl-amidine-treated ozone-AF647-HDM mice compared to vehicle ozone-AF647-HDM controls (Fig. 8j).
These observations suggested that NETs promoted AF647-HDM uptake by lung CD11b+Ly-6C+ DCs and mediated allergic airway inflammation triggered by flu infection or ozone exposure.
Discussion
Here we showed that neutrophils have an important role in type 2 allergic immunity and link pro-allergic environmental conditions and host allergic susceptibility. We showed that airway exposure to low-dose LPS, influenza virus infection and ozone exposure in mice induced the accumulation of NET-releasing CXCR4hi neutrophils in the lung. These neutrophils promoted the uptake of HDM by lung CD11b+Ly-6C+ DCs and increased susceptibility to allergic asthma.
LPS measurements have been used in epidemiological studies related to the 'hygiene hypothesis', suggesting that an LPS-rich environment is associated with reduced risk of atopy and asthma, while LPS-poor environments represent a risk factor for the development of asthma8,38. The 'hygienic' model used here is an adaptation of a previous model21, in which priming with a low or high dose of LPS biased the immune response to ovalbumin towards a TH2 or TH1 profile, respectively. Here, we found that exposure to a low dose of LPS in BALB/c mice potentiated HDM-induced type 2 allergic asthma, while priming with a higher dose of LPS22 had no substantial effect.
Airway exposure to low-dose LPS in mice triggered NET-releasing CXCR4hi neutrophils in the lung. These neutrophils shared similarities with 'aged' neutrophils, a subset of NET-prone CXCR4hi neutrophils found in the blood25,26. Kinetic analyses of CXCR4 expression on lung, blood and BM neutrophils indicated that neutrophils were recruited to the lung and instructed locally. This indicates that CXCR4hi neutrophils, rather than representing a subset, are in a transient state of activation that depends on a local stimulus (i.e., low-dose LPS). Our data argue in favor of the notion that neutrophils are heterogenous, plastic, and can adapt to context-specific cues to exert particular functions14. We found that these locally instructed CXCR4hi neutrophils represented early and critical players in the initiation of type 2 allergic asthma against HDM allergens. Given the central role of epithelial-derived alarmins, including IL-33, IL-25 and TSLP in the initiation of type 2 allergic immunity39, it would be interesting to test their respective contributions to the imprinting of CXCR4hi neutrophils.
We used DNAse, NEi and Cl-amidine to assess the functional importance of NETs in the initiation of allergic asthma. None of these approaches are fully specific for NETs36. Cl-amidine inhibits the activity of PAD4, which is implicated in chromatin reorganization and is expressed in many cell types. Treatment with Cl-amidine may lead to decreased activity of citrullinated histone proteins rather than NET impairment19. In addition, the biological activity of the inhibitors may not be optimal in the tissue and could be influenced by factors that are inherent to the experimental models used. However, treatment with DNAse, NEi and Cl-amidine impaired NETs and had the same global outcome on the development of HDM-induced asthma, suggesting that NETs could be mediating the onset of allergic airway inflammation to HDM in the models tested here.
Low-dose LPS, influenza virus infection and ozone exposure were associated with an increased uptake of fluorescent-labelled HDM by CD11b+Ly-6C+ DCs, an important step in the initiation of HDM-specific type 2 responses31,32. Allergen uptake was significantly reduced in NET-targeted mice, supporting the idea that NETs can directly or indirectly modulate this process. Ex vivo co-culture experiments with lung neutrophils and BMDCs further indicated that NETs derived from LPSlo neutrophils could directly promote HDM uptake by CD11b+Ly-6C+ DCs. Our study is in accordance with reports that extracellular host DNA, the main NET component, is a potent signal that promotes the activation of DCs and type 2 immune responses20,40.
Whether CXCR4hi neutrophils and NETs can trigger type 2 sensitization against other type 2-inducing stimuli, such as fungal proteases, food allergens, helminths or additional pro-allergic factors, such as other respiratory viruses, exhaust particles, cigarette smoke, in BALB/c or other genetic backgrounds remains unclear17. In humans, neutrophils are important immune-modulating cells in the effector phase of severe asthma, which is characterized by neutrophilic inflammation, high expression of IL-17 and resistance to corticosteroids16–19. Whether particular NET-releasing neutrophils contribute to the initiation of type 2 allergic asthma in humans remains unknown. A prospective Danish study found that the number of respiratory infections in early life, but not the particular viral trigger, was associated with asthma development41. The authors postulated that a host-derived factor might underlie the increased allergic susceptibility41. Our results suggest that the accumulation of NET-prone neutrophils could be such host-associated factor. In addition, blood neutrophils from Hutterite children, who are raised in an environment poor in LPS and are prone to develop allergies, have higher expression of CXCR4 compared to blood neutrophils from Amish children, who live in LPS-rich homes and protected from allergies38. While lung neutrophils have not been assessed in these children, it is tempting to speculate that environmental risk factors may promote allergic airway sensitization in humans by inducing NET-prone CXCR4hi neutrophils, which increase host susceptibility to mount type 2 allergic responses towards aeroallergens.
Methods
Mice
Female BALB/c mice were purchased from Janvier Laboratories. Age-matched, 6- to 10-week-old mice were used for experiments. Mice were housed under specific pathogen free (SPF) conditions and maintained in a 12-h light-dark cycle with food and water ad libitum. All animal experiments described in this study were reviewed and approved by the Institutional Animal Care and Use Committee of the University of Liège. The “Guide for the Care and Use of Laboratory Animals”, prepared by the Institute of Laboratory Animal Resources, National Research Council, and published by the National Academy Press, as well as European and local legislations, were followed carefully.
Reagents and antibodies
2.4G2 Fc receptor blocking antibodies were produced in house. Anti-mouse FITC- and V500-conjugated anti-CD45.2 (clone 104), PE-conjugated anti-CD3 (clone 142-2C11), PE-conjugated anti-CD19 (clone 1D3), PE-conjugated anti-NK1.1 (clone pk136), PE-conjugated anti-SiglecF (clone E50-2440), PE-conjugated anti-Ly-6G (clone RB6-8C5), eFluor450- and PE-Cy7-conjugated anti-CD11b (clone M1/70), PE-Cy7-conjugated anti-Ly-6G (clone 1A8), APC-Cy7-conjugated anti-CD11c (clone HL3), PE-CF594-conjugated anti-Ly-6C (clone 49-44), FITC-conjugated anti-CD103 (clone M290), PE-conjugated anti-Lamp-1 (CD107a) (clone 1D4B) and PE-conjugated streptavidin antibodies were purchased from BD biosciences. Anti-mouse PE-conjugated anti-CXCR4 (clone 2B11), anti-mouse PE-conjugated anti-CD49d (clone R1-2) and anti-mouse anti-CD86 biotin (clone GL-1) antibodies were purchased from eBioscience. Anti-mouse PerCP-Cy5.5-conjugated anti-MHC-II (Ia-Ie) (clone M5/M4,15,2) and BV421-conjugated anti-CD64 (clone X54-5/7.1) antibodies were purchased from Biolegend.
Unconjugated goat anti-mouse myeloperoxidase (MPO) (cat. AF3667) antibodies were purchased from R&D systems, unconjugated rabbit anti-mouse anti-citrullinated H3 (cat. Ab5103) antibodies were purchased from Abcam. Donkey anti-rabbit and anti-goat IgG antibodies conjugated with AlexaFluor568 and AlexaFluor488, respectively, were purchased from ThermoFisher.
Anti-mouse HSP90α, goat anti-rabbit immunoglobulins/HRP and rabbit anti-mouse immunoglobulins/HRP were purchased from Agilent.
Additional reagents can be found in the sections below.
Model of low-dose-LPS-triggered allergic asthma to HDM
Isoflurane-anesthetized BALB/c wild-type mice were instilled i.n. with different doses of LPS ranging from 0.1 ng to 10 µg, two of which being chosen as low (100 ng) or high (10 µg) doses (LPS from Escherichia coli O55:B5, Sigma-aldrich). Vehicle mice were instilled i.n. with 50 µl PBS. One day later (Day 1), mice were administered i.n. with 40 µg HDM (HDM pteronyssinus, Greer Laboratories) in 50 µl PBS. Seven days later (Day 8), all mice were challenged by i.n. instillation of 10 µg HDM in 50 µl PBS. Three days after the HDM challenge (Day 11), we estimated bronchial hyperresponsiveness to methacholine by assessing dynamic airway resistance in anesthetized animals subjected to increased doses of methacholine with a FlexiVent small animal ventilator (SCIREQ) system42. Animals were then sacrificed and features of allergic airway inflammation were assessed. BALF cytology and lung histology were performed as described42. The extent of perivascular and peribronchial inflammation was estimated by a score calculated by means of quantification of inflammatory cells in lung sections stained with hematoxylin and eosin43. Briefly, score 0 was assigned to bronchi with no surrounding leukocyte infiltration; score 1 corresponded to few infiltrating leukocytes; scores 2 or 3 were assigned if there were from 1 to 2, or 3 to 5 layer(s) of perivascular and/or peribronchial leukocytes, respectively. Mucus production was quantified as the percentage of Periodic Acid Schiff (PAS)–stained goblet cells per total epithelial cells in randomly selected bronchi. Bronchial lymph node (BLN) cells were collected, pooled from 2-5 mice (Figs. 1c, 4j, 5d, 8b,g) and cultured in complete RPMI medium with or without HDM restimulation (30 μg/ml). Culture supernatants were assessed for cytokine production (IL-4, IL-5, IL-13, IFN-γ) by ELISA (eBiosciences).
Cell isolation, staining and flow cytometry
To obtain single-lung-cell suspensions, lungs were perfused with 10 ml of PBS through the right ventricle, cut into small pieces, and digested for 1 h at 37°C in HBSS containing 1 mg/ml collagenase A (Roche) and 0.05 mg/ml DNase I (Roche). Blood was collected in an EDTA-containing tube (100 mM), and red blood cells were lysed with RBC lysis buffer (eBioscience). BM cells were isolated by flushing femurs with PBS. Cells were filtered through a 70μM cell strainer to obtain single cell suspensions.
Cell phenotyping and sorting were performed on a FACSCANTO II and a FACSARIA III (BD Biosciences), respectively. Staining reactions were performed at 4°C with 2% v/v/ of Fc block (BD Pharmingen) to reduce non-specific binding. Anti-mouse Lamp-1 intracellular staining was performed using the Foxp3/Transcription factor Staining Buffer Set from eBiosciences.
FSC-W and FSC-A discrimination was used to exclude doublet cells, and ViaProbe (7-AAD) cell viability solution (BD Biosciences) was used to discriminate between dead and living cells. BM, blood and lung neutrophils were identified as SSChiCD45+CD11bhiLy-6Ghi cells. Neutrophil Mean Fluorescence Intensity (MFI) of specific markers was quantified using FlowJo. Results were analyzed using FlowJo (Tree Star, Ashland, USA).
For scRNA-seq, adoptive transfer and co-culture experiments, single-lung-cell suspensions were obtained from lungs of vehicle, LPSlo and LPShi mice 24 h after treatment. Neutrophils were first enriched by negative selection using a magnetic-activated cell sorting (MACS, Neutrophil Isolation kit, Miltenyi Biotec) and then sorted as CD45+ cells using nozzle 100 at 3000 events/second (see Supplementary Fig. 2b,c). Trypan blue-treated cells were examined under the microscope for counting and viability testing. Viability was above 95% for all three samples. Cell preparations were centrifuged at 300g for 5 min. For scRNA-seq, neutrophils were isolated from lung single-cell suspensions pooled from 3 BALB/c female wild-type mice per condition, and were resuspended in calcium- and magnesium-free PBS containing 400µg/ml bovine serum albumin (BSA, Sigma-Aldrich).
For cytologic examination and immunofluorescence ex vivo, CD45+CD11bhiLy-6GhiCD49dlo neutrophils from vehicle and LPShi mice and CD45+CD11bhiLy-6GhiCD49dhi neutrophils from LPSlo mice were FACS-sorted 24 h after LPS.
ScRNA-seq: library construction using 10X Genomics® platform
Cellular suspensions were loaded on the Chromium™ Controller (10x Genomics, Pleasanton, CA, USA) in order to generate Gel Bead-In-EMulsions (GEMs). Barcoded sequencing libraries were generated by using the Chromium™ Single Cell 3’ Reagent Kits v2 (10x Genomics, Pleasanton, CA, USA) following manufacturer’s instructions. Sequencing libraries were loaded at 1.4 pM on an Illumina NextSeq500 with NextSeq 500/550 Mid Output v2 kit (150 cycles) (Illumina, CA, USA) using the following read lengths: 26 bp for Read1 (16 bp Barcode + 10 bp Randomer), 8 bp for Sample Index and 58 bp for Read2.
Analysis scRNA-seq samples
Cell Ranger software (v1.2.0) (10x Genomics) was used to demultiplex Illumina BCL files to FASTQ files (cellranger mkfastq), to perform alignment (to mouse GRCm38/mm10 genome), filtering, UMI counting and to produce gene – barcode matrices (cellranger count).
Subsequent analysis used R bioconductor44 (version 3.4.2.), and the R package Seurat45 (version 2.1.0). We first performed a quality control analysis and selected cells for further analysis (see Supplementary Fig. 2d,e). Gene counts were normalized and highly variable genes were calculated. Cell-cell variation in the number of detected UMI was regressed out using the ScaleData function. Linear dimensional reduction was performed on the scaled data using the 'RunPCA' function. To identify the number of statistically significant principal components (PCs) to include for subsequent analyses, we used the 'JackStraw' function, which implements a resampling test inspired by the jackStraw procedure45. PC 1:11 were used in the subsequent analyses. We have also performed analyses including lower and higher numbers of PCs (1:8 to 1:13) and did not find any substantial change in the results obtained. Cells were clustered via the 'FindClusters' function. Several cluster resolutions were tested, and the resolution of 0.25 was chosen, since higher resolutions created additional subdivisions or clusters containing singlets, which were considered not relevant. To visualize the data, non-linear dimensional reduction was used, and tSNE plots were created by using the 'RunTSNE' function, with the number of dimensions to use set to 11 (PC 1:11). The aforementioned analyses were performed on the individual Seurat objects (encompassing data from vehicle, LPSlo and LPShi mice) but also on a merged Seurat object that encompassed merged data from vehicle, LPSlo and LPShi mice. Differential expression (DE) analysis between clusters was performed using the 'FindMarkers' functionA value of 0.25 was attributed to the min.pct argument, which requires a gene to be detected at least in 25% in either of the two groups of cells. Only DE genes with an adjusted P value <10-3 were retained. To define the transcriptomic signature of steady-state neutrophils (cluster 0) (see Supplementary Fig. 3c,d), lists of the significantly upregulated genes in cluster 0 compared to cluster 1 (i.e. LPSlo-induced), cluster 0 compared to clusters 2,3,5 (i.e. LPShi-induced), and cluster 0 compared to cluster 4 were generated, and genes commonly found in each of the 3 lists were retained. To define the common 'LPS signature' (see Supplementary Fig. 3e,f), lists of the significantly upregulated genes in cluster 1 compared to cluster 0, clusters 2,3,5 compared to 0, and cluster 4 compared to cluster 0 were generated, and genes commonly found in each of the 3 lists were retained. To define cluster-specific gene signatures, only genes that did not belong to the common LPS signature and that were significantly upregulated in that specific cluster as compared to each of the others were retained. Statistical enrichment tests for Gene Ontology (GO) biological processes were performed with PANTHER 13.1 using specific gene set for each cluster with a P value <10-3 and minimal detection in 25% of cells with all gene contained in gene ontology Mus Musculus database as reference.
Neutrophil cytologic examination
Cytologic examination of FACS-sorted neutrophils was performed on cytospin preparations stained with Hemacolor (Merck KgaA). Sections were examined with a FSX100 microscope (Olympus). Quantifications of neutrophil size and cytoplasm/nucleus ratio were performed using the ImageJ software.
Immunofluorescence
To assess the ability of neutrophils to form NETs ex vivo, 2.5 x 10⁵ FACS-sorted neutrophils were seeded and cultured ex vivo on slides (Nunc® Lab-Tek® II Chamber Slide™ system, Sigma) pre-coated with poly-D-lysin hydrobromide (Sigma) for 24 h in supplemented D-MEM medium (Gibco). Supernatants were removed and chambers were rinsed with PBS. Slides were then fixed with paraformaldehyde 10%, rinsed twice with PBS and permeabilized in PBS 0.5% triton X-100. Slides were then blocked and stained as described below.
To identify NETs from lung tissues, lungs were collected without performing BALF and fixed with 4% paraformaldehyde in PBS. Lung tissues were paraffin-embedded and lung sections were cut (2-μm-thick sections) for immunofluorescence staining. After deparaffinization and rehydration, tissue sections were boiled for 20 min in 10-mM sodium carbonate buffer for antigen retrieval. Lung sections were permeabilized in PBS 0.5% triton X-100.
Samples were incubated with a blocking buffer (PBS with 2% BSA and 2% of donkey serum [Sigma-Aldrich]) for 1 h at room temperature (RT) and stained in blocking buffer with rabbit anti-mouse antibodies directed against citrullinated histone H3 (1:100 in blocking buffer) and with goat anti-mouse antibodies directed against myeloperoxidase (MPO) (1:40 in blocking buffer) during 1 h at RT. After washing samples with PBS, secondary donkey anti-rabbit IgG antibodies conjugated with AlexaFluor568 (1:200 in blocking buffer) and donkey anti-goat IgG antibodies conjugated with AlexaFluor488 (1:200 in blocking buffer) were added in blocking buffer containing DAPI (1:1000) and incubated for 2 h in the dark at RT. Finally, samples were mounted with 10 μl of ProLong Antifade reagent (ThermoFisher) on glass slides and stored at RT in the dark overnight.
All samples were analyzed by fluorescence microscopy using standard filter sets. Controls were stained with secondary antibody only, and nonspecific fluorescent staining was not detected when secondary antibodies were tested alone. Images were acquired on a Zeiss LSM 880 Airyscan Elyra S.1. confocal microscope (Zeiss) and processed using the ImageJ software. To quantify the volume of NETs released by neutrophils ex vivo (see Supplementary Fig. 4g) or present in the lung tissue (see Figs. 3j,k; 5a,b; 7i,m; Supplementary Figs. 5g; 6b; 7j), Z stack pictures were acquired and Imaris software was used. Briefly, we performed a three-dimensional (3D) reconstruction of structures staining double positive for H3-Cit (red) and MPO (green), and Imaris provided quantification of the volume of these structures, expressed as mm3 per 102 neutrophils for ex vivo experiments (counted under the bright-field microscope and staining positive for intracellular MPO associated with the granules) or per 102 mm3 of lung tissue.
DsDNA measurement in BALF
DsDNA was measured in the acellular fraction of the BALF, which was obtained after a double centrifugation and supernatant collection. Levels of dsDNA were determined using Quant-iT PicoGreen dsDNA reagent (Invitrogen, Carlsbad, CA) according to the manufacturer's protocol.
Western blotting
Lung tissues were homogenized in RIPA buffer supplemented with a cocktail of protease inhibitors (Complete, Roche). An equivalent amount of protein per sample was resolved on a 4-20% gel (Mini-PROTEAN® TGX™ Precast Gels, biorad) and electroblotted on Invitrolon PVDF membranes (Life technologies). Membranes were blocked 1 h at RT in TBS-Tween 0.1% containing 5% of dry milk and incubated overnight at 4°C with primary antibody anti-citrullinated H3 (1:1000 in TBS-tween 0.1% and BSA 5%). The membranes were then incubated 2 h at RT with appropriate HRP-associated secondary antibodies in TBS-tween 0.1% containing 5% BSA. Equal loading was confirmed by probing for HSP90α.
Measurement of NE/DNA complexes in BALF
Nunc plates (ThermoFisher) were coated overnight with anti-NE antibodies (1/2000, Abcam, ab21595) and washed 3 times with PBS-Tween 0.05%. Plates were blocked 1 h at RT with PBS-BSA 1% and washed 3 times. Samples were then loaded for 2 h at RT and plates were then washed 5 times. Mouse anti-dsDNA antibodies were added for 1 h at RT followed, after 5 washes, by incubation with biotinylated rat anti-mouse IgG polyclonal antibodies for 90 min at RT. After extensive washing, secondary streptavidin-HRP (BD pharmingen, cat.554066) was added for 30 minutes at RT, followed by 5 washes. The relative amount of NE/DNA complexes was revealed using TMB substrate solution (Sigma-Aldrich).
Antibody-mediated neutrophil in vivo depletion
Neutrophils were depleted by i.p. injection of 500 µg of anti-Ly-6G antibody (InVivo Plus anti-mouse Ly-6G, clone 1A8, Bioxcell) intraperitoneally (i.p.) one day before (day -1), at day 0 and one day after LPS exposure (day 1) (see Supplementary Fig. 5a). Mice were sacrificed 3 h later.
Inhibition of LPS-induced lung neutrophil recruitment
To inhibit LPS-induced lung neutrophil recruitment46, an antagonist of the chemokine receptor CXCR2 (i.e., Sch52712347, MedChem Express) was given orally, by gavage, at the dose of 3mg/kg, 2 h before, 4 h after and 8 h after LPS treatment, as well as 2 h before and 4 h after i.n. administration of 40 µg HDM. Seven days later, mice were challenged with 10 µg HDM and features of allergic airway inflammation were assessed 3 days later.
Neutrophil adoptive transfers
After MACS enrichment and FACS sorting, neutrophils were resuspended in calcium- and magnesium-free PBS at the concentration of 2.107 cells/ml. Five hundred thousand (5 x 10⁵) cells, together with 40 µg HDM, were injected intratracheally to naive mice in 50 µl PBS. Seven days later, mice were challenged with 10 µg HDM and features of allergic airway inflammation were assessed 3 days later.
Degradation of NETs and inhibition of NET formation in vivo
The formation of NETs was prevented in vivo by i.p. injection of NEi (GW-311616 hydrochloride, Axon Medchem) (2.5µg/g in 200 µl PBS) or of Cl-amidine (10x stock solution in DMSO, Sanbio) (10mg/kg in 200 µl 1% DMSO v/v in PBS), twice daily from day -1 to day +2 (LPS model) or from day 5 to day 17 (PR8 infection model), or from day 0 to day 3 (ozone model). Alternatively, NETs were degraded by injecting 1000 I.U DNAse I (Sigma-Aldrich) i.p. in 200 µl HBSS once daily from day -1 to day +2 (model of LPS exposure) or from day 5 to day 17 (PR8 infection model) or from day 0 to day 3 (ozone model). In pilot experiments, we compared the responses of LPSlo/HDM, PR8/HDM or ozone/HDM mice with their vehicle-treated counterparts (either HBSS, PBS or 1% DMSO v/v, used separately) and confirmed that vehicle did not affect the response. In subsequent experiments, vehicle LPSlo/HDM, PR8/HDM or ozone/HDM mice were treated randomly with either HBSS, PBS or DMSO 1% v/v.
AF647-HDM uptake by lung DC subsets
To assess HDM uptake by lung DCs, LPSlo or ozone-exposed mice were administered i.n. with 40 µg of HDM labelled with Alexafluor-647 (AF647-HDM) (Alexa Fluor™ 647 Protein Labeling Kit, ThermoFisher) 24 h after treatment. Alternatively, PR8-infected mice were injected i.n. with AF647-HDM at day 7 post-infection. Twenty-four h later, lung-single-cell suspensions were obtained and lung dendritic cells (DCs) were selected as CD45+CD3e-CD19-SiglecF-Ly-6G-NK1.1-MHC-II+CD11c+ cells and were then subdivided into CD11b-CD103+, CD11b+Ly-6C- and CD11b+Ly-6C+ subsets by flow cytometry (see Fig. 6a). Alternatively, mice were also treated with NEi, Cl-amidine or DNAse as described above.
Neutrophils/BMDCs co-culture experiments
To generate BMDCs, BM cells were isolated from naive BALB/c mice and were grown for 7 days in GM-CSF-containing medium, as described48. Vehicle, LPSlo and LPShi neutrophils were isolated 24 h after treatment. Two hundred fifty thousand (2.5 x 10⁵) neutrophils were seeded into 48 wells plates previously coated with poly-D-lysin hydrobromide (Sigma) in supplemented D-MEM medium (Gibco) and allowed to adhere for 2 h. BMDCs were then added to neutrophil cultures at a ratio of 1:1. Finally, AF647-HDM (500 ng/ml) and DNAse I (400 I.U./ml, Sigma-Aldrich) were added to the culture. Twelve h later, cells were collected, washed, resuspended in FACS medium and stained for flow cytometry analysis.
Influenza A virus infection protocol
Influenza A virus strain A/PR8/34 (H1N1) was kindly provided by F. Trottein (Institut Pasteur, Lille, France). The viral stock suspension (108 PFU/ml) was diluted and 5 PFU were administered i.n. to isoflurane-anesthetized mice in 50 µl PBS.
Assessment of viral mRNA expression
Lung apical lobes were excised and total mRNA was isolated from homogenized tissue according to the Immgen protocol (www.immgen.org). cDNA was obtained using RevertAid First Strand cDNA Synthesis Kit (ThermoFisher Scientific) and qPCR was performed in duplicate using iTaq Universal SYBR geen supermix (Biorad) and ABI 7900HT Fast Real-Time PCR System (Applied Biosystems). Primer sequences were as followed: 5’-TTCACCATTGCCTTCTCTTC-3’ and 5’-CCCATTCTCATTACTGCTTC-3’ for viral NS1, 5’-AGCCCAGTGTTACCACCAAG-3’ and 5’-ACCCAAGAACAAGCACAAGG-3’ for housekeeping gene Ubc, 5’-TGGCAAAGTGGAGATTGTTGCC-3’ and 5’-AAGATGGTGATGGGCTTCCCG-3’ for housekeeping gene Gapdh, 5’-CATGGCTCGCTCGGTGACC-3’ and 5’- AATGTGAGGCGGGTGGAACTG-3’ for housekeeping gene B2m. Expression levels of NS1 were normalized relative to the three control genes (Ubc, B2m and Gapdh).
Model of PR8-triggered allergic asthma to HDM
Seven days post-infection, mice were administered i.n. with 40 µg HDM. Seven days later (Day 7), all mice were challenged by i.n. instillation of 10 µg HDM. Three days after the challenge, animals were sacrificed and features of allergic airway inflammation were assessed, as described above. In addition, levels of HDM-specific IgG1 were quantified, as described49.
Model of ozone-triggered allergic asthma to HDM
Naive mice were exposed for 3 consecutive days to 2 ppm ozone during 3 h. Twenty-four h after the last ozone exposure, mice were administered i.n. with 40 µg HDM. Seven days later, mice were challenged with 10 µg HDM and features of allergic airway inflammation were assessed 3 days later as described above.
Statistical analysis
Respect of the assumptions of normal distribution of residuals and homoscedasticity was verified, and data were presented as mean + s.e.m., as well as individual values, unless otherwise indicated. Data from independent experiments were pooled for analysis in each data panel, unless otherwise indicated. Statistical analyses were performed using Prism 6 (GraphPad Software). We considered a P-value lower than 0.05 as significant. */°, P<0.05; **/°°, P<0.01, ***/°°°, P<0.001; ns, not significant.
Supplementary Material
Acknowledgements
We thank F. Trottein (Pasteur Institute, Lille, France) for providing us with the Influenza A virus H1N1 PR8/34 strain; S. Ormenese, R. Stefan, J.-J. Goval and A. Hego from the GIGA Flow Cytometry and Cell Imaging Platform; P. Drion and all staff members from the GIGA Mouse facility and Transgenics Platform; C. Humblet and staff members from the GIGA Immunohistology Platform; B. Charloteaux, M. Deckers, L. Karim and members from the GIGA Genomics Platform; C. Desmet and D. Pirottin for insightful discussions; and C. François, R. Fares and I. Sbai for their excellent technical and administrative support. C.R. and C.S. were research fellows of the F.R.S-FNRS; S.L.J. was supported by a Chair from Asthma UK (number CH11SJ, to S.L.J.) and Medical Research Council Centre grant (number G1000758, to S.L.J.); F.B. is supported by the F.R.S.-FNRS for the FRFS-WELBIO (grant CR-2012S-01R to F.B.) and by an Excellence Of Science (EOS) grant. T.M. is a Research Associate of the F.R.S.-FNRS and is supported by an “Incentive Grant for Scientific Research” of the F.R.S.-FNRS (grant F.4508.18 to T.M.), by the FRFS-WELBIO (grant CR-2017s-04 to T.M.), by the Acteria Foundation and by an ERC Starting Grant (grant ERC-StG-2018 IM-ID 801823 to T.M.).
Footnotes
Reporting summary
Further information on research design is available in the Life Sciences Reporting Summary linked to this article.
Author Contributions
C.R., T.M. and F.B. conceived the project. T.M., F.B., M.T., C.R. and C.S. were involved in experimental design. C.R. and C.S. realized most experiments, compiled the data and contributed equally to this work. P.M., C.Ru. and J.S. were involved in (bone marrow-derived) dendritic cell-related experiments. M.T. and S.L.J. were involved in experiments aiming at detecting and inhibiting NETs. C.V., F.P., N.R. and D.C. contributed to experiments involving ozone exposure and invasive measurements of airway function. T.M. analysed single cell RNA sequencing data with the help of the GIGA Genomics Platform. C.R. and T.M. prepared the figures, and T.M. wrote the manuscript. All authors provided feedback on the manuscript.
Competing financial interests
The authors declare no competing financial interests.
Data Availability
The scRNA-seq data provided in this manuscript have been deposited in the ArrayExpress database at EMBL-EBI (https://www.ebi.ac.uk/arrayexpress/experiments/E-MTAB-6902) under accession number E-MTAB-6902. The figures that have associated scRNA-seq data are the following: Fig. 2, Supplementary Figs. 2,3. The source data underlying Figs 1a-d and f; 2d; 3b,c,f,g,i,k; 4b-e, g, i-k and m; 5b-e and g; 6b, d and f; 7 b-i and k-m; 8a-c,e and f-h and j and Supplementary Figs 1b,d; 4c,d; 5 b,c and e,g; 6b, 7b-d,f,g,i,j; 8a are provided as a Source Data file. Any data that support the findings of this study are available from the corresponding authors upon request.
References
- 1.Braman SS. The global burden of asthma. Chest. 2006;130:4s–12s. doi: 10.1378/chest.130.1_suppl.4S. [DOI] [PubMed] [Google Scholar]
- 2.Galli SJ, Tsai M, Piliponsky AM. The development of allergic inflammation. Nature. 2008;454:445–54. doi: 10.1038/nature07204. [DOI] [PMC free article] [PubMed] [Google Scholar]
- 3.Vercelli D. Discovering susceptibility genes for asthma and allergy. Nat Rev Immunol. 2008;8:169–82. doi: 10.1038/nri2257. [DOI] [PubMed] [Google Scholar]
- 4.Eder W, Ege MJ, von Mutius E. The asthma epidemic. N Engl J Med. 2006;355:2226–35. doi: 10.1056/NEJMra054308. [DOI] [PubMed] [Google Scholar]
- 5.Platts-Mills TA. The allergy epidemics: 1870-2010. J Allergy Clin Immunol. 2015;136:3–13. doi: 10.1016/j.jaci.2015.03.048. [DOI] [PMC free article] [PubMed] [Google Scholar]
- 6.Busse WW, Lemanske RF, Jr, Gern JE. Role of viral respiratory infections in asthma and asthma exacerbations. Lancet. 2010;376:826–34. doi: 10.1016/S0140-6736(10)61380-3. [DOI] [PMC free article] [PubMed] [Google Scholar]
- 7.Peden DB. The epidemiology and genetics of asthma risk associated with air pollution. J Allergy Clin Immunol. 2005;115:213–9. doi: 10.1016/j.jaci.2004.12.003. quiz 220. [DOI] [PubMed] [Google Scholar]
- 8.Braun-Fahrlander C, et al. Environmental exposure to endotoxin and its relation to asthma in school-age children. N Engl J Med. 2002;347:869–77. doi: 10.1056/NEJMoa020057. [DOI] [PubMed] [Google Scholar]
- 9.Strachan DP. Family size, infection and atopy: the first decade of the ‘hygiene hypothesis’. Thorax. 2000;55(Suppl 1):S2–10. doi: 10.1136/thorax.55.suppl_1.s2. [DOI] [PMC free article] [PubMed] [Google Scholar]
- 10.Lloyd CM, Snelgrove RJ. Type 2 immunity: Expanding our view. Sci Immunol. 2018;3 doi: 10.1126/sciimmunol.aat1604. [DOI] [PubMed] [Google Scholar]
- 11.Lambrecht BN, Hammad H. The immunology of asthma. Nat Immunol. 2015;16:45–56. doi: 10.1038/ni.3049. [DOI] [PubMed] [Google Scholar]
- 12.Gregory LG, Lloyd CM. Orchestrating house dust mite-associated allergy in the lung. Trends Immunol. 2011;32:402–11. doi: 10.1016/j.it.2011.06.006. [DOI] [PMC free article] [PubMed] [Google Scholar]
- 13.Locksley RM. Asthma and allergic inflammation. Cell. 2010;140:777–83. doi: 10.1016/j.cell.2010.03.004. [DOI] [PMC free article] [PubMed] [Google Scholar]
- 14.Ng LG, Ostuni R, Hidalgo A. Heterogeneity of neutrophils. Nat Rev Immunol. 2019;19:255–265. doi: 10.1038/s41577-019-0141-8. [DOI] [PubMed] [Google Scholar]
- 15.Papayannopoulos V. Neutrophil extracellular traps in immunity and disease. Nat Rev Immunol. 2018;18:134–147. doi: 10.1038/nri.2017.105. [DOI] [PubMed] [Google Scholar]
- 16.Krishnamoorthy N, et al. Neutrophil cytoplasts induce TH17 differentiation and skew inflammation toward neutrophilia in severe asthma. Sci Immunol. 2018;3 doi: 10.1126/sciimmunol.aao4747. [DOI] [PMC free article] [PubMed] [Google Scholar]
- 17.Radermecker C, Louis R, Bureau F, Marichal T. Role of neutrophils in allergic asthma. Curr Opin Immunol. 2018;54:28–34. doi: 10.1016/j.coi.2018.05.006. [DOI] [PubMed] [Google Scholar]
- 18.Wang YH, Wills-Karp M. The potential role of interleukin-17 in severe asthma. Curr Allergy Asthma Rep. 2011;11:388–94. doi: 10.1007/s11882-011-0210-y. [DOI] [PMC free article] [PubMed] [Google Scholar]
- 19.Lachowicz-Scroggins ME, et al. Extracellular DNA, Neutrophil Extracellular Traps, and Inflammasome Activation in Severe Asthma. Am J Respir Crit Care Med. 2019;199:1076–1085. doi: 10.1164/rccm.201810-1869OC. [DOI] [PMC free article] [PubMed] [Google Scholar]
- 20.Toussaint M, et al. Host DNA released by NETosis promotes rhinovirus-induced type-2 allergic asthma exacerbation. Nat Med. 2017;23:681–691. doi: 10.1038/nm.4332. [DOI] [PMC free article] [PubMed] [Google Scholar]
- 21.Eisenbarth SC, et al. Lipopolysaccharide-enhanced, toll-like receptor 4-dependent T helper cell type 2 responses to inhaled antigen. J Exp Med. 2002;196:1645–51. doi: 10.1084/jem.20021340. [DOI] [PMC free article] [PubMed] [Google Scholar]
- 22.Schuijs MJ, et al. Farm dust and endotoxin protect against allergy through A20 induction in lung epithelial cells. Science. 2015;349:1106–10. doi: 10.1126/science.aac6623. [DOI] [PubMed] [Google Scholar]
- 23.Zheng GX, et al. Massively parallel digital transcriptional profiling of single cells. Nat Commun. 2017;8 doi: 10.1038/ncomms14049. 14049. [DOI] [PMC free article] [PubMed] [Google Scholar]
- 24.Remijsen Q, et al. Neutrophil extracellular trap cell death requires both autophagy and superoxide generation. Cell Res. 2011;21:290–304. doi: 10.1038/cr.2010.150. [DOI] [PMC free article] [PubMed] [Google Scholar]
- 25.Adrover JM, Nicolas-Avila JA, Hidalgo A. Aging: A Temporal Dimension for Neutrophils. Trends Immunol. 2016;37:334–45. doi: 10.1016/j.it.2016.03.005. [DOI] [PubMed] [Google Scholar]
- 26.Casanova-Acebes M, et al. Rhythmic modulation of the hematopoietic niche through neutrophil clearance. Cell. 2013;153:1025–35. doi: 10.1016/j.cell.2013.04.040. [DOI] [PMC free article] [PubMed] [Google Scholar]
- 27.Dwyer MP, et al. Discovery of 2-hydroxy-N,N-dimethyl-3-{2-[[(R)-1-(5- methylfuran-2-yl)propyl]amino]-3,4-dioxocyclobut-1-enylamino}benzamide (SCH 527123): a potent, orally bioavailable CXCR2/CXCR1 receptor antagonist. J Med Chem. 2006;49:7603–6. doi: 10.1021/jm0609622. [DOI] [PubMed] [Google Scholar]
- 28.Reutershan J, et al. Critical role of endothelial CXCR2 in LPS-induced neutrophil migration into the lung. J Clin Invest. 2006;116:695–702. doi: 10.1172/JCI27009. [DOI] [PMC free article] [PubMed] [Google Scholar]
- 29.Cools-Lartigue J, et al. Neutrophil extracellular traps sequester circulating tumor cells and promote metastasis. J Clin Invest. 2013 doi: 10.1172/JCI67484. [DOI] [PMC free article] [PubMed] [Google Scholar]
- 30.Wang Y, et al. Histone hypercitrullination mediates chromatin decondensation and neutrophil extracellular trap formation. J Cell Biol. 2009;184:205–13. doi: 10.1083/jcb.200806072. [DOI] [PMC free article] [PubMed] [Google Scholar]
- 31.Mesnil C, et al. Resident CD11b(+)Ly6C(-) lung dendritic cells are responsible for allergic airway sensitization to house dust mite in mice. PloS one. 2012;7:e53242. doi: 10.1371/journal.pone.0053242. [DOI] [PMC free article] [PubMed] [Google Scholar]
- 32.Plantinga M, et al. Conventional and monocyte-derived CD11b(+) dendritic cells initiate and maintain T helper 2 cell-mediated immunity to house dust mite allergen. Immunity. 2013;38:322–35. doi: 10.1016/j.immuni.2012.10.016. [DOI] [PubMed] [Google Scholar]
- 33.Marichal T, et al. Interferon response factor 3 is essential for house dust mite-induced airway allergy. J Allergy Clin Immunol. 2010;126:836–844 e13. doi: 10.1016/j.jaci.2010.06.009. [DOI] [PubMed] [Google Scholar]
- 34.Larché M, et al. Costimulation through CD86 is involved in airway antigen-presenting cell and T cell responses to allergen in atopic asthmatics. J Immunol. 1998;161:6375–6382. [PubMed] [Google Scholar]
- 35.Janss T, et al. Interferon response factor-3 promotes the pro-Th2 activity of mouse lung CD11b+ conventional dendritic cells in response to house dust mite allergens. Eur J Immunol. 2016;46:2614–2628. doi: 10.1002/eji.201646513. [DOI] [PubMed] [Google Scholar]
- 36.Al-Garawi AA, et al. Acute, but not resolved, influenza A infection enhances susceptibility to house dust mite-induced allergic disease. J Immunol. 2009;182:3095–104. doi: 10.4049/jimmunol.0802837. [DOI] [PubMed] [Google Scholar]
- 37.Hollingsworth JW, et al. Ozone activates pulmonary dendritic cells and promotes allergic sensitization through a Toll-like receptor 4-dependent mechanism. J Allergy Clin Immunol. 2010;125:1167–70. doi: 10.1016/j.jaci.2010.03.001. [DOI] [PMC free article] [PubMed] [Google Scholar]
- 38.Stein MM, et al. Innate Immunity and Asthma Risk in Amish and Hutterite Farm Children. N Engl J Med. 2016;375:411–421. doi: 10.1056/NEJMoa1508749. [DOI] [PMC free article] [PubMed] [Google Scholar]
- 39.Roan F, Obata-Ninomiya K, Ziegler SF. Epithelial cell-derived cytokines: more than just signaling the alarm. J Clin Invest. 2019;129:1441–1451. doi: 10.1172/JCI124606. [DOI] [PMC free article] [PubMed] [Google Scholar]
- 40.Marichal T, et al. DNA released from dying host cells mediates aluminum adjuvant activity. Nat Med. 2011;17:996–1002. doi: 10.1038/nm.2403. [DOI] [PubMed] [Google Scholar]
- 41.Bonnelykke K, Vissing NH, Sevelsted A, Johnston SL, Bisgaard H. Association between respiratory infections in early life and later asthma is independent of virus type. J Allergy Clin Immunol. 2015;136:81–86 e4. doi: 10.1016/j.jaci.2015.02.024. [DOI] [PMC free article] [PubMed] [Google Scholar]
- 42.Sabatel C, et al. Exposure to Bacterial CpG DNA Protects from Airway Allergic Inflammation by Expanding Regulatory Lung Interstitial Macrophages. Immunity. 2017;46:457–473. doi: 10.1016/j.immuni.2017.02.016. [DOI] [PubMed] [Google Scholar]
- 43.Janss T, et al. Interferon response factor-3 promotes the pro-Th2 activity of mouse lung CD11b+ conventional dendritic cells in response to house dust mite allergens. Eur J Immunol. 2016;46:2614–2628. doi: 10.1002/eji.201646513. [DOI] [PubMed] [Google Scholar]
- 44.Gentleman RC, et al. Bioconductor: open software development for computational biology and bioinformatics. Genome Biol. 2004;5:R80. doi: 10.1186/gb-2004-5-10-r80. [DOI] [PMC free article] [PubMed] [Google Scholar]
- 45.Macosko EZ, et al. Highly Parallel Genome-wide Expression Profiling of Individual Cells Using Nanoliter Droplets. Cell. 2015;161:1202–1214. doi: 10.1016/j.cell.2015.05.002. [DOI] [PMC free article] [PubMed] [Google Scholar]
- 46.Reutershan J, et al. Critical role of endothelial CXCR2 in LPS-induced neutrophil migration into the lung. J Clin Invest. 2006;116:695–702. doi: 10.1172/JCI27009. [DOI] [PMC free article] [PubMed] [Google Scholar]
- 47.Dwyer MP, et al. Discovery of 2-hydroxy-N,N-dimethyl-3-{2-[[(R)-1-(5- methylfuran-2-yl)propyl]amino]-3,4-dioxocyclobut-1-enylamino}benzamide (SCH 527123): a potent, orally bioavailable CXCR2/CXCR1 receptor antagonist. J Med Chem. 2006;49:7603–6. doi: 10.1021/jm0609622. [DOI] [PubMed] [Google Scholar]
- 48.Marichal T, et al. Interferon response factor 3 is essential for house dust mite-induced airway allergy. J Allergy Clin Immunol. 2010;126:836–844 e13. doi: 10.1016/j.jaci.2010.06.009. [DOI] [PubMed] [Google Scholar]
- 49.Toussaint M, et al. Host DNA released by NETosis promotes rhinovirus-induced type-2 allergic asthma exacerbation. Nat Med. 2017;23:681–691. doi: 10.1038/nm.4332. [DOI] [PMC free article] [PubMed] [Google Scholar]
Associated Data
This section collects any data citations, data availability statements, or supplementary materials included in this article.
Supplementary Materials
Data Availability Statement
The scRNA-seq data provided in this manuscript have been deposited in the ArrayExpress database at EMBL-EBI (https://www.ebi.ac.uk/arrayexpress/experiments/E-MTAB-6902) under accession number E-MTAB-6902. The figures that have associated scRNA-seq data are the following: Fig. 2, Supplementary Figs. 2,3. The source data underlying Figs 1a-d and f; 2d; 3b,c,f,g,i,k; 4b-e, g, i-k and m; 5b-e and g; 6b, d and f; 7 b-i and k-m; 8a-c,e and f-h and j and Supplementary Figs 1b,d; 4c,d; 5 b,c and e,g; 6b, 7b-d,f,g,i,j; 8a are provided as a Source Data file. Any data that support the findings of this study are available from the corresponding authors upon request.