Abstract
In eukaryotes, accurate chromosome segregation in mitosis and meiosis maintains genome stability and prevents aneuploidy. Kinetochores are large protein complexes, that by assembling onto specialized Cenp-A nucleosomes 1,2, function to connect centromeric chromatin to microtubules of the mitotic spindle 3,4. Whereas the centromeres of vertebrate chromosomes comprise Mb of DNA and attach to multiple microtubules, the simple point centromeres of budding yeast are connected to individual microtubules 5,6. All 16 budding yeast chromosomes assemble complete kinetochores using a single Cenp-A nucleosome (Cenp-ANuc), each of which is perfectly centred on its cognate centromere 7–9. The inner and outer kinetochore modules are responsible for interacting with centromeric chromatin and microtubules, respectively. Here, we describe the cryo-EM structure of the S. cerevisiae inner kinetochore module - the constitutive centromere associated network (CCAN) complex, assembled onto a Cenp-A nucleosome (CCAN–Cenp-ANuc). The structure explains the inter-dependency of CCAN’s constituent sub-complexes and shows how the ‘Y’-shaped opening of CCAN accommodates Cenp-ANuc to allow specific CCAN subunits to contact the nucleosomal DNA and histone subunits. Interactions with the unwrapped DNA duplex at the two termini of Cenp-ANuc are mediated predominantly by a DNA-binding groove present in the Cenp-LN sub-complex. Disruption of these interactions impairs assembly of CCAN onto Cenp-ANuc. Our data indicate a mechanism of Cenp-A nucleosome recognition by CCAN and how CCAN acts as a platform for assembly of the outer kinetochore for linking centromeres to the mitotic spindle for chromosome segregation.
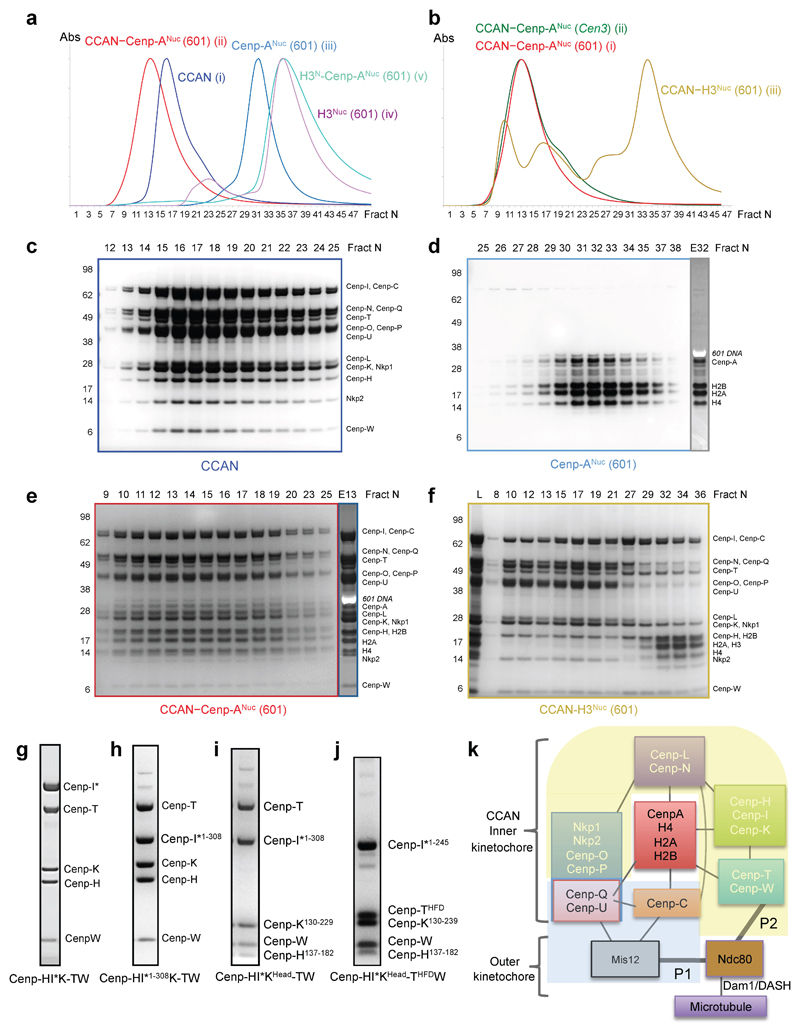
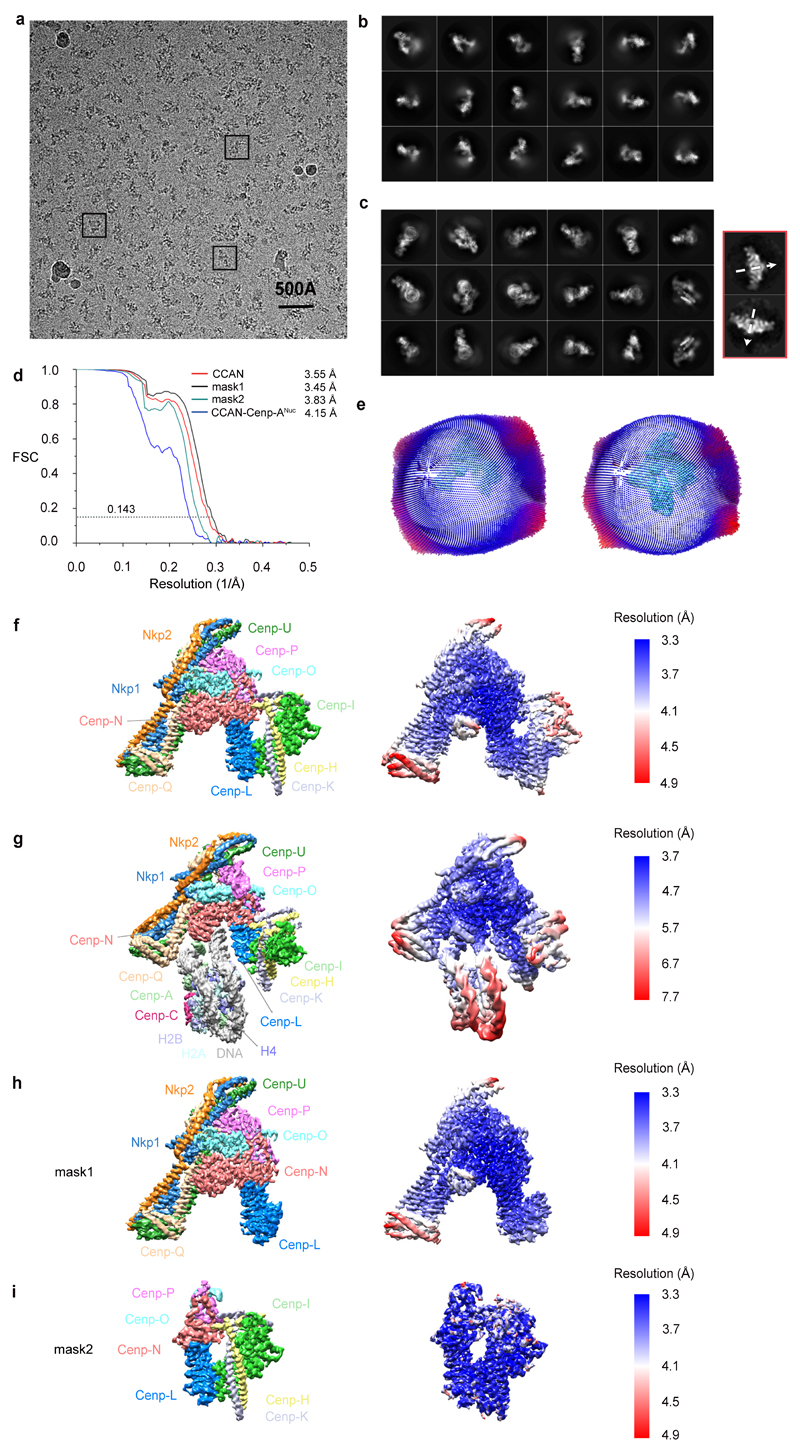
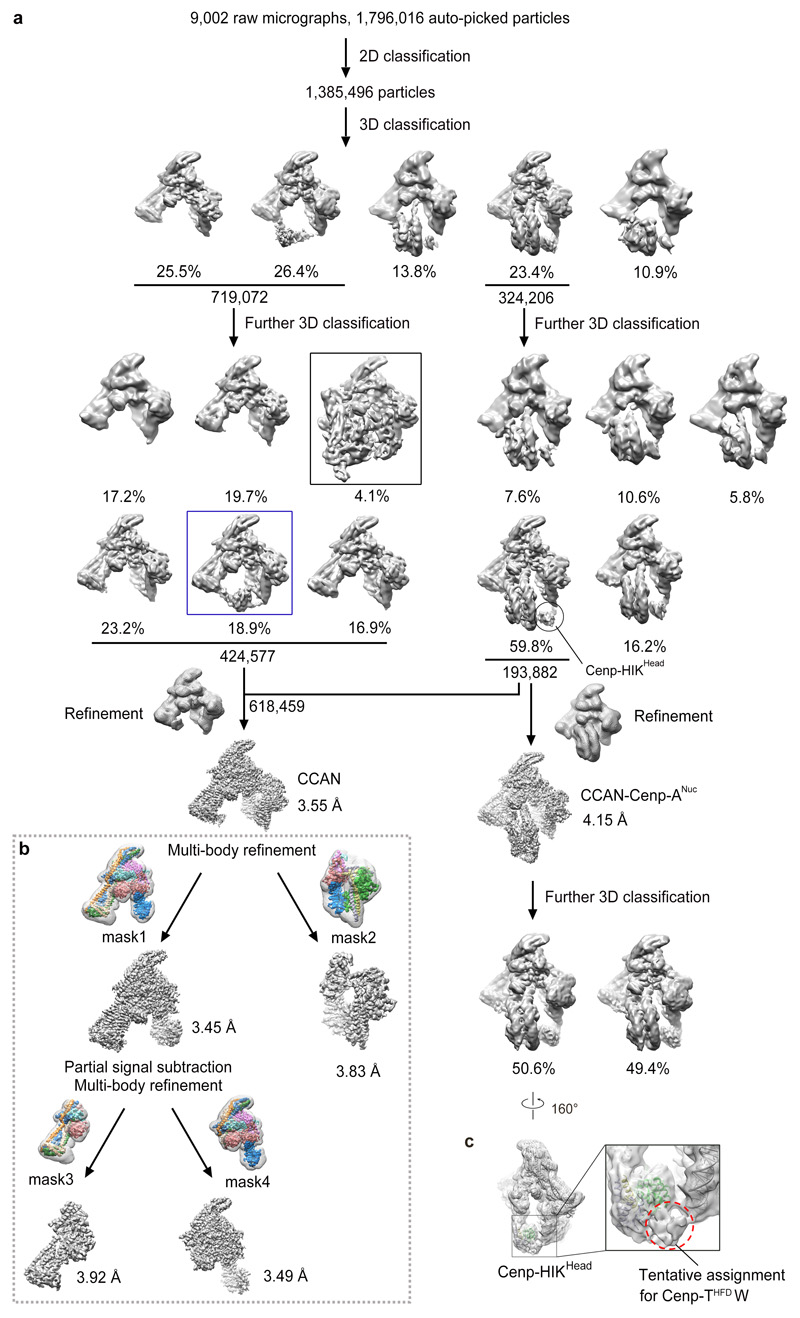
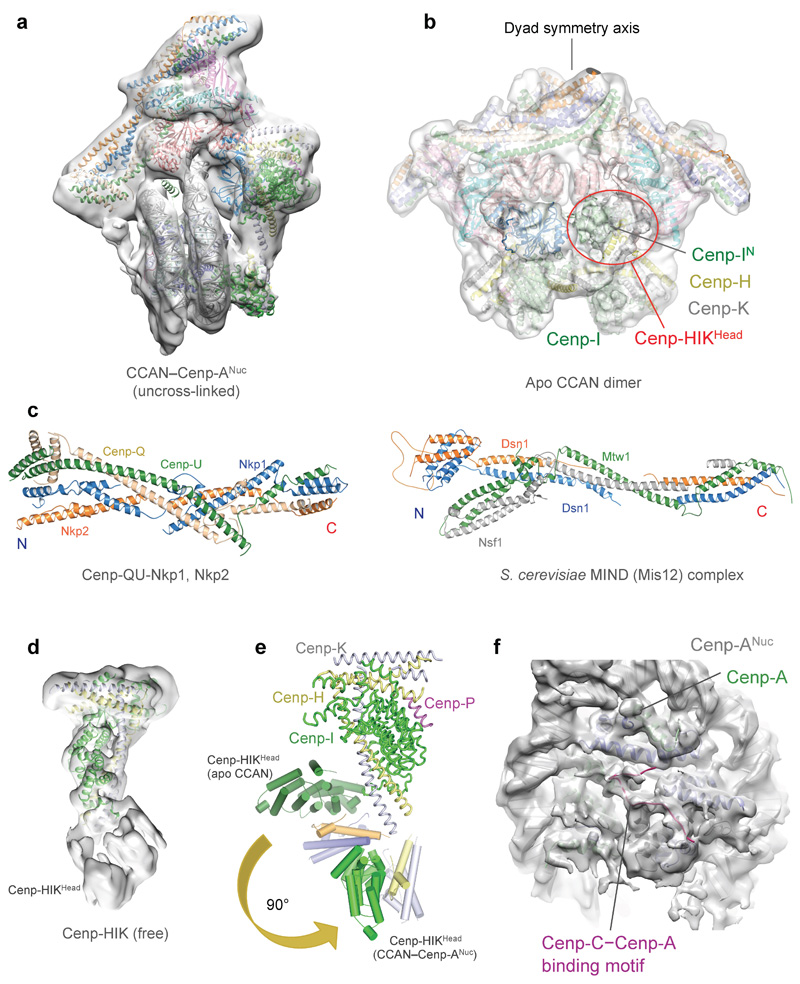
The 14 subunit-CCAN complex assembled onto specialized Cenp-A nucleosomes (Cenp-A substituted for histone H3) reconstituted using either an S. cerevisiae centromere sequence or the Widom 601 sequence, with both complexes eluting at similar volumes on size exclusion chromatography (Extended Data Fig. 1a-e). In contrast, CCAN did not assemble onto a canonical H3 nucleosome, indicating the specificity of the CCAN – Cenp-ANuc interaction (Extended Data Fig. 1b, f). Cryo-electron micrographs of CCAN–Cenp-ANuc (using the more stable 601-Cenp-A nucleosome) revealed a heterogeneous population of particles that by 3D classification were identified as monomeric free CCAN, a monomer of CCAN in complex with Cenp-ANuc, and dimeric CCAN (Extended Data Figs 2 and 3). A 3D reconstruction of free monomeric CCAN was determined to 3.5 Å resolution (Fig. 1, Extended Data Figs 2 and 3 and Extended Data Table 1). Clearly defined EM density for the majority of amino acid side chains (Extended Data Fig. 4 and Extended Tables 1 and 2) allowed building and refinement of the complete atomic model of CCAN, guided by existing models of individual CCAN subunits. The CCAN–Cenp-ANuc complex at 4.15 Å was built by docking apo CCAN and a nucleosome into the CCAN–Cenp-ANuc EM reconstruction (Fig. 2 and Extended Data Table 1). A cryo-EM reconstruction of uncross linked CCAN–Cenp-ANuc, at lower resolution (Extended Data Fig. 5a), matched that of the cross-linked structure, whereas the free CCAN dimer, determined at 8.6 Å (Extended Data Fig. 5b), resembles the 4.25 Å structure of S. cerevisiae CCAN 10. Compared with the latter study, the Nkp1 and Nkp2 subunit assignments differ.
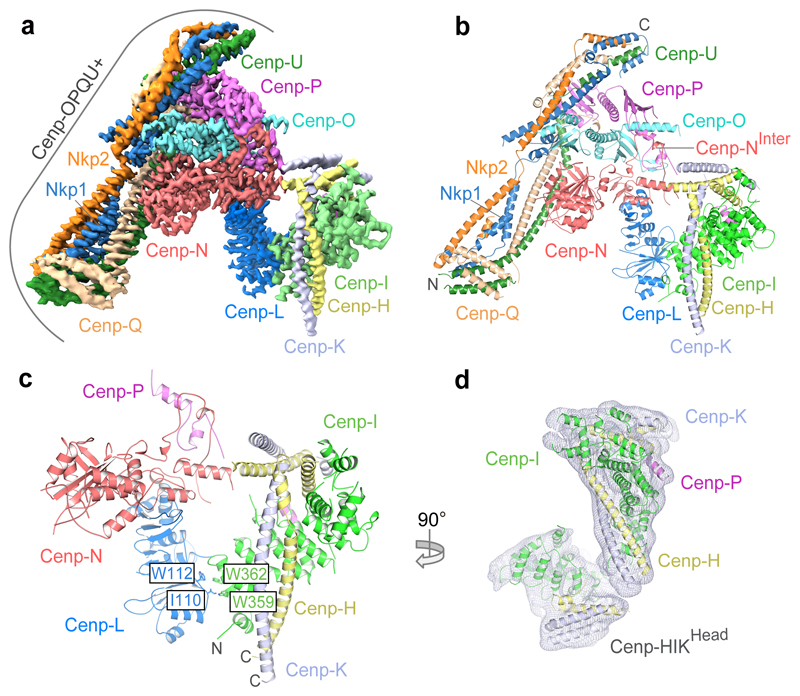
Figure 1. Structure of the S. cerevisiae CCAN complex.
a, Cryo-EM density map and b, Cartoon representation of CCAN. 11 subunits are assigned. ‘N’ and ‘C’ indicate the N- and C-termini of Cenp-QU, Nkp1 and Nkp2. c, Details of the Cenp-HIK–Cenp-LN modules. Residues of Cenp-I are visible from 320 onwards. d, Cryo-EM density for the complete Cenp-HIK module showing Cenp-HIKHead from the CCAN dimer EM 3D class (Extended Data Figs 3a and 5b).
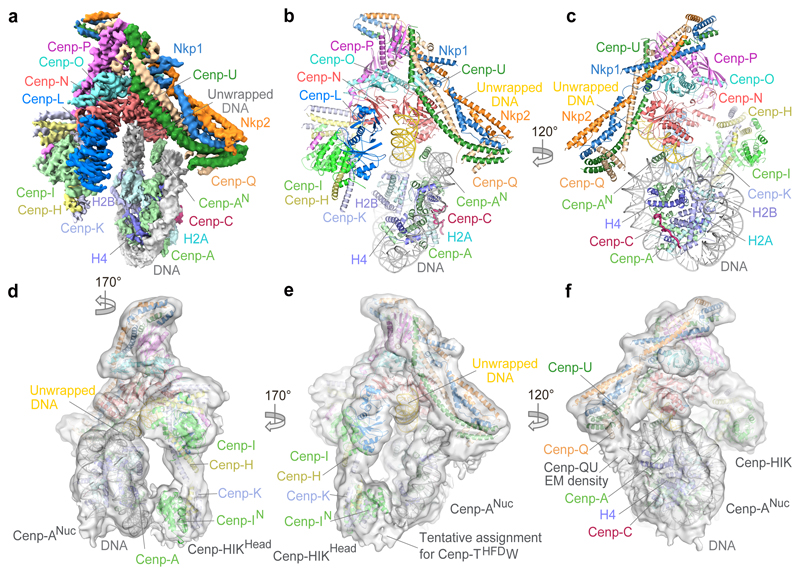
Figure 2. Structure of the S. cerevisiae CCAN–Cenp-ANuc complex.
a, Cryo-EM density map of CCAN–Cenp-ANuc. Cenp-AN: residues 111-129. b, c, Two views of a cartoon representation of CCAN–Cenp-ANuc. Cenp-ANuc wraps ~105 bp of DNA, leaving 20 bp of DNA unwrapped at both ends (coloured yellow for the ordered terminal segment). Supplementary Video 1. d-f, Three views of the cryo-EM density of a 3D sub-class of the overall CCAN–Cenp-ANuc 3D class, before application of the mask used to refine the cryo-EM map shown in (a) (Extended Data Fig. 3a), highlighting contacts to Cenp-ANuc. d, The Cenp-HIKHead module contacts Cenp-A. e, Cenp-THFDW contacts the DNA gyre of Cenp-ANuc. f, N-terminal region of Cenp-QU contacts Cenp-A and H4.
The arrangement of the three sub-complexes of CCAN; Cenp-LN, Cenp-OPQU+ and Cenp-HIK–TW (Extended Data Table 2), generates a ‘Y’-shaped structure (Fig. 1a, b). The Cenp-N subunit, located at the centre of the ‘Y’, is the coordinating element of CCAN, consistent with it forming a critical node at the centromere–kinetochore interface 11. Cenp-OPQU+, which has an elongated shape and generates the stem and one arm of the ‘Y’, interacts mainly with Cenp-N. Cenp-L also forms an extensive interface with Cenp-N, and contributes the major point of contact with Cenp-HIK–TW. Together, Cenp-L and Cenp-HIK–TW generate the opposite arm of the ‘Y’ (Fig. 1a, b). The six-subunit Cenp-OPQU+ module shares four subunits in common with vertebrate Cenp-OPQUR, and its structure in CCAN resembles the negative stain reconstruction of human OPQUR 12. The long N-terminal regions of Cenp-O and Cenp-P, disordered in the K. lactis crystal structure 13, become more structured through interactions with Cenp-HIK and Cenp-N (Fig. 1b, c). Four subunits of Cenp-OPQU+ (Cenp-Q, Cenp-U, Nkp1 and Nkp2) form extended α-helices that associate in a parallel, inter-weaved fashion to create an irregular coiled-coil α-helical bundle. This shares a striking similarity to the outer kinetochore complex Mis12 14,15 (Extended Data Fig. 5c). Nkp1 and Nkp2 create an outer layer of α-helices in Cenp-OPQU+, which are likely substituted by Cenp-R in vertebrates 12.
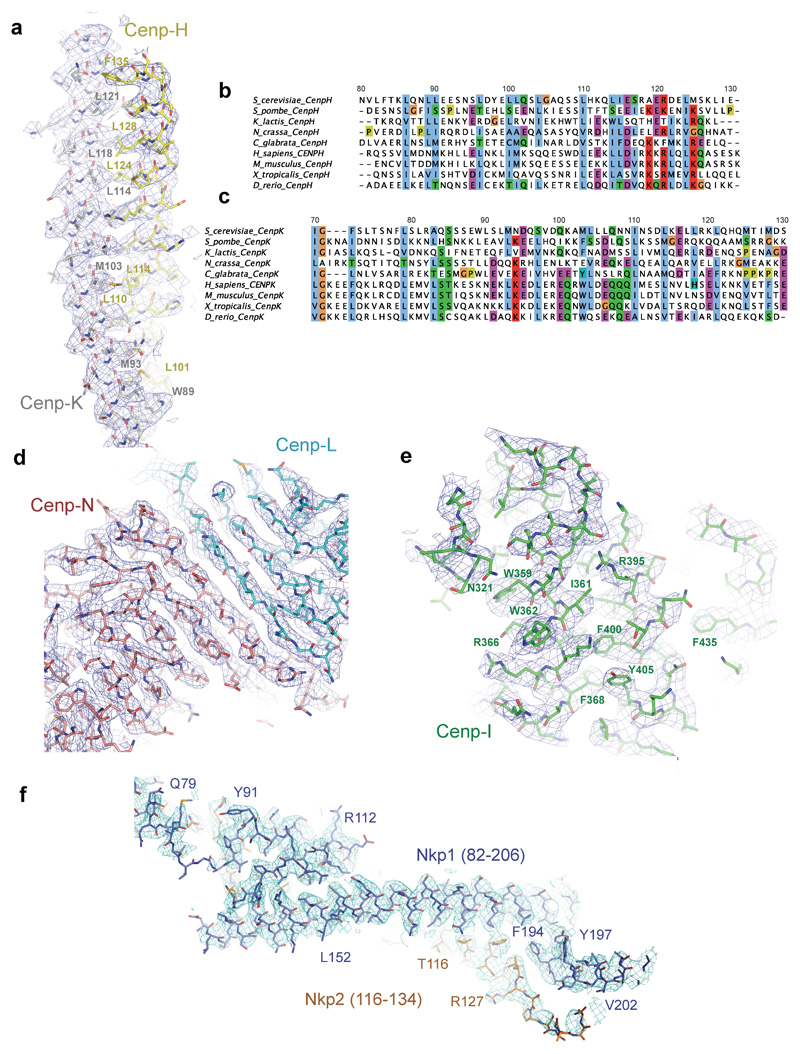
The Cenp-HIK module (Fig. 1c), which resembles the free Cenp-HIK complex (Extended Data Fig. 5d), is dominated by the C-terminal HEAT repeats of Cenp-I (Extended Data Fig. 4e). The coiled-coil α-helices of Cenp-H and Cenp-K run anti-parallel to Cenp-I (Fig. 1c and Extended Data Fig. 4a-c). The base of Cenp-HIK is a four α-helical bundle comprising the N-termini of Cenp-H and Cenp-K. The flexible head domain, visible in free Cenp-HIK (Cenp-HIKHead), and a small population of CCAN particles (Extended Data Figs 3c and 5b, d), matches the shape of the crystal structure of the N-terminal Cenp-I HEAT repeats that are associated with the C-termini of both Cenp-H and Cenp-K 16 (Fig. 1d). The Cenp-TW sub-complex, comprising the histone-fold domain (HFD) subunits Cenp-T and Cenp-W, was not clearly resolved in cryo-EM maps of CCAN and CCAN–Cenp-ANuc. Cenp-TW associates with Cenp-HIK in solution, in agreement with previous studies 11,17, and Cenp-THFDW interacts equally well with a complex comprising Cenp-HIKHead (Extended Data Fig. 1g-j), indicating that the HFDs of Cenp-TW directly interact with Cenp-HIKHead.
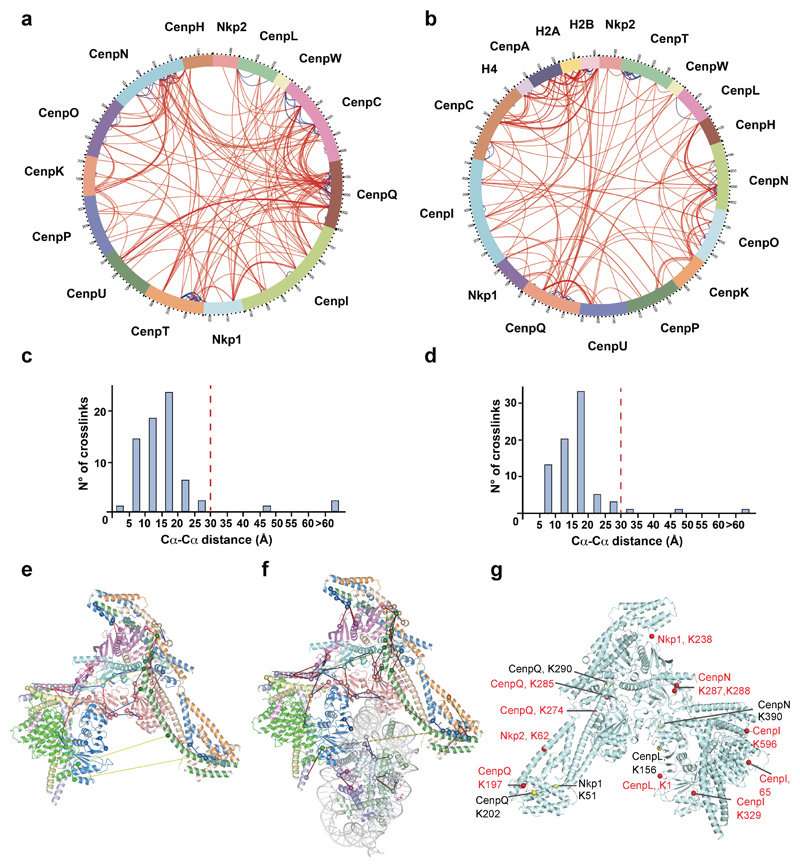
The relative organization of CCAN subunits in our cryo-EM reconstruction is in agreement with that defined from the de novo assembly of the S. cerevisiae kinetochore 9 (Extended Data Fig. 1k), and consistent with a negative stain EM reconstruction of the human HIKM-LN-OPQUR complex 12. To assess the validity of our structure, we performed cross-linking mass spectrometry (XL-MS) analysis of the complexes. Numerous intra and inter-subunit cross-links were identified (Extended Data Fig. 6a, b and Supplementary Tables 1 and 2). Mapping these cross-links onto CCAN and CCAN–Cenp-ANuc, for which both lysines of the cross-linked pair are defined, showed that 95% of the detected crosslinks are within the expected linker distance constraints (Extended Data Fig. 6c-f).
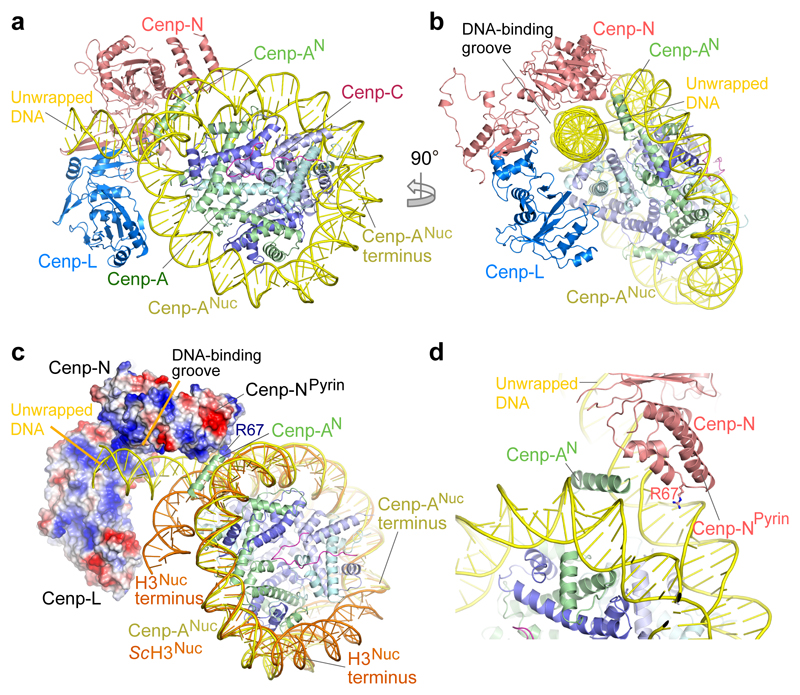
Kinetochores assemble onto Cenp-ANuc 9,18, the hallmark of centromeric chromatin, with the CCAN subunits Cenp-C and Cenp-N directing this assembly 19,20. In the CCAN–Cenp-ANuc complex, Cenp-ANuc is an octameric nucleosome, with DNA wrapped as a left-handed super-helix (Fig. 2 and Supplementary Video 1), shown previously for free Cenp-ANuc 8,21–23. Also consistent with these reports is that compared with canonical H3 nucleosomes, in the CCAN–Cenp-ANuc complex, the DNA gyre of Cenp-ANuc is more loosely wrapped. In CCAN–Cenp-ANuc, only 105 bp of DNA encircle the Cenp-A-octamer, contrasting with 147 bp for canonical nucleosomes 24 (Figs 2 and 3a-c). A total of 20 bp of DNA are unwrapped equally at each DNA terminus of Cenp-ANuc. One of the unwrapped DNA termini, well defined in cryo-EM density, interacts with CCAN, whereas the other is disordered (Fig. 2a). We observe clearly defined α-helical density for the N-terminal segment of one Cenp-A subunit (Cenp-AN), inserted between the unwrapped DNA duplex and DNA gyre (Figs 2a and 3d).
Figure 3. Cenp-LN interacts with the unwrapped DNA duplex of Cenp-ANuc.
a, b. Two orthogonal views showing the unwrapped DNA duplex of Cenp-ANuc engaged by the DNA-binding groove of the Cenp-LN sub-complex. c, Surface of Cenp-LN showing positive electrostatic potential of the DNA-binding groove. The canonical S. cerevisiae H3 nucleosome (orange, PDB: 1ID3 24) wraps 147 bp of DNA compared with the 105 bp wrapped by the S. cerevisiae Cenp-A nucleosome (yellow). d, Zoomed-view showing insertion of the N-terminus of Cenp-A (Cenp-AN) between the unwrapped DNA duplex and DNA gyre of Cenp-ANuc. Arg67 of the Cenp-N Pyrin domain inserts into the DNA major groove.
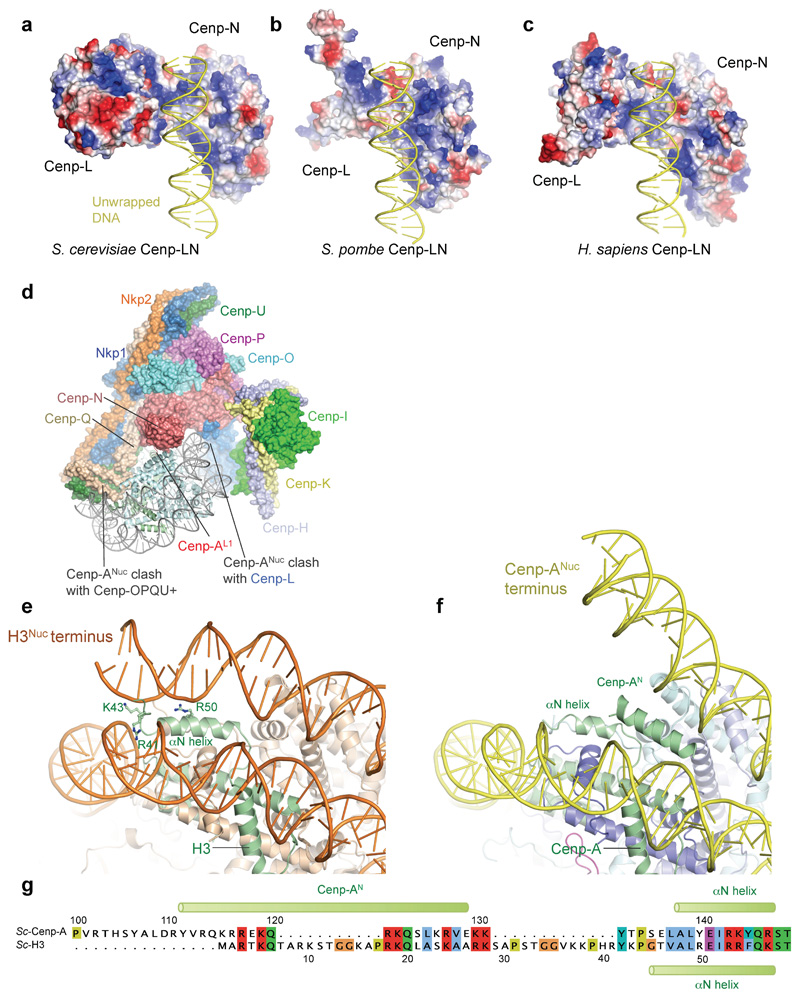
In the CCAN–Cenp-ANuc complex (Fig. 2 and Supplementary Video 1), Cenp-ANuc inserts end-on into the ‘Y’-shaped opening of CCAN with each arm of CCAN embracing opposite sides of the nucleosome. This positions the Cenp-LN module to form extensive contacts with the unwrapped DNA duplex at one of the termini of the Cenp-ANuc DNA gyre (Fig. 2). Cenp-LN adopts a ‘U’-shaped structure creating an evolutionarily conserved positively charged groove that engages the unwrapped DNA (Fig. 3c and Extended Data Fig. 7a-c). The DNA duplex runs along the Cenp-LN groove, exiting opposite to the nucleosome (Figs 2 and 3a-c). Cenp-HIKHead also functions in Cenp-ANuc recognition because in the CCAN–Cenp-ANuc complex, EM density corresponding to Cenp-HIKHead–Cenp-TW contacts the DNA gyre of Cenp-ANuc, with Cenp-I in close proximity to Cenp-A (Fig. 2d, Extended Data Fig. 3c and Supplementary Video 1). Compared with apo-CCAN, Cenp-HIKHead–Cenp-TW rotates ~90° to accommodate Cenp-ANuc (Extended Data Fig. 5e). Previous studies suggested that the vertebrate Cenp-TWSX heterotetramer forms a nucleosome-like particle to interact with DNA 25. However, this is not compatible with Cenp-TW of budding yeast exactly co-localizing with centromeric Cenp-ANuc, in a Cenp-I-dependent manner 17. The HFDs of Cenp-TW were assigned to EM density associated with Cenp-HIKHead contacting the DNA gyre of Cenp-ANuc, visible in a minor 3D class of CCAN–Cenp-ANuc (Fig. 2e and Extended Data Fig. 3c). On the opposite side of CCAN to Cenp-HIK, the N-terminal regions of Cenp-Q and Cenp-U contact the DNA gyre of Cenp-ANuc, and the N-termini of Cenp-A and H4 (Fig. 2c, f). This is consistent with the Cenp-QU dimer binding DNA 26 and recognising the posttranslational status of the N-terminus of Cenp-A 27, and further validated by our XL-MS data revealing Cenp-Q crosslinks to H2A and H2B (Extended Data Fig. 6b).
Cenp-N engages Cenp-ANuc in the budding yeast CCAN–Cenp-ANuc complex differently from how the isolated vertebrate Cenp-N subunit interacts with Cenp-ANuc through the L1 loop of Cenp-A and the adjacent DNA gyre 28,29. Because of steric clashes, the interaction of Cenp-N with Cenp-ANuc revealed in these studies is not compatible with the position of Cenp-N in the context of the CCAN complex (Extended Data Fig. 7d). Binding of Cenp-ANuc at this interface of CCAN, as proposed 10, would require substantial conformational changes of CCAN. The discrepancy between our structure and that of the vertebrate system, may either reflect genuine species differences in CCAN–Cenp-ANuc architectures, or result from the vertebrate Cenp-N–Cenp-ANuc structure representing an intermediate in the CCAN–Cenp-ANuc assembly pathway, in accordance with CCAN–Cenp-ANuc remodelling during the cell cycle 11.
Cenp-C also determines kinetochores–Cenp-ANuc interactions 20 and we found that Cenp-C is required for stable assembly onto Cenp-A-Cen3 nucleosomes (data not shown), although not Cenp-A-601 nucleosomes (Fig. 4b). Cenp-C interacts with Cenp-A through its Cenp-C motif (Extended Data Fig. 5f), similar to vertebrates 30. However, the regions of Cenp-C associated with CCAN were not visible in the cryo-EM map. XL-MS data indicate that Cenp-C participates in multiple interactions with CCAN (Extended Data Figs 6a, b, g and Supplementary Tables 1 and 2).
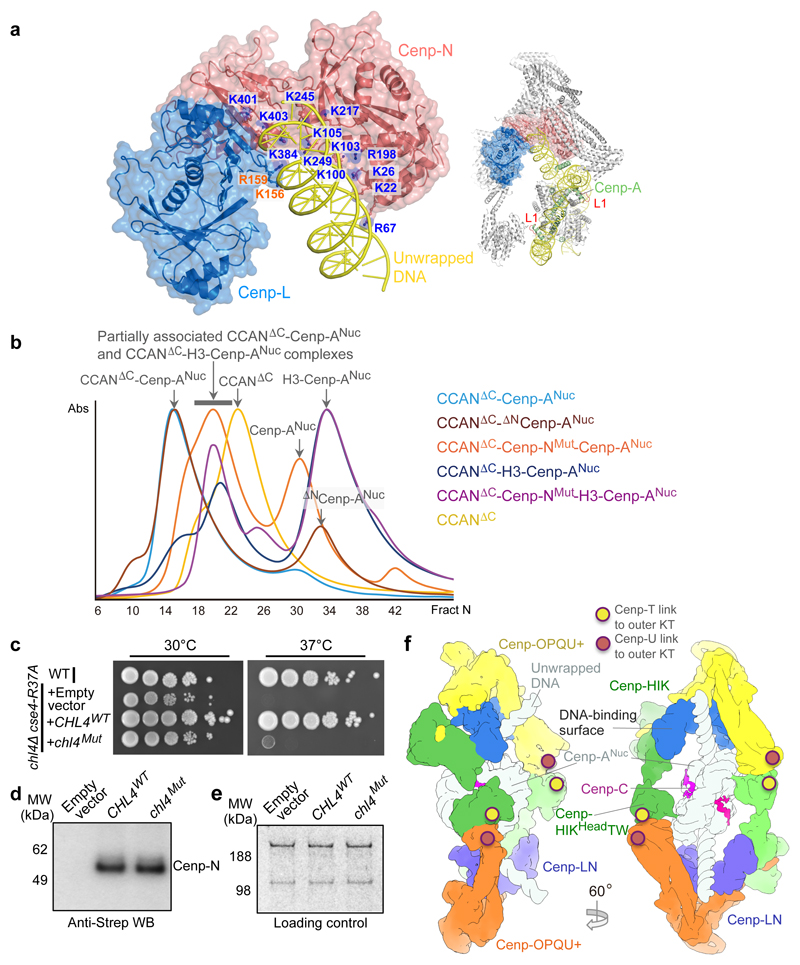
Figure 4. The Cenp-N DNA binding groove is required for stable CCAN – Cenp-ANuc interactions.
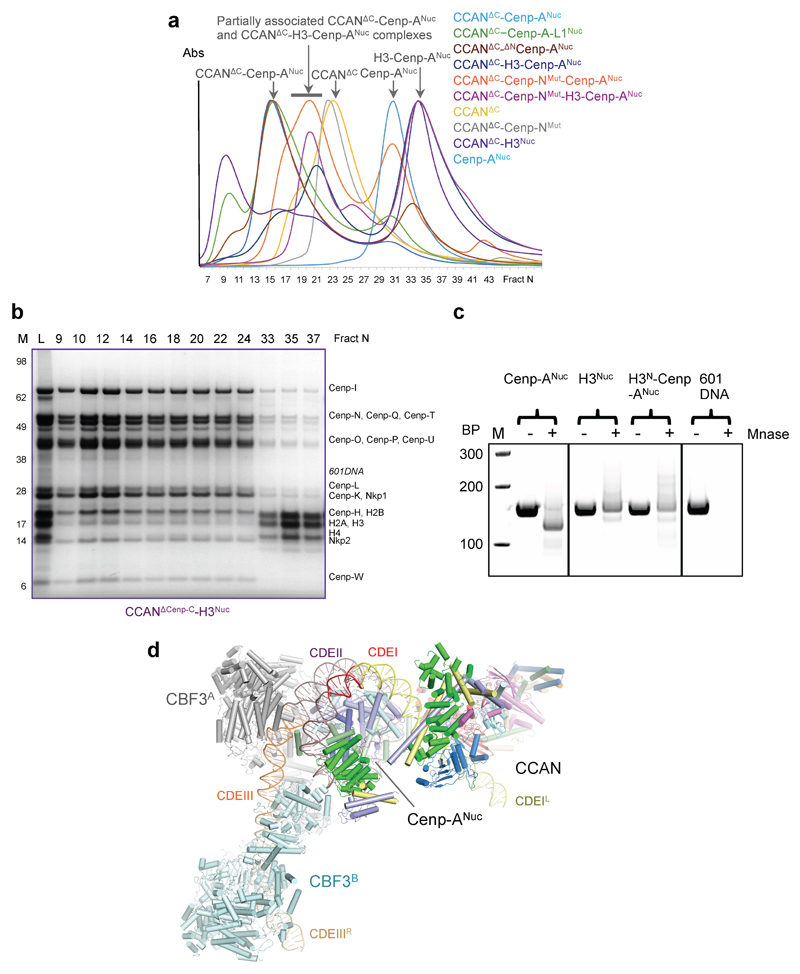
a, Surface of the Cenp-LN module showing the Cenp-N DNA binding groove engaging the unwrapped DNA, indicating the 13 mutated Arg and Lys residues of Cenp-N. Inset: overview of CCAN–Cenp-ANuc showing the Cenp-A L1 loop. b, Size exclusion chromatograms of various CCANΔCenp-C–Cenp-ANuc complexes. Wild type CCANΔCenp-C forms a complex with Cenp-ANuc, but mutating the Cenp-N DNA binding groove weakens CCAN – Cenp-ANuc interactions (Extended Data Fig. 8c, d). The binding of both CCANΔCenp-C and CCANΔCenp-C-Cenp-NMut to H3N-Cenp-ANuc is severely disrupted, with little complex formed (Extended Data Fig. 8g, h). The positions of complexes are indicated by arrows. (CCANΔC = CCANΔCenp-C). This experiment was performed independently in triplicate with similar results. c, The DNA-binding groove functions in vivo. Wild type Cenp-N (CHL4WT) rescues the growth defect of the chl4Δ cse4-R73A mutant strain at 37 °C, whereas the Cenp-NMut (chl4Mut) does not. WT: wild type strain. This experiment was performed independently ten times with similar results. d, Western blot demonstrates that Cenp-NWT and Cenp-NMut are expressed at equivalent levels in the chl4Δ cse4-R73A mutant strain. e, Loading control. Coomassie-blue stained gel shows dynein and acetyl-CoA carboxylase. Experiments in d and e were performed independently in triplicate times with similar results. f, Two views showing a representation of dimeric CCAN–Cenp-ANuc complex with the second CCAN protomer generated by the dyad symmetry of Cenp-ANuc. Sites of contact to the outer kinetochore (KT) (through Cenp-U and Cenp-T) are indicated. For gel source data see Supplementary Fig. 1.
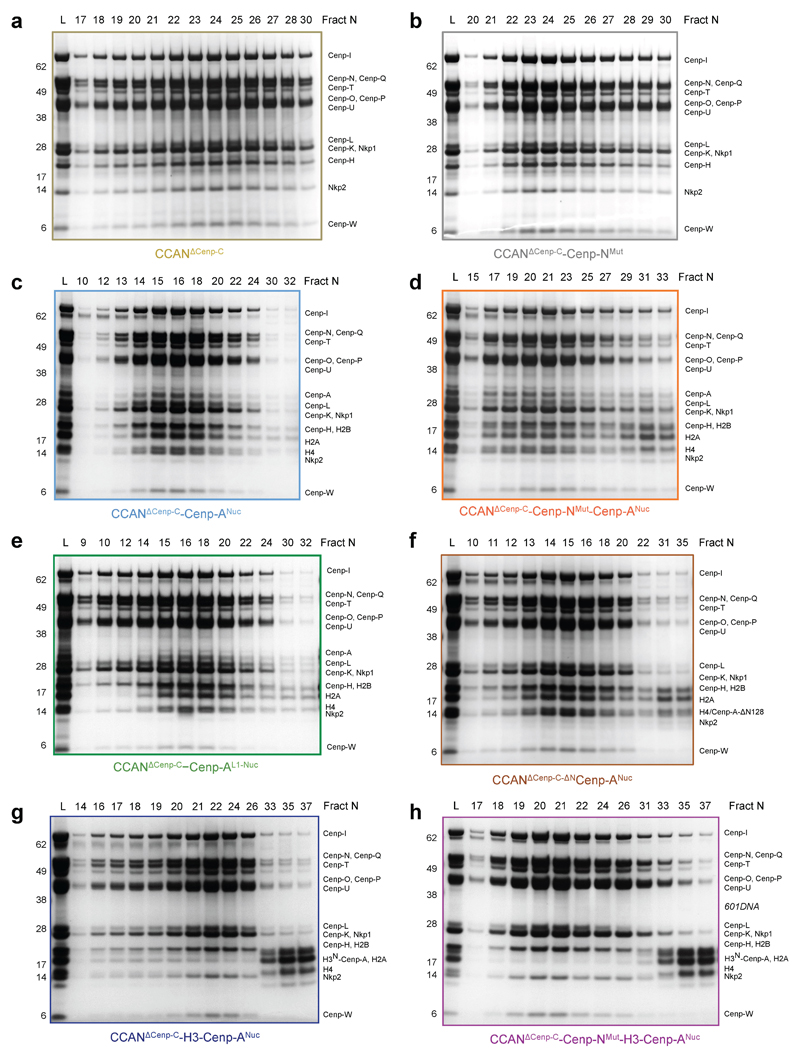
To test the validity of the CCAN–Cenp-ANuc structure, we mutated 13 Arg and Lys residues in Cenp-N that line the Cenp-LN–DNA binding groove (Fig. 4a) and tested the ability of the mutant CCAN to assemble onto Cenp-ANuc. To avoid complications of Cenp-C interacting with Cenp-ANuc, we used CCAN without Cenp-C (CCANΔCenp-C). The Cenp-N mutant did not impair CCANΔCenp-C assembly, and similar to CCAN, CCANΔCenp-C binds to Cenp-A-601 nucleosomes, but not H3 nucleosomes (Fig. 4b and Extended Data Figs 8a-c and 9a, b). The Cenp-N mutant disrupted CCANΔCenp-C – Cenp-ANuc interactions (Fig. 4b and Extended Data Fig. 8d). In contrast, mutating the L1 loop of Cenp-A did not disrupt the binding of CCANΔCenp-C to Cenp-ANuc (Extended Data Figs 8e and 9a).
We then assessed the role of the unwrapped DNA termini of Cenp-ANuc in mediating CCAN – Cenp-ANuc interactions. Because the αN-helix of the H3 histone stabilizes the wrapped DNA termini of canonical H3 nucleosomes 22,24, to create a more closed, highly wrapped Cenp-ANuc, we substituted the N-terminal 50 residues of H3 for the N-terminal 140 residues of Cenp-A, creating a chimeric H3N-Cenp-A (Extended Data Fig. 7e-g). The resultant H3N-Cenp-ANuc wrapped a similar length of DNA as H3Nuc (~147 bp) (Extended Data Fig. 9c). The affinity of CCANΔCenp-C for H3N-Cenp-ANuc was severely disrupted, such that CCANΔCenp-C was substantially dissociated from H3N-Cenp-ANuc (Fig. 4b and Extended Data Fig. 8g). Binding of H3N-Cenp-ANuc to CCANΔCenp-C was completely disrupted with the Cenp-N mutant (Fig. 4b and Extended Data Figs 8h). The reduced affinity of CCAN for H3N-Cenp-ANuc is not due to the lack of the Cenp-A N-terminus because CCAN bound to Cenp-ANuc and ΔNCenp-ANuc equally well (Fig. 4b and Extended Data Fig. 8c, f). These biochemical studies confirm the CCAN – Cenp-ANuc cryo-EM structure showing that CCAN interacts with the unwrapped DNA termini of Cenp-ANuc, and that a major role of the Cenp-LN DNA-binding groove is to engage the unwrapped DNA gyre of Cenp-ANuc (Fig. 3c).
Disruption of the budding yeast Cenp-N gene (CHL4) causes chromosome loss and instability, without affecting viability 31. However, combining a chl4 deletion with either mutation of Cenp-A (CSE4), or deletion of other kinetochore subunits, results in synthetic growth defects and lethality 9,27. Cenp-N is an essential gene in S. pombe and humans. To investigate the in vivo consequences of disrupting the DNA-binding groove of Cenp-LN, we tested whether the synthetic growth defect of the chl4Δ cse4-R37A mutant at 37 °C 27 is rescued by Cenp-NMut. Whereas wild type Cenp-N rescued the growth defect of the chl4Δ cse4-R37A mutant, the Cenp-NMut did not (Fig. 4c-e). This result demonstrates a functional role for the Cenp-LN DNA-binding groove, and together with our biochemical data (Fig. 4b and Extended Data Fig. 8), supports the CCAN – Cenp-ANuc architecture we report here. In budding yeast, Cenp-ANuc is linked to the outer kinetochore Ndc80 complex and associated microtubules through a pathway comprising the essential proteins Cenp-C, Cenp-QU and the Mis12 complex, and by a second pathway involving Cenp-TW and Cenp-N 9 (Extended Data Fig. 1k). The location of Cenp-N at the centre of CCAN is consistent with these two pathways. The unwrapped DNA termini of Cenp-ANuc contribute to stabilizing the CCAN – Cenp-ANuc complex through the Cenp-LN DNA binding groove, augmented by contacts of both Cenp-A and the Cenp-ANuc DNA gyre with Cenp-C (Extended Data Fig. 5f), Cenp-LN (Fig. 3c), Cenp-TW, Cenp-HIKHead and Cenp-QU 27 (Fig. 2d-f).
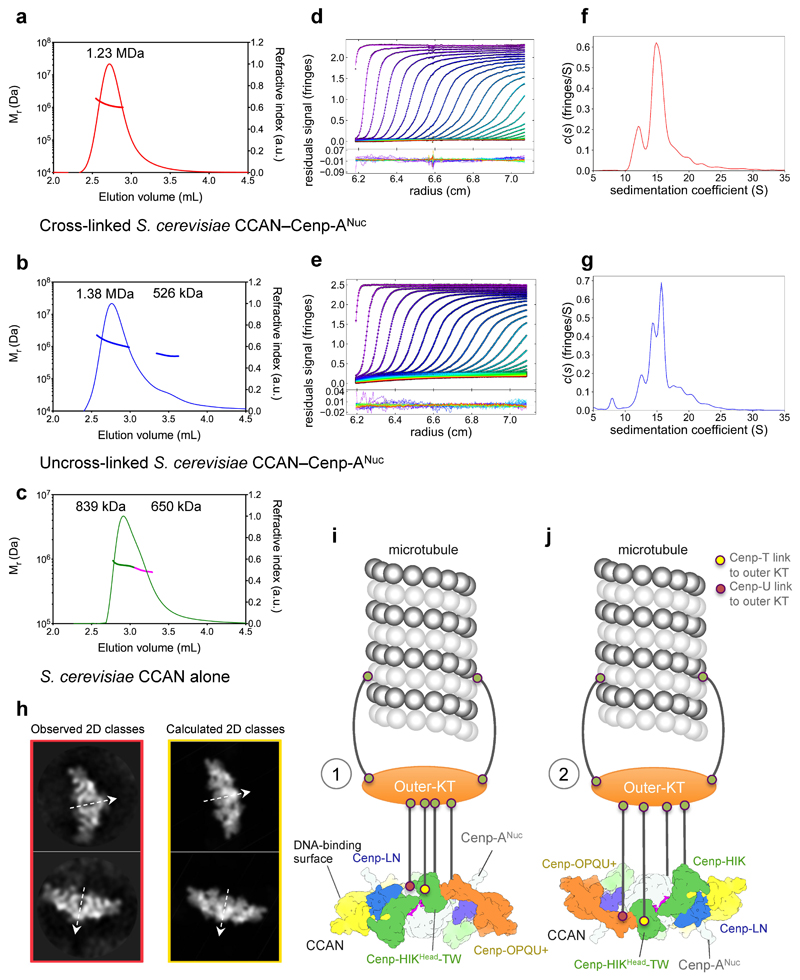
In the cryo-EM reconstruction, Cenp-ANuc is associated with a single CCAN, whereas the expected stoichiometry is two CCANs to Cenp-ANuc 32. SEC-MALS and AUC confirmed the reconstituted CCAN–Cenp-ANuc is consistent with two CCANs per Cenp-ANuc (Extended Data Fig. 10a-g). In a generated model of dimeric CCAN–Cenp-ANuc, two CCAN complexes associate through their tips of the ‘Y’, creating a slot that perfectly accommodates Cenp-ANuc that is inserted vertically (Fig. 4f). The two CCAN complexes cradle Cenp-ANuc with its unwrapped DNA duplexes stretched out, over-lying CCAN’s DNA-binding surface, consistent with XL-MS cross-links between Cenp-Q and Cenp-TW (Extended Data Fig. 6b). Extensive 2D classification of the cryo-EM data identified 2D classes of dimeric CCAN–Cenp-ANuc particles with two-fold symmetry axes (Extended Data Fig. 2c). These particles correspond closely to the calculated reprojections of the proposed dimeric CCAN–Cenp-ANuc complex (Extended Data Fig. 10h). Cryo-EM grids destabilize CCAN – Cenp-ANuc, resulting in a very low abundance of dimeric CCAN–Cenp-ANuc particles.
In S. cerevisiae, the CBF3 complex engages the CDEIII element of the ~125 bp centromere to direct Cenp-A/Cse4 nucleosome deposition. Modelling indicates that only when bound to a single CCAN promoter can Cenp-ANuc simultaneously accommodate CBF3 (Extended Data Fig. 9d), suggesting that CBF3 would not associate with a fully assembled kinetochore.
The dimeric CCAN–Cenp-ANuc complex suggests two possibilities for how a kinetochore-attached microtubule would segregate centromeric chromatin (Extended Data Fig. 10i, j and Supplementary Video 2). In one scenario, CCAN attaches to the microtubule through the outer kinetochore, using the same face as its DNA-binding surface (Extended Data Fig. 10i). This would sandwich the DNA between CCAN and the outer kinetochore, a possibility compatible with the long flexible linkers that attach CCAN to the outer kinetochore. As the microtubule pulls on the kinetochore, CCAN would hoist the over-lying DNA. Alternatively, microtubules could attach to CCAN from the opposite face to its DNA-binding surface, so the chromosome is pulled from behind the inner kinetochore (Extended Data Fig. 10j). Because vertebrate Cenp-ANuc also wraps between 100-120 bp (of α-satellite DNA) 22, with nucleosome unwrapping enhanced by Cenp-C 33, and the human CCAN architecture 12 is similar to yeast, it is likely that the mechanism of recognition of the specialized Cenp-A nucleosome, we describe here for the budding yeast inner kinetochore, is evolutionarily conserved.
Methods
Cloning, expression, purification and reconstitution of recombinant CCAN–Cenp-ANuc nucleosome complex
Cloning
The genes for CTF19, OKP1, MCM21, AME1, NKP1, NKP2, CTF3, MCM16, MCM22, CNN1, WIP1, MIF2, CHL4 and IML3 (MCM19) (Extended Data Table 2 for vertebrate Cenp conversion) were amplified by PCR from Saccharomyces cerevisiae genomic DNA and cloned into a pU1 plasmid using a modified Multibac expression system 34. The intron in MCM21 was deleted by USER methodology. A double StrepII tag together with a TEV cleavage site was attached to the C-termini of Ame1, Ctf3, Chl4, Mif2 and Cnn1 proteins. For expression of the Cenp-OPUQ+ complex (COMA+: Ctf19, Okp1, Mcm21, Ame1, Nkp1 and Nkp2) gene expression cassettes in pU1 were subsequently cloned into a pF2 vector 34. The gene expression cassettes for CTF3, MCM16, MCM22, CNN1 and WIP1 were cloned into pF2 to generate the Cenp-HIK–TW complex.
Cenp-HIK-TW complexes
To test which regions of Cenp-H, Cenp-I and Cenp-K interact with each other and with Cenp-TW, the following fragments of Cenp-H, Cenp-I and Cenp-K were constructed: Cenp-I (residues 1-308) (Cenp-IN), Cenp-H (residues 137-182) (Cenp-HC), Cenp-H (residues 130-239) (Cenp-KC) and combinations of Cenp-H, Cenp-I and Cenp-K, together with Cenp-TW were for assembled into the pU1 plasmid for Multibac expression 34 for co-expression using the insect cell/baculovirus system. A double StrepII tag was added to C-terminus of Cenp-I.
To test the role of the positively-charged DNA-binding groove of Cenp-N for Cenp-A nucleosome interactions, a total of 13 Arg and Lys mutations were introduced into CHL4 (Cenp-NMut) by total gene synthesis (GeneArt/Thermo Fischer): chl4K22/K26S/R67S/K100S/K103S/K105S/R198S/K217S/K245S/K249S/K384S/K401S/K403S. Cenp-NMut was combined with Cenp-L to generate a Cenp-NMut-Cenp-L co-expression baculovirus.
The baculoviruses for expression of Cenp-OPQU+, Cenp-HIK–TW, Cenp-C and Cenp-LN were prepared for expression using the insect cell-baculovirus system 34.
The cDNA encoding for Saccharomyces cerevisiae CSE4 (S. cerevisiae CENP-A), H2A, H2B and H4 histone genes were synthesized (GeneArts/Thermo Fisher) with optimized codons for expression in Escherichia coli and were subsequently cloned into pET28A with a TEV protease cleavable N-terminal His6 tag. For the recombinant Cse4 octamer (ScCenp-A octamer), four expression cassettes for CSE4, H2A, H2B and H4 histone genes were subsequently cloned into a single pET28 plasmid by USER methodology for E. coli expression. For ScH3 octamer purification CSE4 was replaced by the H3 gene. The Cenp-A L1 loop mutant (Cenp-AL1: cse4K172S/D173A/Q174A/D175S) and cse4130-229 (ΔNCenp-A) were expressed for producing Cenp-AL1 and Cenp-AΔN octamers and nucleosomes, respectively. The chimeric H3N-Cenp-A histone comprises a fusion of residues 1-50 of ScH3 with residues 141-229 of CSE4. The H3N-Cenp-A histone (molecular mass 15.74 kDa) was used to generate H3N-Cenp-ANuc-601 by the same procedure as for Cenp-ANuc.
Expression and purification
Complexes of Cenp-OPQU+, Cenp-HIK, Cenp-HIK–TW, Cenp-LN and Cenp-C were expressed individually in High-5 insect cells (Trichoplusia ni: expression system). The High-5 insect cell line was not tested for mycoplasma contamination and was not authenticated. The cells were harvested 48 h after infection. The lysate was loaded onto a Strep-Tactin ® Column (Qiagen) and the complexes were eluted with 2.5 mM desthiobiotin (Sigma) in a buffer of 50 mM Tris.HCl (pH 8.0), 200 mM NaCl, 1 mM DTT. The StrepII-tag was cleaved using TEV protease overnight at 4˚C. The proteins and complexes were further purified on Resource Q anion exchange and size exclusion chromatography in a buffer of 20 mM Hepes (pH 8.0), 200 mM NaCl, 2 mM DTT. Free Cenp-HIK was cross-linked using 0.05% glutaraldehyde for 8 min on ice and quenched with 50 mM Tris.HCl (pH 8.0), then further purified using Superose 6 size exclusion chromatography. The proteins and complexes were collected, concentrated, frozen in liquid nitrogen and stored at -80˚C. The stable 14-subunit CCAN complex was reconstituted by combining individually purified CCAN sub-complexes; Cenp-LN, Cenp-OPQU together with the budding yeast-specific Nkp1 and Nkp2 subunits (Cenp-OPQU+), Cenp-HIK–TW and Cenp-C.
For Cenp-HIK-TW assembly assays, a combination of full length and either their N or C terminal fragments of Cenp-I, Cenp-H and Cenp-K were co-expressed together with Cenp-T and Cenp-W or with Cenp-THFD (residues 268-361) and Cenp-W. Affinity purified complexes were analysed using SDS-PAGE analysis.
The ScCenp-A octamer was prepared by co-expression of CSE4, H2A, H2B and H4 in B834Rare2 E. coli cells. The harvested cell pellet was lysed in a buffer of 50 mM Tris.HCl (pH 8.0), 2 M NaCl. The ScCenp-A octamer was isolated by Ni-NTA affinity chromatography, eluted with imidazole in 2 M NaCl buffer. The octamer was further purified by S200 size exclusion chromatography, concentrated to 3 mg/mL in a buffer of 10 mM Tris.HCl (pH 7.5), 2 M NaCl, 1 mM EDTA and 2 mM DTT and frozen in liquid nitrogen and stored at -80˚C.
For DNA fragment preparation, NEB Stable E. coli cells containing a plasmid with a multiple copy (20x) of the 147 base pair Widom 601 sequence flanked by EcoRV sites in a pUC18 backbone (gift from Fabrizio Martino, MRC-LMB) were cultured in LB broth with ampicillin. The plasmid was isolated by using the Plasmid Giga Kit (Qiagen). The Widom 601 fragment was purified with a 1 mL resource Q anion exchange chromatography column (GE Healthcare Life Sciences) after over-night digestion with EcoRV-HF (NEB). The purified DNA was precipitated, dissolved, buffer-exchanged and stored in a buffer of 2 M NaCl, 10 mM Tris.HCl (pH 7.5), 1 mM EDTA, 2 mM DTT at -20˚C. CEN3 DNA fragment was prepared by the primer-extension method. Two oligos used were: CEN3F ATAAGTCACA TGATGATATT TGATTTTATT ATATTTTTAA AAAAAGTAAA AAATAAAAAG TAGTTTATTT TTAAAAAATA AAATTTAAAA and CEN3R TTCAATGAAA TATATATTTC TTACTATTTC TTTTTTAACT TTCGGAAATC AAATACACTA ATATTTTAAA TTTTATTTTT TAAAAATAAA CTA (Sigma-Aldrich). The fragment was produced in a one step extension at 68 ˚C for 1 min. The final product of the 153 base pair CEN3 (ATAAGTCACA TGATGATATT TGATTTTATT ATATTTTTAA AAAAAGTAAA AAATAAAAAG TAGTTTATTT TTAAAAAATA AAATTTAAAA TATTAGTGTA TTTGATTTCC GAAAGTTAAA AAAGAAATAG TAAGAAATAT ATATTTCATT GAA) fragment was purified using a 1 mL resource Q anion exchange chromatography and stored in a buffer of 2 M NaCl, 10 mM Tris.HCl (pH 7.5), 1 mM EDTA, 2 mM DTT at -20˚C.
ScCenp-A nucleosome and derivatives preparation
ScCenp-A, Cenp-A-L1Mut, ΔNCenp-A, H3N-Cenp-A and H3 histone octamers were wrapped by gradient dialysis from 2 M NaCl to 100 mM NaCl buffer with 10 mM Tris.HCl (pH 7.5), 1 mM EDTA and 2 mM DTT. ScCenp-A octamer was mixed with either 601 DNA or CEN3 DNA, at 7.8 μM concentration. The mixture in the dialysis tube was inserted into a 500 mL beaker containing 500 mL buffer of 2 M NaCl, 10 mM Tris.HCl (pH 7.5), 1 mM EDTA, 2 mM DTT. The NaCl concentration in the dialysis buffer was gradually decreased to 100 mM using an Akta pump at 1.5 mL min-1 for 16 hours at 4˚C. The mixture was further dialysed against the buffer of 100 mM NaCl, 10 mM Tris.HCl (pH 7.5), 1 mM EDTA, 2 mM DTT for 4 hours at 4°C. The ScCenp-A nucleosome and derivatives were stored at 4°C.
Reconstitution of CCAN−Cenp-A nucleosome complex
The CCAN–Cenp-A nucleosome complex was reconstituted by mixing purified Cenp-C and Cenp-LN with Cenp-A nucleosome followed by Cenp-HIK–TW and Cenp-OPQU+. The stoichiometry of CCAN sub-complexes to Cenp-ANuc was adjusted so that CCAN sub-complexes were in excess, as judged by their separation from CCAN–Cenp-ANuc by size exclusion chromatography. The mixed sample was dialysed over-night in a buffer of 10 mM Hepes (pH 8.0), 80 mM NaCl, 1 mM EDTA and 0.5 mM TCEP at 4˚C. CCAN–Cenp-ANuc was purified by Superose 6 size exclusion chromatography. For cryo-EM analysis, CCAN−Cenp-ANuc was cross-linked with 5 mM BS3 (Thermo Fisher Scientific) for one hour on ice and quenched with 50 mM Tris and then subjected to further size exclusion chromatography with an Agilent Bio SEC-5 column (Agilent Technologies) before preparing cryo-EM grids. Mild cross-linking of CCAN−Cenp-ANuc reduced dissociation of CCAN from Cenp-ANuc during preparation of cryo-EM grids. To assess whether cross-linked created artefacts, we also collected a cryo-EM data set using uncross-linked CCAN–Cenp-ANuc.
SEC analysis of CCAN−Cenp-ANuc complexes
To analyse the formation and stability of CCAN−Cenp-ANuc complexes and mutants in CCAN and Cenp-A, all CCAN−Cenp-ANuc complexes were assembled as above (with or without Cenp-C) and then applied to an Agilent Bio SEC-5 size exclusion chromatography column. The eluted fractions were analysed on SDS PAGE gels and stained with Coomassie Blue and ethidium bromide to detect proteins and DNA. For assembly of the CCAN−Cenp-ANuc complexes, the concentration of Cenp-ANuc was 1.6 μM, and that for the individual CCAN sub-complexes (1.6 μM).
Multi-angle light scattering
SEC-MALS was performed using a Wyatt MALS system. CCAN alone, uncross-linked and BS3 cross-linked CCAN−Cenp-ANuc complexes were injected onto an Agilent Bio SEC-5 column gel filtration column pre-equilibrated in 10 mM Hepes (pH 7.5), 80 mM NaCl, 1 mM EDTA and 0.5 mM TCEP. The light scattering and protein concentration at each point across the peaks in the chromatograph were used to determine the absolute molecular mass from the intercept of the Debye plot using Zimm’s model as implemented in the ASTRA v5.3.4.20 software (Wyatt Technologies). To determine inter-detector delay volumes, band-broadening constants and detector intensity normalization constants for the instrument, we used aldolase as a standard prior-to sample measurement. Data were plotted with the program PRISM v8.2.0 (GraphPad Software Inc.).
Analytical ultracentrifugation
Uncross-linked and BS3 cross-linked CCAN–Cenp-ANuc complex at approximately 1 mg/mL in 10 mM Hepes (pH 7.5), 80 mM NaCl, 1 mM EDTA and 0.5 mM TCEP were subjected to velocity sedimentation at 40,000 rpm at 4 ˚C in an An50Ti rotor using an Optima XL-I analytical ultracentrifuge (Beckmann). The data were analysed in SEDFIT 16.1 35 using a c(s) distribution model. The partial-specific volumes (v-bar) were calculated using Sednterp (v20130813 beta) (Dr Thomas Laue, University of New Hampshire). The density and viscosity of the buffer were determined with a DMA 4500M density meter (Anton Parr) and an AMVn viscometer (Anton Paar). Data were plotted with the program GUSSI 36.
Micrococcal nuclease digestion assay
Nucleosomes were digested for 40 min with 1 unit of MNase (NEB) per microgram of DNA at room temperature (22 °C). Reactions were terminated with the addition of excess EGTA. The digested nucleosome mixtures were loaded onto an agarose gel and stained to visualize the DNA.
Yeast strains and growth analysis
The S. cerevisiae strain with a chl4 deletion and cse4-R37A mutation (chl4Δ cse4-R37A), AEY4992 (MATα ade2-101 lys2 his3-11,15 trp1-1 leu2-3,112 ura3-1 can1-100 chl4∆::kanMX cse4-R37A) and wild type S. cerevisiae strain (W303) (MATα ade2-101 his3-11,15 trp1-1 leu2-3,112 ura3-1) were described and authenticated in 27,37. Yeast strains do not have mycoplasma and were not tested for mycoplasma contamination. Cenp-NWT and Cenp-NMut strains were created by transforming AEY4992 27,37 with a 2µ origin plasmid pYes2 incorporating either CHL4WT or chl4Mut (chl4K22/K26S/R67S/K100S/K103S/K105S/R198S/K217S/K245S/K249S/K384S/K401S/K403S) with CHL4’s native promoter, a C-terminal double StrepII-tag on Chl4, and the URA3 selection marker. The transformed cells were selected on synthetic media lacking uracil, and the presence of the plasmid-encoded CHL4 was verified by PCR using a primer pair over-spanning the CHL4 and URA3 genes. Cells were grown in drop-out uracil (SC-U) medium at 30°C and spotted in tenfold dilution steps on YPED plates. The plates were incubated at either 30°C or 37°C for three days.
Immunoprecipitation and Western blotting for detecting Cenp-N expression in the chl4Δ cse4-R37A yeast
Six litres of synthetic SC-U culture were inoculated with the chl4Δ cse4-R37A yeast strain transformed with the pYes2 plasmid expressing either wild type or mutant Cenp-N with a C-terminal double StrepII-tag (and empty vector control) and harvested at OD600 of ~0.8. Pelleted cells were lysed in buffer (50 mM Tris, pH 8.0, 300 mM NaCl, 1 mM EDTA, 1 mM DTT) and the cleared lysate was loaded onto a 1 mL Streptactin column. Fractions were eluted with 5 mM desthiobiotin and analysed by SDS PAGE. Western blotting was performed with an anti-Strep antibody (MCA2489P, Bio-Rad) that detected the C-terminal double StrepII-tag on Cenp-N. Total protein was analysed by Coomassie blue staining for loading controls (normalized loading).
Electron microscopy data collection
3.0 μl of the CCAN−Cenp-ANuc complex at a concentration of ~1 mg/mL was applied to glow-discharged copper 300 mesh Quantifoil R1.2/1.3 holey carbon grids (Quantifoil Micro Tools GmbH) (no carbon support). The grids were flash frozen by being plunged into liquid ethane using an FEI Vitrobot Mark IV (waiting time, 20 s, blotting time, 2 s). EM image stacks were collected with Falcon III cameras in counting mode on four different FEI Titan Krios electron microscopes at a nominal magnification of 75 K (yielding pixel sizes of 1.065Å, 1.070 Å, 1.085 Å, 1.090 Å, respectively). The images were recorded at a dose rate of 0.6 electrons per pixel per second and the total exposure time was 60 s (75 frames) with the FEI automated low-dose data-collection program EPU. Defocus varied from -2.0 to -2.8µm with an interval of 0.2 µm.
For the isolated Cenp-HIK sample, freshly purified Cenp-HIK complex was first visualized by negative-staining EM to check the sample quality. Aliquots of 3 µl samples at ~0.2 mg/mL were applied onto glow-discharged Quantifoil R1.2/1.3 300-mesh holey carbon grids. The grids were incubated for 30 s at 4 °C and 100% humidity and then blotted for 8 s and plunged into liquid ethane using an FEI Vitrobot III. Grids made in this way showed strong preferred orientation. To overcome this problem, we treated the Cenp-HIK complex with 0.025% glutaraldehyde for 10 min on ice before size exclusion chromatography purification. More views were observed after this treatment, allowing us to reconstruct the 3D structure.
For the isolated Cenp-HIK sub-complex, images were collected using EPU with a Falcon III detector in counting mode. 910 micrographs were collected using a dose rate of 0.5 electrons per pixel per second and a total exposure time of 60 s. Each micrograph was recorded into a movie stack of 75 frames. Calibrated physical pixel size is 1.38 Å/pixel.
Image processing
Movie frames were first aligned using MotionCor2 38. CTF parameters were estimated with Gctf 39. The initial template-free particle picking was performed with Gautomatch (developed by Kai Zhang, http://www.mrc-lmb.cam.ac.uk/kzhang/Gautomatch/). Subsequent image processing was carried out using RELION 2.1 and RELION 3.0 40,41. A subset of 556 micrographs (of 1582) was used for Gautomatch template-free particle picking, and the resulting 119,143 coordinates were imported into RELION 2.1 for particle extraction and reference-free 2D classification. Selected averages from the 2D classification were used for an initial model reconstruction with SIMPLE-PRIME 42. These 2D class averages were used for template-based particle auto-picking in Gautomatch for the entire dataset. The extracted particles were subject to two rounds of reference-free 2D classifications resulting in a dataset of 1,385,496 particles from the combined total of 9,002 micrographs. A tandem cascade of 3D classifications against the model built with SIMPLE-PRIME 42 was performed, and initial iterations were performed without angular search restriction for each round of classification. After removing the bad particles, 424,577 particles were assigned to CCAN, whereas 193,882 were assigned to the CCAN−Cenp-ANuc, which were used for the subsequent Baysian polishing, multi-body refinement, and the final map refinement and atomic coordinate refinement. Beam-tilt parameters of the particles were estimated based on the individual dataset, and they were applied during the Baysian polishing of each dataset in RELION 3.0. 3D refinements and multi-body refinements were performed with the polished particle stacks after merging all the datasets. The dataset including all the particles generated the highest resolution reconstruction with an overall CCAN mask. The final resolutions for CCAN and CCAN–Cenp-ANuc are 3.55 Å and 4.15 Å, respectively, based on the gold-standard FSC=0.143 criterion 43 (Extended Data Fig. 2d).
To identify dimeric CCAN-Cenp-ANuc particles, five 2D classes, whose 2D averages of CCAN-Cenp-ANuc (Extended Data Fig. 2c) showed smeared density in close proximity to Cenp-ANuc, were selected for further analyses. The selected particles (10, 553 particles) were subject to a tandem cassette of 2D classifications, resulting in 556 particles, which showed clear C2-symmetry 2D averages. These particles were re-extracted from the micrographs with a box size of 400 pixels to accommodate the bigger symmetric particles. The re-extracted particles were then subject to further 2D classification, and classified into 20 classes, generating the representative symmetric 2D averages shown in the red box of Extended Data Fig. 2c. The reprojections of the modelled dimeric-CCAN-Cenp-ANuc map (filtered to 20 Å resolution) were generated with relion_project. The projections are shown as Extended Data Fig. 10h. The small number of particles and highly preferred orientation on the EM grid (in the plane of the 2-fold symmetry axis) precluded a 3D reconstruction.
Multi-body refinement
To improve map resolution we performed multi-body refinement (MBR) in RELION 3.0 41. Two masks were generated. Mask1 comprised Cenp-LN-OPQU+, excluding Cenp-HIK. Mask2 comprised Cenp-HIK and portions of Cenp-N, L, O and P, (Extended Data Figs 2h, i and 3b). The resultant maps were determined at 3.45 Å and 3.83 Å resolution, respectively. To further improve regions at the periphery of Cenp-OPQU+, partial signal subtracted particles (Cenp-HIK subtracted) were used for a second round of multi-body refinement. Mask3 included part of Cenp-N and N-terminal regions of Cenp-Q, Cenp-U, Nkp1 and Nkp2 with small regions of Cenp-O and Cenp-P. Mask4 comprised Cenp-OP, Cenp-LN and C-terminal regions of Cenp-QU, Nkp1 and Nkp2. Multi-body refinement based on mask3 and mask4 resulted in 3.92 Å and 3.49 Å maps, respectively. The resultant maps derived using multi-body refinement based on the four masks showed significantly improved definition of EM densities and were used for model building (Extended Data Figs 2d, h, i and 3b). Careful choice of the boundaries of mask2 was critical to optimizing the EM density quality for Cenp-HIK. Including specific regions of Cenp-N, L, O and P within mask2 was critical to generating maps that allowed side chain definition of the coiled-coil regions of Cenp-H and Cenp-K (Extended Data Fig. 4a). This defined the correct assignment and polarity of these chains. MBR also improved definition of side chains in the base of Cenp-HIK. The subsequent multi-body refinement using mask3 and mask4 improved side chain definition for the peripheral regions of Cenp-OPQU+. Portions of the EM density map are shown in Extended Data Fig. 4. A 3D class (4% of total apo-CCAN) corresponding to dimeric apo-CCAN was determined at 10 Å resolution (Extended Data Fig. 3a).
For the uncross-linked dataset, the same procedures were applied. 123,215 particles from 1,586 micrographs were used for the final reconstruction of a map at 7.8 Å resolution for the CCAN–Cenp-ANuc complex (Extended Data Fig. 5a).
For the isolated Cenp-HIK complex, the same procedure was applied. 374,158 particles were used for the final reconstruction of a map at 4.3 Å resolution for Cenp-HIK complex.
Before visualization, a negative B factor determined with RELION 2.1 was applied to the density map for sharpening. The modulation transfer function (MTF) of the detector was corrected in the post-processing step with RELION 3.0 40. The local resolution was estimated with RELION 3.0 40.
Model building and structure refinement
Apo-CCAN
EM density maps were visualized in COOT44 and Chimera 45. The crystal structure of K. lactis Cenp-OPQ (PDB:5MU3) 46 (equivalent to S. cerevisiae Cenp-O residues 159 to 362, S. cerevisiae Cenp-P residues 148 to 361 and S. cerevisiae Cenp-Q residues 320 to 342) and structures of S. cerevisiae Cenp-N (residues 374 to 450), Cenp-L (PDB:4JE3) 47 and human Cenp-N N-terminal domain (NTD) (PDB: 6EQT) 29 (equivalent to residues 12 to 260 of S. cerevisiae Cenp-N) were fitted into the cryo-EM density maps of apo-CCAN, with refitting and mutating to the S. cerevisiae sequence for Cenp-NNTD, Cenp-O, Cenp-P and Cenp-Q. Based on the excellent quality of the EM densities, atomic models of Nkp1, Nkp2, Cenp-U, Cenp-Q, Cenp-H (residues 7 to 136), Cenp-I (residues 321 to 728) and Cenp-K (residues 4 to 128) and the inter-domain region of Cenp-N (residues 261 to 373) were built de novo. Only short stretches of Cenp-Q (residues 161 to 216) and Cenp-U (residues 131 to 155) were built as polyAla (Extended Data Table 2). The secondary-structural and disordered regions of the protein sequences were analysed with PHYRE2 48 and PSIPred 49. A model for the Cenp-HIK head domain was based on the crystal structure of regions of the Cenp-HIK assembly from C. thermophilum and T. terrestris (PDB 5Z08) 16 corresponding to S. cerevisiae Cenp-H (residues Asp143 to Ile181), Cenp-I (residues Leu5 to Ala241) and Cenp-K (residues Ala136 to Thr236) and derived using PHYRE2 48. The 3.5 Å monomeric free CCAN coordinates were rigid-body docked into the cryo-EM map The Cenp-HIK head domain was fitted to EM density of the dimeric apo-CCAN. A linker region that connects Cenp-NNTD with Cenp-NCTD, not present in crystal structures, was built de novo.
CCAN−Cenp-ANuc
The CCAN complex model was then fit into the CCAN–Cenp-ANuc cryo EM map. The nucleosome was modelled on the S. cerevisiae H3 nucleosome (PDB: 1ID3) 50 with S. cerevisiae Cenp-A modelled on H. sapiens Cenp-A (PDB: 3AN2) 22 and mutated to the S. cerevisiae Cenp-A sequence, and the 601 Widom DNA sequence (PDB: 3LZ0) 51. The Cenp-C model (PDB: 4X23) 30 in the centromeric nucleosome was rigid body-docked into the EM density.
The apo-CCAN and CCAN–Cenp-ANuc models (excluding the Cenp-HIK head domains) were optimized by several rounds of real-space refinement using PHENIX (phenix.real_space_refine) 52. Standard stereochemical and secondary structural constraints were applied during the real-space refinement. The final models were evaluated with COOT44, PHENIX52 and MolProbity (http://molprobity.biochem.duke.edu/) 53. Figures were prepared using ChimeraX 54, Chimera45, and PyMOL (Molecular Graphics System, 2.0.3, Schrodinger, LLC). Details of the fitted and refined coordinates in Extended Data Table 2. Multiple sequence alignments were performed and displayed using JALVIEW 55.
Cross-linking mass spectrometry analysis
To assess the validity of our structure, we performed cross-linking mass spectrometry (XL-MS) analysis of the complexes 56. Three independent crosslinking reactions were performed for each sample. The CCAN or CCAN–Cenp-ANuc complexes in 20 mM HEPES pH 7.5, 80 mM NaCl and at a concentration of 3 mg/mL were crosslinked with 1 mM DSSO for 15 min at room temperature. Each reaction was quenched with Tris.HCl (pH 8.0) to 50 mM and supplemented with urea to 8 M. The samples were reduced by addition of DTT at a final concentration of 10 mM for 1 hour at room temperature, and alkylated for 0.5 hour at room temperature in the dark by addition of iodoacetamide to 50 mM. Protein digestion was performed with Lys-C at an enzyme-to-protein ratio of 1:75 (w/w) at 30 °C for 3 hours, then the samples were diluted in 50 mM ammonium bicarbonate and further digested with trypsin at an enzyme-to-protein ratio of 1:75 (w/w) at 37 °C for 16 hours. The digested samples were acidified with formic acid to 1%, desalted using home-made C18 stage tips, dried and stored at −80 °C for further use.
Each sample was analysed by LC-MS/MS using an Agilent 1290 Infinity System (Agilent Technologies) in combination with an Orbitrap Fusion Lumos (Thermo Scientific). Reverse phase chromatography was carried out using a 100-μm inner diameter 2-cm trap column (packed in-house with ReproSil-Pur C18-AQ, 3 μm) coupled to a 75-μm inner diameter 50 cm analytical column (packed in-house with Poroshell 120 EC-C18, 2.7 μm) (Agilent Technologies). Mobile-phase solvent A consisted of 0.1% formic acid in water, and mobile-phase solvent B consisted of 0.1% formic acid in 80% acetonitrile. A 180 min gradient was used, and start and end percentage buffer B adjusted to maximize the samples separation.
MS acquisition was performed using the MS2_MS3 strategy: the MS1 scan was recorded in Orbitrap at a resolution of 60000, the selected precursors were fragmented in MS2 with CID and the crosslinker signature peaks recorded at a resolution of 30000. The fragments displaying the mass difference specific for DSSO were further fragmented in a MS3 scan in the ion trap (IT) 57. Each sample was analysed with Proteome Discoverer 2.3 (version 2.3.0.522) with the XlinkX nodes integrated 57 and searching against databases generated after bottom-up analysis of the samples. The crosslink output (Supplementary Tables 1 and 2) was subsequently visualized using the xVis 58 web tool and the crosslinks mapped onto the cryo-EM structures of CCAN and CCAN–Cenp-A using PyMOL (Molecular Graphics System, 2.0.3, Schrodinger, LLC) (Extended Data Fig. 6e-g). The cross-linking mass spectrometry raw files, the associated output and databases are deposited through the ProteomeXchange Consortium 59.
Modelling the CCAN–Cenp-ANuc–CBF3–Cen3 complex
To model CCAN and CBF3 simultaneously bound to the Cenp-A nucleosome, we docked the free unwrapped DNA duplex of the CCAN–Cenp-ANuc complex onto the CBF3–Cen3 coordinates (PDB: 6GYS) 60, matching the minor and major grooves of both complexes. To avoid overlap of CBF3 and CCAN, the dyad symmetry axis of the Cenp-A nucleosome is positioned seven nucleotides upstream of the midpoint of CDEII of the Cen3 sequence.
Modelling H. sapiens and S. pombe Cenp-LN complexes
To generate the H. sapiens Cenp-LN complex we used residues 1-207 from PDB 6EQT 29, and modelled residues 208-338 and Cenp-N by one-to-one threading in PHYRE2 48 using S. cerevisiae Cenp-LN as a template. S. pombe Cenp-LN was modelled with PHYRE2 48 using S. cerevisiae Cenp-LN as a template. The electrostatic potential of S. cerevisiae, S. pombe and H. sapiens Cenp-LN complexes were calculated and displayed in PyMOL (Molecular Graphics System, 2.0.3, Schrodinger, LLC).
Extended Data
Extended Data Figure 1. Reconstituted S. cerevisiae CCAN–Cenp-ANuc complexes.
a, Size exclusion chromatogram profiles (Agilent Bio SEC-5 column) for (i) CCAN, (ii) CCAN–Cenp-A nucleosome (with 601) complex, (iii) Cenp-A nucleosome (with 601), (iv) H3 nucleosome (with 601) and (v) H3N-Cenp-ANuc (with 601). b, Comparative size exclusion chromatogram profiles (Agilent Bio SEC-5 column) for CCAN–Cenp-ANuc with the Cenp-A nucleosome wrapped with either the (i) 147 bp Widom 601 positioning sequence (CCAN–Cenp-ANuc (601) – as in (a)) or (ii) a 153 bp S. cerevisiae centromeric Cen3 sequence (CCAN–Cenp-ANuc (Cen3)). Both complexes eluate at the same volume. CCAN and the H3 nucleosome do not form a complex (iii). c, Coomassie blue-stained SDS PAGE gel of the 14 subunit CCAN complex. d, Coomassie blue-stained SDS PAGE gel of Cenp-ANuc (601). Lane E32: Ethidium bromide stained gel of fraction 32. e, CCAN–Cenp-ANuc (601) complex. Lane E13: Ethidium bromide stained gel of fraction 13. SEC chromatograms in (a). f, SDS PAGE gel of CCAN and H3 nucleosome (601) SEC run shown in (b). g-j, Coomassie blue-stained SDS PAGE gels of various Cenp-H, I and K segments co-expressed with Cenp-TW and purified with a double Strep tag on the tagged Cenp-I subunit, indicated by *. j, Shows that the HFDs of Cenp-TW (Cenp-THFDW) interacts with the Cenp-HIKHead. These results confirm the assignments of the Cenp-H, K and I subunits in our cryo-EM maps. k, Schematic of the organization of CCAN–Cenp-ANuc subunits and sub-complexes and connections to the outer kinetochore Mis12 and Ndc80 complexes. Lines indicate sub-complex connections. The two pathways connecting Cenp-ANuc to the Ndc80 complex and microtubules are indicated as P1 and P2 (thick lines to Ndc80). Subunits of the essential P1 pathway are labelled black and indicated with blue shading, whereas subunits of the non-essential P2 pathway are labelled white and indicated with yellow shading. The P2 pathway becomes essential when the P1 pathway is defective through defects in Dsn1 phosphorylation 9. The experiments shown in a-j were performed independently in triplicate with similar results. For gel source data see Supplementary Fig. 1.
Extended Data Figure 2. Cryo-EM data of the S. cerevisiae CCAN–Cenp-ANuc complex.
a, A typical cryo-electron micrograph of CCAN–Cenp-ANuc, representative of 9,002 micrographs. b, Galleries of 2D classes of CCAN, representative of 100 2D classes. c, Galleries of 2D classes of CCAN–Cenp-ANuc, representative of 150 2D classes. Outlined in red are 2-D class averages for the C2-symmetric dimeric CCAN-Cenp-ANuc complex viewed in the plane of the C2-symmetry axis. Only a few views were observed, precluding a 3D reconstruction. Cryo-EM grids partially destabilize CCAN – Cenp-ANuc interactions, resulting in a very low abundance of dimeric CCAN–Cenp-ANuc particles (~0.03% of total). The two-fold symmetry axes of the dimeric CCAN-Cenp-ANuc complex are shown as dashed arrows. Experiments for data in b and c were performed independently twelve times with similar results. d, Fourier shell correlation (FSC) curves shown for the cryo-EM reconstructions of CCAN–Cenp-ANuc complexes: apo CCAN, mask1 (Cenp-OPQU+, Cenp-LN), mask2 (Cenp-HIK, Cenp-LN, sub-Cenp-OP), CCAN–Cenp-ANuc. Mask1 and mask2 used for multi-body refinement are defined in (h) and (i) in and Methods. e, Angular distribution plot of CCAN–Cenp-ANuc particles. f, Local resolution map of CCAN. g, Local resolution map of CCAN–Cenp-ANuc. h, Local resolution map of mask1 (Cenp-OPQU+, Cenp-LN). i, Local resolution map of mask2 (Cenp-HIK, Cenp-LN, sub-Cenp-OP).
Extended Data Figure 3. Workflow of 3D classification of the CCAN–Cenp-ANuc cryo-EM data set.
a, After initial 2D classification ~1.4 million particles were sorted by 3D classification into apo CCAN (52%) and the CCAN–Cenp-ANuc complex (48%). For apo CCAN, 4% existed as dimers (black box) and 19% showed an ordered head-group (Cenp-HIKHead) for the Cenp-HIK–TW sub-complex (blue box). A mask was applied to the CCAN–Cenp-ANuc EM map to exclude the structurally variable Cenp-HIKHead domain for reconstruction of the 4.15 Å structure. b, Details of the four masks used for multi-body refinement. c, A small 3D class of CCAN–Cenp-ANuc revealing density attached to Cenp-HIKHead contacting the DNA gyre of Cenp-ANuc was assigned as Cenp-THFDW.
Extended Data Figure 4. Cryo-EM density maps of apo CCAN.
a, Portion of cryo-EM map for the coiled coils of Cenp-H and Cenp-K. A selection of highly conserved intersubunit residues defined in (b, c) are labelled. These residues are well defined in EM density, consistent with the structure. b, c, Multiple sequence alignment of the coiled-coil regions of b, Cenp-H and c, Cenp-K. d-f, Portions of cryo-EM maps for: d, Cenp-LN. e, Cenp-I. f, Nkp1-Nkp2. The chain assignments and polarity of Cenp-H, Cenp-I and Cenp-K of our structure agree with the cryo-EM structure of yeast Ctf3 (PDB 6OUA) 61.
Extended Data Figure 5. Cryo-EM densities of CCAN and CCAN–Cenp-ANuc complexes.
a, Cryo-EM reconstruction of CCAN–Cenp-ANuc from uncross-linked sample at 8.6 Å resolution. b, Cryo-EM map of dimeric CCAN (also Extended Data Fig. 3a - black box). Subunits are colour-coded as in Fig. 1. The 3.5 Å monomeric free CCAN coordinates were rigid-body docked into the cryo-EM map. c, Cartoon representation of the S. cerevisiae MIND complex 15 (right) showing a striking similarity to the coiled coils of Cenp-QU-Nkp1-Nkp2 of CENP-OPQU+ (left). d, View of the 4.7 Å resolution cryo-EM map of free Cenp-HIK with fitted coordinates from CCAN. e, In the context of CCAN, Cenp-HIKHead rotates to accommodate Cenp-ANuc. The two conformations of Cenp-HIK from the apo CCAN and CCAN–Cenp-ANuc complexes were superimposed onto their rigid portion of Cenp-HIK (C-terminal region of Cenp-I – shown for apo CCAN) to indicate the conformational variability of Cenp-HIKHead between the two states. Subunits of Cenp-HIKHead of CCAN–Cenp-ANuc are coloured lighter. f, Cryo-EM density of Cenp-ANuc showing the Cenp-C motif of Cenp-C.
Extended Data Figure 6. Cross-linking mass spectrometry analysis of the CCAN and CCAN–Cenp-ANuc complexes.
a, b, Circular plots displaying all the identified cross-links for CCAN (a) and CCAN–Cenp-ANuc (b). Inter- and intra-subunit cross-links are indicated in red and blue, respectively c, d, Histogram plots showing the Cα-Cα distance distribution of the cross-links that could be mapped onto the CCAN (c), and CCAN–Cenp-ANuc structures (d). 95% of the mapped cross-links satisfy the cross-linker imposed distance restraint of 30 Å indicated with a dashed red line. e, f, Cross-links mapped onto the CCAN (e) and CCAN–Cenp-ANuc complex (f). Inter and intra-subunit cross-links are indicated in red and blue, respectively. Cross-links exceeding the cross-linker imposed distance restraint of 30 Å are indicated in yellow. g, Residues on CCAN shown by XL-MS that cross-link with Cenp-C are indicated on the CCAN structure. Red spheres: cross-links in the CCAN–Cenp-ANuc complex. Yellow spheres: additional cross-links unique to apo CCAN. The experiments shown in a and b were performed independently in triplicate with similar results.
Extended Data Figure 7. The S. cerevisiae Cenp-ANuc nucleosome is unwrapped.
a-c, The positively-charged electrostatic potential of the DNA-binding groove of Cenp-LN sub-complex is conserved in S. cerevisiae, S. pombe and H. sapiens. S. pombe and H. sapiens are modelled structures. d, Cenp-N interacts with ScCenp-ANuc in the context of CCAN differently from the interaction of free human Cenp-N with Cenp-ANuc. The Cenp-N subunit of the human Cenp-N–Cenp-A nucleosome structure (PDB: 6C0W 29) was superimposed onto Cenp-N of the S. cerevisiae CCAN–Cenp-ANuc structure. In this mode of Cenp-N–Cenp-ANuc interactions, Cenp-ANuc would clash with Cenp-OPQU+ and Cenp-N of CCAN. e, Structure ScH3Nuc (PDB: 1ID3 24) and f, Cenp-ANuc (this work). g, sequence alignment of the N-terminal regions of ScH3 and Cenp-A (Cse4) histones. For the chimeric H3N-Cenp-ANuc, residues 1-50 of ScH3 were substituted for residues 1-140 of ScCenp-A. A similar approach was used for vertebrate Cenp-ANuc 23.
Extended Data Figure 8. SDS PAGE gels of CCANΔCenp-C–Cenp-ANuc complexes.
a-h, Coomassie-blue stained SDS PAGE gels of various CCANΔCenp-C–Cenp-ANuc complexes. Corresponding SEC chromatogram is shown in Fig. 4b and Extended Data Fig. 9a. a, b, Mutating the Cenp-N DNA binding groove did not impair CCANΔCenp-C assembly. c, Wild type CCANΔCenp-C forms a complex with Cenp-ANuc. d, Mutating the Cenp-N DNA binding groove disrupts CCANΔCenp-C – Cenp-ANuc interactions. e, Mutating the L1 loop of Cenp-A did not destabilize CCANΔCenp-C – Cenp-ANuc interactions. f, Deletion of the N-terminus of Cenp-A (1-129) (ΔNCenp-ANuc) did not impair CCANΔCenp-C – Cenp-ANuc interactions. h, Both CCANΔCenp-C and CCANΔCenp-C-Cenp-NMut bound poorly to H3N-Cenp-ANuc. The experiments shown were performed independently in triplicate with similar results. For gel source data see Supplementary Fig. 1.
Extended Data Figure 9. Testing of CCANΔCenp-C binding to Cenp-ANuc.
a, Comparative size exclusion chromatogram profiles (Agilent Bio SEC-5 column) for wild type CCANΔCenp-C and the Cenp-NMut of CCANΔCenp-C to Cenp-ANuc and its modifications (Cenp-ANuc-L1Nuc, ΔNCenp-ANuc, H3N-Cenp-ANuc) and H3Nuc. Mutating the L1 loop (Cenp-A-L1Nuc) of Cenp-A or deletion of the N-terminal 129 residues (ΔNCenp-ANuc) did not destabilize CCANΔCenp-C – Cenp-ANuc interactions. In contrast, CCAN with the Cenp-NMut bound less well and both CCAN and CCAN-Cenp-NMut bound hardly at all to H3N-Cenp-ANuc. (CCANΔC = CCANΔCenp-C). Associated SDS PAGE gels in Extended Data Fig. 8 and Extended Data Fig. 9b). b, Coomassie-blue stained SDS PAGE gel showed that CCANΔCenp-C did not associated with H3Nuc. c, Micrococcal nuclease digestion of Cenp-ANuc, H3Nuc and H3N-Cenp-ANuc. 601 DNA is shown as a control. The H3Nuc and H3N-Cenp-ANuc protect a similar and longer length of DNA compared with Cenp-ANuc. d, Model of CBF3 60 bound to CCAN–Cenp-ANuc indicating that CBF3 would not associate with a fully assembled kinetochore, consistent with proteomic data 62. The experiments shown in a-c were performed independently in triplicate with similar results. For gel source data see Supplementary Fig. 1.
Extended Data Figure 10. S. cerevisiae CCAN–Cenp-ANuc comprises two CCAN complexes in solution.
The predicted mass of (CCAN)2–Cenp-ANuc is 1.31 MDa, (CCAN)1–Cenp-ANuc is 0.77 MDa and that for a CCAN dimer 1.09 MDa (Extended Data Table 2). Representative SEC-MALS data for a, cross-linked S. cerevisiae CCAN–Cenp-ANuc complex, run independently in triplicate with similar results, average molecular mass is 1.23 MDa [(CCAN)2–Cenp-ANuc]. b, uncross-linked S. cerevisiae CCAN–Cenp-ANuc complex, run independently in triplicate with similar results, with average masses of 1.38 MDa [(CCAN)2–Cenp-ANuc] and 526 kDa [(CCAN)1]. c, S. cerevisiae CCAN alone, run independently in duplicate with similar results, with average masses of 839 kDa for the leading edge (green) and 650 kDa for the trailing edge (magenta) suggesting a non-resolved monomer-dimer equilibrium. Velocity analytical ultracentrifugation of d, cross-linked and e, uncross-linked S. cerevisiae CCAN–Cenp-ANuc complexes with residuals to the fits below of a c(s) distribution model: f, for the cross-linked complex, the major species sediments at 15.8 S (Sw,20 = 26.1 S) with a minor species at 12.1 S (Sw,20 = 20.0 S) that corresponds to calculated masses of 1.34 MDa [(CCAN)2–Cenp-ANuc] and 896 kDa [possibly (CCAN)1–Cenp-ANuc] respectively with a fitted value of 1.761 for the frictional ratio; g, for uncross-linked samples, the major species is resolved into two species that sediment at 14.3 S (Sw,20 = 22.6 S) and 15.7 S (Sw,20 = 24.9 S) with a minor species at 12.3 S (Sw,20 = 19.4 S) which gave masses of 1.32 MDa [(CCAN)2–Cenp-ANuc] and 1.15 MDa [(CCAN)2] for the major species and 716 kDa [(CCAN)1–Cenp-ANuc] for the minor species. The experiments shown in d-g were performed independently in triplicate with similar results. h, Examples of two 2D class averages showing the dimeric CCAN–Cenp-ANuc particles viewed in the plane of the C2 symmetry axis (red outline) (data from Extended Data Fig. 2c) and the 2D reprojections of a modelled dimeric CCAN–Cenp-ANuc based on the CCAN–Cenp-ANuc cryo-EM reconstruction (yellow outline) (Extended Data Fig. 10i). There is a close correspondence in shape and dimensions between the calculated reprojections and the observed 2D classes. The two-fold symmetry axes of the dimeric CCAN-Cenp-ANuc complex are shown as dashed arrows. i, j, Two alternative models for how CCAN assembled onto a Cenp-A nucleosome would interact with the outer kinetochore–microtubule interface (Supplementary Video 2). i, In scenario (1), CCAN interacts with the outer kinetochore from the same side as the DNA-binding surface. Microtubules attached to the outer kinetochore would hoist CCAN from below the over-lying nucleosome and out-stretched DNA. j, In scenario (2), the microtubule-outer kinetochore interface contacts CCAN from the opposite side to the CCAN-DNA binding surface. Outer-KT (outer-kinetochore): KMN network and microtubule attachment complexes: Dam1/DASH (budding yeast) and Ska proteins of vertebrates. The combined dimension of dimeric CCAN–Cenp-ANuc (32 nm) matches that of the hub at the centre of the yeast kinetochore 63.
Extended Data Table 1. Cryo-EM data collection, refinement and validation statistics.
| CCAN (EMDB -4580) (PDB 6QLE) |
CCAN–Cenp-ANuc (EMDB-4579) (PDB 6QLD) |
Mask1 (EMDB-4581) (PDB 6QLF) |
Mask2 (EMDB-4971) |
|
|---|---|---|---|---|
| Data collection and processing | ||||
| Magnification | 75,000 | 75,000 | 75,000 | 75,000 |
| Voltage (kV) | 300 | 300 | 300 | 300 |
| Electron exposure (e–/Å2) | 32 | 32 | 32 | 32 |
| Defocus range (μm) | 2.0-2.8 | 2.0-2.8 | 2.0-2.8 | 2.0-2.8 |
| Pixel size (Å) | 1.09 | 1.09 | 1.09 | 1.09 |
| Symmetry imposed | C1 | C1 | C1 | C1 |
| Initial particle images (no.) | 1,796,016 | 1,796,016 | 1,796,016 | 1,796,016 |
| Final particle images (no.) | 618,459 | 193,882 | 618,459 | 618,459 |
| Map resolution (Å) | 3.55 | 4.15 | 3.45 | 3.83 |
| FSC threshold | 0.143 | 0.143 | 0.143 | 0.143 |
| Map resolution range (Å) | 3.0-5.5 | 3.5-7.0 | 3.0-5.5 | 3.0-5.5 |
| Refinement | ||||
| lnitial model used (PDB code) | 5MU3, 6EQT, 4JE3, 5W94 | 3AN2, 4X23, 5MU3, 6EQT, 4JE3, 5W94 | 5MU3, 6EQT, 4JE3, 5W94 | 5MU3, 6EQT, 4JE3, 5W94 |
| Model resolution (Å) | 3.5 | 4.0 | 3.3 | - |
| 0.143 FSC threshold | ||||
| Model resolution range (Å) | 50 - 3.0 | 50 - 3.6 | 50 - 3.0 | - |
| Map sharpening B factor (Å2) | -139 | -108 | -135 | -172 |
| Model composition | ||||
| Non-hydrogen atoms | 18,058 | 29,183 | 13,541 | - |
| Protein residues | 2,401 | 3,172 | 1,790 | - |
| Ligands | 0 | 248 | 0 | - |
| B factors (Å2) | ||||
| Protein | 78.6 | 82.2 | 67.2 | - |
| Ligand | - | 245.8 | - | - |
| R.m.s. deviations | ||||
| Bond lengths (Å) | 0.004 | 0.004 | 0.005 | - |
| Bond angles (°) | 0.798 | 0.793 | 0.828 | - |
| Validation | ||||
| MolProbity score | 1.39 | 1.57 | 1.45 | - |
| Clashscore | 2.78 | 4.80 | 2.99 | - |
| Poor rotamers (%) | 0.11 | 0.08 | 0.19 | - |
| Ramachandran plot | ||||
| Favored (%) | 95.30 | 94.78 | 94.76 | - |
| Allowed (%) | 4.60 | 5.02 | 5.04 | - |
| Disallowed (%) | 0.10 | 0.20 | 0.20 | - |
Extended Data Table 2. Table of CCAN subunits.
Details of structured regions of CCAN subunits built into the cryo-EM density maps are indicated, including regions built as polyAla. The calculated molecular masses for CCAN and Cenp-ANuc complexes are (i) CCAN: 543.3 kDa, (ii) CCAN dimer: 1.09 MDa, (iii) Cenp-ANuc: 223 kDa, (iv) (CCAN)1−Cenp-ANuc: 0.766 MDa and (v) (CCAN)2−Cenp-ANuc 1.31 MDa.
| Subunit | S.c. name | Length | Mol. Mass kDa | Domain/Region 1 | Domain/Region 2 | Domain/Region 3 | Disordered regions | Sequence built as polyA |
|---|---|---|---|---|---|---|---|---|
| ScCenp-A nucleosome | ||||||||
| Cenp-A | Cse4 | 229 | 26.8 | α-helix and disordered 1-131 | Histone fold 132-229 PDB 3AN2 Hs Cenp-A |
- | 1-111, 131-136,227-229 | 112-130 |
| H2A | 132 | 14.0 | Histone fold PDB 1ID3 Sc H2A |
- | - | - | - | |
| H2B | 132 | 14.2 | Histone fold PDB 1ID3 Sc H2A |
- | - | - | - | |
| H4 | 103 | 11.4 | Histone fold PDB 1ID3 Sc H2A |
- | - | - | - | |
| 601 DNA | 147 bp | 90.6 | ||||||
| Cenp-C | Mif2 | 549 | 62.5 | Cenp-C motif 283-304 PDB 4X23 |
Cupin fold 365-530 |
- | 1-283,306-549 | - |
| Cenp-HIK-TW complex (ScCtf3 complex + Cenp-TW) | ||||||||
| Cenp-H | Mcm16 | 181 | 21.1 | α-helix: De
novo 4-136 |
α-helix: PDB 5Z07 Ct Cenp-I 143-181 |
- | 1-3,41-44,75-78,137-142 | - |
| Cenp-I | Ctf3 | 733 | 84.3 | Heat repeats PDB 5Z07 Ct Cenp-I 5-241 |
Heat repeats: De novo | - | 242-332,526-531,597-601,620-624,657-663,677-689 | 321-330,664-676 |
| Cenp-K | Mcm22 | 239 | 27.6 | α-helix: De
novo 7-128 |
α-helix: PDB 5Z07 Ct Cenp-I 143-236 |
- | 1-6,42-49,61-68,129-142 | - |
| Cenp-T | Cnn1 | 361 | 41.3 | Histone fold | ND | ND | ||
| Cenp-W | Wip1 | 98 | 10.2 | Histone fold | ND | ND | ||
| Cenp-LN complex | ||||||||
| Cenp-L | lml3 | 245 | 28.0 | α/β fold PDB 4JE3 Sc Cenp-L |
- | - | - | - |
| Cenp-N | Chl4 | 458 | 52.7 | Pyrin (1-102) Cenp-N fold (103-262) PDB 6EQT Hs Cenp-N |
Cenp-N linker domain de novo (262-373) |
Dimerization (375-468) PDB 4JE3 Sc Cenp-N |
1-4,47-50,166-192,310-316,338-373,452-458 | - |
| Cenp-OPQU+ complex (ScCOMA+ complex) | ||||||||
| Cenp-O | Mcm21 | 368 | 43.0 | RWD PDB 5MU3 Kl Ctf19 |
- | - | 1-152,332-338 | - |
| Cenp-P | Ctf19 | 369 | 42.8 | RWD PDB 5MU3 Kl Ctf19 |
- | - | 1-96,111-123,286-292,308-313 | 97-110 |
| Cenp-Q | Okp1 | 406 | 47.4 | α-helix: De novo | - | - | 1-160,220-228,304-319,392-406 | 161-219 |
| Cenp-U | Ame1 | 324 | 37.5 | α-helix: De novo | - | - | 1-130,157-165,267-276 | 131-156 |
| Nkp1 | Nkp1 | 238 | 27.0 | α-helix: De novo | - | - | 1,124-135 | 24-32,217-238 |
| Nkp2 | Nkp2 | 153 | 17.9 | α-helix: De novo | - | - | 1-2,25-35 | 133-153 |
Supplementary Material
Acknowledgments
This work was funded by MRC grant (MC_UP_1201/6) and CR-UK grant (C576/A14109) to D.B and Horizon 2020 program INFRAIA project Epic-XS (Project 823839) to A.J.R.H. and Deutsche Forschungsgemeinschaft (EH237/12-1) to A. E.-M. We are grateful to the LMB, eBIC and the Universities of Cambridge and Leeds EM facilities for help with the EM data collection, S. Scheres for help with EM processing, members of the Barford group for useful discussions, J. Grimmett and T. Darling for computing and J. Shi for help with insect cell expression.
Footnotes
Data availability and accession codes. EM maps are deposited with EMDB with accession codes EMD-4580 (CCAN), EMD-4579 (CCAN-Cenp-ANuc), EMD-4581 (Mask1) and EMD-4971 (Mask2). Protein coordinates are deposited with RCSB with accession codes 6QLE (CCAN), 6QLD (CCAN-Cenp-ANuc) and 6QLF (Mask1). The cross-linking mass spectrometry raw files, the associated output and databases are deposited through the ProteomeXchange Consortium via the PRIDE partner repository with the dataset identifier PXD013769. Other data are available upon reasonable request.
Author contributions. Z.Z. cloned kinetochore and nucleosome constructs. J.Y. and Z.Z. purified proteins, performed the protein complex reconstitutions and biochemical and genetic analysis. K.Y. and L.C. prepared EM grids, collected and analysed electron microscopy data and determined the three dimensional reconstructions of CCAN–Cenp-ANuc and free Cenp-HIK, respectively. D.B. and K.Y. fitted coordinates, built models, J.Y. and S.H.M. performed SEC-MALS and AUC. D.F. collected and analysed cross-linking mass spectrometry data. A.J.R.H. directed cross-linking mass spectrometry experiments and analysis. A.E.-M. generated the chl4Δ cse4-R37A and chl4Δ yeast strains. D.B. directed the project. K.Y. and D.B. wrote the manuscript with help from all authors.
Author information. We declare that none of the authors have competing financial or non-financial interests.
References
- 1.Earnshaw WC, Rothfield N. Identification of a family of human centromere proteins using autoimmune sera from patients with scleroderma. Chromosoma. 1985;91:313–321. doi: 10.1007/BF00328227. [DOI] [PubMed] [Google Scholar]
- 2.Meluh PB, Yang P, Glowczewski L, Koshland D, Smith MM. Cse4p is a component of the core centromere of Saccharomyces cerevisiae. Cell. 1998;94:607–613. doi: 10.1016/s0092-8674(00)81602-5. [DOI] [PubMed] [Google Scholar]
- 3.Cheeseman IM. The kinetochore. Cold Spring Harbor perspectives in biology. 2014;6 doi: 10.1101/cshperspect.a015826. a015826. [DOI] [PMC free article] [PubMed] [Google Scholar]
- 4.Musacchio A, Desai A. A Molecular View of Kinetochore Assembly and Function. Biology. 2017;6 doi: 10.3390/biology6010005. [DOI] [PMC free article] [PubMed] [Google Scholar]
- 5.Clarke L, Carbon J. Isolation of a yeast centromere and construction of functional small circular chromosomes. Nature. 1980;287:504–509. doi: 10.1038/287504a0. [DOI] [PubMed] [Google Scholar]
- 6.Winey M, et al. Three-dimensional ultrastructural analysis of the Saccharomyces cerevisiae mitotic spindle. The Journal of cell biology. 1995;129:1601–1615. doi: 10.1083/jcb.129.6.1601. [DOI] [PMC free article] [PubMed] [Google Scholar]
- 7.Furuyama S, Biggins S. Centromere identity is specified by a single centromeric nucleosome in budding yeast. Proceedings of the National Academy of Sciences of the United States of America. 2007;104:14706–14711. doi: 10.1073/pnas.0706985104. [DOI] [PMC free article] [PubMed] [Google Scholar]
- 8.Camahort R, et al. Cse4 is part of an octameric nucleosome in budding yeast. Molecular cell. 2009;35:794–805. doi: 10.1016/j.molcel.2009.07.022. [DOI] [PMC free article] [PubMed] [Google Scholar]
- 9.Lang J, Barber A, Biggins S. An assay for de novo kinetochore assembly reveals a key role for the CENP-T pathway in budding yeast. eLife. 2018;7 doi: 10.7554/eLife.37819. [DOI] [PMC free article] [PubMed] [Google Scholar]
- 10.Hinshaw SM, Harrison SC. The structure of the Ctf19c/CCAN from budding yeast. eLife. 2019;8 doi: 10.7554/eLife.44239. [DOI] [PMC free article] [PubMed] [Google Scholar]
- 11.McKinley KL, et al. The CENP-L-N Complex Forms a Critical Node in an Integrated Meshwork of Interactions at the Centromere-Kinetochore Interface. Molecular cell. 2015;60:886–898. doi: 10.1016/j.molcel.2015.10.027. [DOI] [PMC free article] [PubMed] [Google Scholar]
- 12.Pesenti ME, et al. Reconstitution of a 26-Subunit Human Kinetochore Reveals Cooperative Microtubule Binding by CENP-OPQUR and NDC80. Molecular cell. 2018;71:923–939 e910. doi: 10.1016/j.molcel.2018.07.038. [DOI] [PMC free article] [PubMed] [Google Scholar]
- 13.Schmitzberger F, Harrison SC. RWD domain: a recurring module in kinetochore architecture shown by a Ctf19-Mcm21 complex structure. EMBO reports. 2012;13:216–222. doi: 10.1038/embor.2012.1. [DOI] [PMC free article] [PubMed] [Google Scholar]
- 14.Dimitrova YN, Jenni S, Valverde R, Khin Y, Harrison SC. Structure of the MIND Complex Defines a Regulatory Focus for Yeast Kinetochore Assembly. Cell. 2016;167:1014–1027 e1012. doi: 10.1016/j.cell.2016.10.011. [DOI] [PMC free article] [PubMed] [Google Scholar]
- 15.Petrovic A, et al. Structure of the MIS12 Complex and Molecular Basis of Its Interaction with CENP-C at Human Kinetochores. Cell. 2016;167:1028–1040 e1015. doi: 10.1016/j.cell.2016.10.005. [DOI] [PMC free article] [PubMed] [Google Scholar]
- 16.Hu L, et al. Structural analysis of fungal CENP-H/I/K homologs reveals a conserved assembly mechanism underlying proper chromosome alignment. Nucleic acids research. 2019;47:468–479. doi: 10.1093/nar/gky1108. [DOI] [PMC free article] [PubMed] [Google Scholar]
- 17.Pekgoz Altunkaya G, et al. CCAN Assembly Configures Composite Binding Interfaces to Promote Cross-Linking of Ndc80 Complexes at the Kinetochore. Current biology : CB. 2016;26:2370–2378. doi: 10.1016/j.cub.2016.07.005. [DOI] [PubMed] [Google Scholar]
- 18.Guse A, Carroll CW, Moree B, Fuller CJ, Straight AF. In vitro centromere and kinetochore assembly on defined chromatin templates. Nature. 2011;477:354–358. doi: 10.1038/nature10379. [DOI] [PMC free article] [PubMed] [Google Scholar]
- 19.Carroll CW, Silva MC, Godek KM, Jansen LE, Straight AF. Centromere assembly requires the direct recognition of CENP-A nucleosomes by CENP-N. Nature cell biology. 2009;11:896–902. doi: 10.1038/ncb1899. [DOI] [PMC free article] [PubMed] [Google Scholar]
- 20.Carroll CW, Milks KJ, Straight AF. Dual recognition of CENP-A nucleosomes is required for centromere assembly. The Journal of cell biology. 2010;189:1143–1155. doi: 10.1083/jcb.201001013. [DOI] [PMC free article] [PubMed] [Google Scholar]
- 21.Kingston IJ, Yung JS, Singleton MR. Biophysical characterization of the centromere-specific nucleosome from budding yeast. The Journal of biological chemistry. 2011;286:4021–4026. doi: 10.1074/jbc.M110.189340. [DOI] [PMC free article] [PubMed] [Google Scholar]
- 22.Tachiwana H, et al. Crystal structure of the human centromeric nucleosome containing CENP-A. Nature. 2011;476:232–235. doi: 10.1038/nature10258. [DOI] [PubMed] [Google Scholar]
- 23.Roulland Y, et al. The Flexible Ends of CENP-A Nucleosome Are Required for Mitotic Fidelity. Molecular cell. 2016;63:674–685. doi: 10.1016/j.molcel.2016.06.023. [DOI] [PubMed] [Google Scholar]
- 24.White CL, Suto RK, Luger K. Structure of the yeast nucleosome core particle reveals fundamental changes in internucleosome interactions. The EMBO journal. 2001;20:5207–5218. doi: 10.1093/emboj/20.18.5207. [DOI] [PMC free article] [PubMed] [Google Scholar]
- 25.Nishino T, et al. CENP-T-W-S-X forms a unique centromeric chromatin structure with a histone-like fold. Cell. 2012;148:487–501. doi: 10.1016/j.cell.2011.11.061. [DOI] [PMC free article] [PubMed] [Google Scholar]
- 26.Hornung P, et al. A cooperative mechanism drives budding yeast kinetochore assembly downstream of CENP-A. The Journal of cell biology. 2014;206:509–524. doi: 10.1083/jcb.201403081. [DOI] [PMC free article] [PubMed] [Google Scholar]
- 27.Anedchenko EA, et al. The kinetochore module Okp1(CENP-Q)/Ame1(CENP-U) is a reader for N-terminal modifications on the centromeric histone Cse4(CENP-A) The EMBO journal. 2019;38 doi: 10.15252/embj.201898991. [DOI] [PMC free article] [PubMed] [Google Scholar]
- 28.Chittori S, et al. Structural mechanisms of centromeric nucleosome recognition by the kinetochore protein CENP-N. Science. 2018;359:339–343. doi: 10.1126/science.aar2781. [DOI] [PMC free article] [PubMed] [Google Scholar]
- 29.Pentakota S, et al. Decoding the centromeric nucleosome through CENP-N. eLife. 2017;6 doi: 10.7554/eLife.33442. [DOI] [PMC free article] [PubMed] [Google Scholar]
- 30.Kato H, et al. A conserved mechanism for centromeric nucleosome recognition by centromere protein CENP-C. Science. 2013;340:1110–1113. doi: 10.1126/science.1235532. [DOI] [PMC free article] [PubMed] [Google Scholar]
- 31.Kouprina N, et al. Identification and cloning of the CHL4 gene controlling chromosome segregation in yeast. Genetics. 1993;135:327–341. doi: 10.1093/genetics/135.2.327. [DOI] [PMC free article] [PubMed] [Google Scholar]
- 32.Weir JR, et al. Insights from biochemical reconstitution into the architecture of human kinetochores. Nature. 2016;537:249–253. doi: 10.1038/nature19333. [DOI] [PubMed] [Google Scholar]
- 33.Falk SJ, et al. Chromosomes. CENP-C reshapes and stabilizes CENP-A nucleosomes at the centromere. Science. 2015;348:699–703. doi: 10.1126/science.1259308. [DOI] [PMC free article] [PubMed] [Google Scholar]
- 34.Zhang Z, Yang J, Barford D. Recombinant expression and reconstitution of multiprotein complexes by the USER cloning method in the insect cell-baculovirus expression system. Methods. 2016;95:13–25. doi: 10.1016/j.ymeth.2015.10.003. [DOI] [PubMed] [Google Scholar]
- 35.Schuck P. On the analysis of protein self-association by sedimentation velocity analytical ultracentrifugation. Analytical biochemistry. 2003;320:104–124. doi: 10.1016/s0003-2697(03)00289-6. [DOI] [PubMed] [Google Scholar]
- 36.Brautigam CA. Calculations and Publication-Quality Illustrations for Analytical Ultracentrifugation Data. Methods in enzymology. 2015;562:109–133. doi: 10.1016/bs.mie.2015.05.001. [DOI] [PubMed] [Google Scholar]
- 37.Samel A, Cuomo A, Bonaldi T, Ehrenhofer-Murray AE. Methylation of CenH3 arginine 37 regulates kinetochore integrity and chromosome segregation. Proceedings of the National Academy of Sciences of the United States of America. 2012;109:9029–9034. doi: 10.1073/pnas.1120968109. [DOI] [PMC free article] [PubMed] [Google Scholar]
- 38.Zheng SQ, et al. MotionCor2: anisotropic correction of beam-induced motion for improved cryo-electron microscopy. Nat Methods. 2017;14:331–332. doi: 10.1038/nmeth.4193. [DOI] [PMC free article] [PubMed] [Google Scholar]
- 39.Zhang K. Gctf: Real-time CTF determination and correction. J Struct Biol. 2016;193:1–12. doi: 10.1016/j.jsb.2015.11.003. [DOI] [PMC free article] [PubMed] [Google Scholar]
- 40.Fernandez-Leiro R, Scheres SHW. A pipeline approach to single-particle processing in RELION. Acta crystallographica Section D, Structural biology. 2017;73:496–502. doi: 10.1107/S2059798316019276. [DOI] [PMC free article] [PubMed] [Google Scholar]
- 41.Nakane T, Kimanius D, Lindahl E, Scheres SH. Characterisation of molecular motions in cryo-EM single-particle data by multi-body refinement in RELION. eLife. 2018;7 doi: 10.7554/eLife.36861. [DOI] [PMC free article] [PubMed] [Google Scholar]
- 42.Elmlund H, Elmlund D, Bengio S. PRIME: probabilistic initial 3D model generation for single-particle cryo-electron microscopy. Structure. 2013;21:1299–1306. doi: 10.1016/j.str.2013.07.002. [DOI] [PubMed] [Google Scholar]
- 43.Chen S, et al. High-resolution noise substitution to measure overfitting and validate resolution in 3D structure determination by single particle electron cryomicroscopy. Ultramicroscopy. 2013;135:24–35. doi: 10.1016/j.ultramic.2013.06.004. [DOI] [PMC free article] [PubMed] [Google Scholar]
- 44.Emsley P, Lohkamp B, Scott WG, Cowtan K. Features and development of Coot. Acta crystallographica Section D, Biological crystallography. 2010;66:486–501. doi: 10.1107/S0907444910007493. [DOI] [PMC free article] [PubMed] [Google Scholar]
- 45.Yang Z, et al. UCSF Chimera, MODELLER, and IMP: an integrated modeling system. J Struct Biol. 2012;179:269–278. doi: 10.1016/j.jsb.2011.09.006. S1047-8477(11)00261-9 [pii] [DOI] [PMC free article] [PubMed] [Google Scholar]
- 46.Schmitzberger F, et al. Molecular basis for inner kinetochore configuration through RWD domain-peptide interactions. The EMBO journal. 2017;36:3458–3482. doi: 10.15252/embj.201796636. [DOI] [PMC free article] [PubMed] [Google Scholar]
- 47.Hinshaw SM, Harrison SC. An Iml3-Chl4 heterodimer links the core centromere to factors required for accurate chromosome segregation. Cell reports. 2013;5:29–36. doi: 10.1016/j.celrep.2013.08.036. [DOI] [PMC free article] [PubMed] [Google Scholar]
- 48.Kelley LA, Mezulis S, Yates CM, Wass MN, Sternberg MJ. The Phyre2 web portal for protein modeling, prediction and analysis. Nature protocols. 2015;10:845–858. doi: 10.1038/nprot.2015.053. [DOI] [PMC free article] [PubMed] [Google Scholar]
- 49.Buchan DW, Minneci F, Nugent TC, Bryson K, Jones DT. Scalable web services for the PSIPRED Protein Analysis Workbench. Nucleic acids research. 2013;41:W349–357. doi: 10.1093/nar/gkt381. [DOI] [PMC free article] [PubMed] [Google Scholar]
- 50.Luger K, Mader AW, Richmond RK, Sargent DF, Richmond TJ. Crystal structure of the nucleosome core particle at 2.8 A resolution. Nature. 1997;389:251–260. doi: 10.1038/38444. [DOI] [PubMed] [Google Scholar]
- 51.Vasudevan D, Chua EY, Davey CA. Crystal structures of nucleosome core particles containing the '601' strong positioning sequence. Journal of molecular biology. 2010;403:1–10. doi: 10.1016/j.jmb.2010.08.039. [DOI] [PubMed] [Google Scholar]
- 52.Adams PD, et al. PHENIX: a comprehensive Python-based system for macromolecular structure solution. Acta crystallographica Section D, Biological crystallography. 2010;66:213–221. doi: 10.1107/S0907444909052925. [DOI] [PMC free article] [PubMed] [Google Scholar]
- 53.Chen VB, et al. MolProbity: all-atom structure validation for macromolecular crystallography. Acta crystallographica Section D, Biological crystallography. 2010;66:12–21. doi: 10.1107/S0907444909042073. [DOI] [PMC free article] [PubMed] [Google Scholar]
- 54.Goddard TD, et al. UCSF ChimeraX: Meeting modern challenges in visualization and analysis. Protein science : a publication of the Protein Society. 2018;27:14–25. doi: 10.1002/pro.3235. [DOI] [PMC free article] [PubMed] [Google Scholar]
- 55.Waterhouse AM, Procter JB, Martin DM, Clamp M, Barton GJ. Jalview Version 2--a multiple sequence alignment editor and analysis workbench. Bioinformatics. 2009;25:1189–1191. doi: 10.1093/bioinformatics/btp033. [DOI] [PMC free article] [PubMed] [Google Scholar]
- 56.Liu F, Heck AJ. Interrogating the architecture of protein assemblies and protein interaction networks by cross-linking mass spectrometry. Current opinion in structural biology. 2015;35:100–108. doi: 10.1016/j.sbi.2015.10.006. [DOI] [PubMed] [Google Scholar]
- 57.Liu F, Lossl P, Scheltema R, Viner R, Heck AJR. Optimized fragmentation schemes and data analysis strategies for proteome-wide cross-link identification. Nature communications. 2017;8 doi: 10.1038/ncomms15473. 15473. [DOI] [PMC free article] [PubMed] [Google Scholar]
- 58.Grimm M, Zimniak T, Kahraman A, Herzog F. xVis: a web server for the schematic visualization and interpretation of crosslink-derived spatial restraints. Nucleic acids research. 2015;43:W362–369. doi: 10.1093/nar/gkv463. [DOI] [PMC free article] [PubMed] [Google Scholar]
- 59.Vizcaino JA, et al. ProteomeXchange provides globally coordinated proteomics data submission and dissemination. Nature biotechnology. 2014;32:223–226. doi: 10.1038/nbt.2839. [DOI] [PMC free article] [PubMed] [Google Scholar]
- 60.Yan K, Zhang Z, Yang J, McLaughlin SH, Barford D. Architecture of the CBF3-centromere complex of the budding yeast kinetochore. Nature structural & molecular biology. 2018;25:1103–1110. doi: 10.1038/s41594-018-0154-1. [DOI] [PMC free article] [PubMed] [Google Scholar]
- 61.Hinshaw SM, Dates AN, Harrison SC. The structure of the yeast Ctf3 complex. eLife. 2019;8 doi: 10.7554/eLife.48215. [DOI] [PMC free article] [PubMed] [Google Scholar]
- 62.Akiyoshi B, et al. Tension directly stabilizes reconstituted kinetochore-microtubule attachments. Nature. 2010;468:576–579. doi: 10.1038/nature09594. [DOI] [PMC free article] [PubMed] [Google Scholar]
- 63.Gonen S, et al. The structure of purified kinetochores reveals multiple microtubule-attachment sites. Nature structural & molecular biology. 2012;19:925–929. doi: 10.1038/nsmb.2358. [DOI] [PMC free article] [PubMed] [Google Scholar]
Associated Data
This section collects any data citations, data availability statements, or supplementary materials included in this article.


