

Abstract
Segmentation of fundamental heart sounds–S1 and S2 is important for automated monitoring of cardiac activity including diagnosis of the heart diseases. This pa-per proposes a novel hybrid method for S1 and S2 heart sound segmentation using group sparsity denoising and variation mode decomposition (VMD) technique. In the proposed method, the measured phonocardiogram (PCG) signals are denoised using group sparsity algorithm by exploiting the group sparse (GS) property of PCG signals. The denoised GS-PCG signals are then decomposed into subsequent modes with specific spectral characteristics using VMD algorithm. The appropriate mode for further processing is selected based on mode central frequencies and mode energy. It is then followed by the extraction of Hilbert envelope (HEnv) and a thresholding on the selected mode to segment S1 and S2 heart sounds. The performance advantage of the proposed method is verified using PCG signals from benchmark databases namely eGeneralMedical, Littmann, Washington, and Michigan. The proposed hybrid algorithm has achieved a sensitivity of 100%, positive predictivity of 98%, accuracy of 98% and detection error rate of 1.5%. The promising results obtained suggest that proposed approach can be considered for automated heart sound segmentation.
Keywords: Phonocardiogram (PCG), Group sparsity (GS), Variational mode decomposition (VMD), Denoising, Segmentation
Introduction
Phonocardiogram (PCG) is a plotting of the recordings of heart sounds and murmurs. It is a vital tool for the diagnosis of cardiac abnormalities including heart diseases, failures, rate and rhythm. The increased usage of PCG waveforms for cardiac diagnosis is due to its ease of capturing, simplicity and low cost. It overcomes the limitations of acoustical stethoscope when it comes to storing, analysis and automated continuous monitoring. The PCG waveform containing two fundamental heart sounds namely first sound-S1 and second sound-S2. The S1 heart sound is low pitch sound of longer duration corresponding to the systole cycle (contraction) of heart. The S2 heart sound is of shorter duration with high pitch corresponding to the diastole cycle (relaxation) of heart. In addition to these, the PCG signals contain the diastolic low pitch sounds such as S3 and S4, different kind of murmurs and several anomalous sounds like clicks, snaps etc. [1]. The murmurs are caused by turbulence in hemodynamics, vibration of tissues and valvular dysfunctions. Murmurs can be systolic or diastolic and can be of different types based on its timing and duration [2]. Identification of these events in heart sound is critical for automated cardiac analysis, continuous monitoring and heart sound segmentation.
In literature, various approaches have been proposed for heart sound segmentation. A methodology based on morphological and temporal features to detect heart sound events has been proposed in [3]. A total-variation (TV) based technique is proposed in [4] for heart sound segmentation. The TV-filtered PCG signal is processed further based on Shannon entropy envelope and instantaneous phase [4]. The non-linear behavior of PCG signal will deteriorate the efficiency of instantaneous phase extraction stage is the limitation of this method. Many of the existing methods are based on specific features such as energy, entropy, statistical parameters etc. [5, 6]. One of the disadvantage of these methods is inaccurate segmentation in presence of artifacts. Transform-based approaches have been developed to overcome the disadvantages of feature-based techniques. In transform-based approaches, the measured PCG signals are transferred into different modes and later these modes are segmented to detect the events. The examples of transform-based approaches includes wavelet transform [7], empirical mode decomposition (EMD) [8], variational mode decomposition (VMD) [9, 10] and empirical wavelet transform (EWT) [2]. In [9], VMD combined Shannon energy method for heart sound segmentation is proposed. However, this method has poor performance under noisy scenarios. Additionally, the Shan-non energy envelope extraction results error in low amplitude events detection. VMD combined Shannon entropy detection method (VMD-SEE) for fundamental heart sound segmentation has been proposed in [10]. This method offers an improved performance than [9], however, the denoising capability of VMD is not efficient under abnormal situations such as murmurs and additional heart sounds. Thus, during high noisy situations this method results an erroneous detection. An automatic methodology for identification of S1 and S2 sound using PCG and photoplethysmogram (PPG) recordings is proposed in [11]. In this method, the detection is done based on VMD algorithm. Logistic-regression technique [12], multifractal approach [13], deep neural network with mel-frequency cepstral coefficient (MFCC) features [1], hidden Markov model (HMM) [14] are also proposed for fundamental heart sound segmentation.
Objective and contributions
The objective of the present paper is to propose a hybrid method for fundamental heart sound segmentation using group sparsity denoising (GSD) and variational mode decomposition (VMD) algorithm. Even though VMD based heart sound segmentation is available in the literature, its performance is found to be decaying during noisy situations. Hence, there is a requirement of improving the performance in noisy situations by developing alternative approaches. This motivates us to develop a novel hybrid method for fundamental heart sound segmentation by combining GSD and VMD. In the proposed method, the distinct group sparse and periodicity property of PCG signals are utilized to achieve an efficient denoising. The denoised group sparse (GS)-PCG signals are decomposed using VMD into different modes with distinct spectral characteristics. The appropriate VMD mode for further processing is selected based on central frequency and energy based mode selection criteria. Finally, Hilbert transform based envelope extraction and thresholding is performed to segment the fundamental heart sounds–S1 and S2. The efficiency of the proposed hybrid method is verified on different PCG signals having normal and abnormal characteristics.
Proposed hybrid method for fundamental heart sound segmentation
The overview of the proposed hybrid method is illustrated in Fig. 1. The major steps involved in the proposed method are (1) group sparsity denoising, (2) VMD decomposition, (3) appropriate mode selection, and (3) Hilbert envelope extraction and thresholding.
Fig. 1.

The overview of the proposed hybrid method for fundamental heart sound segmentation
Group sparsity denoising (GSD)
Group sparsity (GS) is a characteristic property exhibited by many of the natural signals that the high-valued coefficients are occurring as isolated groups than isolated peaks. The group sparse signals exhibit periodic nature. The com-mon examples of group sparse signals are speech, vibration signals emanating from faulty bearings, bio-medical signals etc. and this peculiar feature is clear from the time-domain or frequency-domain spectrum of such signals [15]. Figure 2 shows the PCG signal and its spectrogram in frequency domain demonstrating the group sparse property of the PCG signal. The short-term Fourier transform (STFT) based 2D spectrum in Fig. 2 is not showing any isolated large magnitudes, but shows ridges of higher magnitudes.
Fig. 2.

Illustrates a measured PCG signal, b STFT based 2D spectrum
In recent years, the denoising of group sparse signals is an important research problem and several algorithms have been proposed [15, 16]. Group-sparsity have been employed in different applications such as image restoration [17], machine condition monitoring [18], fault detection in rotating machines [19] etc. In the present paper, we have utilized the algorithm proposed in [16] for denoising the GS-PCG signals. The objective function to denoise the noisy PCG signal is defined as the minimization of the cost function as,
| 1 |
where is the denoised signal, and is the regular-ization coefficient. The regularization term is defined as,
| 2 |
where denotes the non-convex penalty function, denotes the cardinality of the group or group size and denotes the starting index of th group. The parameterized arctangent (atan) penalty function is utilized in this study and is defined as,
| 3 |
where denotes the scalar parameter to enforce the convexity of the minimization problem. Further the problem defined in Eq. 1 is solved using Majorization-Minimization algorithm. In the present work, we have employed 2D group sparsity algorithm by taking STFT of the PCG signal to get the 2D spectrum. The 2D array of STFT coefficients is created by taking discrete Fourier transform (DFT) of windowed blocks of PCG signal. In the 2D array, one column of Fourier coefficients represent one frame in time domain. However, a point in time domain will appear in two adjacent frames and hence contribute to Fourier coefficients in two consecutive frames. This results an issue in reconstruction (or inverse transform). Hence to make the transform reversible, a point in time-domain should distribute its value to two frames so that while reconstructing, we can directly add the inverse transform of the overlapping frames with appropriate translation. One way of achieving this is to multiply each frame with a half wave sine window before taking DFT during forward transform and after DFT for taking inverse transform. The illustration of above procedure is shown Fig. 3.
Fig. 3.
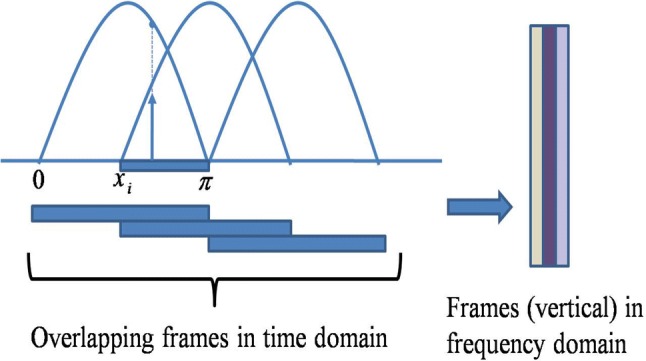
Pictorial illustration of reversible transform
VMD decomposition
The VMD is a non-recursive, quasi-orthogonal, data-adaptive signal decomposition procedure using the concept of alternating direction method of multipliers (ADMM) [20]. In the proposed hybrid method, the group sparse denoised PCG signals, is decomposed into three different modes, with distinct spectral properties. In VMD decomposition, for each mode , the spectrum of the analytic signal is estimated using Hilbert transform. Then the estimated one-sided spectrum tuned to respective center frequency, is shifted to baseband by multiplying with the complex exponential function, . Finally, the bandwidth of the frequency translated signal is computed using the squared of the gradient. The variational optimization problem to obtain the modes is defined as in Eq. 1.
| 4 |
This constrained optimization problem estimate the unknown central frequencies and corresponding modes, subject to the constraint that sum of the estimated modes should be equal to the input signal [21, 22]. This problem is solved using ADMM algorithm by taking the augmented Lagrangian multiplier.
Variational mode decomposition algorithm
Initialize
For all modes,
Update the spectrum and central frequency for each mode for all ,
where is bandwidth parameter.
Update the Lagrangian multiplier ,
where is Lagrangian multiplier update parameter.
-
Increase and repeat the spectrum and central frequency for each mode, until the following convergence criterion is satisfied.
where is tolerance value.
The performance of VMD algorithm is mainly proportional to the selection of two decomposition parameters namely data fidelity constraint () and number of modes () [23]. The bandwidth parameter, determine the bandwidth of each mode and the number of modes, defines the distribution of energy among modes [24]. The very small value of these parameters results in sharing of frequency components with near-by modes. Whereas the very large value leads to mode duplication. Thus, it is necessary to fix these parameters to get most accurate decomposition of PCG signals. The values of all the parameters used in the proposed work is given in Table 1.
Table 1.
VMD parameters used for PCG signal decomposition
| VMD parameters | Value |
|---|---|
| Data fidelity parameter () | 2500 |
| Number of modes () | 3 |
| Noise tolerance parameter () | 0 |
| DC importing parameter | 0 |
| Initialization of | 1 |
| Convergence tolerance | 0 |
Appropriate mode selection
The GS-PCG signals are decomposed into three different modes, which is followed by the selection of appropriate mode for further processing. The selection of suitable mode is important for the segmentation of fundamental sounds. Inspired from [10], the mode selection is done using the mode central frequency and energy of each mode. Figure 4 represents the frequency spectrum of the obtained modes. From Fig. 4 it is clear that the lower VMD modes carries more information regarding the PCG signal and posses more energy than higher modes. Moreover the lower modes have low central frequencies. As the mode number increases, the central frequency value also increases. From literature it is evident that the fundamental heart sounds are usually occur within the range of 10–50 Hz [4, 9, 10]. Thus the criterion adopted to select the suitable mode for segmentation is with the mode central frequency in the range of 10–75 Hz with maximum energy. As shown in Fig. 4, the experiments performed on normal and abnormal PCG waveforms on noisy and noise-less conditions reveals that the first VMD mode () holds this condition and hence this mode is selected for further processing.
Fig. 4.

Illustrates the appropriate mode selection process. a Noisy PCG signal (SNR = 10 dB), b denoised PCG signal (SNR = 26.28 dB), c–e VMD modes, f–j frequency spectrum of a–e
Hilbert envelope extraction and thresholding
The final step of the proposed method is Hilbert envelope (HEnv) extraction and thresholding for fundamental heart sound segmentation. The selected first mode () is then processed to extract the Hilbert envelope. Hilbert transform (HT) is a simple linear operator which gives the corresponding analytical representation of the given signal in discrete domain. The Hilbert transform is defined as,
| 5 |
Here, represents the convolution operation. That is, the above operation is equivalent to computing the convolution integral of the given signal with . Now, the instantaneous envelope is computed by extracting the magnitude of the resulting complex numbers . Further, a threshold value (0.05) based on the experimental observations is fixed to detect the boundary locations of the detected segments. The entire methodology of the proposed hybrid approach for fundamental heart sound segmentation is discussed in Table 2.
Table 2.
Methodology of the proposed hybrid approach for fundamental heart sound segmentation

Results and discussions
This section describes the experiment evaluations performed on signal records obtained from four different PCG databases namely (1) eGeneralMedical (EGM), (2) Littmann heart sound (LHS), (3) Washington heart sounds and murmur (WHSM), and (4) Michigan heart sound and murmur (MHSM). The experiments are performed under following three categories.
Effectiveness of group sparsity denoising.
Effectiveness of fundamental heart sound segmentation.
Evaluation using performance matrices.
Effectiveness of group sparsity denoising
The signals considered for evaluation of the effectiveness of the GSD consists normal signals, split S1 and S2, pulmonic regurgitation, arterial septal defect, ejection clicks, and various murmurs. The clean PCG signals are synthetically corrupted with additive white Gaussian (AWGN) noise on different noise levels. The denoising performance is evaluated based on signal-to-noise ratio (SNR) metric.
Fixing of and group sparsity window size and
The proposed group sparsity approach depends on two input parameters such as regularization parameter, and group sparsity window sizes, and . By controlling and window size of GS, different levels of smoothness are achieved in the noisy PCG signal. This offers an interactive environment for accurate decision making. Figure 5 demonstrate the effect of on controlling the smoothness at various degree. In this study a series of experiments are conducted to fix these two input parameters based on higher output SNR value. During the experiment it is observed that the parameter for all the PCG signal records which gives high SNR falls in the range 0.002–0.8. As the noise level increases, the value has to be increased in the range for maximum smoothing. The GS window size is selected based on the procedure explained in [15, 16]. Figure 6 demonstrate the performance of different GS window sizes on various PCG signals under different noise levels. It is evident from Fig. 6 that the window sizes ; gives the best performance under every noise levels.
Fig. 5.

Illustrates the effect of on inducing various degree of smoothness
Fig. 6.

Illustrates the effect of various K1 and K2 at different noise levels. a Input SNR = − 5 dB, b Input SNR = − 0 dB, c Input SNR = 10 dB
Table 3 shows the output SNR obtained for different PCG signal records at four different noisy levels. Each of the signal record chosen for evaluation has particular characteristics. It is observed that the denoising using GS approach, the characteristics are retained. The comparison of the denoising performance of the proposed method with VMD based denoising [21] is shown in Fig. 7. It is evident from Fig. 7 that the proposed GS approach outperformed VMD based method for denoising noisy PCG signals with different characteristics. Further, the denoising performance is compared with adaptive OGS, wavelet denoising and VMD based denoising by taking the normal PCG signal from MHSM database. The results of evaluation and comparison with VMD denoising [21], adaptive OGS [25] and wavelet denoising are tabulated in Table 4. The wavelet denoising is a commonly preferred denoising technique and is performed using db 10 wavelet. The adaptive implementation of overlapping GS algorithm discussed in [25] has obtained a better performance than wavelet at 15 dB noise level. The performance of VMD based denoising for low input SNR range is satisfactory. However, as the noise level increases, the VMD performance is found to be decaying. It is clear from Table 4 that the proposed GSD has achieved improved denoising performance than all the other referred methods.
Table 3.
Performance evaluation of group sparsity based PCG denoising
| Signal characteristics | Output SNR (dB) | |||
|---|---|---|---|---|
| − 5 dB | 0 dB | 10 dB | 20 dB | |
| EGM database | ||||
| Normal | 14.8495 | 18.5971 | 26.2747 | 33.5254 |
| Late-systolic murmur | 13.4997 | 17.3205 | 24.8342 | 32.3274 |
| Normal split | 14.3232 | 18.4359 | 26.5274 | 33.7973 |
| Diastolic rumble | 13.3612 | 17.3653 | 24.9863 | 33.0471 |
| S3 | 13.8781 | 17.8630 | 25.6877 | 33.4297 |
| LHS database | ||||
| Diastolic rumble | 13.3612 | 17.3059 | 24.9863 | 33.0471 |
| Late-systolic murmur | 13.4997 | 17.3205 | 24.8342 | 32.3274 |
| Pan-systolic murmur | 12.0598 | 15.4998 | 22.8009 | 31.4767 |
| S3 | 13.7102 | 17.8630 | 25.2285 | 33.4297 |
| S4 | 14.4155 | 18.3829 | 25.6367 | 33.5493 |
| WHSM database | ||||
| Split S2 | 18.2394 | 22.4319 | 30.1949 | 35.5784 |
| S4 | 17.2882 | 21.6971 | 29.5798 | 35.8398 |
| S3 | 17.2630 | 21.6465 | 29.3422 | 35.8942 |
| Ventricular septal defect | 14.7986 | 19.5012 | 27.9602 | 35.1876 |
| Normal | 18.9404 | 23.1163 | 30.6989 | 33.2067 |
| MHSM database | ||||
| Split S1 | 18.7050 | 22.7760 | 30.4555 | 36.2695 |
| S4 | 18.1340 | 22.4438 | 30.8417 | 37.5633 |
| Mid-systolic murmur | 20.1238 | 24.4469 | 32.0261 | 38.5396 |
| S3 | 17.5612 | 21.7341 | 30.7322 | 37.9225 |
| Split S2 | 17.8546 | 22.3791 | 30.1435 | 37.1692 |
| Arterial septal defect | 15.2965 | 19.5679 | 29.0614 | 36.2986 |
| Pulmonary valve stenosis | 18.5485 | 20.9181 | 28.9181 | 36.2262 |
Fig. 7.

Performance comparison on denoising with VMD based denoising [21]. a Input SNR = 10 dB, b Input SNR = 20 dB
Table 4.
Comparison of PCG signal denoising performance on signal from MHSM database
Effectiveness of fundamental heart sound segmentation
This section demonstrates the effectiveness of the proposed hybrid method for fundamental heart sound segmentation. Three different cases are considered to evaluate the performance of the proposed method.
Case 1: evaluation on normal PCG signal
This case evaluate the performance advantage of the proposed hybrid method to segment a normal PCG signal without any abnormalities. The normal PCG waveform is taken from MHSM database. It is recorded from apex area at a sampling rate of 44.1 kHz. Initially, the measured PCG signal is denoised using GSD and then the denoised signal is separated into corresponding modes using VMD. The measured and denoised PCG signals are shown in Fig. 8a and b. Further based on the mode energy and mode central frequency, first mode is selected for Hilbert envelope extraction followed by a thresholding. The selected first mode is shown in Fig. 8c, the extracted Hilbert envelope is shown in Fig. 8d, and the boundaries detected after thresholding is shown in Fig. 8e. Finally, the detected starting and ending locations of PCG waveforms are marked and is shown in Fig. 8f.
Fig. 8.

Illustrates the effectiveness of the proposed hybrid method on normal PCG signal. a Normal PCG signal, b denoised PCG signal, c selected first mode of VMD decomposition, d extracted Hilbert envelope, e detected boundaries after thresholding, f denoised PCG signal with starting and ending locations of fundamental heart sounds
Case 2: evaluation on abnormal PCG signal
The performance of the proposed hybrid method to segment an abnormal PCG signal is presented by taking a signal from EGM database, sampled at 11.25 kHz. The signal consists of pan-systolic murmur, begins at S1 and lasts till S2. These murmurs are normally caused by mitral or tricuspid regurgitation and ventricular septal defect. Figure 9a and b represents the measured abnormal PCG signal and corresponding denoised signal. Based on the specified criterion, first mode is then selected for future processing and is shown in Fig. 9c. Extracted Hilbert envelope and the detected boundaries are shown in Fig. 9d and e. Figure 9f represents the marked starting and ending locations of S1 and S2 segments.
Fig. 9.

Illustrates the effectiveness of the proposed hybrid method on abnormal PCG signal. a Abnormal pan-systolic murmur signal, b denoised PCG signal, c selected first mode of VMD decomposition, d extracted Hilbert envelope, e detected boundaries after thresholding, f denoised PCG signal with starting and ending locations of fundamental heart sounds
Case 3: evaluation on noisy PCG signal
To demonstrate the performance advantage on noisy conditions, a corrupted PCG signal with SNR of − 5 dB is considered from LHS database. The signal contains late-systolic murmur and is sampled at 11.25 kHz. The late-systolic murmurs are caused due to the prolapse of mitral or tricuspid valves and dysfunction of papillary muscle. This case evaluates the performance of the proposed hybrid algorithm to segment the fundamental heart sounds by removing murmurs and noises without losing signal features. The simulation results are shown in Fig. 10. The proposed GSD efficiently denoises the signal by utilizing the group sparse periodicity of PCG signals and preserves the actual PCG signal characteristics. The denoised PCG signal is shown in Fig. 10 and the corresponding SNR is 10.45 dB. Figure 10c–e represents the selected first mode of VMD, Hilbert envelope of the first mode and detected boundaries using thresholding. It is clear from Fig. 10f that the heart sound delineation and segmentation is performed accurately using the proposed methodology.
Fig. 10.

Illustrates the effectiveness of the proposed hybrid method on noisy PCG signal. a Noisy PCG signal (SNR = − 5 dB), b denoised PCG signal (SNR = 10.45 dB), c selected first mode of VMD decomposition, d extracted Hilbert envelope, e detected boundaries after thresholding, f denoised PCG signal with starting and ending locations of fundamental heart sounds
To highlight the potential of the proposed fundamental heart sound segmentation in noisy scenarios another PCG waveform from EGM database is taken. The signal has normal split characteristics and is measured at a sampling frequency of 11.25 kHz. The PCG signal is corrupted with 0 dB noise and is shown in Fig. 11a. Figure 11b represents the denoised signal obtained using GSD. The corresponding SNR of output signal is 17.91 dB. The SNR improvement demonstrate the potential of group sparsity algorithm to denoise the noisy PCG signal. The first mode obtained through VMD decomposition is shown in Fig. 11c and the corresponding Hilbert envelope is shown in Fig. 11d. The detected boundaries of S1 and S2 heart sounds are given in Fig. 11e. Finally, Fig. 11f shows the starting and ending starting and ending locations of fundamental heart sounds.
Fig. 11.

Illustrates the effectiveness of the proposed hybrid method. a Noisy PCG signal with 0 dB noise, b denoised PCG signal with SNR = 17.91 dB, c selected first mode of VMD decomposition, d extracted Hilbert envelope from first mode, e detected boundaries after thresholding, f denoised PCG signal with starting and ending locations of fundamental heart sounds
Evaluation using performance matrices
The performance advantage is confirmed by measuring the results using standard performance matrices such as sensi-tivity (Se), positive predictivity (PP), accuracy (A) and de-tection error rate (DER). They are defined as,
| 6 |
| 7 |
| 8 |
| 9 |
where denotes true positive, false positive and false negative respectively. The experiments are done on segments taken from four different datasets. The evaluation results of the proposed hybrid method are depicted in Table 5. The number of segments considered from EGM, WHSM, MHSM, and LHS databases and the corresponding performance measures are given in Table 5. It is clear from Table 5 that the proposed hybrid method performed well on different PCG signals. The segmentation performance of the proposed hybrid method is compared with various benchmark methods and the results are tabulated in Table 6. The methods used for comparison are VMD-SEE [10], FD [13], improved EMD [8], wavelet [26], and adaptive wavelet [26]. It is clear from Table 6 that the proposed hybrid method has attained a satisfactory performance for fundamental heart sound segmentation. The main advantages of the proposed method are (1) robustness against severe noises, (2) less dependency on optimal parameters, (3) less complex, and (4) accurate for automated detection of fundamental heart sounds.
Table 5.
Evaluation of the proposed method using performance matrices
| Data | Segments | TP | FN | FP | Se | PP | A | DER |
|---|---|---|---|---|---|---|---|---|
| EGM | 126 | 126 | 0 | 0 | 100 | 100 | 100 | 0 |
| WHSM | 128 | 126 | 0 | 2 | 100 | 98.43 | 98.43 | 1.5 |
| MHSM | 177 | 177 | 0 | 0 | 100 | 100 | 100 | 0 |
| LHS | 139 | 138 | 0 | 1 | 100 | 99.28 | 99.28 | 0.7 |
Table 6.
Performance comparison for fundamental heart sound segmentation
| Method | Data | Se | PP | A | DER |
|---|---|---|---|---|---|
| Proposed | EGM | 100 | 100 | 100 | 0 |
| Proposed | MHSM | 100 | 100 | 100 | 0 |
| VMD-SEE [10] | EGM | 100 | 100 | 100 | 0 |
| VMD-SEE [10] | MHSM | 100 | 100 | 100 | 0 |
| FD (5 dB noise) [13] | MHSM | 96.97 | 99.58 | 3.55 | 96.58 |
| Improved EMD [8] | Own data | – | – | 99.74 | – |
| Adap. Wavelet [26] | Clinical | 93.24 | – | – | – |
| Wavelet [26] | Clinical | 81.64 | – | – | – |
Conclusion
In this paper, we presented a novel hybrid method for fundamental heart sound segmentation. In the proposed hybrid method, the heart sound signals are denoised using 2D group sparsity algorithm that exploits the group sparse property of PCG signals. The denoised GS-PCG signals are then decomposed into modes of distinct spectral characteristics. Then, based on the mode central frequency and mode energy, the first VMD mode is selected. It is then followed by the extraction of Hilbert envelope and thresholding to segment the fundamental S1 and S2 heart sounds. The experiments are performed on standard databases eGeneralMedical (EGM), Littmann Heart Sound (LHS),Washington Heart Sounds and Murmur (WHSM), and Michigan Heart Sound and Murmur (MHSM) containing normal and abnormal PCG signals. The proposed hybrid algorithm has achieved a sensitivity of 100%, positive predictivity of 98%, accuracy of 98% and detection error rate of 1.5%. The promising results obtained suggest that the proposed hybrid method can be considered for automated heart sound segmentation. We would pursue the detection of low pitch sounds S3 and S4 as a future work.
Compliance with ethical standards
Conflict of interest
The authors declare that they have no conflict of interest.
Ethical approval
This article does not contain any studies with human participants or animals performed by any of the authors.
Footnotes
Publisher's Note
Springer Nature remains neutral with regard to jurisdictional claims in published maps and institutional affiliations.
Contributor Information
V. G. Sujadevi, Email: sujapraba@gmail.com
Neethu Mohan, Email: neethumohan.ndkm@gmail.com.
S. Sachin Kumar, Email: sachinnme@gmail.com
S. Akshay, Email: akshaysoman06@gmail.com
K. P. Soman, Email: kp_soman@amrita.edu
References
- 1.Chen T-E, Yang S-I, Ho L-T, Tsai K-H, Chen Y-H, Chang Y-F, Lai Y-H, Wang S-S, Tsao Y, Wu C-C. S1 and s2 heart sound recognition using deep neural networks. IEEE Trans Biomed Eng. 2017;64(2):372–380. doi: 10.1109/TBME.2016.2559800. [DOI] [PubMed] [Google Scholar]
- 2.Nivitha Varghees V, Ramachandran KI. Effective heart sound segmentation and murmur classification using empirical wavelet transform and instantaneous phase for electronic stethoscope. IEEE Sens J. 2017;17(12):3861–3872. doi: 10.1109/JSEN.2017.2694970. [DOI] [Google Scholar]
- 3.Nivitha Varghees V, Ramachandran KI, Soman KP, Wavelet-based fundamental heart sound recognition method using morpho-logical and interval features. Healthcare Technol Lett 2017.
- 4.Nivitha Varghees V, Ramachandran KI. A novel heart sound activity detection framework for automated heart sound analysis. Biomed Signal Process Control. 2014;13:174–188. doi: 10.1016/j.bspc.2014.05.002. [DOI] [Google Scholar]
- 5.Sabarimalai Manikandan M, Soman KP. Robust heart sound activity detection in noisy environments. Electron Lett. 2010;46(16):1100–1102. doi: 10.1049/el.2010.1201. [DOI] [Google Scholar]
- 6.Suboh MZ, Mashor MY, Hadi HM, Mohd Saad AR, Mohamed MS, Khor BT. Segmentation of heart sound signal into cycles based on time properties of the heart sound.
- 7.Safara F, Doraisamy S, Azman A, Jan-tan A, Ramaiah ARA. Multi-level basis selection of wavelet packet decomposition tree for heart sound classification. Comput Biol Med. 2013;43(10):1407–1414. doi: 10.1016/j.compbiomed.2013.06.016. [DOI] [PubMed] [Google Scholar]
- 8.Sun H, Chen W, Gong J. An improved empirical mode decomposition-wavelet algorithm for phonocardiogram signal denoising and its application in the first and second heart sound extraction. In: 2013 6th international conference on biomedical engineering and informatics (BMEI), p. 187–91. IEEE, 2013.
- 9.Banerjee S, Mishra M, Mukherjee A. Segmentation and detection of first and second heart sounds (si and s 2) using variational mode decomposition. In: 2016 IEEE EMBS conference on biomedical engineering and sciences (IECBES), p. 565–70. IEEE, 2016.
- 10.Ajay Babu K, Ramkumar B, Sabarimalai Manikandan M. S1 and s2 heart sound segmentation using variational mode decomposition. In: Region 10 Conference, TENCON 2017–2017 IEEE, p. 1629–34. IEEE, 2017.
- 11.Ajay Babu K, Ramkumar B, Sabarimalai Manikandan M. Automatic identification of s1 and s2 heart sounds using simultaneous PCG and PPG recordings. IEEE Sens J. 2018;18:9430–9440. doi: 10.1109/JSEN.2018.2869416. [DOI] [Google Scholar]
- 12.Springer DB, Tarassenko L, Clifford GD. Logistic regression-HSMM-based heart sound segmentation. IEEE Trans Biomed Eng. 2016;63(4):822–832. doi: 10.1109/TBME.2015.2475278. [DOI] [PubMed] [Google Scholar]
- 13.Thomas R, Hsi LL, Boon SC, Gu-nawan E. Heart sound segmentation using fractal decomposition. In: 2016 IEEE 38th annual international conference of the engineering in medicine and biology society (EMBC), p. 6234–37. IEEE, 2016. [DOI] [PubMed]
- 14.Kwak C, Kwon O-W. Cardiac disorder classification by heart sound signals using murmur likelihood and hidden markov model state likelihood. IET Signal Proc. 2012;6(4):326–334. doi: 10.1049/iet-spr.2011.0170. [DOI] [Google Scholar]
- 15.Chen P-Y, Selesnick IW. Translation-invariant shrink-age/thresholding of group sparse signals. Signal Process. 2014;94:476–489. doi: 10.1016/j.sigpro.2013.06.011. [DOI] [Google Scholar]
- 16.Chen P-Y, Selesnick IW. Group-sparse signal denoising: non-convex regularization, convex optimization. IEEE Trans Signal Process. 2014;62(13):3464–3478. doi: 10.1109/TSP.2014.2329274. [DOI] [Google Scholar]
- 17.Liu J, Huang T-Z, Selesnick IW, Lv X-G, Chen P-Y. Image restoration using total variation with overlap-ping group sparsity. Inf Sci. 2015;295:232–246. doi: 10.1016/j.ins.2014.10.041. [DOI] [Google Scholar]
- 18.Chandran Athira, Anjali T., Mohan Neethu, Soman K. P. Advances in Intelligent Systems and Computing. Cham: Springer International Publishing; 2017. Overlapping Group Sparsity Induced Condition Monitoring in Rotating Machineries; pp. 409–418. [Google Scholar]
- 19.He W, Ding Y, Zi Y, Selesnick IW. Sparsity-based algorithm for detecting faults in rotating machines. Mech Syst Signal Process. 2016;72:46–64. doi: 10.1016/j.ymssp.2015.11.027. [DOI] [Google Scholar]
- 20.Dragomiretskiy K, Zosso D. Variational mode decomposition. IEEE Trans Signal Process. 2014;62(3):531–544. doi: 10.1109/TSP.2013.2288675. [DOI] [Google Scholar]
- 21.Sujadevi VG, Soman KP, Sachin Kumar S, Mohan N, Arunjith AS. Denoising of phonocardiogram signals using variational mode decomposition. In: 2017 international conference on advances in computing, communications and informatics (ICACCI), p. 1443–1446. IEEE, 2017.
- 22.Pankaj D, Sachin Kumar S, Mohan N, Soman KP. Image fusion using variational mode decomposition. Indian J Sci Technol. 2016;9:45. [Google Scholar]
- 23.Mohan N, Soman KP. Power system frequency and amplitude estimation using variational mode decomposition and chebfun approximation system. In: 2018 twenty fourth national conference on communications (NCC), p. 1–6. IEEE, 2018.
- 24.Mohan N, Kumar S, Poornachandran P, Soman KP. Modified variational mode decomposition for power line interference removal in ecg signals. Int J Electr Comput Eng (IJECE) 2016;6(1):151–159. doi: 10.11591/ijece.v6i1.pp151-159. [DOI] [Google Scholar]
- 25.Deng S-W, Han J-Q. Adaptive overlapping-group sparse denoising for heart sound signals. Biomed Signal Process Control. 2018;40:49–57. doi: 10.1016/j.bspc.2017.08.027. [DOI] [Google Scholar]
- 26.Wang P, Kim Y, Ling LH, Soh CB. First heart sound detection for phonocardiogram segmentation. In: 27th annual international conference of the engineering in medicine and biology society, 2005. IEEE-EMBS 2005, p. 5519–5522. IEEE, 2006. [DOI] [PubMed]