

Abstract
It is well established that, besides facilitating lipid absorption, bile acids act as signaling molecules that modulate glucose and lipid metabolism. Bile acid metabolism, in turn, is controlled by several nutrient‐sensitive transcription factors. Altered intrahepatic glucose signaling in type 2 diabetes associates with perturbed bile acid synthesis. We aimed to characterize the regulatory role of the primary intracellular metabolite of glucose, glucose‐6‐phosphate (G6P), on bile acid metabolism. Hepatic gene expression patterns and bile acid composition were analyzed in mice that accumulate G6P in the liver, that is, liver‐specific glucose‐6‐phosphatase knockout (L‐G6pc−/−) mice, and mice treated with a pharmacological inhibitor of the G6P transporter. Hepatic G6P accumulation induces sterol 12α‐hydroxylase (Cyp8b1) expression, which is mediated by the major glucose‐sensitive transcription factor, carbohydrate response element‐binding protein (ChREBP). Activation of the G6P‐ChREBP‐CYP8B1 axis increases the relative abundance of cholic‐acid–derived bile acids and induces physiologically relevant shifts in bile composition. The G6P‐ChREBP–dependent change in bile acid hydrophobicity associates with elevated plasma campesterol/cholesterol ratio and reduced fecal neutral sterol loss, compatible with enhanced intestinal cholesterol absorption. Conclusion: We report that G6P, the primary intracellular metabolite of glucose, controls hepatic bile acid synthesis. Our work identifies hepatic G6P‐ChREBP‐CYP8B1 signaling as a regulatory axis in control of bile acid and cholesterol metabolism.
Abbreviations
- Acc
acetyl‐CoA carboxylase
- Ac‐H3
acetylated histone 3
- Ac‐H4
acetylated histone 4
- Acly
ATP citrate lyase
- bp
base pair
- C4
7α‐hydroxy‐4‐cholesten‐3‐one
- CA
cholic acid (3α,7α,12α‐trihydroxy‐5β‐cholan‐24‐oic acid)
- CDCA
chenodeoxycholic acid (3α,7α‐dihydroxy‐5β‐cholan‐24‐oic acid)
- ChIP
chromatin immunoprecipitation
- ChREBP
carbohydrate response element‐binding protein (Mlxipl)
- Cyp2c70
cytochrome P450, family 2, subfamily c, polypeptide 70
- Cyp7a1
cholesterol 7α‐hydroxylase
- Cyp7b1
oxysterol 7α‐hydroxylase
- Cyp8b1
sterol 12α‐hydroxylase
- Cyp27a1
sterol 27‐hydroxylase
- DCA
deoxycholic acid
- FoxO
forkhead box O
- FOXO1
forkhead box protein O1
- Fxr
farnesoid X receptor
- G6P
glucose‐6‐phosphate
- G6PC
glucose‐6‐phosphatase, catalytic subunit
- GC
gas chromatography
- GSD I
glycogen storage disease type 1
- H3/4
histone 3 and 4
- Hnf4α
hepatocyte nuclear factor 4 alpha
- IgG
immunoglobulin G
- IHH
immortalized human hepatocyte
- IR
insulin resistance
- L‐PK
L‐type pyruvate kinase
- Lrh‐1
liver receptor homolog 1
- Mafg
MAF BZIP transcription factor G
- MCA
muricholic acid (3α,6β,7α‐trihydroxy‐5β‐cholanoic acid and 3α,6β,7β‐trihydroxy‐5β‐cholanoic acid)
- Shp
small heterodimer partner
- shRNA
short hairpin RNA
- siChREBP
ChREBP small interfering RNAs
- WT
wild type
Bile acids facilitate absorption of dietary lipids and fat‐soluble vitamins in the intestine, but also act as signaling molecules that control glucose, lipid, and energy metabolism.1 Bile acid metabolism is known to be perturbed in conditions of uncontrolled hyperglycemia and insulin resistance (IR).2, 3 Bile acid synthesis from cholesterol occurs exclusively in the liver and comprises multiple biochemical reactions initiated by cholesterol 7α‐hydroxylase (CYP7A1), the rate‐controlling enzyme in the “classic” pathway of primary bile acid synthesis. Sterol 12α‐hydroxylase (CYP8B1) subsequently generates 3α,7α,12α‐trihydroxy‐5β‐cholan‐24‐oic acid (cholic acid; CA) as an end product.2, 4, 5 As a consequence, hepatic CYP8B1 activity determines the contribution of CA produced in the classic pathway relative to 3α,7α‐dihydroxy‐5β‐cholan‐24‐oic acid (chenodeoxycholic acid; CDCA). CDCA, in contrast to CA, can also be generated by an “alternative” pathway starting with 27‐hydroxylation of cholesterol.6 CDCA is efficiently converted to hydrophilic C6‐hydroxylated muricholic acids (MCAs) in rodents, but not in humans.6 Primary bile acid species are secreted into the intestine, where they can be converted by microbial actions to secondary bile acids with distinct physicochemical properties6 that determine their efficacy to promote fat and cholesterol absorption as well as their signaling functions.1
Bile acid synthesis is increased during postprandial periods and reduced upon fasting.7 Insulin and glucose have both been reported to induce the expression of CYP7A1 in cultured hepatocytes.8, 9 Moreover, insulin suppresses whereas glucose induces the expression of Cyp8b1.9, 10 Insulin‐induced suppression of Cyp8b1 is mediated by the transcription factor, forkhead box protein O1 (FOXO1).4 Under insulin‐resistant conditions, constitutive FOXO1 activation shifts the composition of the bile acid pool toward an increased contribution of CA and its hydrophobic microbial metabolite, 3α,12α‐dihydroxy‐5β–cholan‐24‐oic acid (deoxycholic acid; DCA).4 Accordingly, we and others have shown that IR is associated with an increase in CA synthesis2, 4, 5 and a more hydrophobic bile acid pool in humans.2 IR is generally associated with hyperglycemic episodes, enhancing intrahepatic glucose metabolism.11, 12
Here, we characterized the direct regulatory role of intrahepatic glucose on bile acid synthesis. After being taken up by hepatocytes, glucose is immediately converted into glucose‐6‐phosphate (G6P), the primary intracellular metabolite of glucose that acts as a signaling molecule.12 Glycogen storage disease type 1 (GSD I) is an inborn error of carbohydrate metabolism caused by mutations in the glucose‐6‐phosphatase (glucose‐6‐phosphatase, catalytic subunit; G6PC) gene (GSD Ia) or the glucose‐6‐phosphate transporter, SLC37A4 (GSD Ib). GSD I is characterized by a strong accumulation of G6P inside hepatocytes and, importantly, low fasting glucose and insulin levels.13 We took advantage of this unique feature to evaluate the effects of intracellular glucose versus blood glucose and insulin and hence to selectively establish the effects of intra‐ versus extrahepatic glucose on bile acid metabolism. Our data show that, in mice, intrahepatic G6P regulates bile acid metabolism by a carbohydrate response element‐binding protein (ChREBP; also known as Mlxipl)‐dependent induction of CYP8B1, resulting in an increased hydrophobicity of biliary bile acids and reduced fecal cholesterol loss. On the other hand, hepatic CYP7A1 expression was regulated by extrahepatic (blood) glucose rather than intrahepatic G6P.
Materials and Methods
Animals
Male adult (8‐12 weeks) B6.G6pc lox/lox and B6.G6pc lox/lox.SAcreERT2/w mice,14 male L‐FoxO1,3,4−/− and L‐FoxO1,3,4+/+ mice (18‐20 weeks old),15 and C57BL/6 mice (12‐13 weeks old, local breeding) were housed in a light‐ and temperature‐controlled facility and fed a standard laboratory chow diet (RMH‐B; AB‐diets, Woerden, The Netherlands). Liver‐specific G6pc‐deficient mice (L‐G6pc−/−) and wild‐type (WT) littermates (L‐G6pc+/+) were generated as described.14 For tissue collection, mice were sacrificed by cardiac puncture 10 days after the last tamoxifen injection in nonfasted conditions, unless stated otherwise. In separate experiments requiring bile collection, mice were anesthetized by intraperitoneal injection of Hypnorm (10 mL/kg; Janssen Pharmaceuticals, Tilburg, The Netherlands) and diazepam (10 mg/kg; Actavis, Baarn, The Netherlands), the bile duct was ligated, the gallbladder was cannulated, and bile was collected for 30 minutes.
Male L‐FoxO1,3,4−/−, L‐FoxO1,3,4+/+ mice and C57BL/6 mice were equipped with a permanent catheter in the right jugular vein for infusions and were allowed a recovery period of at least 4 days. Mice were kept in experimental cages during the experiment and the preceding fasting period, allowing frequent collection of tail blood samples. After overnight fasting, mice were infused for 6 hours with S4048 (a generous gift from Sanofi‐Aventis, Frankfurt, Germany, 5.5 mg/mL of phosphate‐buffered saline (PBS) with 6% dimethyl sulfoxide at 0.135 mL/h) or vehicle. Blood glucose concentrations were measured in tail blood every 30 minutes during the experiment. All experimental procedures were approved by the Institutional Animal Care and Use Committee of the University of Groningen.
Construction, Production, and In Vivo Transduction of Short Hairpin RNAs Using Self‐Complementary Adeno‐Associated Virus Vectors
To construct the self‐complementary (scAAV) adeno‐associated virus (AAV) 2/8‐U6‐shChREBP, the scAAV2‐LP1‐hFIXco backbone vector was restricted with BamHI and BbsI and the 3,493‐bp (base pair) fragment was isolated and ligated. Restriction with BamHI and Bbsl removed hFIXco and partially deleted the LP1 promoter, and the U6 promoter driving the expression of the construct was cloned into the vector in antisense orientation. Short hairpin RNA (shRNA) construct directed against ChREBPα/β and scramble construct were ordered as oligonucleotides (shRNA; 5′‐aat tcA AAA AAT GTA GTT TGA AGA TGT GGG TCT CGA GAC CCA CAT CTT CAA ACT ACA TC‐3′ and 3′‐ggc caG ATG TAG TTT GAA GAT GTG GGT CTC GAG ACC CAC ATC TTC AAA CTA CAT TTT TT‐5′, scramble; 5′‐aat tcG TTG TAA GTG GAG GTT TAA GTC TCG AGA CTT AAA CCT CCA CTT ACA ACA CCG GT‐3′ and 3′‐ggc caA CCG GTG TTG TAA GTG GAG GTT TAA GTC TCG AGA CTT AAA CCT CCA CTT ACA AC‐5′) and cloned into the vector using EcoRI and AgeI. Production, purification, and titration of these AAV2/8 viruses encoding the shRNA directed against ChREBPα and ChREBPβ and the scrambled control were performed as described.16 Mice were injected with 5 × 10¹² virus particles per mouse and sacrificed 30 days after virus administration.
Immortalized Human Hepatocyte Glucose Stimulation and Transient Transfection Assays
For glucose stimulation, immortalized human hepatocyte (IHH) cells17 were glucose‐deprived in Dulbecco’s modified Eagle’s medium (Thermo Scientific, Landsmeer, The Netherlands) without glucose, supplemented with 1% penicillin/streptomycin, 0.1% fatty‐acid–free bovine serum albumin, 16 mU/mL of insulin, 2 mM of GlutaMAX (Thermo Scientific) and 1 mM of glucose for 16 hours. Cells were subsequently incubated with low (1 mM) or high (11 mM) glucose concentrations for 24 hours. For transient transfection assays, IHH cells were transfected for 48 hours using Lipofectamine RNAiMAX Reagent (Thermo Scientific), according to the manufacturer’s protocol, with 50 nM of ChREBP small interfering RNAs (siChREBP)18 or control small interfering RNA (siRNA; #12935‐100; Thermo Scientific) in Williams E medium containing 2 mM of glutamine and supplemented with 2% fetal calf serum, 20 mU/mL of insulin, and 50 nM of dexamethasone.
Analytical Procedures
Blood glucose was measured using a One Touch Ultra glucose meter (LifeScan, Inc., Milpitas, CA). Plasma insulin and glucagon were analyzed using commercially available enzyme‐linked immunosorbent assays (Chrystal Chem, Downers Grove, IL and Alpco Diagnostics, Salem, NH, respectively). To quantify plasma plant sterols, plasma lipids were extracted according to Folch lipid extraction,19 methanolyzed, silylated, and analyzed with gas chromatography (GC). Commercially available kits were used to analyze plasma levels of triglycerides (Roche, Mannheim, Germany) and plasma levels of total and free cholesterol (Roche and DiaSys, Holzheim, Germany, respectively). Hepatic glycogen and G6P content was determined as described.20 Plasma and biliary bile acid composition were quantified using liquid chromatography‐mass spectrometry; fecal bile acid composition was quantified using capillary GC as described.21 The hydrophobicity index of biliary bile acids was calculated according to Heuman.22 Fecal cholesterol and its derivatives were trimethylsilylated with pyridine, N,O‐Bis(trimethylsilyl) trifluoroacetaminde, and trimethylchlorosilane (ratio 50:50:1) and quantified by GC.
Gene Expression Analysis
Total RNA was isolated using TRI‐Reagent (Sigma‐Aldrich Corp., St. Louis, MO). Complementary DNA was obtained by reverse transcription and amplified using primers and probes listed in Supporting Table S6. mRNA levels were calculated based on a dilution curve, expressed relative to 36b4 for liver and 18S for IHH cells, and normalized to their controls.
Targeted Proteomics
Targeted proteomics was applied in homogenized liver tissue by the isotopically labeled peptide standards (G6PC; GLGVDLLWTLEK, CYP8B1; VFGYQSVDGDHR, ChREBP; LGFDTLHGLVSTLSAQPSLK, CYP7A1; LSSASLNIR, oxysterol 7α‐hydroxylase [CYP7B1]; YITFVLNPFQYQYVTK, sterol 27‐hydroxylase [CYP27A1]; LYPVVPTNSR, cytochrome P450, family 2, subfamily c, polypeptide 70 [CYP2C70]; TDSSLLSR), containing 13C‐labeled lysine/arginine (PolyQuant GmbH, Bad Abbach, Germany), according to the workflow described.21 The following alterations were made: Lipids were extracted from liver homogenates with diethyl ether before the proteomics workflow and the concentrations were related to the total peptide content, which was determined by a colorimetric peptide assay after tryptic digestion and SPE cleanup (Thermo Scientific). Concentrations of endogenous peptides were calculated from the known concentration of the standard and expressed in fmol/µg of total peptide and expressed relative to the values in the control group.
Cell Reporter Assays
CV1 cells (ATCC) were transiently transfected using FuGENE 6 Transfection Reagent (Promega, Leiden, The Netherlands). pCMVS4/ChREBPα, pCMVS4/ChREBPβ, and pCMVS4/Mlx (kind gifts from M. Herman) were shuttled to pcDNA3.1 using cloning PCR. Primers are listed in Supporting Table S6. The human or mouse PGL3/Cyp8b1 promoter luciferase reporter (–623/+364 bp and –1,582/+115 bp respectively, kind gifts from J. Chiang) or minimal promoter PGL3/ChREBP luciferase reporter (–40/+12; kind gift from H. Towle) was cotransfected with pcDNA3.1/ChREBPα, pcDNA3.1/ChREBPβ, pcDNA3.1/Mlx, pcDNA3.1/Hnf4α (hepatocyte nuclear factor 4 alpha), or a combination for 48 hours. Cell lysis and luciferase assays were performed using a Dual‐Luciferase Reporter Assay System (Promega).
Chromatin Immunoprecipitation/qPCR
Chromatin immunoprecipitation (ChIP) analysis was performed as described,23 with the following modifications. Before cross‐linking with 1% formaldehyde, livers were homogenized in PBS and cross‐linked with 0.5 M of di(N‐succinimidyl) glutarate for 45 minutes at room temperature. Immunoprecipitation of samples was performed overnight at 4°C with 3 µg of ChREBP (Novus), acetylated histone 4 (Ac‐H4; Millipore), acetylated histone 3 (Ac‐H3; Millipore), HNF4A (Santa Cruz), or normal rabbit immunoglobulin G (IgG) antibody (Santa Cruz). DNA was purified using the PCR Clean‐up Extraction Kit (Macherey‐Nagel), after which qPCR was performed. Primers are listed in Supporting Table S7.
Statistical analysis
Statistical analysis was performed using BrightStat software. Differences between two or multiple groups were tested by Mann‐Whitney U test or Kruskal‐Wallis H test followed by post‐hoc Conover pair‐wise comparisons, respectively. P values <0.001 (***), 0.001‐0.01 (**), and 0.01‐0.05 (*) were considered significant. Correlations were analyzed by Spearman’s correlations coefficient using SPSS software (version 24.0 for Windows; SPSS, Chicago, IL).
Results
Hepatic G6P Accumulation Modifies Bile Acid Synthesis
To establish the selective impact of intracellular glucose on hepatic bile acid synthesis, C57BL/6 mice were infused during 6 hours with S4048, a selective inhibitor of the G6P transporter, SLC37A4, thereby acutely inducing GSD Ib in liver.24 S4048 reduced blood glucose concentrations and increased hepatic G6P and glycogen contents, whereas glucagon‐to‐insulin ratios were increased (Supporting Table S1). Hepatic mRNA levels of genes involved in bile acid synthesis showed a marked increase in Cyp8b1 expression, whereas Cyp7a1 and Cyp27a1 expression were reduced and Cyp7b1 and Cyp2c70 expression remained unchanged (Fig. 1A). S4048 infusion did not alter biliary bile acid composition or plasma bile acid levels (Fig. 1B and Supporting Fig. S1A). Presumably, the time frame of S4048 infusion is too short to translate into altered bile acid composition: The cycling time of the murine bile acid pool is approximately 4‐5 hours, and only 5% of biliary bile acids is derived from de novo synthesis.25
Figure 1.

Hepatic G6P accumulation modifies bile acid synthesis. (A) Hepatic mRNA levels of bile acid synthesis genes and (B) biliary bile acid composition in C57BL/6 mice infused with S4048 or vehicle (n = 7). (C) Hepatic mRNA levels of bile acid synthesis genes in overnight fasted L‐G6pc−/− mice and L‐G6pc +/+ mice (n = 7‐8). (D) Biliary bile acid composition. (E) Biliary bile acid secretion and plasma bile acid levels in L‐G6pc−/− and L‐G6pc +/+ mice (n = 7‐8). (F) Hepatic mRNA and protein levels of CYP7A1 in L‐G6pc−/− mice and L‐G6pc +/+ mice in either fed state or after an overnight fast (n = 7‐8). (G) Correlation between blood glucose levels and hepatic CYP7A1 protein levels and correlation between blood glucose levels and plasma C4 levels in L‐G6pc−/− mice and L‐G6pc +/+ mice in either fed state or after an overnight fast (n = 7‐8). (H) Hepatic mRNA and protein levels of CYP8B1 in L‐G6pc−/− mice and L‐G6pc +/+ mice in either fed state or after an overnight fast (n = 7‐8). Data represent Tukey box plots. ***P < 0.001; **P < 0.01; *P < 0.05. See also Supporting Fig. S1 and Supporting Tables S1, S2, and S3. Abbreviation: BW, body weight.
Next, we performed similar analyses in mice with sustained hepatic G6P accumulation, that is, fasted liver‐specific G6pc knockout (L‐G6pc−/−) mice,14 which exhibited increased glucagon‐to‐insulin ratios (Supporting Table S1). In these animals, hepatic Cyp8b1 mRNA levels were also strongly elevated whereas expression of Cyp7a1, Cyp27a1, Cyp7b1, and Cyp2c70 was significantly lower as compared to L‐G6pc +/+ littermates (Fig. 1C). Altered expression of bile acid synthesis genes in L‐G6pc−/− mice did translate into a relative increase in CA and CA‐derived bile acids (Fig. 1D; Table 1). Similar increases in CA and DCA and concomitant decreases in CDCA and CDCA‐derived MCAs were observed in plasma and feces from L‐G6pc−/− mice (Supporting Fig. S1B,C; Supporting Table S2). Biliary bile acid secretion rates and plasma bile acid concentrations were not different between L‐G6pc−/− and L‐G6pc +/+ mice (Fig. 1E; Table 1).
Table 1.
Bile Characteristics in Chow‐Fed Male L‐G6pc−/− Mice and WT Littermates
| L‐G6pc +/+ | L‐G6pc−/− | P Value | |
|---|---|---|---|
| Median (Range) | Median (Range) | ||
| Body weight (g) | 28.4 (21.5‐29.9) | 27.5 (25.3‐32.5) | 0.645 |
| Bile flow (µL/min/100 g BW) | 12.2 (8.5‐15.0) | 14.6 (12.3‐18.5) | 0.021 |
| Bile acid secretion (nmol/min/100 g BW) | 305.1 (244.3‐587.5) | 313.3 (229.7‐514.5) | 0.878 |
| Phospholipid secretion (nmol/min/100 g BW) | 81.1 (75.3‐164.9) | 109.7 (93.2‐159.4) | 0.038 |
| Cholesterol secretion (nmol/min/100 g BW) | 11.6 (9.5‐17.1) | 12.7 (10.7‐18.6) | 0.161 |
| Bile acid species secretion (nmol/min/100 g BW) | |||
| CA | 3.88 (1.18‐7.15) | 3.13 (0.86‐6.07) | 0.959 |
| GCA | 0.58 (0.21‐1.21) | 0.45 (0.31‐0.75) | 0.279 |
| TCA | 150.17 (124.91‐292.16) | 226.74 (164.34‐344.06) | 0.028 |
| TUDCA | 5.11 (3.86‐11.26) | 3.92 (2.58‐7.33) | 0.105 |
| TCDCA | 2.01 (1.61‐4.98) | 2.63 (1.32‐5.84) | 0.645 |
| TDCA | 6.59 (3.40‐13.85) | 9.18 (2.14‐15.74) | 0.442 |
| THDCA | 2.27 (0.56‐3.89) | 1.40 (0.79‐2.17) | 0.279 |
| α‐MCA | 0.40 (0.14‐1.48) | 0.31 (0.00‐1.18) | 0.279 |
| Tα‐MCA | 11.37 (9.18‐36.33) | 12.48 (6.90‐29.22) | 0.878 |
| β‐MCA | 2.65 (0.52‐5.13) | 0.42 (0.00‐1.17) | 0.007 |
| Tβ‐MCA | 117.01 (87.53‐212.07) | 52.38 (30.24‐117.05) | 0.002 |
| ω‐MCA | 2.61 (0.84‐7.07) | 0.84 (0.38‐1.78) | 0.005 |
Abbreviations: BW, body weight; GCA, glycocholic acid; TCA, taurocholic acid; TUDCA, tauroursodeoxycholic acid; TCDCA, taurochenodeoxycholic acid; TDCA, taurodeoxycholic acid; THDCA, taurohyodeoxycholic acid; α‐MCA, alpha‐muricholic acid; Tα‐MCA, tauro‐alpha‐muricholic acid; β‐MCA, beta‐muricholic acid; Tβ‐MCA, tauro‐beta‐muricholic acid; ω‐MCA, omega‐muricholic acid. P values <0.05 are marked in bold.
Interestingly, hepatic CYP7A1 protein levels, but not Cyp7a1 mRNA levels, were lower in L‐G6pc−/− mice as compared to WT littermates (Fig. 1F), and hepatic CYP7A1 protein levels positively correlated with blood glucose levels (Fig. 1G). Similar correlations were observed for plasma 7α‐hydroxy‐4‐cholesten‐3‐one (C4) levels, the product of CYP7A1 and a marker of its activity26 (Fig. 1G). C4 levels were significantly lower in fasted L‐G6pc−/− mice compared to WT littermates (Supporting Fig. S1D). On the other hand, hepatic CYP8B1 mRNA and protein levels were significantly increased in L‐G6pc−/− mice irrespective of the feeding state (Fig. 1H).
ChREBP Mediates the Induction of Cyp8b1 in Response to Hepatic G6P Accumulation
To elucidate the mechanism of G6P‐dependent control of Cyp8b1, we performed S4048 infusions in mice lacking forkhead box O (FoxO) 1,3,4 expression in hepatocytes and in mice with reduced hepatic expression of the G6P‐sensitive transcription factor, ChREBP, which is activated in GSD Ia and GSD Ib.12, 24, 27 We confirmed that FoxOs control basal Cyp8b1 expression,4 and found that the S4048‐mediated induction of Cyp8b1 was absent in L‐FoxO1,3,4−/− mice (Fig. 2A). Interestingly, induction of Cyp8b1 upon S4048 infusion was also abolished in mice with reduced hepatic Chrebpα and Chrebpβ expression (Fig. 2A and Supporting Fig. S2B). Similar effects were observed on Cyp8b1 mRNA and protein levels upon hepatic ChREBP knockdown in L‐G6pc−/− mice (Fig. 2B,C). As shown above, S4048 infusion and hepatic G6pc deficiency caused reductions in Cyp7a1 expression. However, these reductions were not reversed by knockout of FoxOs or knockdown of hepatic ChREBP (Supporting Fig. S2A,C,D). Thus, ChREBP mediates the induction of hepatic Cyp8b1, but not the repression of Cyp7a1, in liver‐specific GSD Ia and GSD Ib mice.
Figure 2.
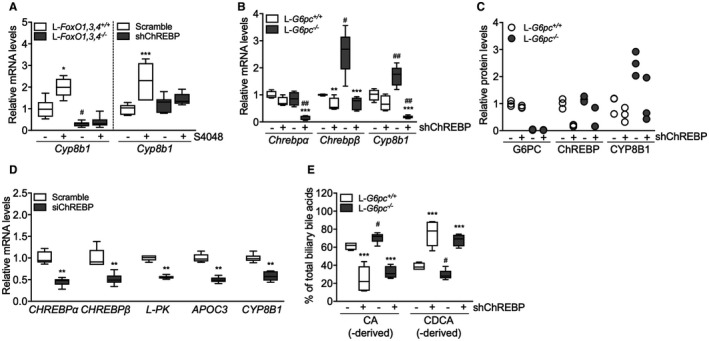
ChREBP mediates induction of Cyp8b1 in response to hepatic G6P accumulation. (A) Hepatic mRNA levels of Cyp8b1 in L‐FoxO1,3,4−/− and L‐FoxO1,3,4 +/+ mice and in C57BL/6 mice treated with either shChREBP or scrambled shRNA, infused with S4048 or vehicle (n = 7‐8). (B) Hepatic mRNA levels in L‐G6pc−/− and L‐G6pc +/+ mice, treated with either shChREBP or scrambled shRNA (n = 4‐6). (C) Hepatic protein levels in L‐G6pc−/− and L‐G6pc +/+ mice, treated with either shChREBP or scrambled shRNA (n = 3). (D) mRNA expression in IHH cells transfected with siChREBP or scramble after high (11 mM) glucose exposure for 24 hours (n = 6). (E) Biliary bile acid composition in L‐G6pc−/− and L‐G6pc +/+ mice treated with either shChREBP or scrambled shRNA (n = 4‐5). Data represent Tukey box plots. ***P < 0.001; **P < 0.01; *P < 0.05 indicates significance compared to scrambled shRNA. # P < 0.05 indicates significance compared to WT littermates. See also Supporting Fig. S2 and Supporting Tables S4 and S5.
We also tested whether established transcriptional regulators of Cyp8b1 are altered in response to hepatic G6P‐ChREBP signaling. Hepatic expression of nuclear receptor subfamily 1 group H member 4 (farnesoid X receptor; Fxr), nuclear receptor subfamily 5 group A member 2 (liver receptor homolog 1; Lrh‐1), Hnf4a (Hnf4α), and MAF BZIP transcription factor G (Mafg) remained largely unaffected upon hepatic G6P accumulation (Supporting Fig. S2E,F), indicating that these factors cannot explain the induction of Cyp8b1 in response to G6P accumulation. We noted that the expression of some of these factors was reduced exclusively when ChREBP was knocked down in S4048‐treated or L‐G6pc−/− mice (Supporting Fig. S2E,F), though the biological significance of this is unclear. Hepatic nuclear receptor subfamily 0, group B, member 2 (small heterodimer partner; Shp) mRNA levels were lower in S4048‐treated and L‐G6pc−/− mice as compared to their controls, and were further reduced in response to hepatic ChREBP knockdown in L‐G6pc +/+ and L‐G6pc−/− mice (Supporting Fig. S2E,F). Thus, Fxr, Shp, Lrh‐1, Hnf4α, and Mafg mRNA levels did not consistently follow the pattern of CYP8B1 expression in response to hepatic G6P‐ChREBP signaling (Fig. 2A‐C and Supporting Fig. S2E,F).
Cyp8b1 Induction by G6P‐ChREBP Is Cell Autonomous and Occurs in Human Cells
To assess whether this G6P‐ChREBP–dependent modulation of CYP8B1 is conserved in human hepatocytes, we exposed IHH cells, that are glucose responsive,17 to high‐ and low‐glucose culture media. We also transfected them with siChREBP or scrambled siRNAs under conditions of high‐glucose exposure. As expected, high glucose induced CHREBPα mRNA levels, as well as the expression of its target genes, CHREBPβ, L‐type pyruvate kinase (L‐PK) and apolipoprotein C3 (APOC3; Supporting Fig. S2G), whereas siChREBP reduced all of these (Fig. 2D). Combined with the in vivo data shown above, these in vitro findings demonstrate that ChREBP activity is necessary and sufficient for CYP8B1 induction by intracellular glucose metabolism, in a cell‐autonomous manner.
On the other hand, CYP7A1 expression in IHHs was not similarly regulated. Consistent with published data,9 CYP7A1 mRNA levels were induced upon high‐glucose exposure (Supporting Fig. S2G). However, siChREBP did not reverse this effect; in fact, it amplified it (Supporting Fig. S2G). Thus, CYP7A1 mRNA levels are induced in response to glucose exposure in IHHs, but not through ChREBP. CYP7B1 was not regulated by glucose or siChREBP (Supporting Fig. S2G), and CYP27A1 is not expressed by IHH cells.
Hepatic G6P‐ChREBP Signaling Regulates Bile Acid Composition
Then, we evaluated whether G6P‐ChREBP–dependent induction of Cyp8b1 translated into qualitative changes in biliary and plasma bile acids. Hepatic G6P accumulation increased the contribution of biliary CA and DCA and increased plasma CA and DCA levels in L‐G6pc−/− mice whereas administration of shChREBP had the opposite effect (Fig. 2E and Supporting Fig. S2H; Supporting Tables S3, S4, and S5), consistent with the observed decrease in hepatic Cyp8b1 expression (Fig. 2B,C and Supporting Fig. S2B). Combined, these data indicate that G6P‐ChREBP induce qualitative changes in biliary and plasma bile acid composition through induction of hepatic Cyp8b1 expression.
ChREBP Does Not Directly Regulate Hepatic Cyp8b1 Transcription
We next investigated whether ChREBP directly regulates Cyp8b1 transcription. Analysis of a hepatic ChREBP ChIP sequencing (ChIP‐seq) data set28 indicated potential regulation of Cyp8b1 by ChREBP. Computational analysis revealed three putative ChREBP response elements similar to the ChREBP consensus sequence (CAYGYGnnnnnCRCRTG) and one element with an alternative sequence (GGGGGYGGGC) in the mouse Cyp8b1 promoter (Fig. 3A). Cell reporter assays did not show transactivation of the murine or human Cyp8b1 promoter by ChREBPα or ChREBPβ, whereas both Cyp8b1 reporters used were transactivated by Hnf4α (Fig. 3B),29 and the minimal acetyl‐CoA carboxylase alpha (acetyl‐CoA carboxylase; Acc) promoter30 did show ChREBP responsiveness (Fig. 3B). In agreement with these findings, in vivo ChIP analysis did not show a strong interaction of ChREBP with the putative response elements in the mouse Cyp8b1 promoter whereas S4048 treatment promoted ChREBP recruitment to the pyruvate kinase L/R (L‐pk) promoter (Fig. 3A,C).31 Moreover, HNF4α recruitment to the Cyp8b1 and L‐pk promoter regions was not altered upon ChREBP knockdown, indicating that the effect of ChREBP was likely not mediated by increased HNF4α binding to Cyp8b1 (Supporting Fig. S3A). We confirmed that acetylated histone 3 and 4 (H3/4) mainly interacted with the transcribed region of the Cyp8b1 promoter (Supporting Fig. S3B and Fig. 3D).32 Interestingly, recruitment of Ac‐H4 in the promoter region (–1,500 bp) and further downstream (+5,000 bp) in the Cyp8b1 gene was induced upon hepatic G6P accumulation and reduced upon ChREBP knockdown in S4048‐treated mice, whereas we did not observe clear changes in binding of Ac‐H3 under conditions of combined hepatic ChREBP knockdown and G6P accumulation (Fig. 3D). Altogether, these findings demonstrate that induction of Cyp8b1 expression by G6P‐ChREBP is associated with increased recruitment of Ac‐H4, but not of ChREBP, HNF4α, or Ac‐H3, to the Cyp8b1 locus. These effects were paralleled by a ChREBP‐dependent induction of ATP citrate lyase (Acly) expression (Figs. 3E and 2D), the essential enzyme for glucose‐induced histone acetylation in vitro.33
Figure 3.
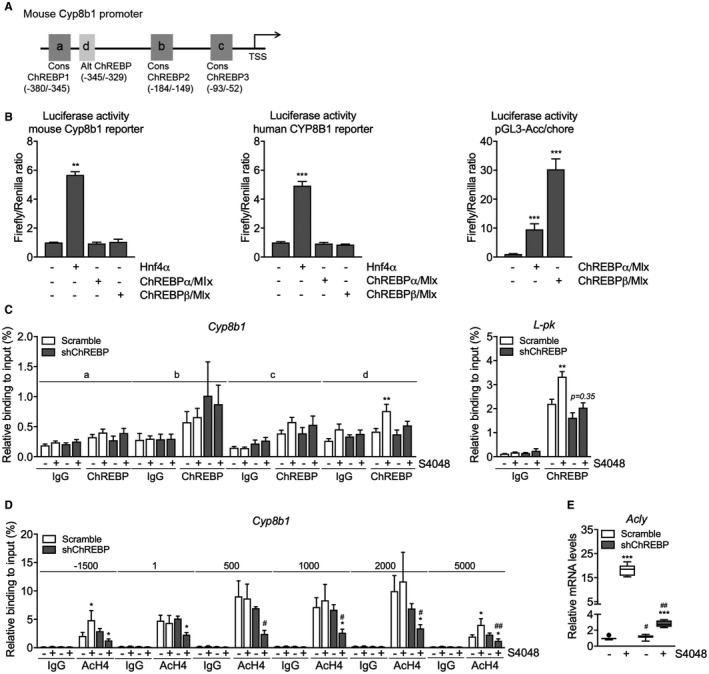
ChREBP does not directly regulate hepatic Cyp8b1 transcription. (A) Schematic presentation of putative consensus and alternative ChREBP response elements within the murine Cyp8b1 promoter. (B) Luciferase activity for the murine and human CYP8B1 promoter reporter and minimal promoter ACC/chore after transfection with Hnf4α, ChREBPα, and ChREBPβ plasmids (n = 5‐6). (C) In vivo ChIP analysis of the putative ChREBP response elements in the hepatic Cyp8b1 and L‐pk gene and (D) of acetylated histone H4 around the hepatic Cyp8b1 gene in mice treated with either shChREBP or scrambled shRNA and infused with S4048 or vehicle (n = 7). (E) Hepatic mRNA levels of Acly in C57BL/6 mice treated with either shChREBP or scrambled shRNA, infused with S4048 or vehicle (n = 7‐8). Data are represented as means ± SEM. ***P < 0.001; **P < 0.01; *P < 0.05 indicates significance compared to vehicle controls. ## P < 0.01; # P < 0.05 indicates significance compared to controls treated with scrambled shRNA. See also Supporting Fig. S3. Abbreviations: Alt, alternative; chore, carbohydrate response element; Cons, consensus; TSS, transcription start site.
G6P‐ChREBP Increases Biliary Bile Acid Hydrophobicity and Reduces Fecal Sterol Loss
A shift in the contribution of CA‐ versus CDCA‐derived bile acids alters the hydrophobicity of the bile acid pool22 and, in turn, changes the capacity for intestinal lipid solubilization and uptake.1, 7, 34, 35, 36 Induction of hepatic Cyp8b1 expression and relative increase in CA and DCA in L‐G6pc−/− mice (Fig. 1C,D) increased the hydrophobicity index of the biliary bile acids entering the intestine (Fig. 4A) whereas hepatic ChREBP knockdown reduced this index (Fig. 4B). We confirmed that hepatic Cyp8b1 expression was positively correlated to biliary bile acid hydrophobicity in L‐G6pc−/− mice37 (Supporting Fig. S4A) and hypothesized that altered hydrophobicity in response to G6P‐ChREBP‐CYP8B1 signaling impacts intestinal sterol absorption.34, 36 Hepatic Cyp8b1 expression indeed negatively correlated with fecal neutral sterol excretion36 (Supporting Fig. S4B). Fecal neutral sterol excretion was reduced in L‐G6pc−/− mice (Fig. 4C and Supporting Fig. S4C) and, as expected, increased upon hepatic ChREBP knockdown (Fig. 4D and Supporting Fig. S4C). The plasma campesterol/cholesterol ratio, a marker of intestinal cholesterol absorption,38 showed similar patterns (Fig. 4E). Bile acid hydrophobicity and fecal neutral sterol excretion were found to be negatively correlated (Fig. 4F) and hepatic Chrebpβ mRNA expression showed a positive correlation to hydrophobicity index (Fig. 4G), whereas it was negatively correlated with fecal neutral sterol excretion (Fig. 4H). Fecal energy and fatty acid excretion remained unchanged in response to hepatic G6P accumulation or ChREBP knockdown (Supporting Fig. S4D,E).
Figure 4.
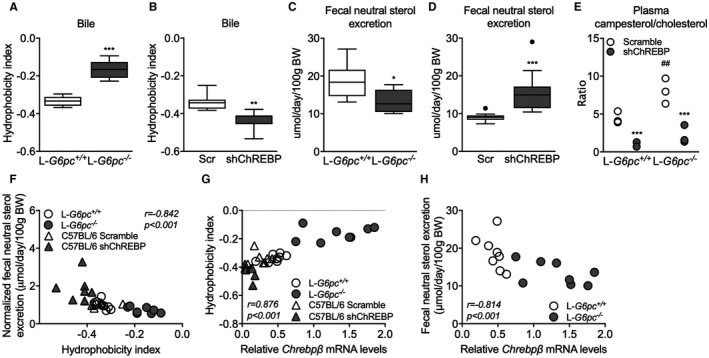
G6P‐ChREBP increases biliary bile hydrophobicity and reduces fecal sterol loss. (A) Bile hydrophobicity index of bile from L‐G6pc−/− and L‐G6pc +/+ mice and (B) mice treated with either shChREBP or scrambled (Scr) shRNA (n = 7‐8). (C) Fecal neutral sterol excretion of L‐G6pc−/− and L‐G6pc +/+ mice (n = 8) and (D) mice treated with either shChREBP or scrambled shRNA (n = 14). (E) Plasma campesterol/cholesterol ratios in L‐G6pc−/− and L‐G6pc +/+ mice treated with either shChREBP or scrambled shRNA (n = 3). (F) Correlation between bile hydrophobicity index and normalized fecal neutral sterol excretion and between (G) Chrebpβ mRNA levels and bile hydrophobicity index in L‐G6pc−/− and L‐G6pc +/+ mice and mice treated with either shChREBP or scrambled shRNA (n = 7‐8). (H) Correlation between Chrebpβ mRNA levels and fecal neutral sterol excretion in L‐G6pc−/− and L‐G6pc +/+ mice (n = 8). Data represent Tukey box plots. ***P < 0.001; **P < 0.01; *P < 0.05 indicates significance compared to WT littermates or controls treated with scrambled shRNA. ## P < 0.01 indicates significance compared to WT littermates. See also Supporting Fig. S4. Abbreviation: BW, body weight.
Discussion
In the current study, we characterized an important regulatory role of glucose, independent of insulin, in the control of hepatic bile acid synthesis. Using the monogenetic disease GSD I as a model to establish the contribution of intrahepatic glucose, we show that G6P controls hepatic bile acid synthesis through ChREBP‐dependent induction of Cyp8b1 in mice. Our findings furthermore indicate that the G6P‐ChREBP axis regulates hepatic CYP8B1 expression through H4 acetylation dynamics. As a consequence, G6P‐ChREBP signaling increases the relative abundance of CA‐derived bile acids and induces physiologically relevant shifts in bile composition. We confirmed that the human CYP8B1 gene is regulated by a similar mechanism. Importantly, our work also demonstrates the physiological relevance of this regulatory mechanism: The G6P‐ChREBP‐dependent change in bile acid hydrophobicity in mice associates with reduced fecal neutral sterol loss and lower plasma campesterol/cholesterol ratios, compatible with enhanced intestinal cholesterol absorption (Fig. 5).
Figure 5.
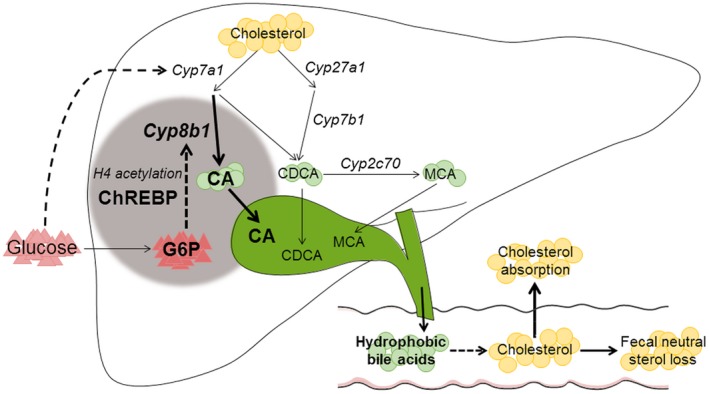
Working model of the mechanism by which intrahepatic glucose controls bile acid synthesis and intestinal cholesterol handling in mice. Intrahepatic glucose (G6P) controls bile acid synthesis through a ChREBP‐dependent induction of Cyp8b1 by H4 acetylation, whereas hepatic Cyp7a1 expression is regulated by blood glucose levels. Hepatic G6P‐ChREBP‐CYP8B1 hence induces corresponding shifts in bile composition, which subsequently promotes intestinal cholesterol absorption.
Besides G6P‐dependent regulation of CYP8B1, we found that hepatic levels of CYP7A1 protein, the supposedly rate‐controlling enzyme in bile acid synthesis,6 as well as the plasma concentrations of its product C4 correlated with circulating glucose levels. Several studies have reported altered hepatic Cyp7a1 mRNA expression in response to changes in hepatic glucose availability.9, 39 We and others have shown that type 1 and type 2 diabetic rodents exhibit increased hepatic expression of Cyp7a1 39 and an enlarged bile acid pool.40, 41 On the other hand, prolonged fasting decreases hepatic Cyp7a1 mRNA expression in mice, with a concomitant reduction of total bile acid pool size,39 consistent with our finding that hypoglycemia is associated with lower hepatic CYP7A1 protein levels. These data indicate that blood glucose level regulates CYP7A1 protein levels independently of hepatic G6P accumulation, possibly through its effect on the insulin‐to‐glucagon ratio,8, 9 but independently of hepatic FOXO1,3,4 or ChREBP expression (Supporting Fig. S2A‐D).
We thus show that hepatic CYP7A1 expression is partly controlled by circulating glucose levels, whereas intrahepatic glucose (G6P) appears to be the major regulator of CYP8B1 expression. Previous studies have reported an induction of Cyp8b1 by glucose in vitro 9 and an insulin‐mediated suppression of the gene in vivo.2, 4 We now show, in insulin‐sensitive mice, that glucose‐mediated induction of Cyp8b1 requires hepatic ChREBP. Importantly, we observed that ChREBP‐dependent regulation of Cyp8b1 expression in response to intracellular glucose signaling was rapid (i.e., within 6 hours in S4048‐exposed mouse liver) and also occurred in cultured human hepatocytes (IHH cells). Thus, the observed reduction of CYP8B1 mRNA levels upon ChREBP knockdown in IHH cells indicates a cell‐autonomous relationship between ChREBP and CYP8B1 expression that is independent of circulating factors or potential changes in hepatic inflammation or injury.
Although we did not identify a direct transcriptional regulation of the CYP8B1 promoter by ChREBP, the G6P‐ChREBP–dependent changes in hepatic Cyp8b1 expression were paralleled by altered H4 acetylation patterns in the CYP8B1 promoter and more downstream in the gene. Increased H4 acetylation levels in response to hepatic G6P‐ChREBP signaling likely promoted chromatin relaxation in these regions, resulting in an induction of Cyp8b1 transcription. ChREBP is a key determinant of glycolysis and a direct transcriptional regulator of ACLY,28, 42 the essential enzyme for glucose‐induced histone acetylation.9, 33 In the current study, we observed consistent changes in Acly expression, H4 acetylation patterns, and CYP8B1 expression in response to G6P‐ChREBP signaling. In contrast, expression of other potential mediators of the G6P‐ChREBP–dependent Cyp8b1 regulation (i.e., FXR, SHP, LRH‐1, HNF4α, and MAFG) did not consistently follow the pattern of Cyp8b1 expression in response to G6P‐ChREBP signaling. We therefore propose that the G6P‐ChREBP axis controls the CYP8B1‐mediated pathway in bile acid synthesis through H4 acetylation dynamics.
Hydrophobic bile acids effectively promote the absorption of dietary lipids and sterols,34, 35, 36 whereas a more hydrophilic bile acid pool is associated with enhanced intestinal cholesterol excretion.21 Our data strongly suggest that ChREBP activity contributes to cholesterol homeostasis in mice through its effect on CYP8B1 and hence on bile acid composition. The ChREBP‐mediated increase in CA and decrease in β‐MCA synthesis resulted in more hydrophobic bile that was paralleled by reduced fecal neutral sterol excretion. Because dietary cholesterol intake (data not shown), biliary cholesterol excretion (Table 1), and jejunal and ileal mRNA expression of Niemann‐Pick C1‐like 1, ATP binding cassette subfamily G member 5, ATP binding cassette subfamily G member 8, and acetyl‐CoA acetyltransferase 2 (data not shown) were similar in L‐G6pc−/− mice and WT littermates, the reduction in neutral sterol excretion is most likely related to enhanced fractional cholesterol absorption as a consequence of the more hydrophobic bile acid pool in L‐G6pc−/− mice. We also show that normalization of bile composition upon hepatic ChREBP knockdown reverses reduced fecal neutral sterol excretion, consistent with the phenotype of Cyp8b1−/− mice and with the effect of Cyp8b1 inhibition in mice.34, 36, 43 However, in contrast to what was reported for Cyp8b1−/− mice fed a high‐fat diet,34, 36 fecal fatty acid and energy loss remained unaltered in the current study. In accord with our findings, Cyp8b1 heterozygous knockout mice displaying an intermediate phenotype with regard to bile acid pool composition also did not present changes in fecal calorie loss.34 The absence of a change in fecal excretion of nonsterol dietary fat could furthermore be attributed to the relatively low fat content of the chow diet used, the high efficiency of intestinal fatty acid absorption under normal conditions,44 and the fact that intestinal sterol absorption shows a larger dependency on bile acid hydrophobicity as compared to dietary fatty acids.35 Therefore, we conclude that activation of the hepatic G6P‐ChREBP‐CYP8B1 axis selectively reduces fecal cholesterol excretion in chow‐fed mice.
A major difference in bile acid metabolism between mice and humans is the presence of MCAs in murine bile, attributed to rodent‐specific C6 hydroxylation.45 Given that MCAs are very hydrophilic,22 the human bile acid pool is more hydrophobic as compared to mice. G6P‐ChREBP–mediated induction of Cyp8b1, promoting CA synthesis at the expense of dihydroxylated CDCA, would result in a more hydrophilic, rather than a more hydrophobic, bile acid pool in humans, with a potentially opposite effect on intestinal cholesterol absorption. There are no reports focusing on disturbed bile acid metabolism in GDS Ia patients, yet it is well known that bile acid metabolism is perturbed in type 2 diabetes.2, 4, 5 Although deviations in blood glucose are opposite in GSD Ia and diabetes, intrahepatic glucose metabolism is enhanced in both diseases and the hepatic phenotypes are very similar, rendering GSD Ia a “model” for diabetic liver disease.10, 11, 12, 13, 14, 15 Type 2 diabetic mice exhibit elevated hepatic Cyp8b1 expression and a corresponding increase in 12‐hydroxylated bile acids,4, 41 which has been attributed to IR and consequent FOXO activation.4 Given that hepatic ChREBP is also activated in type 2 diabetic mice and humans,46, 47, 48 increased G6P‐ChREBP signaling potentially contributes to perturbed bile acid metabolism in type 2 diabetes. Therefore, our current data underscore the need to establish the impact of intrahepatic G6P‐ChREBP signaling on bile acid pool composition in mice with a humanized bile acid pool45 and GSD I patients, as well as its contribution to perturbed bile acid metabolism in type 2 diabetes.
In conclusion, we present a mechanism by which intracellular glucose controls hepatic bile acid synthesis and intestinal cholesterol handling. The G6P‐ChREBP‐CYP8B1 signaling cascade that we have identified likely contributes to altered bile acid metabolism and its (patho)physiological consequences in conditions coinciding with excessive intrahepatic glucose signaling such as GSD I and type 2 diabetes.
Supporting information
Acknowledgment
We thank A. Jurdinski, R. Havinga, T. Boer, M. Koehorst, R. Boverhof, Y. van der Veen, K. Tholen, C. van der Leij, S.X. Lee, and Z. Unal for excellent technical assistance. We are thankful for receiving plasmids from M. Herman (pcDNA3.1/ChREBPα, pcDNA3.1/ChREBPβ, and pcDNA3.1/Mlx), J.W. Jonker (pcDNA3.1/Hnf4α), H. Towle (minimal promoter PGL3/ChREBP luciferase reporter), and J. Chiang (human and mouse PGL3/Cyp8b1 promoter luciferase reporters). We thank A. Herling and D. Schmoll (Sanofi) for providing S4048 and L. Chan for sharing the ChREBP ChIP‐seq data set.
Supported by an unrestricted research grant from DSM Nutritional Products (Kaiseraugst, Switzerland). M.H.O. is the recipient of a VIDI grant from the Dutch Scientific Organization and holds a Rosalind Franklin Fellowship from the University of Groningen. R.A.H. is supported by R01HL125649 from the National Institutes of Health. F.K. is supported by CardioVasculair Onderzoek Nederland (CVON2012‐03).
Potential conflict of interest: Nothing to report.
References
Author names in bold designate shared co‐first authorship.
- 1. Lefebvre P, Cariou B, Lien F, Kuipers F, Staels B. Role of bile acids and bile acid receptors in metabolic regulation. Physiol Rev 2009;89:147‐191. [DOI] [PubMed] [Google Scholar]
- 2. Haeusler RA, Astiarraga B, Camastra S, Accili D, Ferrannini E. Human insulin resistance is associated with increased plasma levels of 12α‐hydroxylated bile acids. Diabetes 2013;62:4184‐4191. [DOI] [PMC free article] [PubMed] [Google Scholar]
- 3. Bennion LJ, Grundy SM. Effects of diabetes mellitus on cholesterol metabolism in man. N Engl J Med 1977;296:1365‐1371. [DOI] [PubMed] [Google Scholar]
- 4. Haeusler RA, Pratt‐Hyatt M, Welch CL, Klaassen CD, Accili D. Impaired generation of 12‐hydroxylated bile acids links hepatic insulin signaling with dyslipidemia. Cell Metab 2012;15:65‐74. [DOI] [PMC free article] [PubMed] [Google Scholar]
- 5. Brufau G, Stellaard F, Prado K, Bloks VW, Jonkers E, Boverhof R, et al. Improved glycemic control with colesevelam treatment in patients with type 2 diabetes is not directly associated with changes in bile acid metabolism. Hepatology 2010;52:1455‐1464. [DOI] [PubMed] [Google Scholar]
- 6. Chiang JYL. Bile acids: regulation of synthesis. J Lipid Res 2009;50:1955‐1966. [DOI] [PMC free article] [PubMed] [Google Scholar]
- 7. Gälman C, Angelin B, Rudling M. Bile acid synthesis in humans has a rapid diurnal variation that is asynchronous with cholesterol synthesis. Gastroenterology 2005;129:1445‐1453. [DOI] [PubMed] [Google Scholar]
- 8. Li T, Kong X, Owsley E, Ellis E, Strom S, Chiang JYL. Insulin regulation of cholesterol 7α‐hydroxylase expression in human hepatocytes. J Biol Chem 2006;281:28745‐28754. [DOI] [PMC free article] [PubMed] [Google Scholar]
- 9. Li T, Chanda D, Zhang Y, Choi HS, Chiang JYL. Glucose stimulates cholesterol 7alpha‐hydroxylase gene transcription in human hepatocytes. J Lipid Res 2010;51:832‐842. [DOI] [PMC free article] [PubMed] [Google Scholar]
- 10. Ishida H, Yamashita C, Kuruta Y, Yoshida Y, Noshiro M. Insulin is a dominant suppressor of sterol 12α‐hydroxylase P450 (CYP8B) expression in rat liver: possible role of insulin in circadian rhythm of CYP8B. J Biochem 2000;127:57‐64. [DOI] [PubMed] [Google Scholar]
- 11. Bandsma RHJ, Grefhorst A, van Dijk TH, van der Sluijs FH, Hammer A, Reijngoud D‐J, et al. Enhanced glucose cycling and suppressed de novo synthesis of glucose‐6‐phosphate result in a net unchanged hepatic glucose output in ob/ob mice. Diabetologia 2004;47:2022‐2031. [DOI] [PubMed] [Google Scholar]
- 12. Oosterveer MH, Schoonjans K. Hepatic glucose sensing and integrative pathways in the liver. Cell Mol Life Sci 2014;71:1453‐1467. [DOI] [PMC free article] [PubMed] [Google Scholar]
- 13. Chou JY, Mansfield BC. Mutations in the glucose‐6‐phosphatase‐alpha (G6PC) gene that cause type Ia glycogen storage disease. Hum Mutat 2008;29:921‐930. [DOI] [PMC free article] [PubMed] [Google Scholar]
- 14. Mutel E, Abdul‐Wahed A, Ramamonjisoa N, Stefanutti A, Houberdon I, Cavassila S, et al. Targeted deletion of liver glucose‐6 phosphatase mimics glycogen storage disease type 1a including development of multiple adenomas. J Hepatol 2011;54:529‐537. [DOI] [PubMed] [Google Scholar]
- 15. Haeusler RA, Kaestner KH, Accili D. FoxOs function synergistically to promote glucose production. J Biol Chem 2010;285:35245‐5248. [DOI] [PMC free article] [PubMed] [Google Scholar]
- 16. Hermens WT, ter Brake O, Dijkhuizen PA, Sonnemans MA, Grimm D, Kleinschmidt JA, Verhaagen J. Purification of recombinant adeno‐associated virus by iodixanol gradient ultracentrifugation allows rapid and reproducible preparation of vector stocks for gene transfer in the nervous system. Hum Gene Ther 1999;10:1885‐1891. [DOI] [PubMed] [Google Scholar]
- 17. Samanez CH, Caron S, Briand O, Dehondt H, Duplan I, Kuipers F, et al. The human hepatocyte cell lines IHH and HepaRG: models to study glucose, lipid and lipoprotein metabolism. Arch Physiol Biochem 2012;118:102‐111. [DOI] [PubMed] [Google Scholar]
- 18. Tong X, Zhao F, Mancuso A, Gruber JJ, Thompson CB. The glucose‐responsive transcription factor ChREBP contributes to glucose‐dependent anabolic synthesis and cell proliferation. Proc Natl Acad Sci U S A 2009;106:21660‐21665. [DOI] [PMC free article] [PubMed] [Google Scholar]
- 19. Folch J, Lees M, Sloane GH. A simple method for the isolation and purification of total lipids from animal tissues. J Biol Chem 1957;266:497‐509. [PubMed] [Google Scholar]
- 20. Bergmeyer HU. Methods of enzymatic analysis In: Bergmeyer HU, ed. Methods of Enzymetic Analysis. Weinheim, Germany: Verlag Chemie; 1974:1089‐1204. [Google Scholar]
- 21. de Boer JF, Schonewille M, Boesjes M, Wolters H, Bloks VW, Bos T, et al. Intestinal farnesoid X receptor controls transintestinal cholesterol excretion in mice. Gastroenterology 2017;152:1126‐1138.e6. [DOI] [PubMed] [Google Scholar]
- 22. Heuman DM. Quantitative estimation of the hydrophilic‐ hydrophobic balance of mixed bile salt solutions. J Lipid Res 1989;30:719‐730. [PubMed] [Google Scholar]
- 23. Duggavathi R, Volle DH, Mataki C, Antal MC, Messaddeq N, Auwerx J, et al. Liver receptor homolog 1 is essential for ovulation. Genes Dev 2008;22:1871‐1876. [DOI] [PMC free article] [PubMed] [Google Scholar]
- 24. Grefhorst A, Schreurs M, Oosterveer MH, Cortés VA, Havinga R, Herling AW, et al. Carbohydrate‐response‐element‐binding protein (ChREBP) and not the liver X receptor α (LXRα) mediates elevated hepatic lipogenic gene expression in a mouse model of glycogen storage disease type 1. Biochem J 2010;432:249‐254. [DOI] [PubMed] [Google Scholar]
- 25. Kok T, Hulzebos CV, Wolters H, Havinga R, Agellon LB, Stellaard F, et al. Enterohepatic circulation of bile salts in farnesoid X receptor‐deficient mice: efficient intestinal bile salt absorption in the absence of ileal bile acid‐binding protein. J Biol Chem 2003;278:41930‐41937. [DOI] [PubMed] [Google Scholar]
- 26. Gälman C, Arvidsson I, Angelin B, Rudling M. Monitoring hepatic cholesterol 7alpha‐hydroxylase activity by assay of the stable bile acid intermediate 7alpha‐hydroxy‐4‐cholesten‐3‐one in peripheral blood. J Lipid Res 2003;44:859‐866. [DOI] [PubMed] [Google Scholar]
- 27. Abdul‐Wahed A, Gautier‐Stein A, Casteras S, Soty M, Roussel D, Romestaing C, et al. A link between hepatic glucose production and peripheral energy metabolism via hepatokines. Mol Metab 2014;3:531‐543. [DOI] [PMC free article] [PubMed] [Google Scholar]
- 28. Poungvarin N, Chang B, Imamura M, Chen J, Moolsuwan K, Sae‐Lee C, et al. Genome‐wide analysis of ChREBP binding sites on male mouse liver and white adipose chromatin. Endocrinology 2015;156:1982‐1994. [DOI] [PMC free article] [PubMed] [Google Scholar]
- 29. Inoue Y, Yu AM, Yim SH, Ma X, Krausz KW, Inoue J, et al. Regulation of bile acid biosynthesis by hepatocyte nuclear factor 4alpha. J Lipid Res 2006;47:215‐227. [DOI] [PMC free article] [PubMed] [Google Scholar]
- 30. O’Callaghan BL, Koo SH, Wu Y, Freake HC, Towle HC. Glucose regulation of the acetyl‐CoA carboxylase promoter PI in rat hepatocytes. J Biol Chem 2001;276:16033‐16039. [DOI] [PubMed] [Google Scholar]
- 31. Hasegawa J, Osatomi K, Wu RF, Uyeda K. A novel factor binding to the glucose response elements of liver pyruvate kinase and fatty acid synthase genes. J Biol Chem 1999;274:1100‐1107. [DOI] [PubMed] [Google Scholar]
- 32. Yamada A, Honma K, Mochizuki K, Goda T. BRD4 regulates fructose‐inducible lipid accumulation‐related genes in the mouse liver. Metabolism 2016;65:1478‐1488. [DOI] [PubMed] [Google Scholar]
- 33. Wellen KE, Hatzivassiliou G, Sachdeva UM, Bui TV, Cross JR, Thompson CB. ATP‐citrate lyase links cellular metabolism to histone acetylation. Science 2009;324:1076‐1080. [DOI] [PMC free article] [PubMed] [Google Scholar]
- 34. Bertaggia E, Jensen KK, Castro‐Perez J, Xu Y, Di Paolo G, Chan RB, et al. Cyp8b1 ablation prevents Western diet‐induced weight gain and hepatic steatosis because of impaired fat absorption. Am J Physiol Endocrinol Metab 2017;313:E121‐E133. [DOI] [PMC free article] [PubMed] [Google Scholar]
- 35. Wang DQ, Tazuma S, Cohen DE, Carey MC. Feeding natural hydrophilic bile acids inhibits intestinal cholesterol absorption: studies in the gallstone‐susceptible mouse. Am J Physiol Gastrointest Liver Physiol 2003;285:G494‐G502. [DOI] [PubMed] [Google Scholar]
- 36. Bonde Y, Eggertsen G, Rudling M. Mice abundant in muricholic bile acids show resistance to dietary induced steatosis, weight gain, and to impaired glucose metabolism. PLoS One 2016;11:e0147772. [DOI] [PMC free article] [PubMed] [Google Scholar]
- 37. Pandak WM, Bohdan P, Franklund C, Mallonee DH, Eggertsen G, Bjorkhem I, et al. Expression of sterol 12α‐hydroxylase alters bile acid pool composition in primary rat hepatocytes and in vivo. Gastroenterology 2001;120:1801‐1809. [DOI] [PubMed] [Google Scholar]
- 38. Stellaard F, von Bergmann K, Sudhop T, Lütjohann D. The value of surrogate markers to monitor cholesterol absorption, synthesis and bioconversion to bile acids under lipid lowering therapies. J Steroid Biochem Mol Biol 2017;169:111‐122. [DOI] [PubMed] [Google Scholar]
- 39. Li T, Francl JM, Boehme S, Ochoa A, Zhang Y, Klaassen CD, et al. Glucose and insulin induction of bile acid synthesis: mechanisms and implication in diabetes and obesity. J Biol Chem 2012;287:1861‐1873. [DOI] [PMC free article] [PubMed] [Google Scholar]
- 40. Van Waarde WM, Verkade HJ, Wolters H, Havinga R, Baller J, Bloks V, et al. Differential effects of streptozotocin‐induced diabetes on expression of hepatic ABC‐transporters in rats. Gastroenterology 2002;122:1842‐1852. [DOI] [PubMed] [Google Scholar]
- 41. Herrema H, Meissner M, van Dijk TH, Brufau G, Boverhof R, Oosterveer MH, et al. Bile salt sequestration induces hepatic de novo lipogenesis through farnesoid X receptor‐ and liver X receptorα‐controlled metabolic pathways in mice. Hepatology 2010;51:806‐816. [DOI] [PubMed] [Google Scholar]
- 42. Ma L, Robinson LN, Towle HC. ChREBP*Mlx is the principal mediator of glucose‐induced gene expression in the liver. J Biol Chem 2006;281:28721‐28730. [DOI] [PubMed] [Google Scholar]
- 43. Chevre R, Trigueros‐Motos L, Castaño D, Chua T, Corlia M, Patankar JV, et al. Therapeutic modulation of the bile acid pool by Cyp8b1 knockdown protects against nonalcoholic fatty liver disease in mice. FASEB J 2018;32:3792‐3802. [DOI] [PubMed] [Google Scholar]
- 44. Werner A, Minich DM, Havinga R, Bloks V, Van Goor H, Kuipers F, et al. Fat malabsorption in essential fatty acid‐deficient mice is not due to impaired bile formation. Am J Physiol Gastrointest Liver Physiol 2002;283:900‐908. [DOI] [PubMed] [Google Scholar]
- 45. Takahashi S, Fukami T, Masuo Y, Brocker CN, Xie C, Krausz KW, et al. Cyp2c70 is responsible for the species difference in bile acid metabolism between mice and humans. J Lipid Res 2016;57:2130‐2137. [DOI] [PMC free article] [PubMed] [Google Scholar]
- 46. Dentin R, Benhamed F, Hainault I, Fauveau VR, Foufelle F, Dyck JR, et al. Liver‐specific inhibition of ChREBP improves hepatic steatosis and insulin resistance in ob/ob mice. Diabetes. 2006;55:2159‐2170. [DOI] [PubMed] [Google Scholar]
- 47. Kursawe R, Caprio S, Giannini C, Narayan D, Lin A, D’Adamo E, et al. Decreased transcription of ChREBP‐α/β isoforms in abdominal subcutaneous adipose tissue of obese adolescents with prediabetes or early type 2 diabetes: associations with insulin resistance and hyperglycemia. Diabetes. 2013;62:837‐844. [DOI] [PMC free article] [PubMed] [Google Scholar]
- 48. Eissing L, Scherer T, Tödter K, Knippschild U, Greve JW, Buurman WA, et al. De novo lipogenesis in human fat and liver is linked to ChREBP‐β and metabolic health. Nat Commun 2013;4:1528. [DOI] [PMC free article] [PubMed] [Google Scholar]
Associated Data
This section collects any data citations, data availability statements, or supplementary materials included in this article.
Supplementary Materials