

Abstract
Smallholder farmers dependent on rain‐fed agriculture experience seasonal variations in food and nutrient availability occasioned by seasonality of production patterns. This results in periods of nutrient abundance in the plenty seasons followed closely by periods of nutrient inadequacies and malnutrition. This pattern contributes to a cycle of deteriorating health and nutrition status and deprives children of their ability to realize full developmental potential. This study investigates the role of caregiver's nutritional knowledge and attitudes in mediating effects of seasonality on children's diets. Repeated cross‐sectional surveys were conducted on 151 randomly selected households in the plenty and lean seasons to collect dietary data using two non‐consecutive quantitative 24‐hr recalls and caregiver's nutritional knowledge and attitudes assessed using interviewer administered questionnaire. Sixty‐five percent of the caregivers had attained a primary level education or less. There was a positive modest correlation between caregivers' nutritional knowledge and their attitudes (r = 0.3, P < 0.000, α = 0.01). Children's mean adequacy ratio was significantly higher in the plenty season than in the lean season (0.84 vs. 0.80, P < 0.000). A two‐block hierarchical regression to predict the seasonal changes in dietary quality of children using caregiver's nutritional knowledge and attitude scores while controlling for the effect of sociodemographics and mean adequacy ratio at first season (plenty) found that caregiver's nutritional knowledge (ß = −0.007, SE = 0.003, P = 0.027, 95% CI [−0.013, −0.001] ŋ 2 = 0.034) but not attitudes had significant contribution to the prediction. Maternal nutritional knowledge mediates seasonal variation in child nutrient intakes.
Keywords: attitudes, children, Kenya, micronutrient intakes, nutrition knowledge, seasonality
Key messages.
Children's diets in Vihiga County are poor in micronutrients, especially the minerals iron, zinc, and calcium.
The micronutrient content of the diets of small children in Vihiga County follows seasonality in food production; they are poor during the lean season and improve significantly during the postharvest season.
Caregiver's nutritional knowledge mediates against seasonal variations in the children's diet quality.
We recommend that programmes that aim at improving dietary intakes among children should target caregiver's attitudes in addition to nutrition education.
1. INTRODUCTION
The 2030 Agenda for Sustainable Development adopted in 2015 by countries around the globe recognizes eradication of hunger as a stepping stone to realizing its vision. Although the number of people affected by hunger and malnutrition has gradually decreased over the past decades, close to 800 million people are still suffering from chronic malnutrition with micronutrient deficiencies affecting close to 2 billion people (FAO, IFAD, and WFP, 2015). In Sub‐Saharan Africa where more than half of the population derives their food and employment directly from agriculture (ILO, 2013), and where agriculture contributes up to 50% of gross domestic product (OECD/FAO, 2016), the absolute number of those affected by hunger and malnutrition has gone up by close to 44 million people between the period 1990 and 2016 (FAO, IFAD, and WFP, 2015). The consequences of hunger and malnutrition have both social and economic implications on those affected. The worst damages of malnutrition happen during pregnancy and early childhood—from conception to 2 years, that is, the first 1,000 days. The effects of malnutrition during these formative years have a long‐term effect including impairments in intellectual performance, work capacity, reproductive outcomes, and overall health during adolescence and adulthood (Dewey, 2001). In addition, the Lancet series of “Maternal And Child Undernutrition” notes that undernutrition, including foetal growth restriction, suboptimum breastfeeding, stunting, wasting, and deficiencies of vitamin A and zinc, causes 45% of child deaths, resulting in 3.1 million deaths annually (Black et al., 2013), and is responsible for 33% of the disability‐adjusted life years in children (WHO, 2009).
Although the nature and causes of malnutrition are complex, the framework developed by UNICEF recognizes nutritionally inappropriate diet and disease as the two immediate causes. In Kenya, like many developing countries, an insufficient diet is a major cause of nutrient inadequacies. In Kenya, the diet is based predominantly on starchy staples and poor in diversity (Bwibo & Neumann, 2003; Ekesa, Walingo, & Abukutsa‐Onyango, 2008; Gewa, Murphy, Weiss, & Neumann, 2014). Diets predominantly based on plants tend to be high in phytate and other antinutrients that inhibit absorption of other important dietary components such as iron, calcium, and zinc and some vitamins, resulting in their deficiencies (WHO/FAO, 2004).
Rural farming families experience an additional type of inadequacy in the form of seasonal fluctuations in food intake related to the agricultural cycle where a person consumes more calories and critical nutrients in some times of year than in others. This type of dietary deprivation has been studied by many researchers (Arsenault et al., 2014; Miller et al., 2013; Mitchikpe, Dossa, Ategbo, Van Raaij, & Kok, 2009; Rossato et al., 2010; Vaitla, Devereux, & Swan, 2009). In rural Burkina Faso, women's intakes of calcium, vitamin C, and folate were much lower in the lean season compared with the plenty season, whereas children had lower intake values for calcium in the lean season and vitamin B12 in the plenty season. The authors noted that grains, nuts, and vegetables provide the majority of micronutrients to the diets of women and children in rural Burkina and account for many of the seasonal shifts in micronutrient intake adequacy observed (Savy, Martin‐Prével, Traissac, Eymard‐Duvernay, & Delpeuch, 2006). Similarly, a study in rural households of Eastern Kenya reported significant increased intake of energy, carbohydrates, and proteins as well as calcium, zinc, iron, and folate and a decrease of vitamin A during postharvest (M'Kaibi et al., 2015). Similar trends have been reported with diet diversity; for instance, Waswa, Jordan, Herrmann, Krawinkel, and Keding (2014) reported a significant improvement of dietary diversity score from a mean of 3.8 in the lean season to a mean of 4.1 in the season of high food availability.
A number of studies have documented the short‐ and long‐term impacts of seasonality on children. In one recent study to examine the long‐term consequences of consumption seasonality on human capital, the researchers found that seasonal variation in consumption during childhood negatively impacted on both height and educational attainment (Christian & Dillon, 2016). Using data spanning almost 20 years, the authors demonstrated that deficits acquired during the low consumption periods of the year impact children in the long run. Accordingly, a 10% deviation of consumption resulted in 0.07% reduction in height or a 0.7–0.8% reduction in years of educational attainment. Most studies on ways to smoothing variability in food availability and intakes have focused on increasing credit facilities and market access of the rural farmers (Burke, 2014; Fink, Jack, & Masiye, 2014, Hirvonen, Taffesse, & Worku Hassen, 2016). There is however lack of published data on the effect of caregiver's nutritional knowledge and attitudes on the variation in nutrient intakes and dietary diversity of children due to seasonality. Christian and Dillon (2016) observed that shifting a quantity of food equivalent to half of a day's worth from the harvest season to the lean season would improve outcomes as much as increasing consumption by a quarter throughout the year. In this paper, we explore the relationship between maternal nutritional knowledge and attitudes on seasonal changes in the diets of young children in the humid agroecological zones of Vihiga County in Western Kenya.
2. MATERIALS AND METHODS
2.1. Study site and population
This study is part of a bigger project, “Participatory approaches to improve dietary diversity in Vihiga County, Western Kenya,” whose aim is to improve dietary diversity of women and children in Vihiga. The project area mainly lies in the upper midland agroecological zone (Jaetzold, Schmidt, Hornetz, & Shisanya, 2005). The rainfall pattern is bimodal with long rains from April to June and short rains from September to November. Administratively, Vihiga County is divided into four administrative sub‐counties and further into 9 divisions, 37 locations, and 129 sublocations. It has a population size of 554,622 with the Luhya being the dominant ethnic group. Children age 1–2 years of age constitute about 6% (34,014) of the population (KNBS, 2010).
2.2. Study design and sample
A repeated cross‐sectional study design was used to collect data on food consumption of children and women across two seasons in 10 randomly sampled sublocations. The first round of data collection took place immediately following a harvest season in September/October 2014 and the second round during the lean season in March/April 2015. In the first season 40, households per sublocation were randomly sampled from a list of households prepared with the help of community health volunteers and the local administration (assistant chiefs and village elders). Presence of a child aged between 12 and 24 months and a woman caregiver of reproductive age group in the household was used as the main criteria for inclusion in the household sampling list. Women and children were used as the target population because of their special nutrient requirements due to their needs for reproduction and growth, respectively. Children in this age group are at a stage of complementary feeding with gradually reduced dependence on breast milk and therefore are more likely to be affected by seasonality. All households sampled in the first round that still met the sampling criteria were included in the lean season sample, and the sample was refilled with randomly selected households from a new list of households meeting the inclusion criteria at the time of the second survey round.
2.3. Caregiver's nutritional knowledge and attitudes
The caregiver's nutritional knowledge and attitudes were collected using a standard structured questionnaire adapted from the FAO guidelines (Macias & Glasauer, 2014). This questionnaire was administered only once in the first survey. The responses were given scores ranging from 0 to 12 for knowledge and −19 to 19 for attitudes in order to obtain a scale variable. The knowledge and attitude questions tested three main areas: complementary feeding and continued breastfeeding beyond 6 months, iron deficiency and anaemia, and vitamin A deficiency.
2.3.1. Knowledge
A total of 12 questions with predetermined answers were used to test knowledge. All questions carried equal weight—one correctly answered question equals a score of 1. Where multiple answers were possible as for questions on signs, causes, and prevention of anaemia and vitamin A deficiency, one correct answer was considered adequate. A score of 0 was awarded for a wrong answer, do not know, or no response.
2.3.2. Attitudes
Each respondent was asked 19 questions related to her attitudes on the three main subjects above to test her confidence and opinions. The predetermined answers were different according to the type of question, for example, “not confident,” “ok/not sure,” and “confident” or “likely,” “ok/not sure,” and “not likely” or “good,” “ok/not sure,” and “not good” or “difficult,” “ok/not sure,” and “not difficult” or “serious,” “ok/not sure,” and “not‐serious.” Depending on whether the response was appropriate or not, scores were allotted. A positive attitude was awarded a score of 1, negative attitude score of −1, and an “ok/so‐so” or no response was awarded a score of 0.
2.4. Dietary assessment
The dietary assessment of the children and their caregivers was done using two non‐consecutive quantitative 24‐hr food intake recalls (Gibson & Ferguson, 2008). The purpose of the assessment was to provide an estimate of habitual dietary intake and the dietary diversity score. First, subjects were asked to mention all the foods and beverages they had eaten during the preceding 24 hr. Then, they were asked to describe the foods and beverages consumed, including ingredients and cooking methods of mixed dishes. The amounts of all foods, beverages, and ingredients of mixed dishes consumed were estimated either in weight, household units (volume determined by water content), or in monetary value. The proportion of what was eaten by the subject was then determined based on the volume eaten and the total volume of the dish. This proportion was used to calculate the amount of ingredients consumed in their raw forms. For dishes consumed outside the home, standard recipes were prepared, and the amount of ingredients consumed by the subject was determined. To process the nutrient intakes, the ingredients consumed were entered in the web‐based Lucille for Food Intake programme (http://www.foodintake.ugent.be) with a preuploaded Food Composition Table (see below). Total nutrient intakes per person per day were calculated for each of the two recall days. Subsequently, the results were exported to another web‐based programme multiple source method (https://msm.dife.de/) for estimation of usual intakes.
Dietary intake adequacy was evaluated using the estimated average requirement (EAR) cut‐point method (Gibson & Ferguson, 2008) except for iron. Due to the skewed nature of iron requirements for children, the full probability approach was used to evaluate inadequacy in iron intakes (Allen, de Benoist, Dary, & Hurrell, 2006). Because the bioavailability of zinc and iron is influenced by the composition of the diet, a low bioavailability and 5% bioavailability profiles were, respectively, applied. The EAR and the recommended nutrient intake (RNI) values for all nutrients used are those of WHO (Allen et al., 2006). The acceptable macronutrient distribution ranges for macronutrients came from the Food and Nutrition Bulletin of the Institute of Medicine (2003).
The qualitative aspect of the diet was assessed through nutrient adequacy ratio (NAR) and the mean adequacy ratio (MAR). NAR was calculated for energy; the macronutrients (carbohydrates, proteins, and fats); and 11 micronutrients (niacin, thiamin, riboflavin, vitamin B6, vitamin B12, vitamin C, vitamin A, folate, iron, zinc, and calcium) as the ratio of the subject's nutrient intake to the RNIs. The MAR was used to assess the overall micronutrient quality of the diet and was calculated as the sum of NAR for each of the micronutrients divided by the number of micronutrients considered (in this case, 11). The NAR and MAR values were both truncated at 100%.
2.5. Adaptation of the food composition table
A food composition table based on the Tanzanian food composition table (Lukmanji et al., 2008) was used to convert the ingredients and recipes consumed into individual nutrients. Missing foods and/or nutrients were supplemented with data from the USDA food composition table (USDA, 2014); the Kenyan food composition table (Sehmi, 1993); and the West African food composition table (Stadlmayr et al., 2012). Nutrient compositions of raw ingredients were corrected for different cooking methods using the USDA Table for Nutrient Retention Factors (2007).
2.6. Statistical analysis
Statistical analysis was done with the help of IBM SPSS Statistics Base, version 22 (SPSS, Chicago, USA). Descriptive analysis of the of continuous data was done using means, standard deviations, minimum, and maximum, whereas categorical data were expressed as frequencies and percentages. Group proportions were compared for significant difference using the chi‐square test. Comparison of the means of intakes between the plenty season and lean season was done using the repeated measures analysis of variance. Associations between variables were tested using the bivariate regression analysis.
A hierarchal regression analysis was used to explore the association between the outcome variable and maternal nutritional knowledge and attitudes and the sociodemographic variables. The outcome variable in the analysis was the change in MAR between the two seasons calculated as the absolute change in the individual MAR from the plenty season to the lean season. In the first block, the demographic variables were entered. The baseline MAR (at plenty season) was included as covariate in the analysis to control for the bias associated with the correlation. (Cologne, 2006; Glymour, Weuve, Berkman, Kawachi, & Robins, 2005). In the second and third blocks, we entered the variables maternal nutritional knowledge and attitudes scores, respectively. Nutrient intakes were first assessed for normality using the Kolmogorov–Smirnov test for normality.
2.7. Study ethics
The research protocols for this study was reviewed and approved by the Research and Ethics Committee at the Division of Research and Extension of Egerton University, Kenya. In addition, we obtained written consent from all the study respondents. Children's consents were sought from the parents or caregivers.
3. RESULTS
From the 400 households interviewed during the plenty season, 151 still qualified for inclusion (child between 12 and 23 months) during the lean season. The data presented in this paper only represent the 151 households with data in both seasons.
The characteristics of the sample are presented in Table 1. The respondents were predominantly married women (80.8%) with a mean age of 28.8 ± 8.9 years. Only 6% of the women had attained more than secondary education, whereas more than one‐third had had either dropped out of primary school (33.3%) or did not attend any formal education (2%). The mean age of the children was 17.8 ± 3.7 months (median = 17.4, minimum = 11.3, and maximum = 27.9). A total of 51.7% of the children were girls.
Table 1.
Sociodemographic profile of the sample
| Characteristics | Proportion of households, n = 151 |
|---|---|
| Caregivers age in years, mean ± SD | 28.8 ± 8.9 |
| Caregivers marital status | |
| Married | 80.8 |
| Single | 15.2 |
| Widowed | 2.6 |
| Separated | 1.3 |
| Religious affiliation of the household | |
| Christianity | 95.4 |
| Islamic | 4.0 |
| Others | 0.7 |
| Highest educational level attained by caregiver | |
| No education | 2.0 |
| Primary incomplete | 33.3 |
| Primary complete | 30.0 |
| Secondary incomplete | 15.3 |
| Secondary incomplete | 13.3 |
| Tertiary | 6.0 |
| Child age in months, mean ± SD | 17.8 ± 3.7 |
| Child sex | |
| Male | 48.3 |
| Female | 51.7 |
| Does the household own arable land? | |
| Yes | 98.0 |
| No | 2.0 |
| Does the household own livestock? | |
| Yes | 93.3 |
| No | 6.7 |
3.1. Caregivers' nutritional knowledge
Out of the maximum score of 12, caregivers scored a mean of 6.4 ± 2.7 with a minimum of 1 point and a maximum of 12. About 38% of the caregivers obtained a score of less than 6. Bivariate correlation analyses between caregivers nutritional knowledge score and caregiver's age, educational level, and age of child found a positive significant association with the age of the child (r = 0.2, P = 0.026) but not with the other variables (P > 0.05). Only 69.5% of the caregivers knew that continued breastfeeding should be practiced up to 24 months or more. With regard to the consistency of the child's meal, caregivers were shown two pictures (one with watery porridge and another with thick porridge) and asked to pick the one that shows porridge that is appropriate for the child; 42% of the caregivers chose the watery porridge. When asked to explain the choice of the picture, only 43% of those who chose the thick porridge could correctly articulate the reason—being that the thick porridge is more nutrient dense and therefore more nutritious. To test caregivers' knowledge of dietary diversification, they were asked to name types of foods they would give to their children in a day so that it is diverse. The foods mentioned by 47% of the caregivers did not qualify as diverse if fed to a child in a day. Caregivers' nutritional knowledge concerning iron and vitamin A are presented in Figure 1. The respondents were first asked whether they have heard of the terms “iron deficiency anemia” or simply “anaemia” or “vitamin A deficiency” or “lack of vitamin A in the body.” An affirmative response to this question was followed by questions regarding recognizable signs of each of the condition, the causes, and prevention measures including naming of foods rich in the nutrients.
Figure 1.
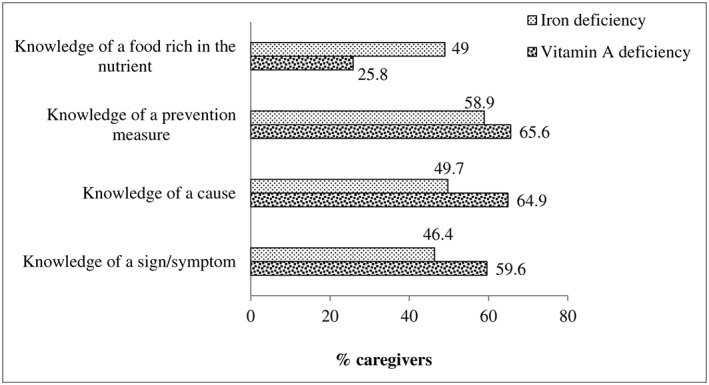
Caregivers' knowledge of iron deficiency and vitamin A deficiency
3.2. Caregiver's nutrition related attitudes
The mean attitude score was 11.8 (±3.8). The lowest score was 1, and the maximum was 19. A bivariate analysis between the caregivers' attitude score and nutritional knowledge found a modest positive association between the two (r = 0.3, P < 0.000, α = 0.01). Although not significant (P > 0.05), there was a positive association between the caregivers attitude score and caregivers educational level (r = 0.1) but a negative association with the caregivers age (r = −0.1). There was no association between the attitude score and the age of the child (r = 0). Table 2 describes the caregivers' attitudes towards various aspects of child feeding, iron deficiency and anaemia, and vitamin A deficiency. Nearly (95.4%) all the caregivers feel confident preparing food for their children. The confidence levels however drop when it comes to preparation of a diversified diet (87.4%). A further drop in the number to 79.5% each is observed when it comes to preparing meals with iron rich foods and vitamin A rich foods. Although practically all the caregivers (98.7%) are of the opinion that breastfeeding should continue beyond 6 months, 10.6% of them feel that it is difficult for them to practice this. Similar results are seen with regard to diversifying the child's diet. Although almost all (99.3%) of the caregivers feel that a diversified diet is good for the child, almost half (49.7%) of them feel that it is difficult to realize this, and still 27.8% feel that it is in fact difficult to feed the child several times in a day. Although majority of the caregivers feel that deficiencies of iron (93.4%) and vitamin (93.4%) are serious, 37.7% and 38.4% of the caregivers, respectively, feel that their children were not likely to suffer these deficiencies despite the fact that 34.4% and 24.5% of them argued that it was difficult to prepare meals with foods rich in iron and vitamin A, respectively.
Table 2.
Caregivers' responses to attitude‐related questions on child feeding, iron deficiency anaemia, and vitamin A deficiency
| Opinion questions | Responses, number (%) | ||
|---|---|---|---|
| Not confident | Not sure | Confidenta | |
| Are you confident that you can prepare food for your child? | 1 (0.7) | 6 (4.0) | 144 (95.4) |
| How confident do you feel in preparing a diversified diet for your child | 4 (2.6) | 15 (9.9) | 132 (87.4) |
| How confident do you feel in preparing meals with iron‐rich foods? | 12 (7.9) | 19 (12.6) | 120 (79.5) |
| How confident do you feel in preparing meals with vitamin‐A‐rich foods? | 9 (6.0) | 22 (14.6) | 120 (79.5) |
| Not good | Not sure | Gooda | |
| How good do you think it is to continue breastfeeding beyond six months? | 2 (1.3) | — | 149 (98.7) |
| How good do you think it is to give different types of food to your child each day? | 1 (0.7) | — | 150 (99.3) |
| How good do you think it is to feed your child several times each day? | 11 (7.3) | 1 (0.7) | 139 (92.1) |
| How good do you think it is to prepare meals with iron‐rich foods such as beef, chicken or liver? | 2 (1.3) | 19 (12.6) | 130 (86.1) |
| How good do you think it is to prepare meals with vitamin‐A‐rich foods such as carrots, green leafy vegetables, sweet‐potatoes or liver? | 4 (2.6) | 20 (13.2) | 127 (84.1) |
| Difficult | Not sure | Not difficulta | |
| How difficult is it for you to continue breastfeeding beyond six months? | 16 (10.6) | 3 (2.0) | 132 (87.4) |
| Is it difficult for you to give different types of food to your child each day? | 75 (49.7) | 12 (7.9) | 64 (42.7) |
| How difficult is it for you to feed your child several times each day? | 42 (27.8) | 13 (8.6) | 96 (63.6) |
| How difficult is it for you to prepare meals with iron‐rich foods? | 52 (34.4) | 34 (22.5) | 65 (43.0) |
| How difficult is it for you to prepare meals with vitamin‐A‐rich foods? | 37 (24.5) | 32 (21.2) | 82 (54.3) |
| Not likely | Not sure | Likelya | |
| How likely do you think your child is to be iron‐deficient/anaemic? | 57 (37.7) | 54 (34.8) | 40 (26.5) |
| How likely do you think your child is to lack vitamin A in his/her body? | 58 (38.4) | 54 (35.8) | 39 (25.8) |
| Not serious | Not sure | Seriousa | |
| How serious do you think iron‐deficiency/anaemia is? | 10 (6.6) | 141 (93.4) | |
| How serious do you think a lack of vitamin A is? | — | 10 (6.6) | 141 (93.4) |
| Not important | Not sure | Importanta | |
| How important is it to have a diversified diet? | 1 (0.7) | — | 150 (99.3) |
Responses considered appropriate or positive attitudes.
3.3. Children's dietary intake
Table 3 describes the mean intakes for energy and the nutrients of the children across the two seasons as well as the proportion of the children with intakes below the recommendations. Mineral intakes were most limiting with the means of the three minerals falling below the EAR for calcium and zinc and below the RNI for iron in both seasons. The mean intakes for folate and vitamin A were less than the EAR values during the lean season. Apart from thiamin, vitamin B12, iron, and zinc, the mean intakes for all the other nutrients differed significantly across the two seasons. The mean intakes for energy were significantly higher during the lean season (1,389.77 ± 461.13 kcals) compared with the plenty season (1,217.08 ± 386.77 kcals, P < 0.000). Children obtained a higher caloric intake by carbohydrate (P < 0.000) but lower caloric intake by protein (P < 0.000) and fat (P = 0.042) during the lean season. At the same time, the mean intakes of vitamin A, vitamin C, riboflavin, vitamin B6, folate, and calcium decreased significantly during the lean season. Interestingly, more children did not meet their caloric requirements in the plenty season (48.3%) than in the lean season (33.8%, P < 0.010). The average caloric contribution of carbohydrate to the total energy intake was higher than the recommendations, whereas fat was lower than the recommendations in both seasons. Almost all children (92.1% in plenty and 97.4% in lean) did not meet their requirements for fat intakes. The proportion of children with intakes below the recommendations more than tripled for vitamin A (20.5% vs. 69.5%) and doubled for folate (29.1% vs. 64.9%) from the plenty season to the lean season. The prevalence of inadequate intakes of vitamin B12, on the contrary, was significantly higher during the plenty season than in the lean season.
Table 3.
Mean energy and nutrient intakes and prevalence of nutrient inadequacy across seasons
| Nutrient | EAR | Plenty | Lean | P value | % with inadequate intake | P value | |||
|---|---|---|---|---|---|---|---|---|---|
| Mean | Std. dev. | Mean | Std. dev. | Plenty | Lean | ||||
| Energy (Kcals) | 1,165–1,230 | 1,217.08 | 386.60 | 1,389.77 | 461.13 | 0.000 | 48.3 | 33.8 | 0.010 |
| CHO (%energy) | 45–65 | 67.89 | 5.81 | 70.13 | 4.63 | 0.000 | 70.2** | 83.4** | 0.006 |
| Protein (%energy) | 5–20 | 10.31 | 1.75 | 9.11 | 1.29 | 0.000 | 0.0 | 0.0 | — |
| Fat (%energy) | 30–40 | 21.80 | 5.53 | 20.75 | 4.36 | 0.042 | 92.1 | 97.4 | 0.040 |
| Vitamin A, (μgRE) | 285 | 573.42 | 326.43 | 236.71 | 131.94 | 0.000 | 20.5 | 69.5 | 0.000 |
| Vitamin C (mg) | 25 | 77.41 | 39.38 | 64.05 | 45.84 | 0.004 | 9.3 | 9.9 | 0.845 |
| Thiamin (mg) | 0.4 | 0.72 | 0.24 | 0.77 | 0.32 | 0.123 | 7.3 | 7.9 | 0.828 |
| Riboflavin (mg) | 0.4 | 1.99 | 0.09 | 1.36 | 0.77 | 0.000 | 0.7 | 0.7 | 1.000 |
| Niacin (mgNE) | 5 | 7.44 | 2.56 | 8.26 | 3.41 | 0.009 | 16.6 | 13.2 | 0.419 |
| Vitamin B6 (mg) | 0.4 | 1.10 | 0.49 | 0.93 | 0.38 | 0.000 | 4.6 | 3.3 | 0.556 |
| Folate (μgDFE) | 120 | 158.38 | 62.48 | 110.69 | 46.83 | 0.000 | 29.1 | 64.9 | 0.000 |
| Vitamin B12 (μg) | 0.7 | 1.08 | 0.78 | 1.14 | 0.58 | 0.398 | 36.4 | 21.9 | 0.005 |
| Calcium (mg) | 417 | 348.65 | 206.11 | 296.06 | 144.76 | 0.003 | 73.5 | 84.8 | 0.016 |
| Iron (mg) | 11.6a | 7.88 | 2.57 | 8.45 | 3.49 | 0.068 | 72 | 68.6 | — |
| Zinc (mg) | 6.9 | 4.98 | 1.65 | 5.24 | 1.99 | 0.152 | 86.1 | 81.5 | 0.275 |
Note. EAR: estimated average requirement; RNI: recommended nutrient intake.
EAR value cannot be established because of the skewed distribution of requirements for iron by children. Instead, the corresponding RNI value is given.
Proportion of children whose intakes were greater than the recommended 65% of total caloric intake.
The MAR of the children's micronutrient intakes was 0.84 (±0.11) during the plenty season decreasing to 0.80 (±0.11) during the lean season (t 150 = 3.53, P < 0.001). The NAR for children was 1 for riboflavin and carbohydrates in both seasons. The NAR was more than 0.7 for all the nutrients during the plenty season except for zinc, iron, and calcium. For all the nutrients where the NAR values differed significantly between the seasons, there was a decrease in the NAR values from the plenty season to lean season (Vitamin A, folate, and zinc) with the exception of vitamin B12 (Table 4). The MAR values showed a significant positive correlation with educational levels of the caregiver both in the plenty season (r = 0.304, P < 0.000) and lean season (r = 0.163, P < 0.047).
Table 4.
Nutrient adequacy ratio (NAR) and mean adequacy ratio (MAR) of children
| Nutrient | Plenty season | Lean season | P value |
|---|---|---|---|
| NAR | |||
| Energy (Kcals) | 0.96 ± 0.11 | 0.98 ± 0.07 | 0.085 |
| Carbohydrates (g) | 1 ± 0.02 | 1 ± 0 | 0.284 |
| Protein (g) | 0.71 ± 0.11 | 0.63 ± 0.09 | 0.000 |
| Fat (g) | 0.74 ± 0.16 | 0.71 ± 0.14 | 0.074 |
| Vitamin A, (μgRE) | 0.88 ± 0.22 | 0.56 ± 0.26 | 0.000 |
| Vitamin C (mg) | 0.96 ± 0.12 | 0.95 ± 0.13 | 0.427 |
| Thiamin (mg) | 0.96 ± 0.1 | 0.96 ± 0.11 | 0.974 |
| Riboflavin (mg) | 1 ± 0.02 | 1 ± 0.03 | 0.904 |
| Niacin (mgNE) | 0.93 ± 0.14 | 0.94 ± 0.12 | 0.469 |
| Vitamin B6 (mg) | 0.98 ± 0.08 | 0.98 ± 0.07 | 0.633 |
| Folate (μgDFE) | 0.86 ± 0.19 | 0.69 ± 0.22 | 0.000 |
| Vitamin B12 (μg) | 0.78 ± 0.3 | 0.88 ± 0.21 | 0.001 |
| Calcium (mg) | 0.63 ± 0.26 | 0.57 ± 0.24 | 0.067 |
| Iron (mg) | 0.67 ± 0.2 | 0.69 ± 0.23 | 0.424 |
| Zinc (mg) | 0.6 ± 0.2 | 0.62 ± 0.21 | 0.383 |
| MAR | 0.84 ± 0.11 | 0.80 ± 0.11 | 0.001 |
3.4. Seasonal shifts in children's intakes
The mean changes in the micronutrient intakes between the two seasons as a percent of the respective micronutrient EAR values are presented in Figure 2. The largest change in intake was seen with regard to riboflavin (141%), vitamin A (118%), and vitamin C (53%). Small negative changes were realized in intakes of niacin, thiamin, vitamin B12, iron, and zinc.
Figure 2.
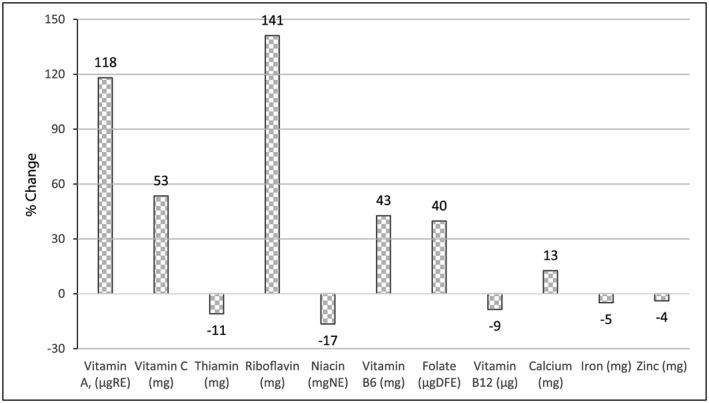
Means of the changes in intakes as a percent of respective estimated average requirement values
Pearson correlation analyses were conducted to examine the relationship between caregiver's nutritional knowledge and attitudes score and the seasonal changes in micronutrient intakes (as a percent of EAR). The nutritional knowledge score was negatively but significantly correlated with NAR changes between season for thiamin (r = −0.201, P = 0.013); niacin (r = −0.174, P = 0.032); vitamin B6 (r = −0.171, P = 0.035); iron (r = −0.177, P = 0.030); and zinc (r = −0.161, P = 0.048). None of the NAR changes was significantly associated with caregiver's attitude scores. A two block hierarchal regression analysis was used to predict the change in MAR between the two seasons using caregiver's nutritional knowledge and attitude scores—while controlling for the baseline MAR values and demographic characteristics (caregiver's educational levels [coded as 1 = primary or less and 2 = more than primary], caregivers age, and child age). In the first block, the enter method was applied, whereas in the second block, the stepwise method was applied. A significant model emerged for the first block with demographics and baseline MAR as predictors: F(4, 145) = 17.187, P < 0.000, R 2 = 0.322. None of the demographic however variables was significant. The introduction of caregiver's nutritional knowledge and attitudes in the analysis produced a significant change in the prediction: ∆F(1, 144) = 4.982, ∆P < 0.027, ∆R 2 = 0.023. Only the caregivers' nutritional knowledge score contributed significantly in the model (ß = −0.007, SE = 0.003, P = 0.035, 95% CI [−0.013, −0.001] ŋ 2 = 0.034). The variable caregiver's attitudes was thus dropped in this analysis step, as it did not contribute significantly to the prediction. (Table 5).
Table 5.
Summary of hierarchical regression analysis for variables predicting change in MAR between plenty and lean seasons
| Model | Parameter | B | Std. error | t | Sig. | 95.0% CI for B | ŋ 2 | |
|---|---|---|---|---|---|---|---|---|
| Lower | Upper | |||||||
| 1 | (Constant) | −0.448 | 0.082 | −5.442 | 0.000 | −0.611 | −.285 | |
| Baseline MAR (plenty) | 0.642 | 0.080 | 8.043 | 0.000 | 0.484 | 0.800 | 0.3080 | |
| Caregiver's age (years) | −0.001 | 0.001 | −0.815 | 0.416 | −0.003 | 0.001 | 0.0046 | |
| Caregiver's educational level | −0.014 | 0.019 | −0.737 | 0.462 | −0.052 | 0.024 | 0.0037 | |
| Child age (months) | −0.002 | 0.002 | −0.675 | 0.500 | −0.006 | 0.003 | 0.0031 | |
| 2 | (Constant) | −0.421 | 0.082 | −5.120 | 0.000 | −0.583 | −0.258 | |
| Baseline MAR (plenty) | 0.649 | 0.079 | 8.237 | 0.000 | 0.493 | 0.805 | 0.2873 | |
| Caregiver's age (years) | −0.001 | 0.001 | −1.019 | 0.310 | −0.003 | 0.001 | 0.0072 | |
| Caregiver's educational level | −0.015 | 0.019 | −0.822 | 0.412 | −0.052 | 0.022 | 0.0046 | |
| Child age (months) | −0.001 | 0.002 | −0.251 | 0.802 | −0.005 | 0.004 | 0.0004 | |
| Caregiver's knowledge score | −0.007 | 0.003 | −2.232 | 0.027 | −0.013 | −0.001 | 0.0335 | |
Note. Dependent variable: change in MAR. MAR: mean adequacy ratio.
4. DISCUSSION
This study investigated the variations in children's dietary intakes from plenty season to the lean season and the potential role played by caregiver's nutritional knowledge and attitudes in safeguarding children against the effect of such variations. Generally speaking, the caregivers in the sample have low formal education with only 6% having schooled beyond secondary. Formal education plays an important role in child care, and there is a general consensus that formal education is related with better incomes and employment status both of which would expectedly buffer families against shocks brought about by variation in seasonal food availability among rural farming households. Higher educational attainment among women has been strongly associated with positive nutritional outcomes in children (Frongillo, Onis, & Hanson, 1997; Smith & Haddad, 2000). A study of the effects of mother's education on child's nutritional status in the slums of Nairobi found that mother's education was a strong predictor of nutritional status of the children. Children belonging to mothers with lower than secondary education were 29% more likely to be stunted than those whose mothers had above secondary school education indicating that post‐secondary education is protective against child stunting (Abuya, Ciera, & Kimani‐Murage, 2012). In our study we found that having higher educational level was positively associated with MAR at both seasons.
That said, it is important to note that formal education per se cannot guarantee better nutritional outcomes in children. For instance, Appoh and Krekling (2005) found that impact of maternal nutritional knowledge on child nutrition status was greater than that of formal education. This is to say that even those caregivers who do not have formal education can still realize better nutritional outcomes for their children. Our study investigated the relationship between nutritional knowledge and the seasonal changes in child nutrient intakes. The findings reveal a negative relationship between nutritional knowledge score and change in intakes—children whose caregivers scored higher were less likely to have variations in their diets between seasons. This result was obtained in a context where caregiver's educational level had significant effect in buffering against the variations in intakes showing significant positive associations with the MAR for both seasons. Although our study did not investigate at individual level the direction of changes in intakes, we assume that, because on overall there was a decrease in the quality of the diet of the children from plenty season to lean season, this dietary change was rather a decrease. Other similar recent studies (Arsenault et al., 2014; M'Kaibi et al., 2015) and a recent meta‐analysis (Stelmach‐Mardas et al., 2016) have constantly reported increase in intakes from lean to plenty seasons. It is on this basis that we conclude that increasing nutritional knowledge would lead to relatively better and stable nutrient intakes and nutritional outcomes.
In a randomized‐cluster controlled trial on the effect of nutrition education focusing on the utilization of local agro‐biodiversity in improving the diversity of children's complementary diets and nutrition knowledge of caregivers, the researchers noted that although a significantly higher proportion of children in the intervention group compared with those in the control group achieved minimum dietary diversity (87.3% vs. 55.7%, P < 0.001); minimum meal frequency (98.8% vs. 88.6%, P = 0.019); and minimum acceptable diet (87.8% vs. 51.9%, P < 0.001), the increase in DDS was not associated with the observed increase in maternal nutrition knowledge (Waswa, Jordan, Herrmann, Krawinkel, & Keding, 2015). The authors conclude that effect of the intervention on child dietary diversity was not via an increase in nutrition knowledge of the caregivers per se and that although increased nutrition knowledge is an important factor, on its own, it cannot lead to changes in behaviours. This study did not find significant relationship between the changes in nutrient intakes with caregiver's attitudes score but showed a positive significant relationship between nutritional knowledge score and the attitude score. This indicates that whereas caregiver's attitudes did not have direct influence on dietary intakes, the attitudes and perceptions are useful to influence behaviours. It is also worthy to note that we only assessed the attitudes at season. This is a limitation of this study. We suspect that some of the responses to the attitudes questions may change from one season to the other given the difference prevailing circumstance, say, for instance, food availability.
Our findings reveal the effects of the season on children's intakes and diet quality. In the plenty season, the intakes for most of the nutrients are sufficient to meet the children's requirements. However, the situation is different during the lean season. Using the MAR, there was a significant decrease in the quality of the micronutrient content of the diet consumed by children from 84% to 80% of the dietary recommendations from the plenty season to the lean season. The proportion of children with intakes below the recommendations for vitamin A, folate, and calcium increased significantly from 20.5%, 29.1%, and 73.5%, respectively, to 69.5%, 64.9%, and 84.8% from plenty season to lean season. These results are comparable with those of other studies in Kenya and Burkina Faso, where, in the Kenya study, the children's MAR changed from 61.1% in the lean season to 61.9% in plenty season and, in the Burkina Faso study, the MPA of children's micronutrient intakes increased from 43% in the lean season to 52% in the plenty season (Arsenault et al., 2014; M'Kaibi et al., 2015). In the plenty season, food is available, as the farmers produce their own, but even so, for those not producing, the prices are low. Many families are therefore able to eat from a variety of food groups and meet their daily requirements for most foods. In the lean season, however, children's diet is predominantly composed of carbohydrates with carbohydrate contributing more than the recommended maximum 65% in well over 80% of the children compared with the 70% in the plenty season. We suspect that this high intake of carbohydrate rich but nutrient poor diets during the lean season is responsible for bigger proportions of children reaching the daily recommendations for calories but not micronutrients. Zinc, iron, and calcium are the most problematic micronutrients with both seasons recording high prevalence of dietary inadequacies of up to 84%. The high prevalence of gaps regarding these three micronutrients can be attributed to the high dependence on predominantly cereal‐based diets with limited amounts of the more nutrient dense animal source foods in the diets. This is evidenced by our results that show that carbohydrates provide up to more than 80% of the total calories. A recent study in Vihiga and Kitui by Ferguson, Chege, Kimiywe, Wiesmann, and Hotz (2015) reported similar results and noted that iron and zinc would remain a problem even if the absorption were to be enhanced form low to moderate. The authors in the study recommended introduction of low‐cost foods that are rich sources of iron, zinc, and calcium into the local food supply for adoption by caregivers of young children.
Although our study was limited in the study duration with regard to the number of data collection rounds covered, it provides a very useful insight as far as the usefulness of nutrition education is concerned in improving micronutrient adequacy of the diet in children.
5. CONCLUSIONS
In conclusion, our study confirms findings of earlier studies that indicate seasonal variations in dietary intakes of children among rural households; however, we further demonstrated that caregiver's nutritional knowledge is an important factor that mediates seasonal changes in diets. Therefore, increasing nutrition knowledge among these households will help stabilizing dietary intakes across seasons. Moreover, we recommend that programmes that aim at improving dietary intakes among children should consider changing attitudes in addition to nutrition education.
CONFLICTS OF INTEREST
The authors declare that they have no conflicts of interest.
CONTRIBUTIONS
Céline Termote, Gina Kennedy, Francis Odhiambo Oduor, and Dorothy Mituki‐Mungiria conceptualized the scope and framework of the study. Francis Odhiambo Oduor and Céline Termote conducted the statistical analysis for this article. Francis Odhiambo Oduor, Julia Boedecker, and Céline Termote wrote the first‐draft manuscript. Julia Boedecker, Dorothy Mituki‐Mungiria, Francis Odhiambo Oduor, Céline Termote, and Gina Kennedy contributed to writing.
ACKNOWLEDGEMENTS
We are grateful to the Vihiga community particularly the sampled communities for accepting the study and supporting it. We also thank all the enumerators and data entry team for their hard work and Carl Lachat of Ghent University for assistance with the Lucille programme.
Oduor FO, Boedecker J, Kennedy G, Mituki‐Mungiria D, Termote C. Caregivers' nutritional knowledge and attitudes mediate seasonal shifts in children's diets. Matern Child Nutr. 2019;15:e12633 10.1111/mcn.12633
REFERENCES
- Abuya, B. A. , Ciera, J. , & Kimani‐Murage, E. (2012). Effect of mother's education on child's nutritional status in the slums of Nairobi. BMC Pediatrics, 12(1), 80 10.1186/1471-2431-12-80 [DOI] [PMC free article] [PubMed] [Google Scholar]
- Allen, L. , de Benoist, B. , Dary, O. , & Hurrell, R. (2006). Guidelines on food fortification with micronutrients. Who, Food and Agricultural Organization of the United Nations, 341 10.1242/jeb.02490 [DOI] [Google Scholar]
- Appoh, L. Y. , & Krekling, S. (2005). Maternal nutritional knowledge and child nutritional status in the Volta Region of Ghana. Maternal and Child Nutrition, 1(2), 100–110. 10.1111/j.1740-8709.2005.00016.x [DOI] [PMC free article] [PubMed] [Google Scholar]
- Arsenault, J. E. , Nikiema, L. , Allemand, P. , Ayassou, K. A. , Lanou, H. , Moursi, M. , & Martin‐Prevel, Y. (2014). Seasonal differences in food and nutrient intakes among young children and their mothers in rural Burkina Faso. Journal of Nutritional Science, 3, e55 10.1017/jns.2014.53 [DOI] [PMC free article] [PubMed] [Google Scholar]
- Black, R. E. , Victora, C. G. , Walker, S. P. , Bhutta, Z. A. , Christian, P. , de Onis, M. , … Uauy, R. (2013). Maternal and child undernutrition and overweight in low‐income and middle‐income countries. The Lancet, 382(9890), 427–451. 10.1016/S0140-6736(13)60937-X [DOI] [PubMed] [Google Scholar]
- Burke, M. (2014). Selling low and buying high: An arbitrage puzzle in Kenyan villages. Working Paper.
- Bwibo, N. O. , & Neumann, C. G. (2003). The need for animal source foods by Kenyan children. Journal of Nutrition, 133, 3936S–3940S. http://jn.nutrition.org/content/133/11/3936S.full [DOI] [PubMed] [Google Scholar]
- Christian, P. , & Dillon, B. (2016). Long term consequences of consumption seasonality, working paper series N° 241, African Development Bank, Abidjan, Côte d'Ivoire.
- Cologne, J. B. (2006). Re: “When is baseline adjustment useful in analyses of change? An example with education and cognitive change”. American Journal of Epidemiology, 164(11), 1138–1139. 10.1093/aje/kwj359 [DOI] [PubMed] [Google Scholar]
- Dewey, K. (2001). Guiding principles for complementary feeding of the breastfed child (Vol. 15) (pp. 18–25). Washington D.C.: Pan American Health Organization and World Health Organization; 10.1017/S1368980011002485 [DOI] [Google Scholar]
- Ekesa, B. N. , Walingo, M. K. , & Abukutsa‐Onyango, M. O. (2008). Influence of agricultural biodiversity on dietary diversity of preschool children in Matungu division, western Kenya. African Journal of Food, Agriculture, Nutrition and Development, 8(4), 390–404. Retrieved from https://www.ajol.info/index.php/ajfand/article/view/19200 [Google Scholar]
- FAO, IFAD and WFP (2015). The state of food insecurity in the world 2015. Meeting the 2015 international hunger targets: taking stock of uneven progress. Rome, FAO. [DOI] [PMC free article] [PubMed]
- Ferguson, E. , Chege, P. , Kimiywe, J. , Wiesmann, D. , & Hotz, C. (2015). Zinc, iron and calcium are major limiting nutrients in the complementary diets of rural Kenyan children. Maternal & Child Nutrition, 11, 6–20. 10.1111/mcn.12243 [DOI] [PMC free article] [PubMed] [Google Scholar]
- Fink, G , Jack, B. K. , & Masiye, F. (2014). Seasonal credit constraints and agricultural labor supply: Evidence from Zambia. National Bureau of Economic Research.
- Food and Nutrition Board, Institute of Medicine (2003). Dietary reference intakes: Applications in dietary planning. Washington, DC: National Academy Press. [Google Scholar]
- Frongillo, E. A. , Onis, M. D. , & Hanson, K. M. P. (1997). Socioeconomic and demographic factors are associated with worldwide patterns of stunting and wasting of children. Journal of Nutrition, 127(12), 2302–2309. [DOI] [PubMed] [Google Scholar]
- Gewa, C. A. , Murphy, S. P. , Weiss, R. E. , & Neumann, C. G. (2014). Determining minimum food intake amounts for diet diversity scores to maximize associations with nutrient adequacy: An analysis of schoolchildren's diets in rural Kenya. Public Health Nutrition, 17(12), 2667–2673. 10.1017/S1368980014000469 [DOI] [PMC free article] [PubMed] [Google Scholar]
- Gibson, R. S. , & Ferguson, E. L. (2008). An interactive 24‐hour recall for assessing the adequacy of iron and zinc intakes in developing countries. Washington D.C.: ILSI‐press. [Google Scholar]
- Glymour, M. M. , Weuve, J. , Berkman, L. F. , Kawachi, I. , & Robins, J. M. (2005). When is baseline adjustment useful in analyses of change? An example with education and cognitive change. American Journal of Epidemiology, 162(3), 267–278. 10.1093/aje/kwi187 [DOI] [PubMed] [Google Scholar]
- Hirvonen, K. , Taffesse, A. , & Worku Hassen, I. (2016). Seasonality and household diets in Ethiopia. Public Health Nutrition, 19(10), 1723–1730. 10.1017/S1368980015003237 [DOI] [PMC free article] [PubMed] [Google Scholar]
- ILO . (2013). Global Employment Trends 2013. Recovering from a second jobs dip. Global Employment Trends (pp. 69–73).
- Jaetzold, R. , Schmidt, H. , Hornetz, B. , & Shisanya, C. (2005). Farm management handbook of Kenya—Natural conditions and farm management information—West Kenya‐Subpart A1. Western Province (2nd ed.). Nairobi, Kenya: Government Printers, II: 1–319. [Google Scholar]
- Kenya National Bureau of Statistics (KNBS) (2010). The 2009 Kenya Population and Housing Census In “Counting our people for the implementation of vision 2030” volume 1C population distribution by age, sex and administrative units. Nairobi, Kenya: Government of Kenya. [Google Scholar]
- Lukmanji, Z. , Hertzmark, E. , Mlingi, N. , Assey, V. , Ndossi, G. , & Fawzi, W. (2008). Tanzania food composition tables, Muhimbili University of Health and Allied Sciences (MUHAS). ( p. 272). Boston, USA: Tanzania Food and Nutrition Centre (TFNC), Dar es salaam ‐ Tanzania and Harvard School of Public Health (HSPH). [Google Scholar]
- Macias, Y. F. , & Glasauer, P. (2014). Guidelines for assessing nutrition‐related knowledge, attitudes and practices manual. ( pp. 107–131). Rome: Food and Agriculture Organization of the United Nations. [Google Scholar]
- Miller, J. , Brett, R. , Cuong, T. , Sean, B. , Christina, O. L. , Kathryn, W. , & Lynne, C. (2013). Seasonal variation in the nutritional status of children aged 6 to 60 months in a resettlement village in West Timor. Asia Pacific Journal of Clinical Nutrition, 22(3), 449–456. [DOI] [PubMed] [Google Scholar]
- Mitchikpe, C. E. S. , Dossa, R. a. M. , Ategbo, E. a. D. , Van Raaij, J. M. A. , & Kok, F. J. (2009). Seasonal variation in food pattern but not in energy and nutrient intakes of rural Beninese school‐aged children. Public Health Nutrition, 12(3), 414–422. 10.1017/S1368980008002929 [DOI] [PubMed] [Google Scholar]
- M'Kaibi, F. K. , Steyn, N. P. , Ochola, S. , Du Plessis, L. , Cromwell, E. , Cooper, D. , & Hodgkin, T. (2015). Effects of agricultural biodiversity and seasonal rain on dietary adequacy and household food security in rural areas of Kenya. BMC Public Health, 15(1), 422 10.1186/s12889-015-1755-9 [DOI] [PMC free article] [PubMed] [Google Scholar]
- OECD/FAO (2016). OECD‐FAO Agricultural Outlook 2016–2025. Paris: OECD Publishing; 10.1787/agr_outlook-2016-en [DOI] [Google Scholar]
- Rossato, S. L. , Olinto, M. T. A. , Henn, R. L. , Anjos, L. A. , Bressan, A. W. , & Wahrlich, V. (2010). Seasonal effect on nutrient intake in adults living in Southern Brazil. Cadernos de Saúde Pública, 26(11), 2177–2187. 10.1590/S0102-311X2010001100019 [DOI] [PubMed] [Google Scholar]
- Savy, M. , Martin‐Prével, Y. , Traissac, P. , Eymard‐Duvernay, S. , & Delpeuch, F. (2006). Dietary diversity scores and nutritional status of women change during the seasonal food shortage in rural Burkina Faso. The Journal of Nutrition, 136, 2625–2632. http://jn.nutrition.org/cgi/content/short/136/10/2625 [DOI] [PubMed] [Google Scholar]
- Sehmi, J. K. (1993). National food composition tables and the planning of satisfactory diets in Kenya. Nairobi: Government Printers. [Google Scholar]
- Smith, L. C. , & Haddad, L. (2000). Explaining child malnutrition in developing countries: A cross‐country analysis. Research Report 111. Washington, D.C.: International Food Policy Research Institute. https://doi.org/http://cdm15738.contentdm. http://oclc.org/utils/getfile/collection/p15738coll2/id/125371/filename/125372.pdf
- Stadlmayr, B. , Charrondiere, U. R. , Enujiugha, V. N. , Bayili, R. G. , Fagbohoun, E. G. , Samb, B. , … Burlingame, B. (2012). West African food composition table –Table de composition des aliments d'Afrique de l'Ouest. Rome, Italy: FAO. [Google Scholar]
- Stelmach‐Mardas, M. , Kleiser, C. , Uzhova, I. , Penalvo, J. L. , La Torre, G. , Palys, W. , … Boeing, H. (2016). Seasonality of food groups and total energy intake: A systematic review and meta‐analysis. European Journal of Clinical Nutrition, 70(6), 700–708. 10.1038/ejcn.2015.224 [DOI] [PubMed] [Google Scholar]
- U.S. Department of Agriculture . (2007). USDA table of nutrient retention factors, release 6. Nutrient Data Laboratory
- U.S. Department of Agriculture, Agricultural Research Service . (2014). USDA National Nutrient Database for standard reference, release 27. Nutrient Data Laboratory Home Page, http://www.ars.usda.gov/ba/bhnrc/ndl
- Vaitla, B. , Devereux, S. , & Swan, S. H. (2009). Seasonal hunger: A neglected problem with proven solutions. PLoS Medicine, 6(6), e1000101 10.1371/journal.pmed.1000101 [DOI] [PMC free article] [PubMed] [Google Scholar]
- Waswa, L. , Jordan, I. , Herrmann, J. B. , Krawinkel, M. , & Keding, G. (2015). Community‐based educational intervention improved the diversity of complementary diets in western Kenya: Results from a randomized controlled trial. Public Health Nutrition, 1, 1–14. 10.1017/S1368980015000920 [DOI] [PMC free article] [PubMed] [Google Scholar]
- Waswa, L. M. , Jordan, I. , Herrmann, J. , Krawinkel, M. B. , Keding, G. B. (2014). Seasonal variations in women dietary diversity scores and relationship with nutritional status in Western Kenya [Poster]—Bioversity International‐1 p. http://hdl.handle.net/10568/67472
- WHO/FAO (World Health Organization/Food and Agriculture Organization) . (2004). Vitamin and mineral requirements in human nutrition. 2nd ed WHO, Geneva. [Google Scholar]
- World Health Organization (Ed.) (2009). Global health risks: Mortality and burden of disease attributable to selected major risks. Geneva, Switzerland: World Health Organization. [Google Scholar]