

Abstract
This study utilized human fibroblasts as a preclinical discovery and diagnostic platform for identification of cell biological signatures specific for the LRRK2 G2019S mutation producing Parkinson’s disease (PD). Using live cell imaging with a pH-sensitive Rosella biosensor probe reflecting lysosomal breakdown of mitochondria, mitophagy rates were found to be decreased in fibroblasts carrying the LRRK2 G2019S mutation compared to cells isolated from healthy subject (HS) controls. The mutant LRRK2 increased kinase activity was reduced by pharmacological inhibition and targeted antisense oligonucleotide treatment, which normalized mitophagy rates in the G2019S cells and also increased mitophagy levels in HS cells. Detailed mechanistic analysis showed a reduction of mature autophagosomes in LRRK2 G2019S fibroblasts, which was rescued by LRRK2 specific kinase inhibition. These findings demonstrate an important role for LRRK2 protein in regulation of mitochondrial clearance by the lysosomes, which is hampered in PD with the G2019S mutation. The current results are relevant for cell phenotypic diagnostic approaches and potentially for stratification of PD patients for targeted therapy.
Introduction
The majority of Parkinson’s disease (PD) patients suffer from sporadic forms of the disease with familial forms accounting for only ~10% of the affected individuals (1–4). The principal risk factor for PD is age, with incidence rising significantly after 50 (5–7). PD manifests in a number of tissues in addition to the brain. Biochemical and physiological changes including degeneration is found in the gut, heart and other organs (8–10). Moreover, genetic risk factors indicate that system-related immune function influences this disease [(11), reviewed in (12)]. Several research teams have employed PD patient skin cells to investigate the biological changes in PD that could reflect the underlying mechanisms (13–21). Conceptually, the degeneration of neuronal cells in PD and many other neurodegenerative diseases may simply reflect a higher vulnerability of certain cell types for age-dependent degeneration upon exposure to certain environmental or genetic stress ors (22).
An undisturbed cycle of mitochondrial turnover is essential for efficient cellular function and output (23). Human-induced pluripotent stem cell (iPSC)-derived neurons from PD patients carrying the leucine-rich repeat kinase 2 (LRRK2) PD triggering G2019S mutation have altered mitochondrial movement, increased vulnerability to chemical stressors of mitochondrial function (20) and increased mitochondrial DNA damage (24). Mitochondrial function is compromised in fibroblasts isolated from PD patients carrying the LRRK2 G2019S mutations and in sporadic PD patients (20,25–28). Genetic variations in the LRRK2 locus are associated with an increased risk for sporadic PD development (29) and an increase in LRRK2 kinase activity is observed in idiopathic PD brain tissue (30). Accumulation of damaged mitochondria is observed in G2019S transgenic mice (31). Decrease in mitophagy is observed in PD fibroblasts and iPSC-derived neurons carrying the LRRK2 G2019S mutation (21,32), whereas others have reported increased mitophagy linked to changes of calcium homeostasis in primary mouse cortical neurons carrying the G2019S mutation (33). In aging, a major risk factor for PD development, cells exhibit impaired mitochondrial quality control leading to accumulation of large senescent mitochondria (34). In our recent work, by utilizing a static co-localization based assay, we have shown that pharmacological inhibition of LRRK2 kinase (using LRRK2 IN-1) normalizes valinomycin-induced mitophagy in LRRK2 G2019S and sporadic PD patient fibroblasts (28), suggesting a role for LRRK2 in this cellular process. However, the dynamics of this process, the underlying mechanisms of the specific LRRK2 function and its role in PD development are largely unknown.
As mitochondrial function is linked to PD pathogenesis (35,36), here we investigated the temporal and mechanistic effect of LRRK2 G2019S mutation on mitophagy rate by using skin fibroblasts from healthy controls and LRRK2 G2019S carriers. Mitophagy rates were found to be decreased in human fibroblasts derived from PD patients carrying the LRRK2 G2019S mutation compared to healthy subject (HS) controls. Pharmacological LRRK2 kinase inhibition and antisense oligonucleotide (ASO)-based downregulation of LRRK2 normalized mitophagy indicating that LRRK2 kinase activity is important in regulating mitochondrial degradation by the lysosome. Furthermore, lower levels of mature autophagosomes were observed in LRRK2 G2019S fibroblasts compared to wild-type fibroblasts. The reduced rate of mitophagy can, therefore, be interpreted as a reduction in autophagosome maturation. Overall, these data indicate that in human peripheral cells carrying the LRRK2 G2019S mutation, mitophagy rates are reduced, which may lead to accumulation of damaged mitochondria ultimately increasing cellular vulnerability to external stressors.
Results
Validation of the Rosella biosensor probe for mitophagy rate assessment
By utilizing a static Tom20 and Lamp1 co-localization-based assay, we have previously shown that pharmacological LRRK2 kinase inhibition with LRRK2 IN-1 restores mitochondrial and lysosomal co-localization after valinomycin treatment in mutant, sporadic and HS human fibroblasts, indicating a direct LRRK2 function in this mechanism (28). However, the dynamics of this process remain largely unknown. Using new and refined methods, our goal is to gain a deeper understanding of the temporal changes in mitochondrial degradation exhibited by PD patient-derived fibroblasts carrying the LRRK2 G2019S mutation. For this, live cell imaging of mitophagic flux was performed with a Rosella pH responsive dual fluorescence reporter bioprobe [comprising pH-sensitive Green fluorescent protein (GFP) variant pHluorin and pH-insensitive Red fluorescent protein (RFP) variant DsRed] containing a human mitochondrial target sequence [a modification of the Rosella bioprobe (37–40)]. The dual fluorescence-labeled mitochondria, upon entering the mitophagic pathway are initially associated with a phagophore vacuole, before being enclosed into an autophagosome that matures and eventually fuses with a lysosome. During maturation, the autophagic vesicles undergo acidification, quenching the Rosella pH-sensitive GFP signal (pHluorin), leaving the RFP signal unaffected until full mitochondrial degradation. The resultant green/red fluorescence ratio represents a measure of the mitophagy rate (Fig. 1A). To validate the specificity of the newly sub-cloned lentiviral Rosella bioprobe, confocal imaging was performed on 293T HEK cells transfected with the bioprobe and treated with 1 μM rotenone (a mitochondrial complex I inhibitor that induces mitophagy). Assessment of localization of the Rosella fluorescence signals within the cells showed the presence of two types of punctae: (i) those where red signal always colocalized with the green signal and the mitochondrial marker Tom20, indicative of intact mitochondria or the ones that just entered the mitophagic pathway (Fig. 1B, yellow arrows) and (ii) larger Tom20 positive puncta, also positive for red signal, but devoid of green fluorescence, suggesting the presence of acidic vacuoles (Fig. 1B, white arrows). To further confirm the functionality of the bioprobe, 293T HEK cells transfected with the Rosella plasmid were treated with compounds that induce mitophagy [1 μM rotenone and 1 mm defeiprone (DFP)] and autophagy (20 nm rapamycin) followed by live cell imaging (Fig. 1C). Compared to the non-treatment condition, treatment with rotenone and DFP led to a significant increase in the rate of mitophagy (as indicated by lower green/red fluorescence ratio), and the cells treated with rapamycin exhibited a significant decrease in the rate of mitophagy, thus further confirming the specificity of the bioprobe. Similarly, human HS fibroblasts treated with 10 μM valinomycin (a potassium ionophore that induces loss of mitochondrial membrane potential), at a dose shown to induce an increased vulnerability in PD patient fibroblasts harboring the LRRK2 G2019S mutation (28), presented mitochondrial network fragmentation and increased mitophagy rate as shown by immunocytochemistry (Fig. 1D) and live cell imaging analysis (Fig. 1E). See Supplementary Material, Figure S1 for representative images from live cell imaging of transfected 293T HEK cells (Supplementary Material, Fig. S1A) and fibroblasts (Supplementary Material, Fig. S1B) transduced with the Rosella bioprobe depicting the processing definition used to analyze phase, red and green fluorescent signals within the cells.
Figure 1.
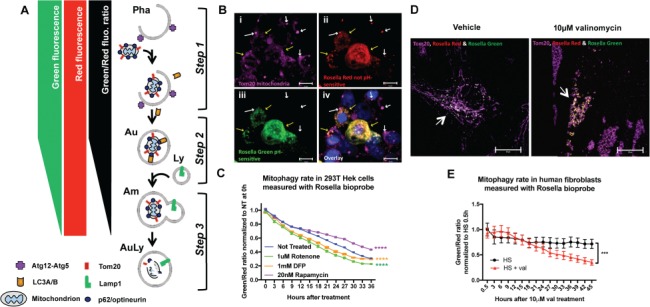
Validation of methodology to measure mitophagic flux using Rosella biosensor. (A) Schematic representation of the Rosella fluorescence output: Step 1. As the mitochondria enter the mitophagic pathway, they are associated with phagophore formation before being enclosed into an autophagosome that matures and eventually fuses with a lysosome. Step 2. During maturation, the autophagic vesicle will undergo acidification. As the pH changes from high mitochondrial pH ~8.2 to the more acidic pH, green fluorescence decreases while red fluorescence is unaffected, lowering the Rosella green signal and thus decreasing the Rosella green/red ratio. Step 3. After the lysosomal fusion, the pH drops to ~5.5, quenching the green fluorescence and bringing the green/red ratio down. Eventually, with full mitochondrial protein degradation, the red fluorescence also decays. Pha: phagophore, Au: autophagosome, Am: amphisome; Ly: lysosome; AuLy: autolysosome. (B) Confocal Z-stack maximal projection (at 100× magnification) of a Rosella transfected 293T cells treated with 1 μM rotenone for 24 h. Yellow arrows point to Tom20 labeled mitochondria (purple, i) transfected and expressing both Rosella red (ii) and green (iii). White arrows pointing to Tom20+ (purple, i) and only Rosella red positive (ii) mitochondria, most probably localized in an acidic low pH environment such as the autophagosome on its way to final degradation in the lysosome. Blue labels nuclear Hoechst staining (iv). (C) Live cell imaging in human 293T HEK cells transfected with the lentivirus-CMV driven Rosella bioprobe and 48 h later treated with 1 μM rotenone, complex I blocker consequently inducing mitochondrial damage, 20 nm rapamycin, an autophagy inducer, and 1 mM DFP, mitophagy inducer. Cells were imaged using live cell IncuCyte imaging system every 3 h immediately after compound application. Two-way ANOVA shows a significant difference in the green/red ratio levels between the non-treated cells and rotenone, rapamycin and DFP treated cells (P<0.0001, F(4, 975) = 970, with Dunnett’s post hoc multiple testing correction). (D) Confocal Z-stack maximal projection (at 100× magnification) of Rosella transduced human fibroblasts (HS21) treated with Dimethyl sulfoxide (DMSO) or 10 μM valinomycin, a mitochondrial depolarizing agent, for 24 h. Arrows point to Rosella transfected (green and red) fibroblasts co-stained with Tom20 to label the mitochondrial networks (purple). Upon 10 μM valinomycin treatment, these networks are visibly fragmented. (E) Live cell imaging of human fibroblasts infected with the lentivirus CMV-driven Rosella bioprobe and treated with DMSO or 10 μM valinomycin. Cells were imaged using live cell IncuCyte imaging system every 3 h immediately after compound application. Two-way ANOVA shows a significant difference in the green/red ratio levels between the vehicle-treated and valinomycin-treated cells (P<0.0004, F(1, 314) = 13.05). Error bars represent standard error of the mean [(SEM); P<0.001 ***, P<0.0001 ****].
Mitophagy rate is decreased in fibroblasts harboring the LRRK2 G2019S mutation
For an in-depth analysis of the alteration in the mitochondrial degradation process associated with mutations in the LRRK2 gene, mitophagy assay was performed using the optimized Rosella biosensor probe in human fibroblasts derived from HS and PD patients carrying the LRRK2 G2019S (LRRK2) mutation (Fig. 2). Live cell imaging exhibited a significantly increased green/red ratio, indicative of a decreased rate of mitophagy in LRRK2 G2019S cells compared to HS controls (Fig. 2A, P = 0.0201). LRRK2 is a large protein with multiple subunits and the G2019S mutation is located in the kinase domain. Previous studies have found that cells with this mutation have elevated kinase activity (41), which appears to be responsible for many of its downstream effects. This prompted us to test whether inhibition of LRRK2 kinase activity could normalize the observed reduction in the rate of mitophagy in G2019S human fibroblasts. Inhibition of the kinase was performed (i) pharmacologically, using the previously established LRRK2 kinase inhibitors, LRRK2 IN-1 (IN-1) (42) and Mli-2 (43,44), and (ii) genetically, using ASOs designed to specifically target and skip either exon41 (which houses the G2019S mutation) or exon2 of the LRRK2 pre-messenger ribonucleic acid (mRNA) (Supplementary Material, Figs S2 and S3). Supporting our hypothesis, LRRK2 kinase inhibition in G2019S cells using IN-1 (30 uM) rescued the phenotype and increased the rate of mitophagy to a level comparable to that of HS controls (Fig. 2B, F(2,16) = 4.136, P = 0.0356). While being quite selective, the first-generation inhibitor IN-1 has also been reported to induce off-target effects (45). To confirm the involvement of LRRK2 kinase activity in the regulation of mitophagy, an additional, more specific inhibitor of LRRK2 kinase activity, Mli-2, was utilized in our study. In an independent experiment, treatment of fibroblasts with 10 nm Mli-2 rescued the rate of mitophagy in LRRK2 mutant cells (Fig. 2C, F (2,28) = 7.783, P = 0.0021). Recent reports have identified a subset of RAB GTPases including RAB10 to be primary targets of LRRK2 which gets phosphorylated at threonine 73 in a kinase-dependent manner (46,47). To assess the potency of Mli-2 treatment on LRRK2 kinase activity in human fibroblasts, levels of RAB10 phosphorylation was analyzed. Treatment with Mli-2 led to a significant downregulation of phosphorylation of RAB10 with no change in level of the total RAB10 protein (Supplementary Material, Fig. S4, P = 0.0082).
Figure 2.
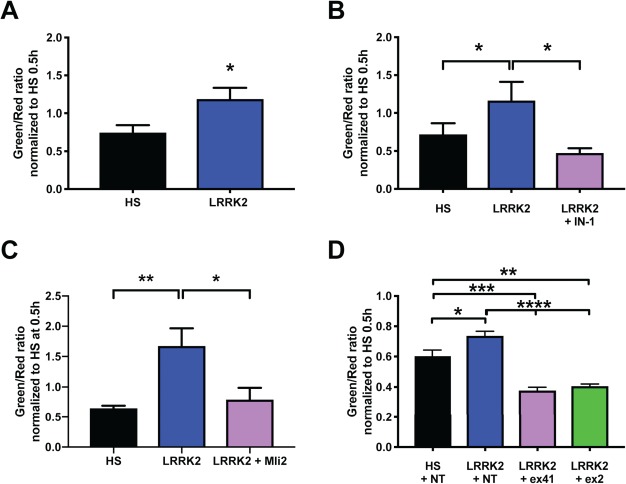
Patient-derived fibroblasts carrying the LRRK2 G2019S mutation show a decrease in mitophagy rate, which is normalized by LRRK2 kinase inhibition and LRRK2 specific ASO treatment. Live cell imaging of HS and LRRK2 G2019S (LRRK2) patient-derived fibroblasts expressing the mitophagy Rosella biosensor probe. (A) LRRK2 G2019S fibroblasts showed a decreased mitophagic rate compared to HS control cells [green/red ratio, unpaired t-test P = 0.0201, N = 11 HS and N = 9 LRRK2 G2019S (LRRK2), data pooled from two independent experiments]. (B) Mitophagic flux is rescued in patient-derived LRRK2 G2019S fibroblasts treated with 30 μM IN-1 LRRK2 kinase inhibitor, restoring the mitophagy levels similar to levels as observed in fibroblast cells derived from HS [one-way ANOVA F(2,16) = 4.136, P = 0.0356, with FDR multiple testing correction (MTC), N = 7 HS and N = 6 LRRK2 G2019S]. (C) Mitophagic flux is rescued in patient-derived LRRK2 G2019S fibroblasts treated with 10 nm Mli-2 LRRK2 kinase inhibitor, restoring the mitophagy levels to similar levels as observed in HS fibroblast cells (one-way ANOVA F(2, 28) = 7.783, P = 0.0021, with Tukey’s MTC. Data pooled from two independent experiments N = 11 HS and N = 10 LRRK2 G2019S). (D) Comparison of mitophagic flux in patient-derived LRRK2 G2019S fibroblasts treated with LRRK2 exon 41 and exon 2 ASO compared to HS and LRRK2 non-target (NT) ASO-treated fibroblasts. LRRK2 ex41 and ex2 skipping restores mitophagy rate in the LRRK2 fibroblasts [one-way ANOVA (F(3,18) = 27.22, P = 0.0001) with Tukey’s MTC. Data pooled from two independent experiments N = 7 HS and N = 5 LRRK2 G2019S]. All data was collected 21 h post media change and the initiation of Rosella live cell imaging. Error bars represent SEM; P<0.5 *, P<0.01 **, P<0.001 ***, P<0.0001 ****).
LRRK2 ASOs used for genetic manipulation of the kinase activity were designed to induce skipping of LRRK2 exon41, resulting in a reading frameshift and thereby producing an messenger ribonucleic acid (mRNA) encoding either a truncated version of the protein or degradation of the entire transcript via a nonsense mediated decay induction by the creation of a premature termination codon (PTC) in exon42 (48). A second ASO-targeting approach involving skipping of LRRK2 exon 2, which results in a reading frameshift and consequent mRNA with a PTC in exon 3, essentially knocking down protein expression (49), was also used. A non-target (NT) ASO designed to not bind to any transcript within the genome was included as a negative control. Further confirming our hypothesis, genetic inhibition of the LRRK2 kinase activity using LRRK2 exon41 and exon2 specific ASOs also rescued the decreased rate of mitophagy observed in G2019S mutant cells (Fig. 2D, F(3,18) = 27.22, P = 0.0001). Exon-skipping and protein expression analysis performed to validate the activity of the oligonucleotides showed that transfection of fibroblasts with ex41 ASO induced ~90% skipping of the exon in PD LRRK2 G2019S fibroblasts (Supplementary Material, Fig. S2A) and reduced the total LRRK2 protein level by 43% (Supplementary Material, Fig. S3A and B). Treatment with ex2 ASO induced a ~64% skipping of exon 2 in LRRK2 G2019S fibroblasts (Supplementary Material, Fig. S2B) and reduced the LRRK2 protein levels by 57% (Supplementary Material, Fig. S3A and B). To further assess the effect of ASO-induced exon skipping on LRRK2 kinase activity, change in the expression of phosphoRAB10 (at Th73) was analyzed. We observed a significant decrease of pRAB10 expression (1.52 fold, P = 0.0004) in fibroblasts (both HS and LRRK2 G2019S) upon treatment with ex41 ASO compared to NT control (Supplementary Material, Fig. S3C and D), while the total RAB10 level remain unchanged (Supplementary Material, Fig. S3C and E).
As the inhibitors reduce LRRK2 kinase activity in all cells irrespective of their genotype, induction of mitophagy was also observed in HS fibroblasts when treated with IN-1 (Supplementary Material, Fig. S5A, P = 0.0473) and Mli-2 (Supplementary Material, Fig. S5B, P = 0.0007). Similarly, as the ASOs used here are not mutation specific, exon skipping and reduction of LRRK2 kinase activity led to an increase in rate of mitophagy in HS cells as well (Supplementary Material, Fig. S5C, P = 0.0005, F(2,18) = 12.18). Our data, showing a functional rescue of the mitophagy phenotype in LRRK2 G2019S fibroblast cells as well as an induction of increased mitophagy rate in HS cells, strongly suggests an important role for LRRK2 kinase in the control of intracellular mitophagic flux.
Alterations in autophagosome maturation contribute to the decreased mitophagy rate in LRRK2 G2019S human fibroblasts
Given that LRRK2 G2019S mutant fibroblasts exhibit a significantly decreased mitophagy rate, we wanted to determine whether this could be due to alterations in the level of proteins associated with various stages of the mitophagy pathway (Fig. 3). Mitochondrial degradation is initiated by labeling and ubiquitination of the organelle, soon after which it translocates to a newly formed phagophore. As the process progresses, the mitochondrial-cargo carrying autophagosome elongates, matures and eventually fuses with a lysosome, leading to complete degradation of the dysfunctional mitochondria (50–52). Each stage of this process, including initiation, transport, maturation of the autophagosome and degradation by the lysosomes are tightly regulated by several proteins as depicted in Figure 3A. To determine the mechanism underlying the decrease of mitophagic flux in LRRK2 G2019S fibroblasts, protein expression analysis was performed for the key protein players of this pathway. As valinomycin induces mitophagy and low dose (10 μM) valinomycin treatment increased vulnerability in LRRK2 G2019S fibroblasts (28), mitophagy pathway proteins were analyzed in HS and LRRK2 G2019S fibroblasts at baseline and upon valinomycin-induced mitochondrial membrane depolarization. Moreover, mitophagy is a dynamic process with a quick turnover of autophagic vesicles and proteins associated with it. Hence, to investigate the total content of the autophagosomes and associated proteins, it is important to include a treatment condition that leads to blockage of the pathway at the degradation stage. This was achieved using treatment of the control and mutant cells with 15 nm bafilomycin A1 (bafA1), an inhibitor of vacuolar H+ ATPase-dependent lysosomal acidification and the autophagosome-lysosome fusion (53).
Figure 3.
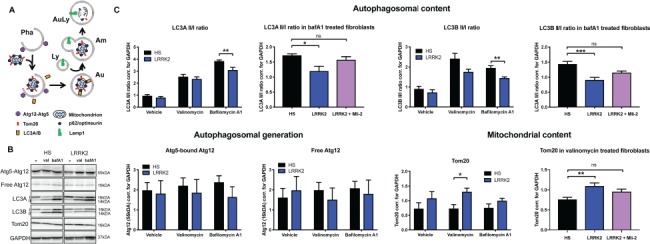
Matured autophagosome load is decreased in LRRK2 G2019S-derived fibroblasts. (A) Representation of the role of various proteins of interest in the process of mitophagic flux and autophagosome maturation. Pha: phagophore, Au: autophagosome, Am: amphisome; Ly: lysosome; AuLy: autolysosome. (B) Protein expression measured 21 h after vehicle, 10μM valinomycin (val) or 15nm bafilomycin A1 (bafA1) treatment in HS and LRRK2 G2019S (LRRK2) patient-derived fibroblasts. Representative images from N = 7 HS and N = 6 LRRK2 G2019S. (C) Quantification of western blot protein analysis represented in (B) for Atg12, LC3A, LC3B and Tom20. In an independent experiment, LC3A and LC3B II/I protein ratios and Tom20 protein levels in LRRK2 G2019S fibroblasts were rescued after Mli-2 LRRK2 kinase inhibitor treatment (N = 9 HS and N = 8 LRRK2 G2019S). Statistical analysis was performed either using unpaired Student t-test, one way ANOVA or Kruskal–Wallis test depending on the character of the data set and its distribution. Error bars represent SEM; P<0.5 *, P<0.01 **, P<0.001 ***.
To assess the initiation of the mitophagy process and the autophagosome load in human fibroblasts, the expression of the mature autophagosome content markers LC3A and LC3B and early autophagosome formation marker Atg12 were analyzed. Three human LC3 isoforms (LC3A, LC3B and LC3C) undergo post-translational modifications during autophagy. Cleavage of LC3 at the carboxy terminus immediately following synthesis yields the cytosolic LC3-I form. During autophagy, LC3-I is converted to LC3-II through lipidation by an ubiquitin-like system involving Atg7 and Atg3 that allows for LC3 to become associated with autophagic vesicles. The presence of LC3 in autophagosomes and the conversion of LC3-I to the lower migrating form, LC3-II, have been used as indicators of autophagy and autophagosome load and maturation (54,55). LC3A and LC3B II/I ratios were both significantly reduced in the LRRK2 G2019S fibroblasts after bafA1 treatment, an inhibitor of autophagosome-lysosome fusion and autophagosome degradation resulting in accumulation of late autophagosomes, suggesting lower autophagic flux and lower levels of mature autophagosome in the mutant cells (Fig. 3B and C, t-test LC3AII/I P = 0.007, LC3BII/I P = 0.003). In an independent experiment, Mli2 LRRK2 kinase inhibition rescued the LC3A and B II/I ratios in the bafA1-treated LRRK2 G2019S fibroblasts, increasing the autophagosome load levels to the levels expressed in the HS cells (LC3A P = 0.014, KW stat = 8.552, LC3B P = 0.0004, F(2,21) = 11.81). Both the free Atg12 and the Atg12 covalently bound to Atg5 that are targeted to phagophore vesicle at the early stages of autophagosome formation, showed no change in expression between the HS and the LRRK2 G2019S fibroblasts (Fig. 3B and C), suggesting no alteration in the initial formation of autophagosomes in these cells.
In alignment with our live cell mitophagy rate analysis, increased levels of Tom20 [marker of mitochondrial mass (56,57)] were detected in the LRRK2 G2019S fibroblasts compared to the HS cells after valinomycin treatment (Fig. 3C, P = 0.013), further supporting our finding of decreased rate of mitochondrial degradation in these cells. Mli2 LRRK2 kinase inhibition normalized the Tom20 protein levels in LRRK2 G2019S cells to match the HS levels (P = 0.005, F(2,22) = 6.8), indicating a functional involvement of LRRK2 kinase in the control of mitochondrial degradation.
No changes were observed in other proteins associated with various stages of the mitophagy pathway such as the autophagic mitochondria-specific adaptor protein optineurin (58,59), general autophagy adaptor protein p62 that plays a role in mitophagic flux (60) and in the total levels of poly-ubiquitin or ubiquitin between the two-cell groups. Lamp1, a lysosomal transmembrane protein that serves as a marker for lysosomal content, involved in regulation of lysosomal motility and lysosome–phagosome fusion, also showed no difference in expression between the two cellular genotypes, both in the glycosylated and the unglycosylated form (data not shown).
In summary, (i) decreased ratios of autophagic flux and mature autophagosome marker LC3II/I, (ii) no change in the Atg12 autophagosome formation marker, (iii) increased levels of Tom20 mitochondrial load and (iv) no changes in other mitophagy nor lysosomal proteins, all suggest alterations in autophagosome load and maturation in human fibroblasts carrying the LRRK2 G2019S mutation.
Discussion
The current results demonstrate that human PD patient fibroblasts carrying the LRRK2 G2019S mutation exhibit a decreased mitophagy rate, which was rescued by pharmacological LRRK2 kinase inhibition and ASO-mediated reduction of LRRK2. Furthermore, analysis of key proteins that regulate mitophagy revealed that the LRRK2 mutant cells have lower levels of mature autophagosome load. This work further validates the use of skin fibroblasts as a source for identification of clinical cell biological signatures linked to PD-specific pathologies. Such fibroblasts also provide a preclinical platform for testing new agents for their ability to ameliorate mitochondrial deficits characteristic of PD.
LRRK2 kinase plays a role in the rate of mitophagic flux
LRRK2 has been linked to autophagy, where both LRRK2 gain- and loss-of-function affect autophagic output [reviewed in (61,62)]. This suggests that LRRK2 activity needs to be balanced and maintained within certain levels to successfully control the appropriate rate of autophagic flux. The LRRK2 G2019S mutation was shown to decrease autophagic flux contributing to an accelerated DA neuron loss in Caenorhabditis elegans (63) and was reported to slow down the initiation of mitophagy in human iPSC-derived neurons and fibroblasts, by failing to remove Miro from the microtubular-dependent mitochondrial transport system (21). These studies, coupled with our previous data that described the importance of LRRK2 kinase activity in regulating co-localization of mitochondria and lysosome (28), suggest a prime role for this protein in mitophagy.
Employing Rosella mitophagy biosensor and temporal live cell imaging analysis, a decrease in mitophagy rate was observed in the LRRK2 G2019S PD patient fibroblasts. In combination with the increase in Tom20 levels (upon valinomycin treatment), this finding indicates an increase in the number of undigested mitochondria. Further in-depth analysis of the key molecular players of the mitophagic pathway showed that these mutant cells have an overall reduced level of late autophagosomes, as observed from the decreased ratio of LC3A and B II/I, with no change in early phagophore formation marker Atg5. Given that these cellular phenotypes were rescued using pharmacological LRRK2 kinase inhibition and ASOs regulating LRRK2 function, the accumulation of undigested mitochondrial load is likely due to a LRRK2 G2019S-dependent mechanism involving autophagosomes. Supporting our findings and in the context of reported increased LRRK2 kinase activity in sporadic PD (30), a recent study found decreased LC3B levels in the cerebrospinal fluid (CSF) of early-stage PD patients, identifying autophagy dysregulation as an early molecular change in PD progression (64).
An important influence on the regulation of mitophagy by LRRK2 could be by its regulation of RAB GTPases to control the transport of autophagic vesicles to lysosomes. Several Rab proteins have been found to be involved in autophagosome formation, transport and maturation [reviewed in (50–52,65)], and a subset of them have been recently identified to be phosphorylated by LRRK2, leading to their inactivation (46,47). Specifically, RAB7, which is primarily involved in the transport of late endosomal vesicles to the lysosome, may have an important role in the late stages of autophagy (66–70). The activity of RAB7 was shown to be decreased in fibroblasts from PD patients with LRRK2 G2019S mutation (71). This indicates a potential negative regulation of the activity of RAB7, and thereby vesicular transport, by the LRRK2 kinase.
Decreased mitophagy rate can induce increased vulnerability in cells carrying the LRRK2 G2019S mutation
PD is best known for its neuronal degeneration in the midbrain and in other vulnerable brain regions. However, new evidence clearly suggests that the disease processes also occur outside the central nervous system (8–10). Such PD disease mechanisms are linked to the same genetic, aging and pathological interactions with the immune system as seen in the brain [(11), reviewed in (12)]. Mitochondrial dysfunction is linked to PD pathogenesis (35,36) and LRRK2 has been proposed to participate in mitochondrial dynamics (1,72,73). Our previous work has shown that human iPSC-derived neurons are ~10 times more vulnerable to valinomycin, a mitochondrial stressor, compared to human fibroblasts (20,28). Cooper et al. (20) previously demonstrated that human PD patient iPSC-derived neurons and PD patient fibroblasts carrying the LRRK2 G2019S mutation exhibited increased cell death relative to control subjects upon treatment with concanamycin A, a direct autophagy inhibitor that blocks the vacuolar H+-ATPases. Decreased mitophagy rate can contribute to the accumulation of damaged mitochondria in the cell, inhibiting the efficiency of electron transport chain and lowering the metabolic output, thereby increasing the accumulation of free radical formation (20,28) and increasing the number of mitochondria with mitochondrial DNA lesions (24). All of these factors can, in a cumulative manner, lead to increased cellular vulnerability to external stressors, as observed upon mitochondrial membrane depolarization and inhibition of autophagy (20).
PD patient-based cellular phenotypes and assays as cell biological signatures and discovery platforms
Clinical symptoms of PD manifest much later than the onset of neuronal degeneration, which limits the effectiveness of potential neuroprotective therapies due to the low number of remaining neurons (74). For neurodegenerative diseases, it is useful to identify accessible novel peripheral cell biological signatures or cellular biomarkers and develop assays to identify risk groups and evaluate potential treatments for early intervention. Although PD is primarily defined by neurological signs and symptoms, at a cellular level, disease-associated mutations and molecular phenotypes are present in most cell types of the human body (9,75–78). However, relative vulnerability of some types of cells over others to the disease-causing mechanisms account for the specific loss of dopamine neurons in the substantia nigra (20,79–82). For assessing disease progression and for the identification of successful therapeutic interventions, in vitro modeling of the specific cellular problem characteristic of the disease is of essence. In recent years, through advances in iPSC-technology, neuronal PD patient-based phenotypic modeling has been successful in identifying novel cellular mechanisms affected by PD [reviewed in (83)] and contributed to the rapid advancement of potential pharmacological treatments. However, this technology is resource and labor intensive and is not appropriate for large-scale diagnostic assays. Because of this limitation, the use of peripheral, readily available non-neuronal cells presents an advantage as a better in vitro disease modeling platform. The use of these primary cell samples and liquid biopsies such as exosomes can also help in defining novel pathobiological mechanisms involved in PD and for the stratification of sporadic patients into groups based on underlying common molecular mechanisms. Being able to define the predominant cellular mechanism involved in a specific group of sporadic patients, as observed during our study of mitochondrial deficits in human fibroblasts (28), is of interest for the development of novel targeted personalized treatment strategies. Human fibroblasts, blood PBMCs, iPSC-derived neurons or immune cells isolated from PD patients can be utilized for this purpose as a discovery platform for the identification of preclinical cellular biological signatures specific to the disease phenotype.
Several efforts to define biomarkers have been on-going [reviewed in (84), reviewer in (85–90)] and include the Parkinson’s Progression Marker Initiative, which is an international, multicenter study aimed at collecting comprehensive data including biological samples, imaging and clinical information from its cohort of ~400 patients and 200 HS controls (91). Utilizing this data, Nalls et al. (92) were able to develop a diagnostic algorithm based on a combination of genetic risk factors and non-motor symptoms to differentiate people with PD from HSs. Nevertheless, despite new efforts in this field, there is a very large need for refined cellular biomarkers and phenotypic data that link to PD mechanisms and genetics. A recent study identified significant decrease in LC3B levels in the CSF of early stage PD patients compared to controls, correlated with clinical and [18F] N-(3-fluoropropyl)-2β-carbon ethoxy-3β-(4-iodophenyl) nortropane positron emission tomography (PET) data, suggestive of a potential phenotypic prognostic and diagnostic biomarker for the disease (64). Such use of cellular biological signatures, or disease-specific phenotypic biomarker, has recently been implemented in an Amyotrophic lateral sclerosis (ALS) clinical trial phase 2, where ALS-specific hyperexcitability of the iPSC-derived neurons was used as a biomarker in ALS patients (by measuring upper and lower motor neuron excitability) and the effect of Ezogabine on this readout (93). Likewise, our observation of reduced rate of mitophagy in human fibroblasts carrying the LRRK2 G2019S mutation could serve as a phenotypic biomarker for diagnostic assays and stratification of patients for personalized therapy. Such biomarkers may come from use of non-neuronal cells, liquid biopsies, advanced imaging technology and advanced biological algorithms (91,92). In the current study, the LRRK2 G2019S mutation fibroblasts exhibited a decreased mitophagy rate, a phenotype that was reversed by pharmacological or ASO treatments. In a broader context, this work speaks to the future use of peripheral cells for disease identification and development of novel treatments.
Materials and Methods
Fibroblast lines
HS and PD patient-derived fibroblast cell lines with LRRK2 G2019S mutation were obtained from the Coriell and the NIA Aging Cell biorepositories or the Mayo clinic (Table 1). Some of the HS and the PD cell lines were described previously (20,28). The age average of the control and the mutant fibroblasts has been matched and is 65 and 62 years, respectively.
Table 1.
Detailed clinical information of the HS and PD patient-derived fibroblasts used in the current study
| Cell ID | Description | Sex | Age at biopsy |
|---|---|---|---|
| HS10 | Healthy subject | F | 68 |
| HS11 | Healthy subject | F | 60 |
| HS17 | Healthy subject | F | 62 |
| HS18 | Healthy subject | F | 65 |
| HS20 | Healthy subject | M | 66 |
| HS21 | Healthy subject | M | 66 |
| HS22 | Healthy subject | F | 61 |
| HS23 | Healthy subject | F | 76 |
| HS24 | Healthy subject | M | 67 |
| HS25 | Healthy subject | M | 61 |
| HS26 | Healthy subject | M | 66 |
| HS29 | Healthy subject | M | 66 |
| HS30 | Healthy subject | M | 67 |
| PD4 | LRRK2 G2019S | Not documented | Not documented |
| PD12 | LRRK2 G2019S | M | 72 |
| PD13 | LRRK2 G2019S | M | 57 |
| PD16 | LRRK2 G2019S | M | 52 |
| PD20 | LRRK2 G2019S | M | 73 |
| PD23 | LRRK2 G2019S | Not documented | Not documented |
| PD28 | LRRK2 G2019S homo. | M | 77 |
| PD29 | LRRK2 G2019S | M | 36 |
| PD36 | LRRK2 G2019S homo. | M | 55 |
| PD37 | LRRK2 G2019S homo. | M | 74 |
Cell culture
HS and PD patient-derived fibroblast lines were cultured in DMEM (Gibco) supplemented with 10% FBS (Hyclone), 1% penicillin-streptomycin (Gibco #10378-016), 0.5% glutamine (Gibco) and 1% non-essential amino acids (Gibco). Cells were kept in an incubator at 37°C and 5% CO2. Cultures were maintained in 15 cm petri dishes and passaged approximately twice a week or when 90% confluent. For passaging, cells were washed with phosphate buffered saline (PBS) prior to dissociation with 0.05% Trypsin (Gibco) followed by seeding to a final density of 40–50%. Cell lines were not kept in culture beyond 20 passages.
Pharmacological compounds
Valinomycin (Sigma-Aldrich #v0627), bafilomycin A1 (Sigma-Aldrich B1793) and LRRK2 kinase inhibitors IN-1 (Tocris #4253) and Mli-2 (Tocris #5756) were all dissolved in DMSO before being diluted to assay concentrations in culture maintenance medium. For vehicle treated controls, DMSO was added to cells at a concentration equivalent to the DMSO amount present in cultures that were treated with the respective compounds.
Live cell imaging of mitophagy rate in human fibroblasts
Mitophagy rate was measured with a bioprobe comprising human ATP3 (mitochondrial membrane ATP synthase protein) mitochondrial target sequence, coupled to a Rosella fusion construct encoding DsRed (pH-insensitive RFP variant) fused with pHluorin (pH-sensitive GFP variant) (39,40), generously gifted to us by Dr Devenish and previously used in HeLa cells (37). Upon entering the mitophagy pathway, pH changes from high in mitochondria to the more acidic lysosomal pH, leading to quenching of the green fluorescence of the bioprobe while leaving the red fluorescence unaffected. Hence, active mitophagy will decrease the green signal and the resultant green/red ratio (Fig. 1). The original Rosella signaling sequence was cloned into a CMV promoter containing CD510B1 lentivirus backbone (without EF1-Puro) and used to produce lentivirus. The 5000 cells/well were seeded into a 96-well plate and transduced the following day with the Rosella lentivirus at MOI 75. Fibroblasts were cultured for 5 days to allow for high Rosella fluorescence expression before media change or 10 μM valinomycin treatment followed by immediate initiation of live cell imaging (0.5 h) of the green and red fluorescence signals. Live cell imaging was performed at 3 h intervals for 45 h (Incucyte ZOOM, Essen Bioscience). Green and red fluorescence intensities were quantified using the ZOOM Essen software and normalized to both the phase cell confluence measurements and the total fluorescence intensity of each cell line to correct for cell density and the infection rate, respectively. This was followed by calculation of the green/red ratio as a measure of mitophagy. Time point of 21 h post initiation of live cell imaging was selected for final analysis. See Supplementary Material, Figure S1 for exemplar live cell images and the processing definition used for quantification and analysis. Independent experiments were performed with the addition of LRRK2 inhibitors IN-1 (30 μM) and Mli-2 (10 nm) 1 h or 24 h prior to live cell imaging initiation, respectively. For the ASO experiments, fibroblasts were first seeded into a 12-well plate at 60 000 cells per well and were infected 4 h later with the Rosella lentivirus at MOI 75. After 48 h, cells were re-plated into a 96-well plate at 2000 cells per well and transfected with ASOs as described below.
Live cell imaging of mitophagy rate in 293T cells
Mitophagy rate was measured in 293T HEK cells with the Rosella bioprobe described above. Briefly, 100 000 cells/well were seeded into a 24-well plate and transfected the following day with the Rosella lentivirus plasmid using Lipofectamine 3000 (ThermoFisher, #L3000015) according to the manufacturers protocol. Cells were cultured for 3 days before they were treated with 1 μM rotenone (Sigma-Aldrich), 20 nm rapamycin (Sigma-Aldrich), 1 mm DFP (Sigma-Aldrich) or vehicle (DMSO) just before the start of live cell imaging. Live cell imaging was performed at 3 h intervals for a total duration of 36 h (Incucyte ZOOM, Essen Bioscience). Green and red fluorescence intensities were quantified using the ZOOM Essen software and the green/red ratio was calculated as described previously (see Supplementary Material, Fig. S1 for images).
Immunocytochemistry
Twenty-four hours after 1 μM rotenone or 10 μm valinomycin treatment, Rosella transfected 293T HEK cells or Rosella-transduced human fibroblasts were fixed with 4% paraformaldehyde, washed three times with PBS and placed in blocking solution containing 0.1% PBS-Triton X-100 (PBS-T, Sigma) and 10% normal donkey serum (Jackson ImmunoResearch Laboratories, 017-000-121) for 1 h at room temperature (RT). The cells were then incubated in Tom20 antibody (1:50, Santa Cruz, SC F-10) in blocking solution at 4°C overnight (O/N). The following day, cells were washed in 0.1% PBS-T and incubated with Alexa Fluor-694 goat-anti-mouse (1:400, A-11011, Life Technologies) for 2 h at RT. Secondary staining was followed by incubation with nuclear dye Hoechst for 10 min at RT. Coverslips containing the cells were mounted in Mowiol and cells were imaged as a Z-stack at 100× magnification using the Zeiss LSM 510 Meta confocal microscope.
LRRK2-specific antisense oligomer treatment
To demonstrate the specific LRRK2-G2019S mutation effect on our cellular phenotypes, ASOs that base pair to the 5′ splice site of either LRRK2 exon 2 (ex2 ASO: 5′-AGTGAAAACAATGCCTTTACCTGCT-3′) or exon 41 (ex41 ASO: 5′-AGACAGACCTGATCACCTACCTGGT-3′) were developed to induce skipping of the targeted exon. All ASOs were phosphorodiamidate morpholino oligomers (Gene Tools, LLC). As a negative control, a non-target standard control oligonucleotide (Ctrl ASO) sequence was used: 5′-CCTCTTACCTCAGTTACAATTTATA-3′ (GeneTools, LLC). One day post plating into a 96-well format, the fibroblast cells were transfected with 1 μM of ASOs using Endo-Porter reagent according to manufacturer’s protocol (Gene Tools, LLC).
RNA isolation and LRRK2 exon-skipping analysis
Exon-skipping analysis was performed as described in Hinrich et al. (94). RNA was isolated from cells 45 h after the initiation of mitophagy experiment using TRIzol reagent (Life Technologies, Carlsbad, CA, 155960) according to manufacturer’s protocol. The 0.25–1 μg of RNA was reverse transcribed using GoScript reverse transcriptase (Promega, Madison, WI, A5003). The 1–2 μl of the resultant complementary deoxyribonucleic acid (cDNA) was used in PCR reactions with GoTaq Green (Promega), 0.1–0.25 μl of α-32P-dCTP and primers specific for human LRRK2: hLRRK2ex40F (CCTACAGCACAGGATTGC), hLRRK2ex42R (CCTCTACTATTCTACCTCC), hLRRK2ex1F (5′-GTTCACGTACTCCGAGCG-3′), hLRRK2ex6R (5′-CAGTCAGTTGCTCCTCTGAG-3′). Products were separated on a 6% nondenaturing polyacrylamide gel and quantified using a Typhoon 9400 phosphorimager (GE Healthcare).
Immunoblotting and protein expression quantification
Cells were washed once in cold PBS before being lysed with RIPA buffer (Thermo Scientific) supplemented with Halt protease and phosphatase inhibitor cocktail (Thermo Fisher Scientific #1861284) and EDTA (Thermo Fisher Scientific #1861283). Cell lysates were collected and sonicated in a sonicator before centrifugation. Protein concentration of the supernatant was measured with a BCA Assay (Pierce). The 30 μg of protein was loaded into Criterion precast 4–20% gradient polyacrylamide gels (Bio-Rad) and size separated using a Bio-Rad electrophoresis system. Proteins were transferred to a PVDF membrane using Trans-Blot Turbo system (Bio-Rad) at 21 V and 2.5 amps for 7 min or at 25 V and 1.3 amps for 15 min for LRRK2 detection, prior to blocking for 1 h with 5% protein blocker (Bio-Rad) in Tris-buffered saline with 0.1 % Tween 20 (TBST). Membranes were then incubated overnight at 4°C with primary antibody: anti-Tom20 (Santa Cruz, #sc11415), anti-LC3A (Cell Signaling, mAb#4599), anti-LC3B (Cell Signaling, mAb#3868), anti-Atg12 (Cell Signaling, mAb#2010), anti LRRK2 [(100–500) UDD3, MRC, University of Dundee, Monoclonal Rabbit 30-12], anti phosphoRAB10 (Abcam, ab230261), anti RAB10 (Cell signaling, #8127) and anti-GAPDH (EMD Millipore, #AB2302). After washing 3 × 10 min with TBST, the membranes were incubated with HRP-coupled secondary antibody for 1 h at RT. Following another 3 × 10 min wash with TBST, the membranes were developed using Advansta WesternBright Sirius chemifluorescent substrate (Advansta, K-12043-D20) and imaged using Chemidoc XRS with Image Lab software. Optical density analysis for assessment of protein expression was performed with Image Lab software (Bio-Rad) and normalized to GAPDH.
Quantification and statistics
Statistical data analysis was performed in GraphPad Prism software V7.0c. All data are expressed as mean +/− SEM. Data was analyzed for normal distribution using Shapiro–Wilk test. Differences between groups at different time points were analyzed using two-way ANOVA, followed by post hoc testing to compare between more than two means. One-way ANOVA was used to determine an overall effect on means followed by post hoc testing to compare between more than two means. An unpaired two-tailed Student’s t-test or ratio paired t-test was used to compare two means as appropriate. When data proved to be not normally distributed, statistical analysis was performed using Mann–Whitney test. For each experiment, the specific statistical analysis used is noted in the figure legend. P-value < 0.05 was considered significant for all analyses.
Material and Correspondence
All of the correspondence and material requests should be directed to both Dr Joanna A. Korecka (jkorecka@mclean.harvard.edu) and Dr Ole Isacson (ole_isacson@hms.harvard.edu).
Supplementary Material
Acknowledgements
We would like to thank Dr Rodney Devenish at Monash University, Melbourne, Australia for generously sharing with us the human specific Rosella biosensor plasmid.
Conflict of Interest statement. The authors declare no competing interests.
Funding
The Michael J. Fox Foundation and National Institute of Health [grants 1RC2NS070276 and 1U24NS078338-01 awarded to the NINDS PDiPS Cell Research Consortium]; the Consolidated Anti-Aging Foundation; the Orchard Foundation; Independent Research Fund Denmark [4092-00325B, post-doctoral fellowship salary support for D.P.C.]. Funds from Harold, Ronna and Margo Cooper Family and the Poul Hansen Family are also gratefully acknowledged.
Author contributions
J.A.K., R.T., D.P.C., M.L.H., P.J.H. and O.I. contributed to the study design.
J.A.K., R.T., D.P.C., A.J.H., E.J.F. and S.L. contributed to the experimental execution.
J.A.K., R.T., D.P.C., A.J.H., S.L., M.L.H., P.J.H. and O.I. contributed to the data analysis and data review.
J.A.K., R.T., D.P.C., P.J.H. and O.I. contributed to the manuscript generation.
References
- 1. Lesage S. and Brice A. (2009) Parkinson’s disease: from monogenic forms to genetic susceptibility factors. Hum. Mol. Genet., 18, R48–R59. [DOI] [PubMed] [Google Scholar]
- 2. Toulouse A. and Sullivan A.M. (2008) Progress in Parkinson’s disease—where do we stand? Prog. Neurobiol., 85, 376–392. [DOI] [PubMed] [Google Scholar]
- 3. Bonifati V. (2007) Genetics of parkinsonism. Parkinsonism Relat. Disord., 13(suppl. 3), S233–S241. [DOI] [PubMed] [Google Scholar]
- 4. Trinh J. and Farrer M. (2013) Advances in the genetics of Parkinson disease. Nat. Rev. Neurol., 9, 445–454. [DOI] [PubMed] [Google Scholar]
- 5. Driver J.A., Logroscino G., Gaziano J.M. and Kurth T. (2009) Incidence and remaining lifetime risk of Parkinson disease in advanced age. Neurology, 72, 432–438. [DOI] [PMC free article] [PubMed] [Google Scholar]
- 6. Rocha E.M., Smith G.A., Park E., Cao H., Brown E., Hallett P. and Isacson O. (2015) Progressive decline of glucocerebrosidase in aging and Parkinson’s disease. Ann. Clin. Transl. Neurol., 2, 433–438. [DOI] [PMC free article] [PubMed] [Google Scholar]
- 7. Reeve A., Simcox E. and Turnbull D. (2014) Ageing and Parkinson’s disease: why is advancing age the biggest risk factor? Ageing Res. Rev., 14, 19–30. [DOI] [PMC free article] [PubMed] [Google Scholar]
- 8. Djaldetti R., Lev N. and Melamed E. (2009) Lesions outside the CNS in Parkinson’s disease. Mov. Disord., 24, 793–800. [DOI] [PubMed] [Google Scholar]
- 9. Hallett P.J., McLean J.R., Kartunen A., Langston J.W. and Isacson O. (2012) Alpha-synuclein overexpressing transgenic mice show internal organ pathology and autonomic deficits. Neurobiol. Dis., 47, 258–267. [DOI] [PMC free article] [PubMed] [Google Scholar]
- 10. Kalia L.V. and Lang A.E. (2015) Parkinson’s disease. Lancet, 386, 896–912. [DOI] [PubMed] [Google Scholar]
- 11. Kannarkat G.T., Boss J.M. and Tansey M.G. (2013) The role of innate and adaptive immunity in Parkinson’s disease. J. Parkinsons Dis., 3, 493–514. [DOI] [PMC free article] [PubMed] [Google Scholar]
- 12. Deleidi M. and Gasser T. (2013) The role of inflammation in sporadic and familial Parkinson’s disease. Cell. Mol. Life Sci., 70, 4259–4273. [DOI] [PMC free article] [PubMed] [Google Scholar]
- 13. Wray S., Self M., Consortium, N.P.s.D.i, Consortium, N.H.s.D.i, Consortium, N.A.i, Lewis P.A., Taanman J.W., Ryan N.S., Mahoney C.J., Liang Y. et al. (2012) Creation of an open-access, mutation-defined fibroblast resource for neurological disease research. PLoS One, 7, e43099. [DOI] [PMC free article] [PubMed] [Google Scholar]
- 14. Teves J.M.Y., Bhargava V., Kirwan K.R., Corenblum M.J., Justiniano R., Wondrak G.T., Anandhan A., Flores A.J., Schipper D.A., Khalpey Z. et al. (2017) Parkinson’s disease skin fibroblasts display signature alterations in growth, redox homeostasis, mitochondrial function, and autophagy. Front. Neurosci., 11, 737. [DOI] [PMC free article] [PubMed] [Google Scholar]
- 15. Verma M., Callio J., Otero P.A., Sekler I., Wills Z.P. and Chu C.T. (2017) Mitochondrial calcium dysregulation contributes to dendrite degeneration mediated by PD/LBD-associated LRRK2 mutants. J. Neurosci., 37, 11151–11165. [DOI] [PMC free article] [PubMed] [Google Scholar]
- 16. Wang W., Ma X., Zhou L., Liu J. and Zhu X. (2017) A conserved retromer sorting motif is essential for mitochondrial DLP1 recycling by VPS35 in Parkinson’s disease model. Hum. Mol. Genet., 26, 781–789. [DOI] [PMC free article] [PubMed] [Google Scholar]
- 17. Magalhaes J., Gegg M.E., Migdalska-Richards A., Doherty M.K., Whitfield P.D. and Schapira A.H. (2016) Autophagic lysosome reformation dysfunction in glucocerebrosidase deficient cells: relevance to Parkinson disease. Hum. Mol. Genet., 25, 3432–3445. [DOI] [PMC free article] [PubMed] [Google Scholar]
- 18. Kilpatrick B.S., Magalhaes J., Beavan M.S., McNeill A., Gegg M.E., Cleeter M.W., Bloor-Young D., Churchill G.C., Duchen M.R., Schapira A.H. et al. (2016) Endoplasmic reticulum and lysosomal Ca(2)(+) stores are remodelled in GBA1-linked Parkinson disease patient fibroblasts. Cell Calcium, 59, 12–20. [DOI] [PMC free article] [PubMed] [Google Scholar]
- 19. Mastroberardino P.G., Ambrosi G., Blandini F., Milanese C. and Sepe S. (2014) Fibroblasts from skin biopsies as a tool for biomarker discovery in Parkinsons disease. Free Radic. Biol. Med., 75(suppl. 1), S10. [DOI] [PubMed] [Google Scholar]
- 20. Cooper O., Seo H., Andrabi S., Guardia-Laguarta C., Graziotto J., Sundberg M., McLean J.R., Carrillo-Reid L., Xie Z., Osborn T. et al. (2012) Pharmacological rescue of mitochondrial deficits in iPSC-derived neural cells from patients with familial Parkinson’s disease. Sci. Transl. Med., 4, 141ra190. [DOI] [PMC free article] [PubMed] [Google Scholar]
- 21. Hsieh C.H., Shaltouki A., Gonzalez A.E., Bettencourt da Cruz A., Burbulla L.F., St Lawrence E., Schule B., Krainc D., Palmer T.D. and Wang X. (2016) Functional impairment in Miro degradation and mitophagy is a shared feature in familial and sporadic Parkinson’s disease. Cell Stem Cell, 19, 709–724. [DOI] [PMC free article] [PubMed] [Google Scholar]
- 22. Engelender S. and Isacson O. (2017) The threshold theory for Parkinson’s disease. Trends Neurosci., 40, 4–14. [DOI] [PubMed] [Google Scholar]
- 23. Hyde B.B., Twig G. and Shirihai O.S. (2010) Organellar vs cellular control of mitochondrial dynamics. Semin. Cell Dev. Biol., 21, 575–581. [DOI] [PMC free article] [PubMed] [Google Scholar]
- 24. Sanders L.H., Laganiere J., Cooper O., Mak S.K., Vu B.J., Huang Y.A., Paschon D.E., Vangipuram M., Sundararajan R., Urnov F.D. et al. (2014) LRRK2 mutations cause mitochondrial DNA damage in iPSC-derived neural cells from Parkinson’s disease patients: reversal by gene correction. Neurobiol. Dis., 62, 381–386. [DOI] [PMC free article] [PubMed] [Google Scholar]
- 25. Grunewald A., Arns B., Meier B., Brockmann K., Tadic V. and Klein C. (2014) Does uncoupling protein 2 expression qualify as marker of disease status in LRRK2-associated Parkinson’s disease? Antioxid. Redox Signal., 20, 1955–1960. [DOI] [PMC free article] [PubMed] [Google Scholar]
- 26. Papkovskaia T.D., Chau K.Y., Inesta-Vaquera F., Papkovsky D.B., Healy D.G., Nishio K., Staddon J., Duchen M.R., Hardy J., Schapira A.H. et al. (2012) G2019S leucine-rich repeat kinase 2 causes uncoupling protein-mediated mitochondrial depolarization. Hum. Mol. Genet., 21, 4201–4213. [DOI] [PMC free article] [PubMed] [Google Scholar]
- 27. Su Y.C. and Qi X. (2013) Inhibition of excessive mitochondrial fission reduced aberrant autophagy and neuronal damage caused by LRRK2 G2019S mutation. Hum. Mol. Genet., 22, 4545–4561. [DOI] [PubMed] [Google Scholar]
- 28. Smith G.A., Jansson J., Rocha E.M.. et al. (2016) Mol. Neurobiol., 53, 5161. doi: 10.1007/s12035-015-9435-4. [DOI] [PMC free article] [PubMed] [Google Scholar]
- 29. Simon-Sanchez J., Schulte C., Bras J.M., Sharma M., Gibbs J.R., Berg D., Paisan-Ruiz C., Lichtner P., Scholz S.W., Hernandez D.G. et al. (2009) Genome-wide association study reveals genetic risk underlying Parkinson’s disease. Nat. Genet., 41, 1308–1312. [DOI] [PMC free article] [PubMed] [Google Scholar]
- 30. Di Maio R., Hoffman E.K., Rocha E.M., Keeney M.T., Sanders L.H., De Miranda B.R., Zharikov A., Van Laar A., Stepan A.F., Lanz T.A. et al. (2018) LRRK2 activation in idiopathic Parkinson’s disease. Sci. Transl. Med., 10, eaar5429. doi: 10.1126/scitranslmed.aar5429. [DOI] [PMC free article] [PubMed] [Google Scholar]
- 31. Ramonet D., Daher J.P., Lin B.M., Stafa K., Kim J., Banerjee R., Westerlund M., Pletnikova O., Glauser L., Yang L. et al. (2011) Dopaminergic neuronal loss, reduced neurite complexity and autophagic abnormalities in transgenic mice expressing G2019S mutant LRRK2. PLoS One, 6, e18568. [DOI] [PMC free article] [PubMed] [Google Scholar]
- 32. Bonello F., Hassoun S.M., Mouton-Liger F., Shin Y.S., Muscat A., Tesson C., Lesage S., Beart P.M., Brice A., Krupp J. et al. (2019) LRRK2 impairs PINK1/Parkin-dependent mitophagy via its kinase activity: pathologic insights into Parkinson’s disease. Hum. Mol. Genet., 28, 1645–1660. doi: 10.1093/hmg/ddz004. [DOI] [PubMed] [Google Scholar]
- 33. Cherra S.J. 3rd, Steer E., Gusdon A.M., Kiselyov K. and Chu C.T. (2013) Mutant LRRK2 elicits calcium imbalance and depletion of dendritic mitochondria in neurons. Am. J. Pathol., 182, 474–484. [DOI] [PMC free article] [PubMed] [Google Scholar]
- 34. Brunk U.T. and Terman A. (2002) The mitochondrial–lysosomal axis theory of aging: accumulation of damaged mitochondria as a result of imperfect autophagocytosis. Eur. J. Biochem., 269, 1996–2002. [DOI] [PubMed] [Google Scholar]
- 35. Hu Q. and Wang G. (2016) Mitochondrial dysfunction in Parkinson’s disease. Transl. Neurodegener., 5, 14. [DOI] [PMC free article] [PubMed] [Google Scholar]
- 36. Moon H.E. and Paek S.H. (2015) Mitochondrial dysfunction in Parkinson’s disease. Exp. Neurobiol., 24, 103–116. [DOI] [PMC free article] [PubMed] [Google Scholar]
- 37. Sargsyan A., Cai J., Fandino L.B., Labasky M.E., Forostyan T., Colosimo L.K., Thompson S.J. and Graham T.E. (2015) Rapid parallel measurements of macroautophagy and mitophagy in mammalian cells using a single fluorescent biosensor. Sci. Rep., 5, 12397. [DOI] [PMC free article] [PubMed] [Google Scholar]
- 38. Mehanna R., Moore S., Hou J.G., Sarwar A.I. and Lai E.C. (2014) Comparing clinical features of young onset, middle onset and late onset Parkinson’s disease. Parkinsonism Relat. Disord., 20, 530–534. [DOI] [PubMed] [Google Scholar]
- 39. Mijaljica D., Prescott M. and Devenish R.J. (2011) A fluorescence microscopy assay for monitoring mitophagy in the yeast Saccharomyces cerevisiae. J. Vis. Exp., 18, 2779. doi: 10.3791/2779. [DOI] [PMC free article] [PubMed] [Google Scholar]
- 40. Rosado C.J., Mijaljica D., Hatzinisiriou I., Prescott M. and Devenish R.J. (2008) Rosella: a fluorescent pH-biosensor for reporting vacuolar turnover of cytosol and organelles in yeast. Autophagy, 4, 205–213. [DOI] [PubMed] [Google Scholar]
- 41. West A.B., Moore D.J., Biskup S., Bugayenko A., Smith W.W., Ross C.A., Dawson V.L. and Dawson T.M. (2005) Parkinson’s disease-associated mutations in leucine-rich repeat kinase 2 augment kinase activity. Proc. Natl. Acad. Sci. U. S. A., 102, 16842–16847. [DOI] [PMC free article] [PubMed] [Google Scholar]
- 42. Deng X., Dzamko N., Prescott A., Davies P., Liu Q., Yang Q., Lee J.D., Patricelli M.P., Nomanbhoy T.K., Alessi D.R. et al. (2011) Characterization of a selective inhibitor of the Parkinson’s disease kinase LRRK2. Nat. Chem. Biol., 7, 203–205. [DOI] [PMC free article] [PubMed] [Google Scholar]
- 43. Fell M.J., Mirescu C., Basu K., Cheewatrakoolpong B., DeMong D.E., Ellis J.M., Hyde L.A., Lin Y., Markgraf C.G., Mei H. et al. (2015) MLi-2, a potent, selective, and centrally active compound for exploring the therapeutic potential and safety of LRRK2 kinase inhibition. J. Pharmacol. Exp. Ther., 355, 397–409. [DOI] [PubMed] [Google Scholar]
- 44. Scott J.S., Degorce S.L., Anjum R., Culshaw J., Davies R.D.M., Davies N.L., Dillman K.S., Dowling J.E., Drew L., Ferguson A.D. et al. (2017) Discovery and optimization of pyrrolopyrimidine inhibitors of interleukin-1 receptor associated kinase 4 (IRAK4) for the treatment of mutant MYD88(L265P) diffuse large B-cell lymphoma. J. Med. Chem., 60, 10071–10091. [DOI] [PubMed] [Google Scholar]
- 45. Luerman G.C., Nguyen C., Samaroo H., Loos P., Xi H., Hurtado-Lorenzo A., Needle E., Stephen Noell G., Galatsis P., Dunlop J. et al. (2014) Phosphoproteomic evaluation of pharmacological inhibition of leucine-rich repeat kinase 2 reveals significant off-target effects of LRRK-2-IN-1. J. Neurochem., 128, 561–576. [DOI] [PubMed] [Google Scholar]
- 46. Steger M., Diez F., Dhekne H.S., Lis P., Nirujogi R.S., Karayel O., Tonelli F., Martinez T.N., Lorentzen E., Pfeffer S.R. et al. (2017) Systematic proteomic analysis of LRRK2-mediated Rab GTPase phosphorylation establishes a connection to ciliogenesis. Elife, 6, e31012. doi: 10.7554/eLife.31012. [DOI] [PMC free article] [PubMed] [Google Scholar]
- 47. Steger M., Tonelli F., Ito G., Davies P., Trost M., Vetter M., Wachter S., Lorentzen E., Duddy G., Wilson S. et al. (2016) Phosphoproteomics reveals that Parkinson’s disease kinase LRRK2 regulates a subset of Rab GTPases. Elife, 5, e12813. doi: 10.7554/eLife.12813. [DOI] [PMC free article] [PubMed] [Google Scholar]
- 48. Hinkle K.M., Yue M., Behrouz B., Dachsel J.C., Lincoln S.J., Bowles E.E., Beevers J.E., Dugger B., Winner B., Prots I. et al. (2012) LRRK2 knockout mice have an intact dopaminergic system but display alterations in exploratory and motor co-ordination behaviors. Mol. Neurodegener., 7, 25. [DOI] [PMC free article] [PubMed] [Google Scholar]
- 49. Lin X., Parisiadou L., Gu X.L., Wang L., Shim H., Sun L., Xie C., Long C.X., Yang W.J., Ding J. et al. (2009) Leucine-rich repeat kinase 2 regulates the progression of neuropathology induced by Parkinson’s-disease-related mutant alpha-synuclein. Neuron, 64, 807–827. [DOI] [PMC free article] [PubMed] [Google Scholar]
- 50. Zhao Y.G. and Zhang H. (2019) Autophagosome maturation: an epic journey from the ER to lysosomes. J. Cell Biol., 218, 757–770. [DOI] [PMC free article] [PubMed] [Google Scholar]
- 51. Nakamura S. and Yoshimori T. (2017) New insights into autophagosome-lysosome fusion. J. Cell Sci., 130, 1209–1216. [DOI] [PubMed] [Google Scholar]
- 52. Tanida I. (2011) Autophagy basics. Microbiol. Immunol., 55, 1–11. [DOI] [PubMed] [Google Scholar]
- 53. Mauvezin C. and Neufeld T.P. (2015) Bafilomycin A1 disrupts autophagic flux by inhibiting both V-ATPase-dependent acidification and Ca-P60A/SERCA-dependent autophagosome-lysosome fusion. Autophagy, 11, 1437–1438. [DOI] [PMC free article] [PubMed] [Google Scholar]
- 54. Karim M.R., Kanazawa T., Daigaku Y., Fujimura S., Miotto G. and Kadowaki M. (2007) Cytosolic LC3 ratio as a sensitive index of macroautophagy in isolated rat hepatocytes and H4-II-E cells. Autophagy, 3, 553–560. [DOI] [PubMed] [Google Scholar]
- 55. Klionsky D.J., Abdalla F.C., Abeliovich H., Abraham R.T., Acevedo-Arozena A., Adeli K., Agholme L., Agnello M., Agostinis P., Aguirre-Ghiso J.A. et al. (2012) Guidelines for the use and interpretation of assays for monitoring autophagy. Autophagy, 8, 445–544. [DOI] [PMC free article] [PubMed] [Google Scholar]
- 56. Contino S., Porporato P.E., Bird M., Marinangeli C., Opsomer R., Sonveaux P., Bontemps F., Dewachter I., Octave J.N., Bertrand L. et al. (2017) Presenilin 2-dependent maintenance of mitochondrial oxidative capacity and morphology. Front. Physiol., 8, 796. [DOI] [PMC free article] [PubMed] [Google Scholar]
- 57. Whitaker-Menezes D., Martinez-Outschoorn U.E., Flomenberg N., Birbe R.C., Witkiewicz A.K., Howell A., Pavlides S., Tsirigos A., Ertel A., Pestell R.G. et al. (2011) Hyperactivation of oxidative mitochondrial metabolism in epithelial cancer cells in situ: visualizing the therapeutic effects of metformin in tumor tissue. Cell Cycle, 10, 4047–4064. [DOI] [PMC free article] [PubMed] [Google Scholar]
- 58. Wong Y.C. and Holzbaur E.L. (2014) Optineurin is an autophagy receptor for damaged mitochondria in parkin-mediated mitophagy that is disrupted by an ALS-linked mutation. Proc. Natl. Acad. Sci. USA., 111, E4439–E4448. [DOI] [PMC free article] [PubMed] [Google Scholar]
- 59. Lazarou M., Sliter D.A., Kane L.A., Sarraf S.A., Wang C., Burman J.L., Sideris D.P., Fogel A.I. and Youle R.J. (2015) The ubiquitin kinase PINK1 recruits autophagy receptors to induce mitophagy. Nature, 524, 309–314. [DOI] [PMC free article] [PubMed] [Google Scholar]
- 60. Harper J.W., Ordureau A. and Heo J.M. (2018) Building and decoding ubiquitin chains for mitophagy. Nat. Rev. Mol. Cell Biol., 19, 93–108. [DOI] [PubMed] [Google Scholar]
- 61. Gan-Or Z., Dion P.A. and Rouleau G.A. (2015) Genetic perspective on the role of the autophagy-lysosome pathway in Parkinson disease. Autophagy, 11, 1443–1457. [DOI] [PMC free article] [PubMed] [Google Scholar]
- 62. Zhang H., Duan C. and Yang H. (2015) Defective autophagy in Parkinson’s disease: lessons from genetics. Mol. Neurobiol., 51, 89–104. [DOI] [PubMed] [Google Scholar]
- 63. Saha S., Ash P.E., Gowda V., Liu L., Shirihai O. and Wolozin B. (2015) Mutations in LRRK2 potentiate age-related impairment of autophagic flux. Mol. Neurodegener., 10, 26. [DOI] [PMC free article] [PubMed] [Google Scholar]
- 64. Youn J., Lee S.B., Lee H.S., Yang H.O., Park J., Kim J.S., Oh E., Park S. and Jang W. (2018) Cerebrospinal fluid levels of autophagy-related proteins represent potentially novel biomarkers of early-stage Parkinson’s disease. Sci. Rep., 8, 16866. [DOI] [PMC free article] [PubMed] [Google Scholar]
- 65. Ao X., Zou L. and Wu Y. (2014) Regulation of autophagy by the Rab GTPase network. Cell Death Differ., 21, 348–358. [DOI] [PMC free article] [PubMed] [Google Scholar]
- 66. Roosen D.A. and Cookson M.R. (2016) LRRK2 at the interface of autophagosomes, endosomes and lysosomes. Mol. Neurodegener., 11, 73. [DOI] [PMC free article] [PubMed] [Google Scholar]
- 67. Jager S., Bucci C., Tanida I., Ueno T., Kominami E., Saftig P. and Eskelinen E.L. (2004) Role for Rab7 in maturation of late autophagic vacuoles. J. Cell Sci., 117, 4837–4848. [DOI] [PubMed] [Google Scholar]
- 68. Hyttinen J.M., Niittykoski M., Salminen A. and Kaarniranta K. (2013) Maturation of autophagosomes and endosomes: a key role for Rab7. Biochim. Biophys. Acta, 1833, 503–510. [DOI] [PubMed] [Google Scholar]
- 69. Gutierrez M.G., Munafo D.B., Beron W. and Colombo M.I. (2004) Rab7 is required for the normal progression of the autophagic pathway in mammalian cells. J. Cell Sci., 117, 2687–2697. [DOI] [PubMed] [Google Scholar]
- 70. Ganley I.G., Wong P.M., Gammoh N. and Jiang X. (2011) Distinct autophagosomal-lysosomal fusion mechanism revealed by thapsigargin-induced autophagy arrest. Mol. Cell, 42, 731–743. [DOI] [PMC free article] [PubMed] [Google Scholar]
- 71. Gomez-Suaga P., Rivero-Rios P., Fdez E., Blanca Ramirez M., Ferrer I., Aiastui A., Lopez De Munain A. and Hilfiker S. (2014) LRRK2 delays degradative receptor trafficking by impeding late endosomal budding through decreasing Rab7 activity. Hum. Mol. Genet., 23, 6779–6796. [DOI] [PubMed] [Google Scholar]
- 72. Wang B., Abraham N., Gao G. and Yang Q. (2016) Dysregulation of autophagy and mitochondrial function in Parkinson’s disease. Transl. Neurodegener., 5, 19. [DOI] [PMC free article] [PubMed] [Google Scholar]
- 73. Larsen S.B., Hanss Z. and Kruger R. (2018) The genetic architecture of mitochondrial dysfunction in Parkinson’s disease. Cell Tissue Res., 373, 21–37. [DOI] [PMC free article] [PubMed] [Google Scholar]
- 74. Haas B.R., Stewart T.H. and Zhang J. (2012) Premotor biomarkers for Parkinson’s disease—a promising direction of research. Transl. Neurodegener., 1, 11. [DOI] [PMC free article] [PubMed] [Google Scholar]
- 75. Fleming S.M., Tetreault N.A., Mulligan C.K., Hutson C.B., Masliah E. and Chesselet M.-F. (2008) Olfactory deficits in mice overexpressing human wildtype α-synuclein. Eur. J. Neurosci., 28, 247–256. [DOI] [PMC free article] [PubMed] [Google Scholar]
- 76. Fleming S.M., Salcedo J., Fernagut P.-O., Rockenstein E., Masliah E., Levine M.S. and Chesselet M.-F. (2004) Early and progressive sensorimotor anomalies in mice overexpressing wild-type human α-synuclein. J. Neurosci., 24, 9434–9440. [DOI] [PMC free article] [PubMed] [Google Scholar]
- 77. Goldstein D.S., Holmes C., Li S., Bruce S., Metman L. and Cannon R.O. (2000) Cardiac sympathetic denervation in Parkinson disease. Ann. Intern. Med., 133, 338–347. [DOI] [PubMed] [Google Scholar]
- 78. Beach T.G., Adler C.H., Sue L.I., Vedders L., Lue L., White C.L. III, Akiyama H., Caviness J.N., Shill H.A., Sabbagh M.N. et al. (2010) Multi-organ distribution of phosphorylated α-synuclein histopathology in subjects with Lewy body disorders. Acta Neuropathol., 119, 689–702. [DOI] [PMC free article] [PubMed] [Google Scholar]
- 79. Chung C.Y., Seo H., Sonntag K.C., Brooks A., Lin L. and Isacson O. (2005) Cell type-specific gene expression of midbrain dopaminergic neurons reveals molecules involved in their vulnerability and protection. Hum. Mol. Genet., 14, 1709–1725. [DOI] [PMC free article] [PubMed] [Google Scholar]
- 80. Isacson O. (1993) On neuronal health. Trends Neurosci., 16, 306–308. [DOI] [PubMed] [Google Scholar]
- 81. Surmeier D.J., Obeso J.A. and Halliday G.M. (2017) Selective neuronal vulnerability in Parkinson disease. Nat. Rev. Neurosci., 18, 101–113. [DOI] [PMC free article] [PubMed] [Google Scholar]
- 82. Giguere N., Burke Nanni S. and Trudeau L.E. (2018) On cell loss and selective vulnerability of neuronal populations in Parkinson’s disease. Front. Neurol., 9, 455. [DOI] [PMC free article] [PubMed] [Google Scholar]
- 83. Korecka J.A., Levy S. and Isacson O. (2016) In vivo modeling of neuronal function, axonal impairment and connectivity in neurodegenerative and neuropsychiatric disorders using induced pluripotent stem cells. Mol. Cell. Neurosci., 73, 3–12. [DOI] [PubMed] [Google Scholar]
- 84. Paciotti S., Gatticchi L., Beccari T. and Parnetti L. (2019) Lysosomal enzyme activities as possible CSF biomarkers of synucleinopathies. Clin. Chim. Acta, 495, 13–24. [DOI] [PubMed] [Google Scholar]
- 85. Maass F., Schulz I., Lingor P., Mollenhauer B. and Bahr M. (2018) Cerebrospinal fluid biomarker for Parkinson’s disease: an overview. Mol. Cell. Neurosci., 97, 60–66. doi: 10.1016/j.mcn.2018.12.005. [DOI] [PubMed] [Google Scholar]
- 86. Ohmichi T., Mitsuhashi M., Tatebe H., Kasai T., Ali El-Agnaf O.M. and Tokuda T. (2018) Quantification of brain-derived extracellular vesicles in plasma as a biomarker to diagnose Parkinson’s and related diseases. Parkinsonism Relat. Disord.,2019 Apr; 61, 82–87. doi: 10.1016/j.parkreldis.2018.11.021 Epub 2018 Nov 20. [DOI] [PubMed] [Google Scholar]
- 87. Cilento E.M., Jin L., Stewart T., Shi M., Sheng L. and Zhang J. (2018) Mass spectrometry: a platform for biomarker discovery and validation for Alzheimer’s and Parkinson’s diseases. J. Neurochem., 2018 Nov 26.14635. doi: 10.1111/jnc.14635 [Epub ahead of print]. [DOI] [PMC free article] [PubMed] [Google Scholar]
- 88. Niimi Y., Ito S., Mizutani Y., Murate K., Shima S., Ueda A., Satake W., Hattori N., Toda T. and Mutoh T. (2018) Altered regulation of serum lysosomal acid hydrolase activities in Parkinson’s disease: a potential peripheral biomarker? Parkinsonism Rel. Disord., 2019 Apr; 61:132–137. doi: 10.1016/j.parkreldis.2018.10.032 Epub 2018 Nov 2. [DOI] [PubMed] [Google Scholar]
- 89. Dong M.X., Feng X., Xu X.M., Hu L., Liu Y., Jia S.Y., Li B., Chen W. and Wei Y.D. (2018) Integrated analysis reveals altered lipid and glucose metabolism and identifies NOTCH2 as a biomarker for Parkinson’s disease-related depression. Front. Mol. Neurosci., 11, 257. [DOI] [PMC free article] [PubMed] [Google Scholar]
- 90. Hansson O., Janelidze S., Hall S., Magdalinou N., Lees A.J., Andreasson U., Norgren N., Linder J., Forsgren L., Constantinescu R. et al. (2017) Blood-based NfL: a biomarker for differential diagnosis of parkinsonian disorder. Neurology, 88, 930–937. [DOI] [PMC free article] [PubMed] [Google Scholar]
- 91. Parkinson Progression Marker, I (2011) The Parkinson Progression Marker Initiative (PPMI). Prog. Neurobiol., 95, 629–635. [DOI] [PMC free article] [PubMed] [Google Scholar]
- 92. Nalls M.A., McLean C.Y., Rick J., Eberly S., Hutten S.J., Gwinn K., Sutherland M., Martinez M., Heutink P., Williams N.M. et al. (2015) Diagnosis of Parkinson’s disease on the basis of clinical and genetic classification: a population-based modelling study. Lancet Neurol., 14, 1002–1009. [DOI] [PMC free article] [PubMed] [Google Scholar]
- 93. https://www.eurekalert.org/pub_releases/2018-12/mgh-ets121018.php (2018). Ezogabine treatment shown to reduce motor neuron excitability in ALS patients EurekAlert. Public Release: 10-Dec-2018. Massachusetts General Hospital, Terri Ogan Janos.
- 94. Hinrich A.J., Jodelka F.M., Chang J.L., Brutman D., Bruno A.M., Briggs C.A., James B.D., Stutzmann G.E., Bennett D.A., Miller S.A. et al. (2016) Therapeutic correction of ApoER2 splicing in Alzheimer’s disease mice using antisense oligonucleotides. EMBO Mol. Med., 8, 328–345. [DOI] [PMC free article] [PubMed] [Google Scholar]
Associated Data
This section collects any data citations, data availability statements, or supplementary materials included in this article.