Abstract
The U.S. Environmental Protection Agency (EPA) is actively involved in supporting citizen science projects and providing communities with information and assistance for conducting their own air pollution monitoring. As part of a Regional Applied Research Effort (RARE) project, EPA’s Office of Research and Development (ORD) worked collaboratively with EPA Region 2 and the Ironbound Community Corporation (ICC) in Newark, New Jersey, to develop and test the “Air Sensor Toolbox for Citizen Scientists.” In this collaboration, citizen scientists measured local gaseous and particulate air pollution levels by using a customized low-cost sensor pod designed and fabricated by EPA. This citizen science air quality measurement project provided an excellent opportunity for EPA to evaluate and improve the Toolbox resources available to communities. The Air Sensor Toolbox, developed in coordination with the ICC, can serve as a template for communities across the country to use in developing their own air pollution monitoring programs in areas where air pollution is a concern. This pilot project provided an opportunity for a highly motivated citizen science organization and the EPA to work together directly to address environmental concerns within the community. Useful lessons were learned about how to improve coordination between the government and communities and the types of tools and technologies needed for conducting an effective citizen science project that can be applied to future efforts.
Keywords: citizen science, air pollution monitoring, air sensors, community engagement
INTRODUCTION
The U.S. Environmental Protection Agency (EPA) facilitates identification of potential environmental concerns by citizen scientists, particularly in vulnerable communities, as part of its mission to protect human health and the environment. The EPA efforts to promote citizen science projects have been largely driven by the general public’s strong interest in collecting environmental data that are of importance to their families and communities.1 Recent availability of new, lower cost (less than $2500) environmental monitors has increased the popularity of citizen environmental data collection,2 allowing community members to collect and analyze data and interpret results often as a part of collaborative projects with professional scientists.3 Many of these projects solve complex real-world problems, identify research questions, make new discoveries, and contribute to the development of new technologies and applications.4 Most citizens, however, lack the necessary technical training and understanding of environmental monitor operation5 to collect environ- mental data that are of an appropriate quality to meet their objectives. In addition, performance characteristics of some of the available lower cost environmental monitors have not been fully evaluated and, thus, might produce data that are of an insufficient quality.
The EPA created the “Air Sensor Toolbox for Citizen Scientists” to help citizens collect, analyze, interpret, and communicate air quality data effectively. The Toolbox, developed by EPA researchers and other groups involved in sensor research, is an online resource for information and guidance on new, low-cost, compact technologies that are used for measuring air quality, including sampling, calibrating and validating sensors, interpreting data, and evaluating device performance. The utility of the Toolbox resources was tested collaboratively by the EPA’s Office of Research and Development (ORD), EPA Region 2, and the Ironbound Community Corporation (ICC) funded through the EPA’s Regional Applied Research Effort (RARE) Program.
Each partner in this collaborative effort had different reasons for participating. The ICC was concerned about the health consequences of poor air quality, including high respiratory and cardiovascular disease rates and potentially cancer.6 Region 2, which has an established Citizen Science Program that engages communities in collecting data and advocating for their own environ- mental concerns, viewed the study as an opportunity to establish successful environmental monitoring community-based participatory research practices and to translate those practices to the Ironbound community and other communities in its jurisdiction. The ORD provided the ICC with tools and technical guidance to help promote and advance an air-monitoring project.
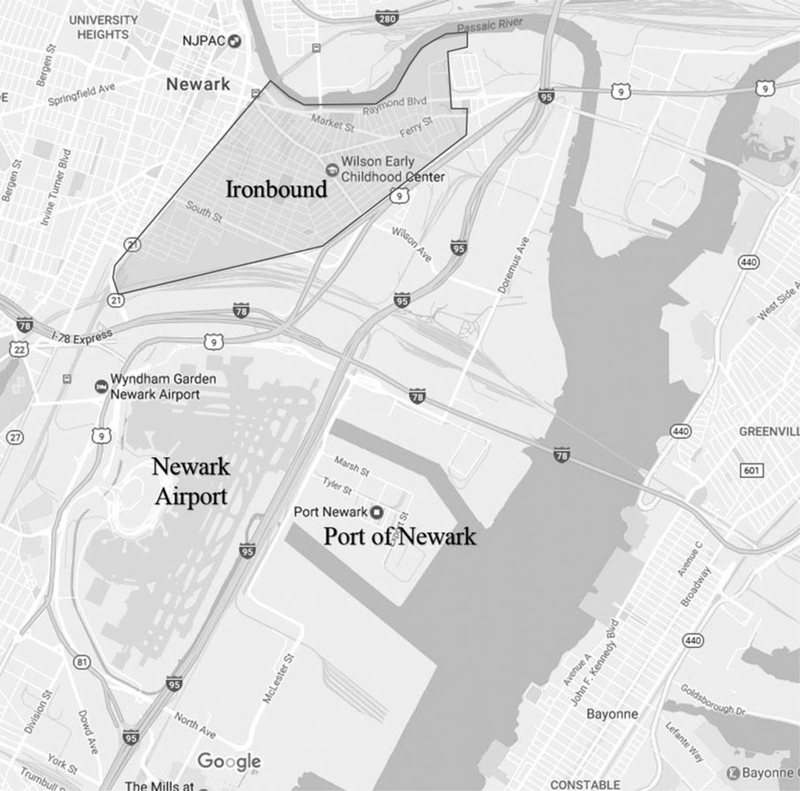
The Ironbound community (Fig. 1) of Newark, New Jersey, provided an ideal location for this project. The community’s diverse population of *50,000 residents is potentially impacted by a wide variety of environmental pollution sources. Many community residents suffer from poverty and live near industry and transportation arteries such as highways and rail lines that contribute to the pollution burden in the area. Roadways and industrial operations, which are often concentrated in low-income urban areas, can increase population exposure to airborne pollutants such as nitrogen oxides (NOx), sulfur oxides (SOx), particulate matter (PM), and air toxics. It is reported that 25% of the children living in the Ironbound community suffer from asthma, which is three times the state average.7 The ICC, a well-established community action group, is an important part of the Ironbound community that has both prior experience in conducting citizen science projects and prior working relationships with Region 2.8
FIG. 1.
Map of the Ironbound community.
Citizen scientists and professional scientists alike face a high technical hurdle in projects involving air quality monitoring. Issues that must be addressed to ensure collection of reliable data are many and complex. These issues include placing sensors in locations where collected data yield a complete picture of local environ- mental conditions while avoiding interference from other pollutants and technical issues with the field-deployed sensors. Simply put, many factors can contribute to collecting poor air pollution data, which significantly complicates the goal of assessing environmental conditions. It is important to acknowledge that, though informative, low-cost sensors typically used by citizen scientists are not directly comparable to regulatory monitors, samplers, or analyzers.
MATERIALS AND METHODS
Project planning and implementation involved several components, each of which was critical to the success of the project. Planning included coordinating partner efforts, assigning roles and responsibilities, and defining objectives. To ensure all stakeholder objectives were achieved, each participating organization contributed to the study design through multiple input sessions. A low-cost sensor pod—the Citizen Science Air Monitor (CSAM)—was designed and tested specifically for use in this project, and documentation was created to guide the community participants in collecting and analyzing the CSAM data.
Partner objectives, roles, and responsibilities
The three partner groups (ORD, Region 2, and ICC) met regularly through teleconferencing and in-person site visits to the Ironbound community to establish objectives and group roles and responsibilities. The overarching project goal was to estimate pollution levels in the Ironbound community. Each partner had slightly different subsidiary objectives, as summarized in Table 1, which were balanced within the context of the larger objective. An important goal for ICC was identifying local-scale variability to help target further air monitoring efforts. ICC also expressed a concern that local-scale variability was not being captured by ambient regulatory monitors (located outside of the community and intentionally away from known sources) or by larger-scale modeling efforts such as regional air quality modeling.
Table 1.
Project Objectives
| Group | Objective(s) |
|---|---|
| Overall objective (ICC/Region 2/ORD) | Estimate pollution levels in the Ironbound community |
| ICC | Characterize near-road/near-source high-concentration areas and local-scale variability Determine potential impact on nearby residences (including multi-story housing) Investigate locations of multi-level sources (roadways and elevated rails) |
| Region 2 | Develop “how-to” documentation Examine potential for sensor loan program for public use Use community-validated documentation for local Air Sensor Toolbox |
| ORD | Develop Air Sensor Toolbox for Citizen Scientists “how-to” documentation Establish community-based participation Create a research plan that includes how to interpret measurements and make decisions Explain uncertainty, variability, benefits, and limitations |
ICC, Ironbound Community Corporation; ORD, Office of Research and Development.
A project coordinator for the entire project was selected, and representatives from each partner group were identified to ensure study participants were supported, lines of communication were clear, and concerns and needs of all stakeholders were addressed throughout the study. The defined roles, responsibilities, and objectives were summarized in writing and distributed to all study partners.
Study design
The study was designed during multiple telephone, webinar, and in-person meetings in which the three partners agreed on a multi-step research approach:
Step 1: Plan a project to assess local air quality and its potential impacts on health, with a focus on developing a Toolbox for citizen scientists. ICC, with the help of community volunteers, would perform selective environmental monitoring, and the resulting data would be augmented by ORD’s sensor evaluation research9 and the Community-Focused Exposure and Risk Screening Tool (C-FERST).10
Step 2: Determine the source pollutants that are of the greatest concern. ORD and Region 2 would help ICC identify the pollutants for measurement. ORD would develop the CSAM and a standard operating procedure (SOP)11 and quality assurance (QA) guidelines.12
Step 3: Collaborate in developing the research plan by using a citizen science monitoring approach. Multi-seasonal data collection would follow the data collection strategy provided by the SOP and QA guidelines.
Step 4: Determine ideal locations and discuss a proper setup for monitors.
Step 5: Process collected environmental data. ICC and Region 2 would tabulate the collected data, which would be incorporated into a database.
Step 6: Incorporate data visualization. The ORD would assist with a visualization component of the environmental data processing to ensure representative displays of information.
Step 7: Analyze and communicate data. The ORD would provide consultation regarding data analysis and communication approaches that ICC could use in summarizing data collected by the citizen group.
From the outset of the study design, the ICC indicated that it wished to develop targeted strategies for combating the high rates of asthma and other respiratory diseases in the community by better understanding the air pollution profile within its neighborhood borders. The ICC intended to augment data from a previous study with the New Jersey Department of Environmental Protection (NJDEP) and the University of Medicine and Dentistry of New Jersey13 with this new data set, which would provide continuous monitoring of data from locations where people lived and/or spent large parts of their day and represented a “typical” air quality profile of a person living in the area during the monitoring period. The ICC requested that the sensors be placed at homes near sources such as elevated railways and highways to determine whether these residences experienced greater levels of air pollution. Based on these stated community needs and the EPA’s research on both near-roadway exposures and available low-cost sensors, the EPA suggested fine particulate matter (PM2.5) and nitrogen dioxide (NO2) as the pollutants of interest for measurement.
Spatial, temporal, and seasonal (February through July) variations were accounted for in the study design. Spatial considerations were important to obtain appropriate coverage of air pollution levels across the area while taking into account factors such as limited hosting locations and accessibility constraints. The aim was to provide broad spatial coverage during this pilot project that could inform more targeted future measurement projects. The ICC was also interested in learning how air pollution levels change over vertical gradients such as different floors of an apartment building. Temporal considerations involved establishing a 2-week minimum for sensor measurements at each location to account for potential meteorological variability. A hazard/risk ranking was conducted that determined how measurements would be compared within the context of overall conditions, what changes in conditions would mean, and how changes in conditions (e.g., lower exposure) could be achieved.
To ensure that the project collected high-quality data, two QA documents were developed—CSAM QA Guidelines14 and a project-specific Quality Assurance Project Plan (QAPP) developed from Region 2’s streamlined QAPP template specifically designed for citizen scientists.15 These documents described the research design and included specifics such as monitoring locations, maintenance schedule, accessibility, measurement duration per location, technology requirements, and data responsibilities. The project roles and responsibilities identified at the beginning of the project were also incorporated into the QAPP.
Air monitoring instrument design and fabrication
During the design phase, it was decided that the development of a low-cost sensor pod, called a CSAM, was required to meet project requirements. The CSAM pod incorporated continuous PM2.5 and NO2 monitoring; portable, lightweight yet rugged rechargeable-battery and hard-wired power options to allow for seven autonomous days of operation; a snorkel tube option for air intakes that allowed sensors to be placed inside a window to measure outdoor air; precipitation resistance; internal data storage; and simple data recovery, on/off operation, and calibration features.
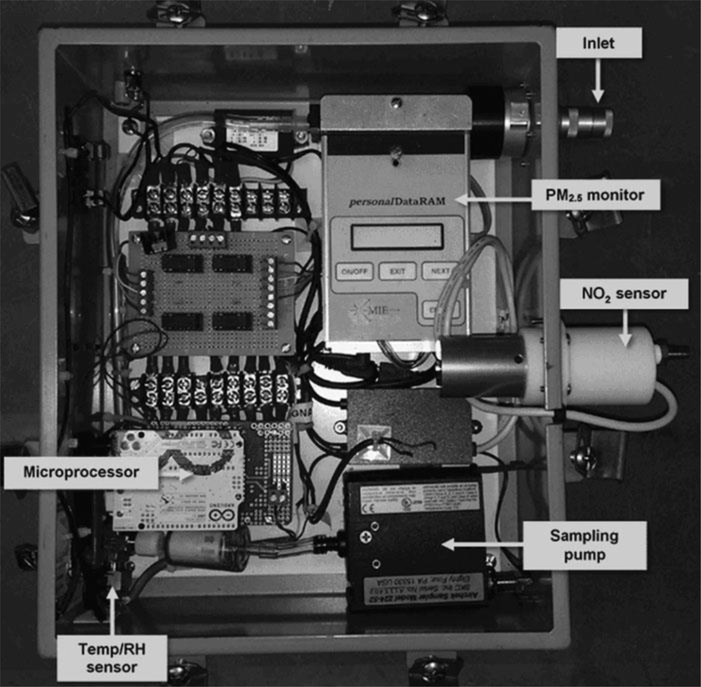
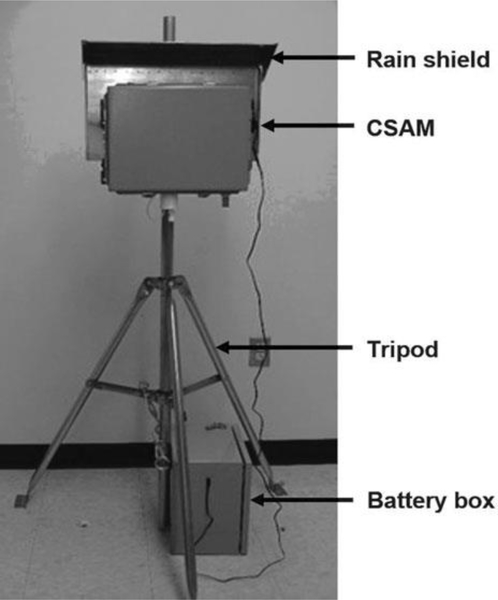
The ORD designed and fabricated four CSAM pods, which included components for measuring PM2.5, NO2, temperature (T), and relative humidity (RH) simultaneously (Fig. 2). The CSAM units were set up (Fig. 3) and tested in an ORD laboratory, UL certified for safety,16 and run to obtain representative data after calibration and QA review. The individual CSAM components are described in the CSAM SOP.17 It should be noted that the CSAM is not approved for regulatory assessment of attainment of the National Ambient Air Quality Standards (NAAQS).
FIG. 2.
The inside of the CSAM with its separate components. CSAM, Citizen Science Air Monitor.
FIG. 3.
CSAM pod assembled with weather shielding, tripod, and battery.
CSAM pod validation
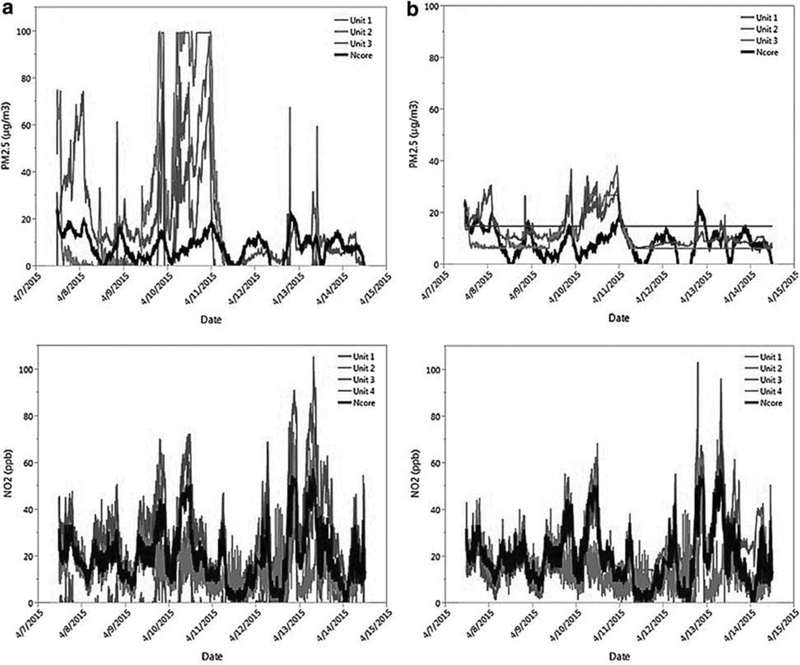
Comparability and data quality testing was conducted by Region 2 before field deployment to evaluate how the CSAM pods compared with regulatory-grade monitors. The four CSAM pods were collocated for *1 week with federal regulatory monitors at the NCore multipollutant network site maintained by the NJDEP (part of the ambient air monitoring network used to assess the NAAQS established by EPA, which must meet federal requirements for performance).18 The NCore station, located *1 mile outside the Ironbound community, included both NO2 and PM2.5 monitors. This evaluation demonstrated that the pods generally agreed with the regulatory monitors, but it tended to overestimate PM2.5 and both overestimated and underestimated NO2 depending on the CSAM pod.
Given the generally good agreement of measurements, the team decided the pods were operating well but needed further calibration. Regression equations were developed and applied to normalize the responses, after which the CSAM data more closely agreed with the regulatory monitor measurements. Figure 4 depicts PM2.5 and NO2 raw and normalized data over the 1-week period. This procedure increased the team’s confidence that the pod data from the field deployment would be more representative of actual concentrations.
FIG. 4.
Raw (a) and normalized (b) CSAM data for PM2.5 (top) and NO2 (bottom) compared with NCore data over time.
CSAM operation and data collection
ORD and Region 2 scientists demonstrated the proper use and maintenance of the CSAM pods to ICC staff during a day-long training session that included pod setup and disassembly, data considerations related to benefits and limitations of the sensors, and information about the context of measurements, including sources, sites, and potential exposures. Instructions were provided for data recovery; proper transport of the pods; best pod placement for proper function and data collection; and troubleshooting in case of disturbances, cold weather events, or other potential error-producing circumstances. The training session gave the ICC staff and volunteers an opportunity for hands-on disassembly and reassembly of the CSAM pods so that they were prepared for a full-field deployment cycle.
After testing and training, the CSAM pods were deployed in the community. Site considerations for placement of the four CSAM pods included accessibility by the community volunteer operators, potential for theft or vandalism, and weather. The ICC was responsible for site selection and deployment to meet study design requirements. Some pods had to be placed indoors with snorkel tubing inserted through a partially open window to allow sampling of outdoor air. Other considerations included proximity to indoor pollutant sources such as tobacco smoke, kitchen or heating system exhausts, or other combustion sources that might influence outdoor air measurements.
The CSAM pods were deployed from February 12 to July 30, 2015. The ICC developed a deployment and maintenance schedule and worked with the community volunteers to deploy all four CSAM pods simultaneously, usually on weekdays when residents were available to receive the instrumentation. A 2-week sampling time was achieved at most locations. For the community field deployment, as many as four pods could be sampled at different locations at a given time. However, due to mechanical and logistical constraints, sometimes only two of the four pods were in operation during a deployment.
The CSAM maintenance duties included charging or replacing batteries, downloading data by using a secure digital card, and moving the CSAM pods to new monitoring sites. After the pods were set up, collecting data and changing the battery required only 20–30 minutes per week for each pod. Sometimes, special arrangements were made with residents if operators needed access to homes or rooftops.
The CSAM pods were generally stable in all weather conditions (wind, rain, snow, humidity, and temperature) throughout the study. Only one incident occurred where rain intruded into a pod casing, which was likely caused by strong wind forcing droplets into the casing at an unexpected angle. The sensors exhibited high sensitivity to measuring pollutant concentrations, with only mini- mal time periods (<24 hours) where pollutant concentrations were not detected. The pods operated without any reported safety issues throughout the entire study, and data storage and recovery hardware and software proved robust.
Data analysis
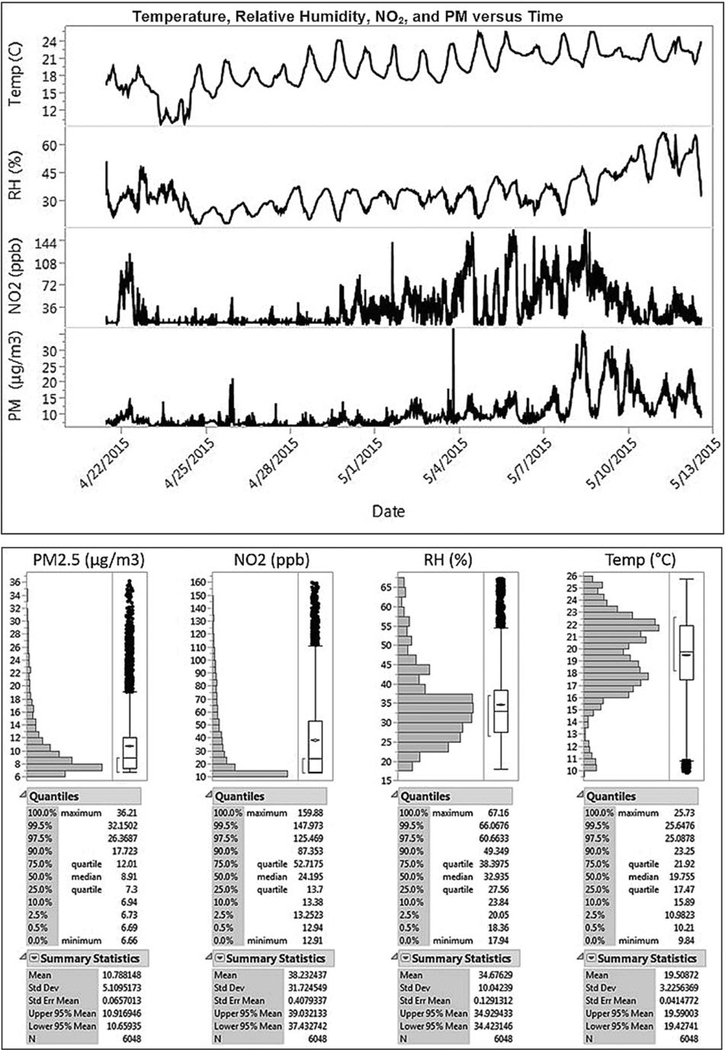
The ORD provided expertise for reviewing, analyzing, and summarizing the collected data. A data analysis plan was developed that considered data quality, intercomparison of data from different locations, and representativeness of data collection conditions. A spreadsheet template was created in Microsoft Excel to import raw data (in millivolts) automatically from the CSAM pods as a text file and to create a worksheet containing both the raw data and the processed data (converted to appropriate units for each measurement [T, RH, PM2.5, and NO2]). Time series graphs were created and basic statistics were performed to determine differences in pollutant concentrations between sampling locations, as shown in Figure 5 for two separate CSAM pods. Contemporaneous measurements were plotted against each other to determine the degree of variance from a 1:1 agreement (i.e., perfect agreement was represented by a slope of 1 in the resulting regression equations). These graphs showed diurnal pat- terns and data ranges and allowed quick identification of any anomalies or missing data. Basic statistics included quantile distributions; mean, median, maximum, and mini- mum values; standard deviation; standard mean error; and upper and lower 95% means.
FIG. 5.
Examples of time series graphing and basic statistics.
In checks of the data for anomalies, a significant pat- tern stood out immediately that indicated an operational issue. In many of the snorkel tube applications, temperatures were not representative of outdoor temperatures and did not reflect diurnal temperature variations, for unknown reasons. These data were not discounted but were flagged as potential concerns.
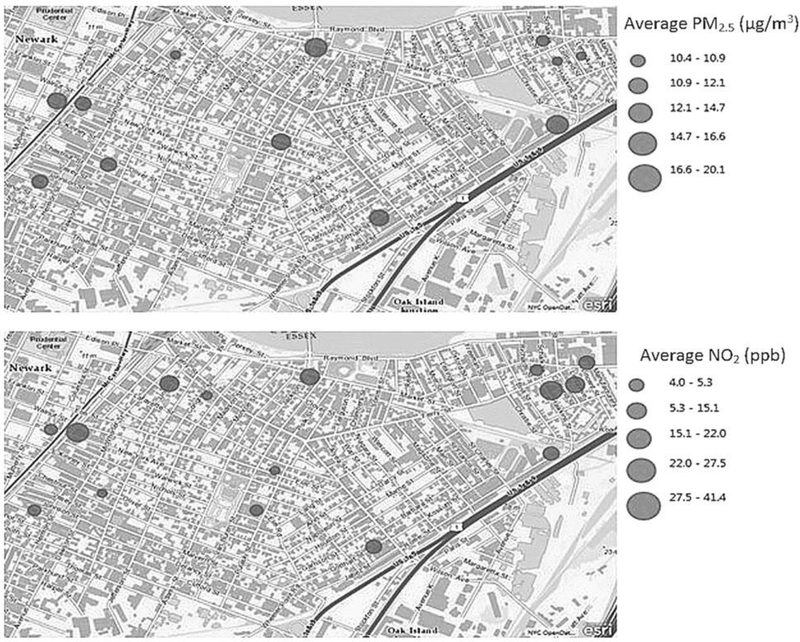
To address the ICC’s concern about local-scale variability, average values for each CSAM monitoring period, regardless of date, were plotted on a map of the community (Fig. 6). These maps can help identify sites for further study and demonstrate homogeneity (indicative of ambient background) or heterogeneity (indicative of near-source contributions) among measurements. The PM2.5 concentration data exhibited overall homogeneity, which suggested ambient conditions. Though not exceedingly high, ambient air PM2.5 concentrations were high enough to warrant further consideration. The apparent heterogeneity of NO2 data across locations likely indicated effects from nearby pollutant sources such as roadways, suggesting that these areas are particularly of concern. These findings support the need for a careful examination of exposure and associated risk near roadways and indicate that this type of monitoring can help target areas for exposure reduction actions.
FIG. 6.
Average PM2.5 and NO2 for each CSAM monitoring period plotted over a map of the community.
CONCLUSIONS AND LESSONS LEARNED
This project was a highly successful collaborative effort between citizen scientists and professional scientists to identify geospatial trends in PM2.5 and NO2 and to place the findings of the Ironbound community’s air quality in a context with that of other cities. A highlight of this project for EPA was successful engagement of citizens in data collection of the air quality measurements. The collaborative relationship established early on with the ICC community action group continued through- out the project, resulting in a successful air monitoring campaign that also built capacity and knowledge for conducting future citizen science air quality projects.
Several valuable lessons were learned during this effort that can inform and improve future citizen science efforts. For instance, clearly defining participant roles and responsibilities at the outset of the project was an important first step, but these needed to be revisited throughout the project as new tasks or resource limitations were identified. Some roles originally assigned could not be performed. The initial plan was for the ICC to lead data analysis and summarization, but as the project proceeded, these aspects required greater collaboration from all research partners. The need for greater detail in the analysis plan also became apparent over the course of the project. Information on how sensor data would be compared with regulatory-equivalent monitor data during validation and who was expected to perform this task, for example, would have resulted in greater efficiency in compiling the results. In addition, a firm plan for data sharing should be established and communicated to all parties before data collection begins. Using a Google Document to share data was discussed early on, but no concrete plans were set in action for data sharing. The data were sent from the ICC to the EPA, where they were compiled and then shared back with all parties. A streamlined plan for this project step would have eliminated confusion and extra work.
Overall CSAM performance was quite good, but a few technical issues arose with the equipment during the study. These issues included minor damage sustained during transport from the place of fabrication in Re- search Triangle Park, North Carolina, to the Region 2 office in Edison, New Jersey; several pump failures (flow rate stability) that ultimately required replacement with brand new pumps due to a manufacturing defect; and, on one occasion, failure of a battery unit to re- charge. Although such issues are often encountered during field studies, these technical difficulties were noted so that similar difficulties can be avoided in future deployments. The turnkey on/off design of the CSAM provided a simple interface for citizens, but some volunteer operators reported that the monitoring stands and battery power supplies were heavy and cumbersome and, thus, difficult to transport to certain monitoring locations. Unfortunately, the requirement for 7 days of operation without AC power dictated the larger battery and heavier unit, but making the CSAM pod more user friendly will be given consideration for future citizen science projects.
At the end of the study, a community meeting was held to discuss general findings of the research, answer any questions, and brainstorm next steps. One very challenging question arose that has yet to be answered fully: “What do these measurements mean for me?” This question was particularly important to community members who had voluntarily hosted CSAM pods in their homes and is an ongoing question for citizen science applications. Nevertheless, the question afforded an opportunity to clearly define for the community the limitations of the data and the value and role of citizen science research. To do this, the data had to be presented not as arbitrary air pollutant concentration values, but as a larger air quality data set that can lead to definable, actionable next steps. In these discussions, members of the Ironbound community learned that the CSAM pod data do not represent regulatory-grade exposure measurements that can be used lawfully to mandate follow- up actions or infer health impacts. Rather, the value of these results lies in the identification of spatial distributions and general trends, which can be used to identify areas for further study, for education and outreach, for implementation of health improvement strategies, or to target future citizen science measurement campaigns. In addition, this question emphasized the importance of articulating early on in citizen science projects the type of data expected to be collected and their usefulness and limitations. Community members suggested several items for potential next steps that demonstrated commitment and enthusiasm for improving their environment: (1) examining multi-media pollution, including water quality; (2) performing saturation monitoring with passive sensors for source apportionment-type studies; (3) examining air quality from airports; (4) performing a cumulative risk assessment and/or cumulative impacts assessment; (5) identifying other potential collaborators, such as local agencies and academic organizations; (6) using targeted sensor placement strategies near potential hotspots; and (7) assessing cancer and respiratory condition clusters prevalent in the community. Although not all of these issues can be addressed through citizen science, the introduction of low-cost technologies affords citizens greater opportunities to learn more about the quality of their local environments and to participate in citizen science efforts to improve the health of their communities. The EPA will continue to guide citizen science by facilitating partnerships, providing technical assistance, educating citizen scientists, analyzing and interpreting results, recommending actions, and implementing solutions.
Acknowledgments
DISCLAIMER
The U.S. EPA through its ORD funded and con- ducted the research described here. It has been reviewed by the U.S. EPA and approved for publication. The effort was supported through contracts with Alion Science and Technology (EP-D-10-070) and Jacobs Technology Inc. (EP-C-15-008). A subcontractor, the ICC, provided a review and commentary of this publication. The mention of trade names or commercial products does not constitute endorsement or recommendation for use.
Footnotes
AUTHOR DISCLOSURE STATEMENT
No competing financial interests exist.
REFERNCES
- 1.McKinley Duncan C., Miller-Rushing Abraham J., Ballard Heidi L., Bonney Rick, Brown Hutch, Evans Daniel M., French Rebecca A., Parrish Julia K., Phillips Tina B., Ryan Sean F., Shanley Lea A., Shirk Jennifer L., Stepenuck Kristine F., Weltzin Jake F., Wiggins Andrea, Boyle Owen D., Briggs Russell D., Chapin Stuart F. III, Hewitt David A., Preuss Peter W., and Soukup Michael A. “Investing in Citizen Science Can Improve Natural Resource Management and Environmental Protection,” Issues in Ecology 19 (Fall 2015, pp 2–6); Dickinson JL and Bonney R (eds). Citizen Science: Public Participation in Environmental Research. (Cornell University Press, 2012). [Google Scholar]
- 2.Snyder Emily G., Watkins Timothy H., Solomon Paul A., Thoma Eben D., Williams Ronald W., Hagler Gayle S.W., Shelow David, Hindin David A., Kilaru Vasu J., and Preuss Peter W. “The Changing Paradigm of Air Pollution Monitoring,” Environmental Science and Technology 47 (2013): 11369–11377; [DOI] [PubMed] [Google Scholar]; Kaufman Amanda, Brown Ann, Barzyk Tim, and Williams Ron. “The Citizen Science Toolbox: A One-Stop Resource for Air Sensor Technology, EM (September 2014): 48–49; [Google Scholar]; Preuss Peter and French Rebecca. “A Sensor World,” EM ( January 2014): 20–24; [Google Scholar]; White Richard M., Paprotny Igor, Doering Frederick, Cascio Wayne E., Solomon Paul A., and Gundel Lara A., “Sensors and Apps for Community-Based Atmospheric Monitoring,” EM Magazine (May 2012): 36–40. [Google Scholar]
- 3.McKinley Duncan C., Miller-Rushing Abraham J., Ballard Heidi L., Bonney Rick, Brown Hutch, Evans Daniel M., French Rebecca A., Parrish Julia K., Phillips Tina B., Ryan Sean F., Shanley Lea A., Shirk Jennifer L., Stepenuck Kristine F., Weltzin Jake F., Wiggins Andrea, Boyle Owen D., Briggs Russell D., Chapin Stuart F. III, Hewitt David A., Preuss Peter W., and Soukup Michael A. “Investing in Citizen Science Can Improve Natural Resource Management and Environmental Protection,” Issues in Ecology 19 (Fall 2015, pp. 10–12). [Google Scholar]
- 4.Community Air Monitoring Training: A Glimpse into EPA’s Air Sensor Toolbox. <https://www.epa.gov/air-sensor-toolbox/air-sensor-toolbox-resources-and-funding#training_videos> (Last accessed on December 6, 2016).
- 5.Williams Ron, Watkins Tim, and Long Russell. “Low-Cost Sensor Calibration Options,” EM Magazine ( January 2014): 10–15; [Google Scholar]; Williams Ron, Kilaru Vasu, Snyder Emily, Kaufman Amanda, Dye Timothy, Rutter Andrew, Russell Ashley, and Hafner Hilary. Air Sensor Guidebook, EPA/600/R-14/159, NTIS PB2015–100610. (U.S. Environmental Protection Agency, Washington, DC, 2014). [Google Scholar]
- 6.Ironbound CARE. <https://sites.google.com/a/ironboundcc.org/ironboundcare/>. (Last accessed on December 6, 2016).
- 7.Greenberg Molly, Ironbound Community Corporation. Community Based Participatory Research: Newark, NJ; <http://www3.epa.gov/citizenscience/NJ/2b-Greenberg-AirMonHealthSurvey.pdf>. (Last accessed on December 6, 2016). [Google Scholar]
- 8.Ironbound CARE. <https://sites.google.com/a/ironboundcc.org/ironboundcare/>. (Last accessed on December 6, 2016);; U.S. Environmental Protection Agency. Science in Action: Citizen Science Toolbox. <http://www.epa.gov/sites/production/files/2015-03/documents/citizen_science_toolbox_ironbound_community_fact_sheet.pdf>. (Last accessed on December 6, 2016).
- 9.Williams Ron, Long Russell, Beaver Melinda, Kaufman Amanda, Zeiger Florian, Heimbinder Michael, Acharya Bharat R., Grinwald Bart A., Kupcho Kurt A., Robinson Sheila E., Zaouak Olivier, Aubert Bruno, Hannigan Michael, Moran Bob, Rook Malcolm, Heppner Paul, Cogar Cathy, Nikzad Nima, and Griswold William G. Sensor Evaluation Report, EPA 600/R-14/143. (U.S. Environmental Protection Agency, Research Triangle Park, NC, 2014). <https://cfpub.epa.gov/si/si_public_record_report.cfm?dirEntryId=277270&simpleSearch=1&searchAll=sensor–evaluation–report>. (Last accessed on December 6, 2016); [Google Scholar]; Williams Ron, Kaufman Amanda, and Garvey Sam. Next Generation Air Monitoring (NGAM) VOC Sensor Evaluation Report, EPA/600/R-15/122. (U.S. Environmental Protection Agency, Research Triangle Park, NC, 2015). <https://cfpub.epa.gov/si/si_public_record_report.cfm?dirEntryId=308114&simpleSearch=1&searchAll=Next–generation–air–monitoring>. (Last accessed on December 6, 2016); [Google Scholar]; Williams Ron, Kaufman Amanda, Hanley Tim, Rice Joann, and Garvey Sam. Evaluation of Field-deployed Low Cost PM Sensors, EPA/600/R-14/464. (U.S. Environmental Protection Agency, Research Triangle Park, NC, 2014). <https://cfpub.epa.gov/si/si_public_record_report.cfm?dirEntryId=297517&simpleSearch=1&searchAll=EPA%2F600%2FR-14%2F464>. (Last accessed on December 6, 2016). [Google Scholar]
- 10.U.S. Environmental Protection Agency. Introduction to the Community-Focused Exposure and Risk Screening Tool (C-FERST). <https://www.epa.gov/healthresearch/communityfocused-exposure-and-risk-screening-tool-c-ferst>. (Last accessed on December 6, 2016).
- 11.U.S. Environmental Protection Agency. Citizen Science Air Monitor (CSAM) Operating Procedures, EPA 600/R-15/051. <https://cfpub.epa.gov/si/si_public_record_report.cfm?dirEntryId=307111&simpleSearch=1&searchAll=CSAM–Operating–Procedures>. (Last accessed on December 6, 2016).
- 12.U.S. Environmental Protection Agency. Citizen Science Air Monitor (CSAM) Quality Assurance Guidelines, EPA 600/R-15/008. <https://cfpub.epa.gov/si/si_public_record_report.cfm?dirEntryId=305651&simpleSearch=1&searchAll=Citizen–Science–Air–Monitor–%28CSAM%29%3A–Quality–Assurance–Guidelines>. (Last accessed on December 6, 2016).
- 13.Ironbound CARE. <https://sites.google.com/a/ironboundcc.org/ironboundcare/>. (Last accessed on December 6, 2016).
- 14.U.S. Environmental Protection Agency. Citizen Science Air Monitor (CSAM) Quality Assurance Guidelines, EPA 600/R-15/008. <https://cfpub.epa.gov/si/si_public_record_report.cfm?dirEntryId=305651&simpleSearch=1&searchAll=Citizen–Science–Air–Monitor–%28CSAM%29%3A–Quality–Assurance–Guidelines>.(Last accessed on December 6, 2016).
- 15.Drisco Kathryn and Peterson Sarah. US EPA Region 2 Guidance for the Development of Quality Assurance Project Plans for Citizen Science Projects. April 2013. <https://www3.epa.gov/citizenscience/pdf/citsci_air_attach_b_form.pdf>. (Last accessed on December 6, 2016).
- 16.UL. Specific Guidelines and Rules. <http://www.ul.com/marks/ul-listing-and-classification-marks/promotion-and-advertisingguidelines/specific-guidelines-and-rules/>. (Last accessed on December 6, 2016).
- 17.U.S. Environmental Protection Agency. Citizen Science Air Monitor (CSAM) Operating Procedures, EPA 600/R-15/051. <https://cfpub.epa.gov/si/si_public_record_report.cfm?dirEntryId=307111&simpleSearch=1&searchAll=CSAM–Operating–Procedures>. (Last accessed on December 6, 2016).
- 18.U.S. Environmental Protection Agency. Air Monitoring, Measuring, and Emissions Research. <https://www.epa.gov/airresearch/air-monitoring-measuring-and-emissions-research#aqmm>.. (Last accessed on December 6, 2016).


