Arabidopsis GAAP1 and GAAP3 interacted with MAPR3. MAPR3 and the interaction between GAAPs and MAPR3 mitigated ER stress through modulation of RIDD and the autophagy pathway dependent on association with IRE1B.
Keywords: Arabidopsis thaliana, autophagy, ER stress, GAAPs, IRE1, MAPR3, RIDD, unfolded protein response
Abstract
Cell viability requires the maintenance of intracellular homeostasis through the unfolded protein response mediated by receptors localized on the endoplasmic reticulum (ER) membrane. The receptor IRE1 mediates not only various adaptive outputs but also programmed cell death (PCD) under varying stress levels. However, little is known about the mechanism by which the same receptors trigger different responses in plants. Arabidopsis Golgi anti-apoptotic protein 1 (GAAP1) and GAAP3 resist PCD upon ER stress and negatively modulate the adaptive response of the IRE1–bZIP60 pathway through IRE1 association. To elucidate the mechanism underlying the anti-PCD activity of GAAPs, we attempted to isolate interactors of GAAPs by yeast two-hybrid screening. Membrane-associated progesterone receptor 3 (MAPR3) was isolated as one of the factors interacting with GAAP. Mutations in GAAP1/GAAP3 and/or MAPR3 enhanced the sensitivity of seedlings to ER stress. Whole-transcriptome analysis combined with quantitative reverse transcription–PCR and cellular analysis showed that regulated IRE1-dependent decay (RIDD) and autophagy were impaired in mutants mapr3, gaap1mapr3, and gaap3mapr3. MAPR3, GAAP1, and GAAP3 interacted with IRE1B as determined by protein interaction assays. These data suggest that the interaction of GAAP1/GAAP3 with MAPR3 mitigates ER stress to some extent through regulating IRE10-mediated RIDD and autophagy.
Introduction
The endoplasmic reticulum (ER) is an important site for protein folding and is highly sensitive to various environmental stresses. ER stress occurs when internal and external stresses cause unfolded or misfolded proteins to accumulate in the ER and exceed their own folding ability (Deng et al., 2013). Tunicamycin (TM) and DTT are usually used as ER stress inducers in the laboratory. Adaptation to ER stress is mediated by the involvement of the unfolded protein response (UPR), an integrated signal transduction pathway that transmits information about the protein folding status in the ER lumen to the nucleus to increase protein folding capacity. Two UPR pathways dependent on IRE1A/B and bZIP17/28 have been identified in plants (Wan and Jiang, 2016). In response to ER stress, IRE1A/B splices and activates the downstream target gene bZIP60, bZIP17/28 is modified by cleavage in the Golgi apparatus, and UPR-related gene expression is up-regulated to enhance protein processing (Liu and Howell, 2010a; Nagashima et al., 2011). In addition to the cytosplicing of bZIP60, the IRE1 pathway facilitates the degradation of mRNA localized in the ER referred to as regulated IRE1-dependent decay (RIDD) and autophagy to decrease the protein load in the ER or clear the damaged ER on time (Hollien and Weissman, 2006; Liu et al., 2012; Mishiba et al., 2013). Conversely, cells undergo programmed cell death (PCD) if the mechanisms of adaptation are insufficient to handle the unfolded protein load. In mammalian cells, IRE1α initiates different outputs by forming a complex signalling platform at the ER membrane through the binding of different adaptor proteins (Hetz and Glimcher, 2009). The adaptor proteins for IRE1 include the phosphatase PTP-1B (Gu et al., 2004), ASK1-interacting protein 1 (Luo et al., 2008), and some members of the BCL-2 protein family (Hetz et al., 2006). Proapoptotic proteins BAX and BAK of the BCL-2 family bind to and activate IRE1, which triggers cell death (Hetz et al., 2006). However, the regulation mechanism of PCD and the key factors regulating different outputs of receptors for ER stress remain unclear in plants. Plants lack a BCL-2 core protein that determines cell life and death, but possess a highly conserved Bax inhibitor-1 (BI-1) (Watanabe and Lam, 2009). In plants, BI-1 promotes cell survival by the reducing Ca2+ concentration and reactive oxygen species accumulation in the ER (Ihara-Ohori et al., 2007). BI-1 can impair the protective function of bZIP28 but not that of IRE1 (Ruberti et al., 2018).
The BI-1-like factor TMBIM4, also known as the Golgi anti-apoptotic protein (GAAP), has been found in Arabidopsis. Arabidopsis GAAP1 and GAAP3 play redundant roles in resisting PCD upon ER stress. Moreover, both GAAP1 and GAAP3 negatively regulate the adaptive response of the IRE1–bZIP60 pathway through IRE1 association and are conducive to energy redistribution when ER stress is relieved (Guo et al., 2018). However, the mechanism underlying the anti-PCD of GAAPs remains unclear. To elucidate this problem, we attempted to isolate interactors of GAAPs through yeast two-hybrid (Y2H) screening. Here, we reported a membrane-bound progesterone receptor protein, membrane-associated progesterone receptor 3 (MAPR3), which is isolated as an interaction factor of GAAPs. Limited knowledge is available about MAPR3. Mutations in GAAP1/GAAP3 and/or MAPR3 enhanced the sensitivity of seedlings to ER stress. Whole-transcriptome (RNA-seq) analysis combined with real-time quantitative reverse transcription–PCR (qRT–PCR) and cellular analysis was further performed to elucidate the mechanism of MAPR3 association with GAAP1/GAAP3 against ER stress. The result showed that the RIDD pathway and autophagy-dependent IRE1 were impaired in mapr3, gaap1mapr3, and gaap3mapr3. Bimolecular fluorescence complementation (BiFC) and pull-down assay showed that MAPR3, similarly to GAAP1 and GAAP3, interacted with IRE1B. Hence, interaction of GAAP1/GAAP3 and MAPR3 mitigated ER stress through regulation of RIDD and the autophagy pathway that is dependent on association with IRE1B.
Materials and methods
Plant material and growth conditions
Arabidopsis thaliana ecotype Columbia-0 (Col-0) plants and T-DNA insertion mutants in the Col-0 background were used. Mutants gaap1-1 and gaap3 were mentioned previously (Guo, 2018). mapr3-1 (SALK_141336C) and mapr3-2 (SALK_056475C) were isolated from the Salk T-DNA collection. Double mutants gaap1mapr3 and gaap3mapr3 were generated via the hybridization of gaap1-1, gaap3, and mapr3-2. Genotypes were also confirmed by the PCR amplification of plant genomic DNA with T-DNA and gene-specific primers. Seeds were stratified at 4 °C for 2–3 d before germination, and plants were grown at 23±2 °C in soil under a light/dark cycle for 16 h/8 h or on 1/2 Murashige and Skoog (MS) medium (consisting of 1% sucrose, 0.8% agar) under continuous white light. Seedling sensitivity to ER stress was tested as described previously (Guo et al., 2018). To inhibit de novo transcription, seedlings were treated with actinomycine D (ActD; 75 μM) for 2 h before stress treatments (Mishiba et al., 2013).
Construction of plasmids
For Y2H screening, the coding sequences of Arabidopsis GAAP1 and GAAP3 were cloned into the bait vector of pBT3-N to generate plasmids LexA-VP16-Cub-GAAP1/3. For cellular localization, the C-terminus of the MAPR3 gene fused to green fluorescent protein (GFP) called 35S::MAPR3–GFP was constructed in the binary vector (Luo et al., 2014). The fusions of the cellular organelle marker genes with mCherry, RAB-A2a–mCherry, ARA7–mCherry, SYP22–mCherry, and DELTA-TIP1–mCherry, were constructed into pMon530. To construct the fusions nYFP–MAPR3, MAPR3–cYFP, and IRE1B–cYFP for the BiFC assay, we amplified the coding sequences with PCR and cloned them into the corresponding vectors (pXY104 and pXY106). The construction of nYFP–GAAP1/GAAP3 and IRE1A–cYFP was described previously (Guo et al., 2018). For co-immunoprecipitation (Co-IP) assay, MAPR3 cDNA was cloned into the pCAMBIA1300-35S-X-TAP plasmid to produce the TAP fusion construct MAPR3-TAP. FLAG-epitope-tagged GAAP1 cDNA was cloned into the pCAMBIA1300-35S-3× FLAG vector (Li et al., 2012).
The primers pairs are listed in Supplementary Table S1 at JXB online, and all the generated constructs were confirmed by sequencing.
The subcellular localization of Arabidopsis MAPR3 and BiFC assay
The plant organelle marker–red fluorescent protein (RFP) or marker–mCherry and 35S::MAPR3–GFP constructs were introduced into tobacco (Nicotiana clevelandii) leaf epidermal cells using the Agrobacterium tumefaciens-mediated infiltration technique. Samples were examined for fluorescence signal via laser scanning confocal microscopy (Leica TCS SP5II). Protein co-localization and BiFC assays were described previously (Luo et al., 2014).
Yeast two-hybrid assay
The yeast (Saccharomyces cerevisiae) split-ubiquitin (Ub) system was used. Plasmids, Arabidopsis cDNA library, and yeast strains used in Y2H assay were described and used following the instructions in the manufacter's protocol (DUALmembrane Starter Kit N, P01201–P01229). The coding sequences of Arabidopsis GAAP1 and GAAP3 were cloned into the bait vector pBT3-N to generate bait plasmids. The prey vector pPR3-N and yeast strain NMY51 were used. Both auxotrophic assay and colony filter lift assay were performed to detect the interaction between prey and bait. If a yeast harboured an interacting protein pair, then the yeast colony can grow on SD-trp-leu-his-ade+2 mM 3-amino-1,2,4-triazole selection medium. Therefore, yeast cells expressing β-galactosidase turned blue when incubated with X-gal.
GST affinity isolation assay
The cDNA sequence fragment of IRE1B encoding the kinase and RNase domains, and GAAP1 were cloned into the vector pGEX-4T and named glutathione S-transferase (GST)–IRE1B-KR and GST–GAAP1, respectively. Pull-down assay was used to detect the association of GST–GAAP1 or GST–IRE1B-KR fusion protein with MAPR3-TAP. GST–GAAP1/GST–IRE1B-KR and GST were each synthesized in Escherichia coli and added to the proteins isolated from tobacco leaf cells which were transformed with 35S:MAPR3-TAP. GST or GST fusion proteins were pulled down using glutathione–agarose beads, and the complexes containing MAPR3-TAP were detected with anti-TAP.
Co-IP of interacting proteins
MAPR3-TAP and FLAG-GAAP1 were co-transformed into tobacco leaves. Leaves 2–3 d after transformation were ground in liquid nitrogen, and proteins were isolated as described previously (Iwata et al., 2008). We used anti-Flag M2 affinity gel (Sigma) to capture the FLAG-tagged proteins and IgG Sepharose 6 Fast Flow to capture the TAP-tagged proteins following the manufacturer's instructions. Western blot was performed using the anti-FLAG M2 antibody and peroxidase–anti-peroxidase soluble complex (Sigma).
Histochemistry and ion leakage measurement
Propidium iodide (PI) staining as a fluorescent indicator of cell membrane permeability was performed as previously described (Watanabe and Lam, 2008). The progression of cell death was assayed by measuring ion leakage from shoots after tunicamycin (TM) treatment. For each measurement, 20 shoots were immersed in 10 ml of distilled water with gentle shaking for 2 h at room temperature. The conductivity of the bathing solution was directly measured with a conductivity meter (Mettler Toledo SevenCompact S230). Measurements for each sample were performed at least in triplicate.
MDC staining, microscopy, and ATG8 lipidation assay
For monodansylcadaverine (MDC) staining, 5-day-old seedlings grown on solid MS plates were transferred to liquid MS medium plus 4 mM DTT or no DTT as a control with or without 1 μM concanamycin A (concA) for 10 h in the dark. The seedlings were stained with MDC as previously described (Liu et al., 2012). Seedlings were incubated with 0.05 mM MDC for 10 min, washed three times with phosphate-buffered saline (PBS), and MDC fluorescence was visualized using a DAPI-specific filter. The signal was determined in the cortical cells of the mature root region with a confocal laser scanning microscope (Leica TCS SP8II). The average numbers of autophagosomes in one cortical cell were analysed. The cell fluorescence image was captured by overlaying three frames in 10 μm and the settings such as laser power were kept constant. Four independent experiments were performed and >10 seedlings were used for the calculation for each genotype.
To characterize ATG8 lipidation, ATG8 and the ATG8–phosphatidylethanolamine (PE) adduct in the above samples were detected essentially as described previously (Chung et al., 2009; Zhuang et al., 2017). Protein samples were subjected to SDS–PAGE in the presence of 6 M urea and analysed by immunoblotting with anti-ATG8A (Abcam) at a dilution of 1:1000.
RNA sequencing and qRT–PCR analysis
Total RNA was extracted from 7-day-old seedlings of Col and mapr3-2 treated or not with 5 μg ml−1 TM for 5 h by using TRIzol reagent (Takara) following the manufacturer's instructions. RNA sequencing was carried out by the high-throughput genomics core facility of Majorbio Company (www.majorbio.com) following the protocols provided by Illumina, including mRNA sequencing library preparation, the addition of MID barcodes to the double-stranded cDNA fragments, and volume adjustment. Base calling and demultiplexing were performed using CASAVA and bclfastq1.6. Fragments per kilobase of exon per million reads mapped (FPKM) values were calculated using the RackJ software package (http://rackj.sourceforge.net/) with reads mapped to The Arabidopsis Information Resource 10 Genome. The FPKM values of the control and treatment samples were compared, and a significant difference was set as a false discovery rate (FDR) <0.05. Differential gene expression pattern clustering was performed using RStudio. Gene Ontology (GO) enrichment was computed using GO tools (https://github.com/tanghaibao/GOatools). A significant enrichment of the GO function was considered when the corrected P-value (P-FDR) was ≤0.05. Kyoto Encyclopedia of Genes and Genomes (KEGG) pathway analysis was performed using KOBAS.
For qRT–PCR analysis, RNA was extracted from 7-day-old seedlings at 5 h after 1 μg ml−1 or 5 μg ml−1 TM or mock treatment. Relative gene expression was the expression level of each gene in plants of different genotypes normalized to the level in the wild-type plants, both of which were normalized to ACTIN8 expression. The fold change (FC) of the treatment and control of each gene was transformed as log2 FC. Error bars represent the SE of two independent biological experiments with three technical replicates.
Results
Association of Arabidopsis GAAP1/GAAP3 with MAPR3
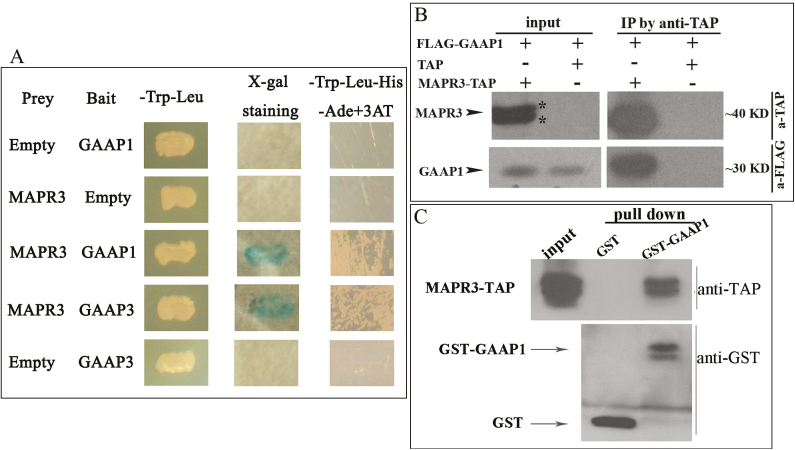
Arabidopsis GAAP1 can inhibit PCD induced by ER stress (Guo et al., 2018). To identify GAAP1-interacting proteins, we carried out a Y2H screen of an Arabidopsis cDNA library by using the full-length GAAP1 coding sequence as bait. Screening was performed based on the reconstitution of Ub protein halves (Cub and Nub) in a split-Ub system (Stagljar et al., 1998). Several positives were isolated from the 3.6×10⁵ screened colonies, and a clone encoded the full-length Arabidopsis MAPR3 protein (At3g48890). The interaction of GAAP1 with MAPR3 was retested in the split-Ub assay, and positive reactions are shown in Fig. 1A.
Fig. 1.
GAAP1/GAAP3 interacted with MAPR3 in vivo and in vitro. (A) GAAP1/GAAP3 interacted with MAPR3, shown by dual-membrane yeast two-hybrid assay. GAAP1/GAAP3 was used as bait and MAPR3 as prey. Yeast harbouring GAAP1/GAAP3 and MAPR3 showed a positive colour for the reporter lacZ assayed by X-gal staining and strong growth on SD-trp-leu-his-ade selection medium. Meanwhile, yeast harbouring the vector pairs only with GAAP1/GAAP3 or only MAPR3 showed negative results. (B) Flag-GAAP1 interacted with MAPR3-TAP fusion protein in tobacco leaf cells assayed by Co-IP. (C) Pull-down assay was used to detect the association of GST–GAAP1 fusion protein with MAPR3-TAP.
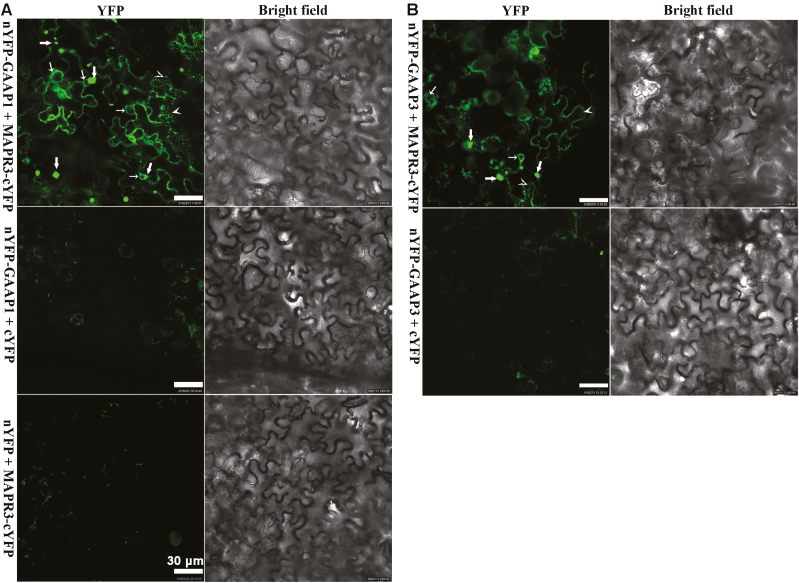
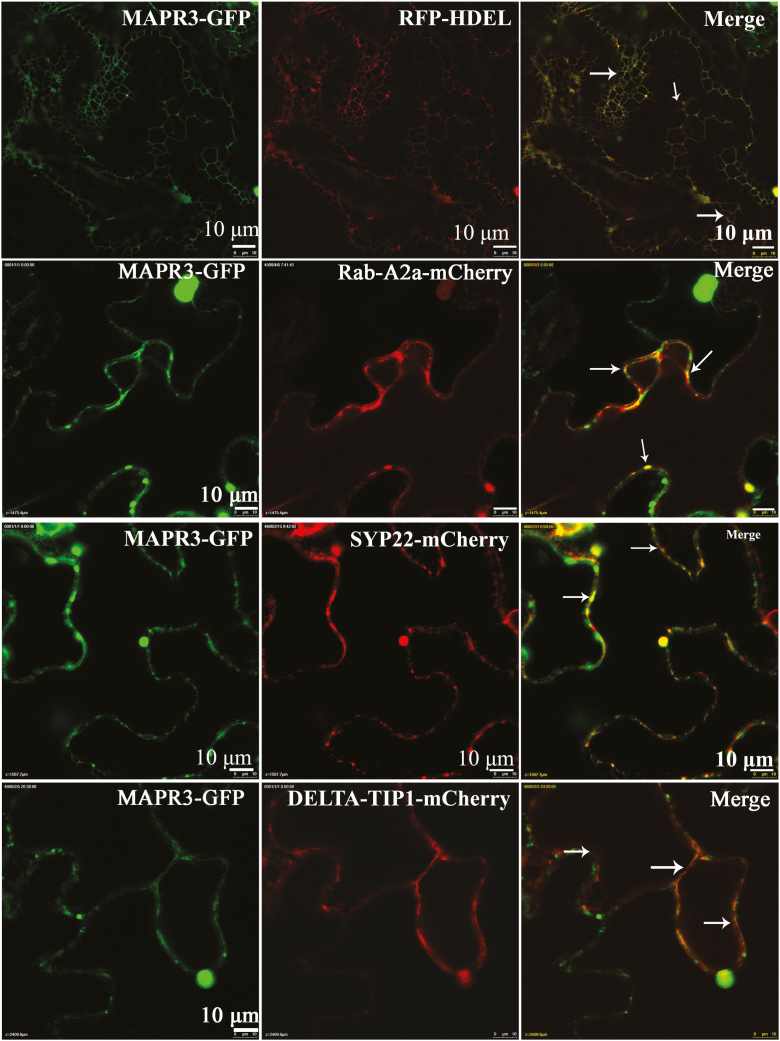
We studied the interaction between GAAP1/GAAP3 and MAPR3 in plants. Co-IP experiments using lysates from tobacco leaf cells that were co-transformed with MAPR3-TAP and FLAG-GAAP1 showed an association between both proteins (Fig. 1B). The association of GAAP1 with MAPR3 was also demonstrated by pull-down assays in tobacco leaves transiently overexpressing MAPR3-TAP driven by the Cauliflower mosaic virus 35S promoter. MAPR3-TAP can be pulled down with GST–GAAP1, and an empty vector control (GST) was used as the negative control (Fig. 1C). The functional association of GAAP1/GAAP3 with MAPR3 in vivo was further investigated using BiFC. For the BiFC assay, we fused the N-terminal halves of YFP to the N-termini of GAAP1 or GAAP3 and the C-terminal halves of yellow fluorescent protein (YFP) to the C-terminus of MAPR3. Strong YFP fluorescence was observed when nYFP–GAAP1/GAAP3 and MAPR3–cYFP were co-expressed in the tobacco leaf cells (Figs 2A, B), which indicated a physical interaction/association between them. Consistent with the result showing that GAAP1 and GAAP3 are located on the cytomembrane and ER (Guo et al., 2018), mesh fluorescent signals were found in the BiFC assay (indicated by arrowheads in Fig. 2). Punctate, granule, or ring signals were also observed (indicated by arrows in Fig. 2). Next, the MAPR3 compartment was tested for the presence of known organelle markers by high-resolution confocal laser microscopy. 35S::MAPR3–GFP and various organelle markers tagged with RFP or mCherry were co-expressed in the tobacco leaf cell. MAPR3–GFP co-localized with the ER marker RFP–HDEL (Fig. 3A), and partially co-localized with the early endosome marker Rab-A2a–mCherry (Markham et al., 2011) (Fig. 3B), the late endosome marker SYP22–mCherry (Fig. 3C), and the vacuolar marker DELTA-TIP1–mCherry (Hunter et al., 2007) (Fig. 3D), as indicated by a yellow signal present in the merged image in the tobacco leaf cell. The endosome and vacuolar marker proteins were also found in the puncta structure of MAPR3–GFP when both genes were co-expressed (Supplementary Fig. S1), which might be the mislocalization by overexpressing MAPR3. These data suggest that GAAP1/GAAP3 is associated with MAPR3 in the ER, and MAPR3 might also be localized in other endomembrane compartments.
Fig. 2.
GAAP1 and GAAP3 interacted with MAPR3 shown by BiFC assay. (A and B) YFP fluorescence was observed when nYFP–GAAP1/GAAP3 and MAPR3–cYFP were co-expressed in tobacco leaf cells, whilst only the background signal of chlorophyll was observed when nYFP–GAAP1/GAAP3 and cYFP or MAPR3–cYFP and nYFP were co-expressed. Thick arrows indicate punctate or granule signals, thin arrows point to rings, and arrowheads point to the mesh signals.
Fig. 3.
MAPR3 is located in the ER, cytoplasm, and possibly other endomembrane compartments.. The green and red fluorescence were observed when 35S::MAPR3–GFP and various organ markers tagged with RFP or mCherry were co-expressed in tobacco leaf cells. (A) MAPR3–GFP co-localized with the ER marker RFP–HDEL. (B–D) MAPR3–GFP partially co-localized with the early endosome marker RAB-A2a–mCherry (B),the late endosome marker SYP22–mCherry (C), and the vacular marker DELTA-TIP1–mCherry (D). Thin arrows indicate merged signals.
MAPR3 and GAAP1 or GAAP3 mutations enhanced plant sensitivity to ER stress
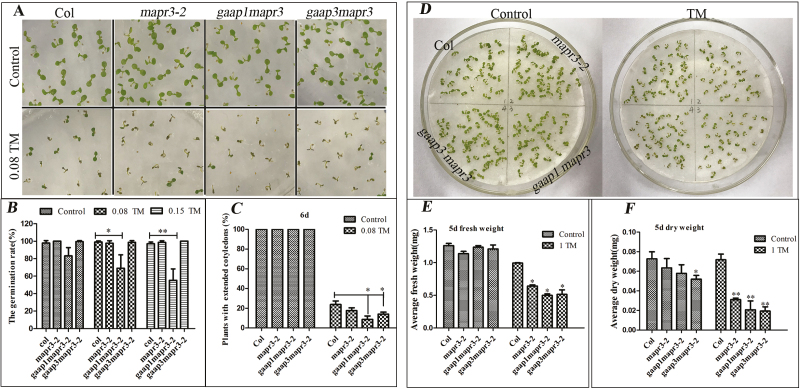
GAAP1 and GAAP3 resist ER stress redundantly (Guo et al., 2018). To determine whether MAPR3, the partner of GAAP1 and/or GAAP3, is also involved in this function, we obtained gene knock-down mutants mapr3-1 and mapr3-2 caused by T-DNA insertion in the promoter (Supplementary Fig. S2A, B). The hypersensitivity of mapr3-1 and mapr3-2 to TM or DTT treatment was similar whether assayed by root inhibition, cell membrane damage, or fresh weight inhibition (Supplementary Fig. S2B, C; and data not shown), and mapr3-2 was used for further experiments. The double mutants gaap1-1mapr3-2 (hereafter referred to as gaap1mapr3) and gaap3mapr3-2 (hereafter referred to as gaap3mapr3) in Col were generated by hybridization. Seeds of Col, mapr3-2, gaap1mapr3, and gaap3mapr3 harvested at the same time were vernalized for 3 d and plated on 1/2 MS medium containing 0, 0.08, and 0.15 μg ml−1 TM, respectively. No mutants exhibited evident growth defects except that the germination rate of gaap1mapr3 was lower but not significantly different from those of the other genotypes under normal conditions. The inhibition of germination by TM was more severe in gaap1mapr3 than in Col, whilst the germination rate of mapr3-2 and gaap3mapr3 was similar to that of Col in terms of the number of seedlings with an elongated radicle. The development of seedlings was inhibited in all plants upon TM treatment, and the percentage of healthy plants with fully expanded cotyledons was significantly lower in gaap1mapr3 and gaap3mapr3, and lower but not significantly different in mapr3-2 than in Col upon treatment with 0.08 μg ml−1 TM (Fig. 4A, B). Additionally, the sensitivity of mapr3-2, gaap1mapr3, and gaap3mapr3 to ER stress post-germination was assayed. The 4-day-old seedlings were infiltrated with 0 and 1.0 μg ml−1 TM for 6 h and then transferred to normal solid medium for another 5 d. The decreased fresh and dry seedling weight of the three mutants under TM treatment were significantly higher than those of the wild-type plants (Fig. 4D, E). These data suggest that MAPR3 functions in plant resistance to ER stress along with GAAP1 and GAAP3.
Fig. 4.
The mutation of GAAP1/GAAP3 and MAPR3 enhanced the sensitivity of plants to ER stress. (A–C) The seed germination was assayed under ER stress. Growth of Columbia (Col), mapr3-2, gaap1mapr3, and gaap3mapr3 seedlings on 1/2 MS medium supplied with different TM concentrations (0, 0.08, and 0.15 μg ml−1) for 6 d (A). Percentage of germinated plants (B) and percentage of seedlings with fully extended cotyledons grown on 1/2 MS medium with different TM concentrations for 6 d (C). Data are expressed as means ±SE. Significant differences compared with Col plants at the same concentration of TM are indicated by asterisks (χ 2 test; *P<0.05, **P<0.01, n=160). (D–F) Growth of Col, mapr3-2, gaap1mapr3, and gaap3mapr3, treated with 0 and 1.0 μg ml−1 TM for 6 h, and then transferred to the medium without TM for another 5 d (D); fresh and dry weight per plant were measured (E and F). Data are expressed as the mean ±SE. Significant differences compared with Col plants at the same concentration of TM are indicated by asterisks (t-test, *P<0.05, *P<0.01, n=6).
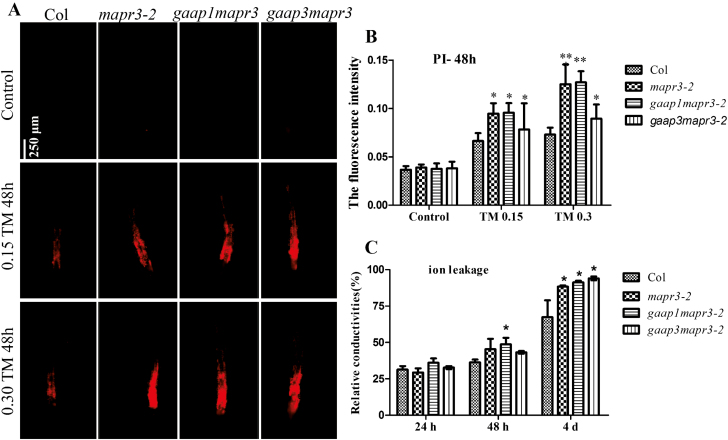
To determine further whether MAPR3, similarly to GAAP1 and GAAP3, can inhibit cell death, we evaluated the root cell viability of the mutants in response to TM for 48 h. The membrane permeability was assayed by PI staining, and the cells of mapr3 and gaap1mapr3 showed the strongest signals, followed by gaap3mapr3 double mutants (Fig. 5A, B). Impaired membranes indicated by electrical conductivity were also increased significantly in gaap1mapr3 seedlings, followed by mapr3-2 and gaap3mapr3 mutants upon TM treatment (Fig. 5C). These data suggest that MAPR3 associated with GAAP1 and/or GAAP3 confers increased tolerance to ER stress-induced cell death.
Fig. 5.
GAAP1/GAAP3 and MAPR3 mutation increased cell membrane permeability induced by ER stress. (A and B) Three-day-old seedlings that were vertically cultured were transferred to a new liquid medium containing different TM concentrations (0, 0.15, and 0.30 μg ml−1). Root cells of Col, mapr3-2, gaap1mapr3, and gaap3mapr3 treated or not with TM for 48 h were stained by PI (A), and the fluorescence intensity of PI staining was determined by ImageJ software (B). Error bars represent the SD. Significant differences compared with Col plants are indicated by asterisks at the same TM concentration (t-test; *P<0.05, **11P<0.01, n≥20). (C) Sterile 7-day-old seedlings were vacuum infiltrated with 0.15 μg ml−1 TM for 30 min, and the relative conductivity was determined at different times post-treatment. Data are expressed as means ±SD. Significant differences compared with Col plants at the same time are indicated by asterisks (Student's t-test, *P<0.05, n=5).
Mutation of GAAP1/GAAP3 and MAPR3 impaired ER stress-induced RIDD and autophagy
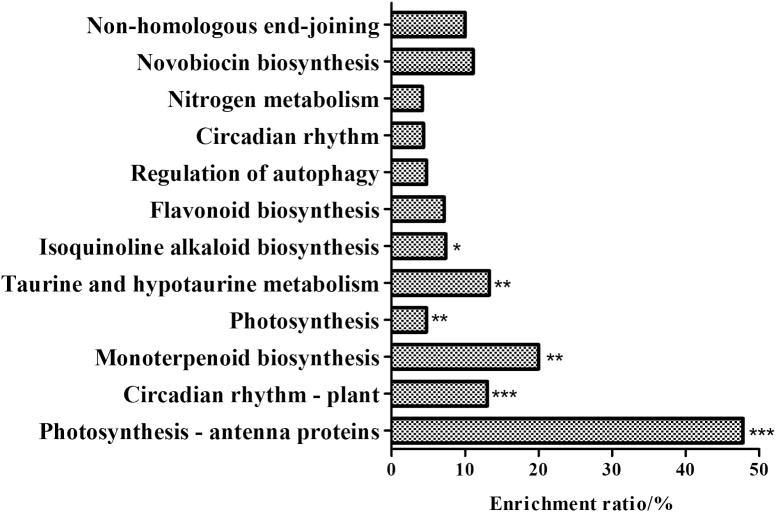
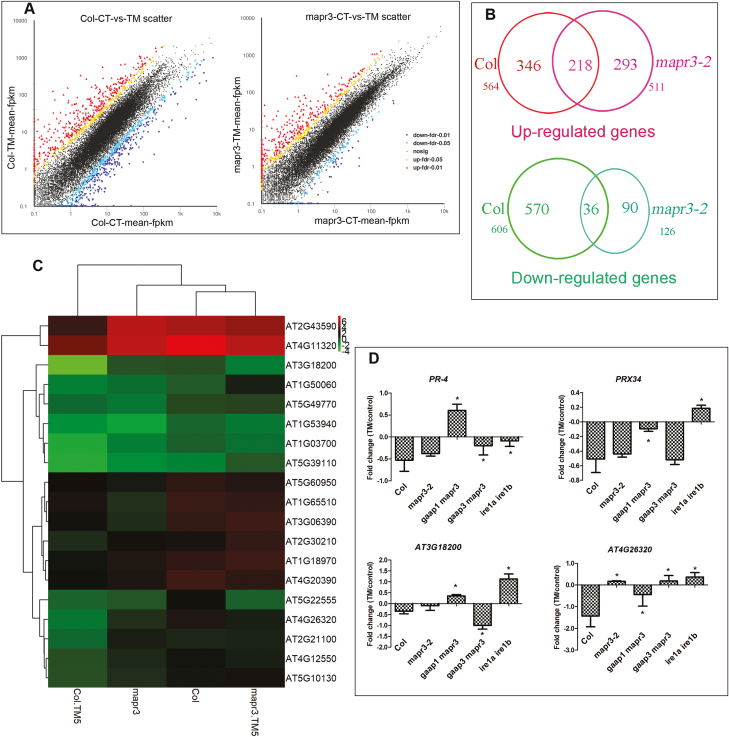
We investigated how MAPR3 and the association of GAAP1/GAAP3 with MAPR3 function in ER stress resistance. Seedlings of the wild type and mapr3-2 were mock or TM treated and subjected to whole-transcriptome analysis (RNA-seq). The enrichment rate of the differential genes in the KEGG pathway was analysed. Under normal conditions, the differential genes of Col and mapr3-2 were mainly involved in photosynthesis, circadian rhythm, anabolism of various secondary metabolites, regulation of cellular autophagy, and other biological pathways (Fig. 6). Upon TM treatment, we observed a similar number of significantly increased reads assigned FPKM values for Col and mapr3-2 (564 versus 511), and 218 values (38.7%) were common to both plants. However, far fewer down-regulated FPKM values were observed in mapr3 than in Col (126 versus 606) (Figs 7A, B; Supplementary Dataset S1).
Fig. 6.
Enrichment ratio of differential mapr3-2 genes compared with Col in KEGG pathways under control conditions. The enrichment ratio (%)=number of differential genes in one biological process/number of total genes in one biological process (Fisher's test; *P<0.05, **P<0.01, ***P<0.001).
Fig. 7.
RNA sequencing of Col and mapr3 showed the effects of MAPR3 on ER stress resistance. (A) Plot of reads assigned fragments per kilobase of exon per million reads mapped (FPKM) values for Col and mapr3 in the control versus seedlings after 6 h of 5 μg ml−1 TM treatment. Significantly up- or down-regulated genes are indicated by red or blue circles, respectively, whilst other data points are plotted in black. (B) Overlap of up- or down-regulated genes in Col and mapr3-2 upon TM treatment; the number of differentially expressed genes in each section is indicated. (C) Heatmap showing levels of transcript abundance of RIDD genes in Col and the mapr3 mutant under control conditions and 5 μg ml−1 TM treatment for 5 h. Gene expression values were log2 transformed. Down-regulated genes with log2 fold change (FC) of <−0.8) in Col and the difference in FC between Col and the mapr3 mutant upon TM treatment >1.5 were selected here. (D) qRT–PCR analysis of RIDD genes in 7-day-old mapr3-2, gaap1mapr3 gaap3mapr3, and ire1a ire1b plants pre-treated with 75 μM ActD for 2 h followed by 1 μg ml−1 TM treatment or mock treatment for 5 h. The relative gene expression was the expression level of each gene in plants of different genotype normalized to the level in the wild-type control, both of which were normalized to the expression of ACTIN8. The FC of treatment and control of each gene was transformed as log2 FC. Error bars represent ±SE of two independent biological experiments with three technical replicates. *Statistical differences between the mutant and Col (Student's t-test, *P<0.05).
We then determined whether the increased sensitivity of mapr3 to ER stress was the result of defects in UPR. RNA-seq showed that among 78 up-regulated downstream transcripts of bZIP28, 23 genes (29.5%) were up-regulated or unchanged by TM treatment (Supplementary Datasets S2, S3; Supplementary Fig. S3). The downstream gene IRE1-bZip60 was similarly increased in both genotypes (Supplementary Dataset S4). However, the FC of genes down-regulated by ER stress as RIDD was different between Col and mapr3-2. Few transcripts are down-regulated, as reported previously (Mishiba et al., 2013), due to TM treatment in the absence of ActD to prevent transcription. A total of 59 RIDD genes screened from previous literature were significantly reduced by TM treatment (log2 FC<−0.5) in Col, and cluster analysis of these genes showed that Col had a similar pattern to mapr3 (Supplementary Fig. S4). Of the 59 genes, 29 (47.50%) were reduced but 22 (37.3%) were increased in mapr3 (Supplementary Dataset S5). Of the 43 RIDD genes significantly down-regulated (log2 FC<−0.8) in Col, 19 (44.2%) were down-regulated or increased by TM in mapr3, and the difference in FC between mapr3 and Col was >1.5 (Supplementary Dataset S6). Cluster analysis of these batch genes in Col and the mapr3 mutant showed that Col under control conditions was similar to mapr3 treated with TM (Fig. 7C). qRT–PCR analysis also verified that the decay of some RIDD genes was induced in the mapr3 mutant (Supplementary Fig. S5). qRT–PCR analysis showed that the degradation of transcripts for these RIDD genes observed in Col were significantly affected in 7-day-old gaap1mapr3 and gaap3mapr3 plants upon TM treatment. The pattern of transcript change of some genes, such as At4G11320 (cysteine proteinase) and At1G50060 (cysteine-rich secretory proteins, antigen 5), was different in gaap1mapr3 and gaap3mapr3 (Supplementary Fig. S6). In order to determine whether the decrease in mRNA abundance was due to mRNA degradation rather than transcriptional attenuation, seedlings were pre-treated with ActD before TM treatment to prevent transcription. Genes for PR-4 and PRX34, which were considered as RIDD genes (Mishiba et al., 2013), along with two down-regulated genes were selected from the genes in Fig.7C . The down-regulation of these genes by TM treatment was inhibited in the ire1a ire1b double mutant (Fig. 7D), consistent with a previous study (Mishiba et al., 2013). Similar to the ire1a ire1b double mutant, the down-regulation of these genes was severely affected in gaap1mapr3 seedlings. The degradation of three genes was not affected in the mapr3-2 mutant, with the exception of one gene (At4G26320), and two genes were affected in gaap3mapr3 seedlings (Fig. 7D). These results suggest that mutations in MAPR3 and/or GAAP1/GAAP3 influence the IRE1-dependent pathway upon ER stress.
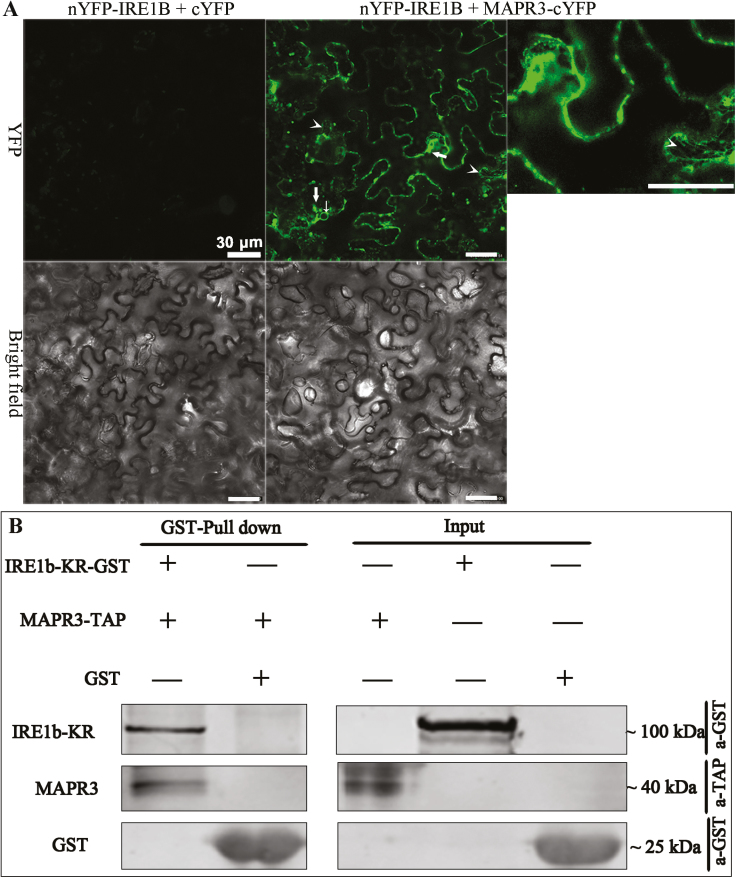
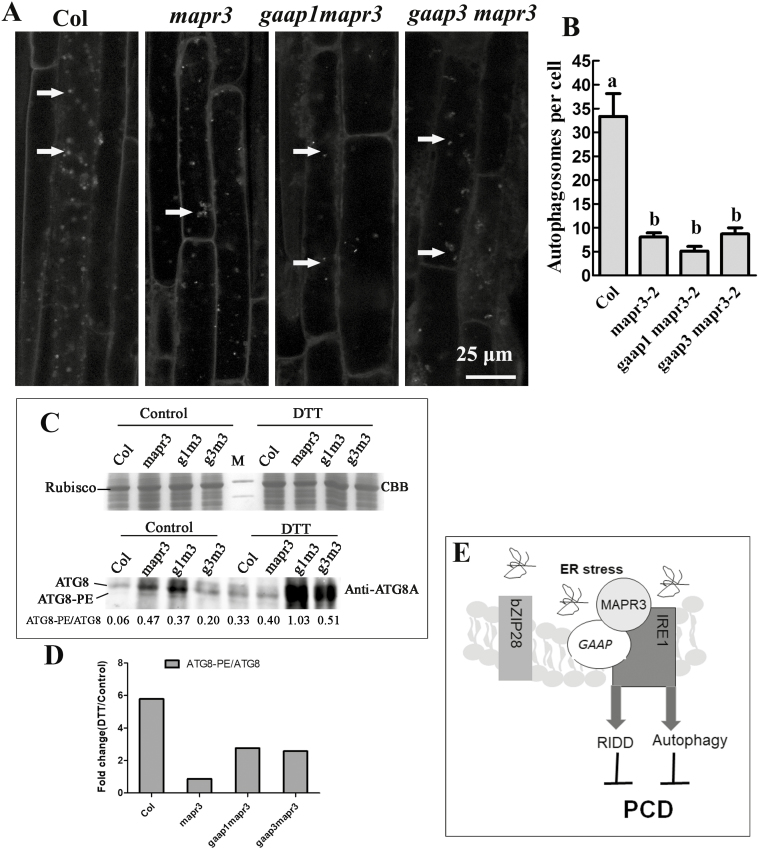
GAAP1/GAAP3 interacts with IRE1A (Guo et al., 2018). In the current study, BiFC assay showed that GAAP1/GAAP3 interacted with IRE1B (Supplementary Figs S7, S8). BiFC and GST pull-down assays were further performed and showed that MAPR3 also interacted with IRE1B (Fig. 8), but the protein interaction assays failed to detect an association between MAPR3 and IRE1A (Supplementary Fig. S9). In addition to the cytoplasmic splicing of mRNAs for bZIP60 and the degradation of mRNA encoding proteins in the secretory pathway referred to as RIDD decreasing the amount of proteins entering the ER in the UPR, IRE1s have a function in autophagy to clear the disabled proteins and organelle quickly (Liu and Howell, 2010b; Nagashima et al., 2011; Mishiba et al., 2013). To determine if MAPR3 is involved in autophagy-dependent IRE1B, we examined the induction of autophagy in mapr3-2, gaap1mapr3, and gaap3mapr3 compared with that in wild-type plants. Seedlings were treated with DTT followed by staining with MDC through which the autophagosomes or autophagy bodies can be observed. Similar to the result reported previously (Liu et al., 2012), under control conditions, all four genotypes showed very few autophagosomes. In response to DTT treatment, numerous autophagy bodies formed in the root cells of Col, while far fewer and fainter signals of autophagy bodies were observed in the three mutants than in Col (Fig. 9A). Quantitative analysis showed that the average number of autophagosomes in one cortical cell of the root mature region was significantly lower in the three mutants upon DTT treatment (Fig. 9B). There are two possibilities to explain the decreased number of autophagosomes seen in the mutants: either the formation of autophagosomes was affected, or the delivery to or degradation of autophagosomes in the vacuole was increased. To distinguish between these possibilities, the vacuolar H+-ATPase inhibitor concA was used to inhibit the degradation of autophagic bodies in the vacuole (Liu et al., 2012). A decreased number of autophagosomes was also found in the mutants with DTT treatment in the presence of concA (Supplementary Fig. S10). Biochemical detection of the lipidation of ATG8, the ATG8–PE adduct, is used as one of the principal methods for measurement of autophagic activity (Chung et al., 2009; Marshall and Vierstra 2018). The changes in ATG8 and ATG8–PE adduct levels were checked by immunoassay. Under normal conditions, the levels of both proteins were higher in the three mutants than in Col. ATG8 and ATG8–PE levels were elevated in plants after DTT treatment and were much higher in both double mutants than in Col (Fig. 9C). However, the ratio of ATG8-PE to ATG8 upon DTT treatment changed less in all mutants than in Col, which reflects the reduced autophagic flux upon ER stress (Fig. 9D). These data indicate that GAAP1/GAAP3 association with MAPR3 might be involved in regulating the autophagy induction upon ER stress-dependent IRE1B.
Fig. 8.
MAPR3 interacted with IRE1B. (A) BiFC assay showed that MAPR3 interacted with IRE1B in tobacco leaf cells. YFP fluorescence was observed when nYFP–IRE1B and MAPR3–cYFP were co-expressed, whilst only the background signal of chlorophyll was observed when nYFP–IRE1B and cYFP or MAPR3–cYFP and nYFP were co-expressed. Arrows indicate punctate or granule signals, and arrowheads point to the mesh or endosome-like signals. (B) The association of the GST–IRE1B fusion protein with MAPR3-TAP was detected by GST pull-down assay.
Fig. 9.
Mutations in MAPR3 and/or GAAP1/GAAP3 impaired the autophagy induced by ER stress. (A) Five-day-old seedlings of wild-type Col, mapr3-2, gaap1mapr3, or gaap3mapr3 were transferred to MS liquid medium supplemented with 4 mM DTT, followed by MDC staining. Then, roots were observed using confocal microscopy. Arrows indicate MDC-stained autophagosomes/autophagic bodies. Scale bar=25 μm. (B) The average number of MDC-stained autophagosomes per cortical cell in the root mature region was counted after DTT treatment as above. Data are average values ±SE (n=4) calculated from four independent experiments. For each experiment, >10 sections were used for the calculation for each genotype. Different lower case letters indicate significant differences (P<0.05 by two-way ANOVA and Tukey's range). (C) Total cellular proteins from the seedlings treated as in (A) were resolved on SDS–PAGE, stained with Coomasie brilliant blue (CBB) or probed with the ATG8A antibodies. The ratios of ATG8–PE to ATG8 in each line at the bottom were determined by ImageJ software. (D) The fold change of the ratio of ATG8–PE to ATG8 upon DTT treatment as in (C). (E) The working model in which GAAPs and MAPR3 are involved in regulating ER stress-induced autophagy and RNA decay by association with IRE1.
Discussion
BI-1-like proteins are conserved across eukaryotic cells and function in anti-cell death induced by various stresses. GAAPs belong to a subfamily of BI-1-like proteins. Arabidopsis has five genes encoding GAAPs. GAAP1 and GAAP3 are located on the cellular membrane, including the ER, and play redundant roles in resisting cell death in response to ER stress in addition to promoting the recovery of cell growth from the adaptive response through association with IRE1 when the cellular stress has been addressed (Guo et al., 2018). However, the mechanism of their anti-cell death function upon ER stress remains unclear. MAPR3 is one of the interaction factors of GAAP1 found through the Y2H technique, and the interaction between MAPR3 and GAAP1 or GAAP3 was determined by BIFC, Co-IP, and GST pull-down assay (Fig. 1). The single mutant mapr3, and the double mutants gaap1mapr3 and gaap3mapr3 were obtained to study the role of the interaction of GAAP1/GAAP3 with MAPR3 in response to ER stress. Under TM treatment, the hypersensitivity of gaap1mapr3, gaap3mapr3, and mapr3 in response to TM was shown by growth inhibition and cell death indicated by membrane permeability analysis (Figs 4, 5; Supplementary Fig. S2). These data suggest that MAPR3 and its interaction with GAAP1/GAAP3 function in resistance to ER stress.
MAPRs are membrane-type steroid-binding proteins localized to the ER or plasma membrane, and the MAPR homologous gene has been identified in plants, animals, and humans (Selmin et al., 2005; Yang et al., 2005). The MAPR protein family in animals includes progesterone receptor membrane component 1 (PGRMC1) and PGRMC2. PGRMC1 is involved in the anti-apoptotic response of follicular cells and promotes the death of breast cancer cells (Thomas, 2008; Kimura et al., 2012). MAPRs in Arabidopsis consist of four homologues, namely AtMAPR2 (AT2G24940), AtMAPR3 (AT3G48890, also known as MSBP2), AtMAPR4 (AT4G14965), and AtMAPR5 (AT5G52240, also known as MSBP1) (Iino et al., 2007). Whether these homologues have a redundant role in resistance to ER stress awaits further elucidation. We performed whole-transcriptome analysis to elucidate the mechanism by which MAPR3 functions in tolerance to ER stress. The results showed that far fewer down-regulated FPKM values were observed in mapr3 than in Col upon TM treatment (Fig. 7). UPR has two roles: increasing the protein folding capacity and decreasing the protein load in the ER (Walter and Ron, 2011). The bZIP28 and IRE1–bZIP60 pathways increase protein folding capacity in plants (Deng et al., 2011; Nagashima et al., 2011). The IRE1 pathway also functions for RIDD and autophagy to decrease protein load in the ER or to clear the damaged ER on time (Liu et al., 2012; Mishiba et al., 2013). Importantly, 44.2% of the TM-down-regulated gene transcripts observed in Col were impaired in mapr3 via RNA-seq assay (Figs 7; Supplementary Fig. S5). The transcripts of several down-regulated genes after TM treatment were monitored by qRT–PCR, and the results showed that the RNA degradation in Col was significantly defective in gaap1mapr3 and gaap3mapr3 (Supplementary Fig. S6). When the transcription was prevented by ActD treatment, the transcript decay upon TM treatment was found to be impaired in gaap1mapr3 similar to in the ire1a ire1b double mutant (Fig. 7D), which indicates that the RIDD targets were affected. While transcripts decay was affected partly in mapr3 and gaap3mapr3, the changed pattern of some RIDD genes was different in gaap1mapr3 and gaap3mapr3 (Figs 7D; Supplementary Fig. S6) probably because the function of GAAP1 differed from that of GAAP3 in some aspects. Consistent with the impaired RIDD pathway in the double mutants, GAAP1 and GAAP3 interacted with IRE1A and IRE1B, and MAPR3 interacted with IRE1B (Guo et al., 2018) (Fig. 8, Supplementary Figs S7, S8). In addition to RIDD, autophagy induced by TM is mediated by IRE1B to mitigate ER stress (Liu et al., 2012). In the current study, autophagy was attenuated significantly in gaap1mapr3, followed by gaap3mapr3 and mapr3 (Fig. 9; Supplementary Fig. S10). It is worth noting that the higher levels of ATG8 and ATG8–PE were detected in the background of the mutants assayed by immunoassay, while there were no obvious higher autophagosomes in the background of the mutants assayed by MDC staining. In addition, the levels of both protein forms were elevated in plants in response to DTT and were much higher in both double mutants (Fig. 9C). The reason for the improved level of ATG8 in the mutants needs further elucidation. However, the FCs of the ratio of ATG8–PE to ATG8 upon DTT treatment were less in all mutants (Fig. 9D), which also reflects the reduced autophagic induction upon ER stress. The enrichment rate of the differential Col and mapr3 genes in the KEGG pathway includes cellular autophagy (Fig. 6). These results suggest that MAPR3 and its partner GAAP1/GAAP3 display positive roles in RIDD and might also be involved in the regulation of autophagy induction dependent on association with IRE1B upon ER stress. This is at least part of the reason for the tolerance of MAPR3 and GAAP1/GAAP3 to ER stress. RNA-seq assay also showed that mutation in the MAPR3 gene decreased the up-regulation of some downstream genes in the bZip28 pathway upon ER stress (Supplementary Datasets S2, S3; Supplementary Fig. S3), which may also be the reason for the hypersensitivity of the mutants.
MAPR5, the homologue of MAPR3, is involved in the positive regulation of auxin polar transport by promoting vesicle transport (Yang et al., 2008). MAPR5 also accelerates the endocytosis of BAK1 and decreases the interaction level of BRI1 and BAK1 in vivo, resulting in the negative regulation of BR signalling (Song et al., 2009). Vesicle transport is involved in stress-induced autophagy, clearing damaged organelles and proteins, facilitating the maintenance of intracellular environment and cell survival (Üstün et al., 2017). MAPR5 is localized in the plasma membrane and endosomes or vesicles (Song et al., 2009). In the experiments presented here, we used fluorescent protein-tagged MAPR3 and organelle markers, and found that MAPR3 was localized in the ER, cytoplasm, and possibly other endomembrane compartments (Fig. 3). Whether MAPR3 play a role in vesicle transport to regulate autophagy needs further study. MAPR3 also interacted with IRE1B but not with IRE1A (Figs 8; Supplementary Fig. S9), and only receptor IRE1B mediates autophagy induced by ER stress (Liu et al., 2012). The output of IRE1B, autophagy, was produced by the association of MAPR3 with GAAP1/GAAP3.
In summary, GAAPs and MAPR3 might be involved in regulating ER stress-induced RNA decay and autophagy by association with IRE1 (Fig. 9E). However, the mechanisms underlying the occurrence of autophagy and RNA decay regulated by these factors in response to ER stress require further study.
Supplementary data
Supplementary data are available at JXB online.
Table S1. List of primers used in this research.
Dataset S1. A complete listing of FPKM values.
Dataset S2. Up-regulated genes in the bZIP28 pathway by TM treatment in the WT.
Dataset S3. Different fold up-regulated genes in the bZIP28 pathway by TM treatment in mapr3 and the WT.
Dataset S4. Up-regulated genes in the IRE1 pathway by TM treatment in the WT.
Dataset S5. Down-regulated genes in the IRE1 pathway by TM treatment in the WT.
Dataset S6. Different fold down-regulated genes in the IRE1 pathway by TM treatment in mapr3 and the WT
Fig. S1. The organelle marker proteins could be found in the puncta structure of 35S::MAPR3–GFP when they are co-expressed.
Fig. S2. MAPR3 transcripts level in mutants.
Fig. S3. Heatmap showing levels of transcript abundance of bZIP28 pathway genes.
Fig. S4. Heatmap showing levels of transcript abundance of RIDD genes.
Fig. S5. qRT–PCR analysis of RIDD genes in mapr3 and Col plants after TM treatment.
Fig. S6. qRT–PCR analysis of RIDD genes in gaap1mapr3 and gaap3mapr3 plants after TM treatment.
Fig. S7. GAAP1 interacted with IRE1A/IRE1B by BiFC assay.
Fig. S8. GAAP3 interacted with IRE1B by BiFC assay.
Fig. S9. MAPR3 did not associate with IRE1A shown by BiFC assay and Co-IP assay.
Fig. S10. Mutations in MAPR3 and/or GAAP1/GAAP3 impaired the autophagy induced by ER stress in the presence of concA.
Acknowledgements
This work was supported by the National Natural Science Foundation of China (no. 31670271) and the Shanghai Natural Science Program (no. 15ZR1410900). We thank Dr Lin Xu (Shanghai Institute of Plant Physiology and Ecology, Chinese Academy of Science), Dr Hong-Li Lian (Shanghai Jiao-Tong University), and Dr Hui Li (East China normal university) for kindly supplying the TAP fusion vector, pHB vector, and HDEL–RFP vector. The authors declare that the research was conducted in the absence of any commercial or financial relationships that could be construed as a potential conflict of interest.
Glossary
Abbreviations
- ActD
actinomycin D
- BI-1
Bax inhibitor-1
- BiFC
bimolecular fluorescence complementation
- Co-IP
co-immunoprecipitation
- ER
endoplasmic reticulum
- FPKM
fragments per kilobase of exon per million reads mapped
- GAAP
Golgi anti-apoptotic protein
- MAPR3
membrane-associated progesterone receptor 3
- PCD
programmed cell death
- PI
propidium iodide
- qRT-PCR
quantitative reverse transcription–PCR
- RIDD
regulated IRE1-dependent decay
- TM
tunicamycin
- UPR
unfolded protein response
References
- Chung T, Suttangkakul A, Vierstra RD. 2009. The ATG autophagic conjugation system in maize: ATG transcripts and abundance of the ATG8–lipid adduct are regulated by development and nutrient availability. Plant Physiology 149, 220–234. [DOI] [PMC free article] [PubMed] [Google Scholar]
- Deng Y, Humbert S, Liu JX, Srivastava R, Rothstein SJ, Howell SH. 2011. Heat induces the splicing by IRE1 of a mRNA encoding a transcription factor involved in the unfolded protein response in Arabidopsis. Proceedings of the National Academy of Sciences, USA 108,7247–7252. [DOI] [PMC free article] [PubMed] [Google Scholar]
- Deng Y, Srivastava R, Howell SH. 2013. Protein kinase and ribonuclease domains of IRE1 confer stress tolerance, vegetative growth, and reproductive development in Arabidopsis. Proceedings of the National Academy of Sciences, USA 110,19633–19638. [DOI] [PMC free article] [PubMed] [Google Scholar]
- Gu F, Nguyên DT, Stuible M, Dubé N, Tremblay ML, Chevet E. 2004. Protein-tyrosine phosphatase 1B potentiates IRE1 signaling during endoplasmic reticulum stress. Journal of Biological Chemistry 279, 49689–49693. [DOI] [PubMed] [Google Scholar]
- Guo K, Wang W, Fan W, et al. 2018. Arabidopsis GAAP1 and GAAP3 modulate the unfolded protein response and the onset of cell death in response to ER stress. Frontiers in Plant Science 9, 348. [DOI] [PMC free article] [PubMed] [Google Scholar]
- Hetz C, Bernasconi P, Fisher J, et al. 2006. Proapoptotic BAX and BAK modulate the unfolded protein response by a direct interaction with IRE1alpha. Science 312, 572–576. [DOI] [PubMed] [Google Scholar]
- Hetz C, Glimcher LH. 2009. Fine-tuning of the unfolded protein response: assembling the IRE1alpha interactome. Molecular Cell 35, 551–561. [DOI] [PMC free article] [PubMed] [Google Scholar]
- Hollien J, Weissman JS. 2006. Decay of endoplasmic reticulum-localized mRNAs during the unfolded protein response. Science 313, 104–107. [DOI] [PubMed] [Google Scholar]
- Hunter PR, Craddock CP, Di Benedetto S, Roberts LM, Frigerio L. 2007. Fluorescent reporter proteins for the tonoplast and the vacuolar lumen identify a single vacuolar compartment in Arabidopsis cells. Plant Physiology 145, 1371–1382. [DOI] [PMC free article] [PubMed] [Google Scholar]
- Ihara-Ohori Y, Nagano M, Muto S, Uchimiya H, Kawai-Yamada M. 2007. Cell death suppressor Arabidopsis bax inhibitor-1 is associated with calmodulin binding and ion homeostasis. Plant Physiology 143, 650–660. [DOI] [PMC free article] [PubMed] [Google Scholar]
- Iino M, Nomura T, Tamaki Y, Yamada Y, Yoneyama K, Takeuchi Y, Mori M, Asami T, Nakano T, Yokota T. 2007. Progesterone: its occurrence in plants and involvement in plant growth. Phytochemistry 68, 1664–1673. [DOI] [PubMed] [Google Scholar]
- Iwata Y, Fedoroff NV, Koizumi N. 2008. Arabidopsis bZIP60 is a proteolysis-activated transcription factor involved in the endoplasmic reticulum stress response. The Plant Cell 20, 3107–3121. [DOI] [PMC free article] [PubMed] [Google Scholar]
- Kimura I, Nakayama Y, Konishi M, Terasawa K, Ohta M, Itoh N, Fujimoto M. 2012. Functions of MAPR (membrane-associated progesterone receptor) family members as heme/steroid-binding proteins. Current Protein & Peptide Science 13, 687–696. [DOI] [PubMed] [Google Scholar]
- Li G, Zhang J, Li J, Yang Z, Huang H, Xu L. 2012. Imitation Switch chromatin remodeling factors and their interacting RINGLET proteins act together in controlling the plant vegetative phase in Arabidopsis. The Plant Journal 72, 261–270. [DOI] [PubMed] [Google Scholar]
- Liu JX, Howell SH. 2010a bZIP28 and NF-Y transcription factors are activated by ER stress and assemble into a transcriptional complex to regulate stress response genes in Arabidopsis. The Plant Cell 22, 782–796. [DOI] [PMC free article] [PubMed] [Google Scholar]
- Liu JX, Howell SH. 2010b Endoplasmic reticulum protein quality control and its relationship to environmental stress responses in plants. The Plant Cell 22, 2930–2942. [DOI] [PMC free article] [PubMed] [Google Scholar]
- Liu Y, Burgos JS, Deng Y, Srivastava R, Howell SH, Bassham DC. 2012. Degradation of the endoplasmic reticulum by autophagy during endoplasmic reticulum stress in Arabidopsis. The Plant Cell 24, 4635–4651. [DOI] [PMC free article] [PubMed] [Google Scholar]
- Luo D, He Y, Zhang H, Yu L, Chen H, Xu Z, Tang S, Urano F, Min W. 2008. AIP1 is critical in transducing IRE1-mediated endoplasmic reticulum stress response. Journal of Biological Chemistry 283, 11905–11912. [DOI] [PMC free article] [PubMed] [Google Scholar]
- Luo Q, Lian HL, He SB, Li L, Jia KP, Yang HQ. 2014. COP1 and phyB physically interact with PIL1 to regulate its stability and photomorphogenic development in arabidopsis. The Plant Cell 26, 2441–2456. [DOI] [PMC free article] [PubMed] [Google Scholar]
- Markham JE, Molino D, Gissot L, Bellec Y, Hématy K, Marion J, Belcram K, Palauqui JC, Satiat-Jeunemaître B, Faure JD. 2011. Sphingolipids containing very-long-chain fatty acids define a secretory pathway for specific polar plasma membrane protein targeting in Arabidopsis. The Plant Cell 23, 2362–2378. [DOI] [PMC free article] [PubMed] [Google Scholar]
- Marshall RS, Vierstra RD. 2018. Autophagy: the master of bulk and selective recycling. Annual Review of Plant Biology 69, 173–208. [DOI] [PubMed] [Google Scholar]
- Mishiba K, Nagashima Y, Suzuki E, Hayashi N, Ogata Y, Shimada Y, Koizumi N. 2013. Defects in IRE1 enhance cell death and fail to degrade mRNAs encoding secretory pathway proteins in the Arabidopsis unfolded protein response. Proceedings of the National Academy of Sciences, USA 110,5713–5718. [DOI] [PMC free article] [PubMed] [Google Scholar]
- Nagashima Y, Mishiba K, Suzuki E, Shimada Y, Iwata Y, Koizumi N. 2011. Arabidopsis IRE1 catalyses unconventional splicing of bZIP60 mRNA to produce the active transcription factor. Scientific Reports 1, 29. [DOI] [PMC free article] [PubMed] [Google Scholar]
- Ruberti C, Lai Y, Brandizzi F. 2018. Recovery from temporary endoplasmic reticulum stress in plants relies on the tissue-specific and largely independent roles of bZIP28 and bZIP60, as well as an antagonizing function of BAX-inhibitor 1 upon the pro-adaptive signaling mediated by bZIP28. The Plant Journal 93,155–165. [DOI] [PMC free article] [PubMed] [Google Scholar]
- Selmin O, Thorne PA, Blachere FM, Johnson PD, Romagnolo DF. 2005. Transcriptional activation of the membrane-bound progesterone receptor (mPR) by dioxin, in endocrine-responsive tissues. Molecular Reproduction and Development 70, 166–174. [DOI] [PubMed] [Google Scholar]
- Song L, Shi QM, Yang XH, Xu ZH, Xue HW. 2009. Membrane steroid-binding protein 1 (MSBP1) negatively regulates brassinosteroid signaling by enhancing the endocytosis of BAK1. Cell Research 19, 864–876. [DOI] [PubMed] [Google Scholar]
- Stagljar I, Korostensky C, Johnsson N, te Heesen S. 1998. A genetic system based on split-ubiquitin for the analysis of interactions between membrane proteins in vivo. Proceedings of the National Academy of Sciences, USA 95,5187-5192. [DOI] [PMC free article] [PubMed] [Google Scholar]
- Thomas P. 2008. Characteristics of membrane progestin receptor alpha (mPRalpha) and progesterone membrane receptor component 1 (PGMRC1) and their roles in mediating rapid progestin actions. Frontiers in Neuroendocrinology 29, 292–312. [DOI] [PMC free article] [PubMed] [Google Scholar]
- Üstün S, Hafrén A, Hofius D. 2017. Autophagy as a mediator of life and death in plants. Current Opinion in Plant Biology 40, 122–130. [DOI] [PubMed] [Google Scholar]
- Walter P, Ron D. 2011. The unfolded protein response: from stress pathway to homeostatic regulation. Science 334, 1081–1086. [DOI] [PubMed] [Google Scholar]
- Wan S, Jiang L. 2016. Endoplasmic reticulum (ER) stress and the unfolded protein response (UPR) in plants. Protoplasma 253, 753–764. [DOI] [PubMed] [Google Scholar]
- Watanabe N, Lam E. 2008. BAX inhibitor-1 modulates endoplasmic reticulum stress-mediated programmed cell death in Arabidopsis. Journal of Biological Chemistry 283, 3200–3210. [DOI] [PubMed] [Google Scholar]
- Watanabe N, Lam E. 2009. Bax Inhibitor-1, a conserved cell death suppressor, is a key molecular switch downstream from a variety of biotic and abiotic stress signals in plants. International Journal of Molecular Sciences 10, 3149–3167. [DOI] [PMC free article] [PubMed] [Google Scholar]
- Yang X, Song L, Xue HW. 2008. Membrane steroid binding protein 1 (MSBP1) stimulates tropism by regulating vesicle trafficking and auxin redistribution. Molecular Plant 1, 1077–1087. [DOI] [PubMed] [Google Scholar]
- Yang XH, Xu ZH, Xue HW. 2005. Arabidopsis membrane steroid binding protein 1 is involved in inhibition of cell elongation. The Plant Cell 17, 116–131. [DOI] [PMC free article] [PubMed] [Google Scholar]
- Zhuang X, Chung KP, Cui Y, Lin W, Gao C, Kang BH, Jiang L. 2017. ATG9 regulates autophagosome progression from the endoplasmic reticulum in Arabidopsis. Proceedings of the National Academy of Sciences, USA 114, E426–E435. [DOI] [PMC free article] [PubMed] [Google Scholar]
Associated Data
This section collects any data citations, data availability statements, or supplementary materials included in this article.


