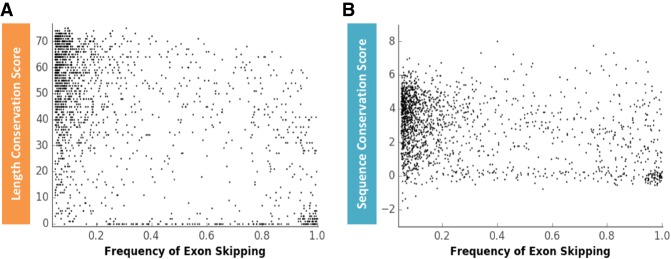
FIGURE 6.
Correlation between the frequency of alternative exon skipping and exon length or sequence conservation. (A) Correlation between exon length conservation (Ultra-In score) and the frequency of exon skipping (Pearson correlation coefficient: −0.484, P-value: 1.5 × 10−97). (B) Correlation between exon sequence conservation (phyloP score) and the frequency of exon skipping (Pearson correlation coefficient: −0.327, P-value: 1.5 × 10−42). Each black dot represents a skipped exon. X-axis scale: 0 = no exon skipping, 1 = 100% exon skipping.

