

This article has been corrected: Due to errors in image processing, the β-actin bands for MOLM-13 cell line in Figure 5 (C and D) were mistakenly presented. The proper Figure 5 (C and D) is shown below. In addition, the figure legends of Figure 2, 4, 7, and 8 are incorrect. The correction figure legends of Figure 2, 4, 7, and 8 are listed below. The authors declare that these corrections do not change the results or conclusions of this paper.
Original article: Oncotarget. 2017; 8:12764–12774. 12764-12774. https://doi.org/10.18632/oncotarget.14463
Figure 5. Effects of HHT, ibrutinib, HHT+ibrutinib on cell cycle distribution in AML cells.
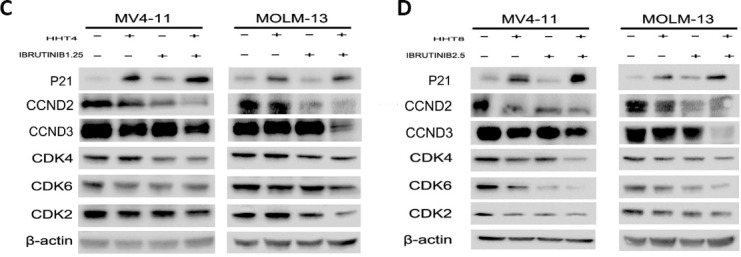
(A) MV4-11 and MOLM-13 cells were treated with 4 nM HHT and/or 1.25 μM ibrutinib for 24 h. (B) MV4-11 and MOLM-13 cells were treated with 8 nM HHT or/and 2.5 μM ibrutinib for 24 h. The cells were stained with propidium iodide and subjected to flowcytometry analysis to determine cell cycle distribution. (C and D) Soluble proteins P21, CCDN2, CCDN3, CDK4, CDK6, CDK2 and β-actin were analyzed by Western blotting analyses at the indicated concentrations for 24 h.
Corrections of figure legends
Figure 2: HHT and ibrutinib inhibit the growth of primary AML cells. FLT3-ITD + primary AML cells (A–C) and FLT3-ITD wt primary AML cells (D and E) were treated with HHT, ibrutinib and HHT+ibrutinib for 24 h. The rate of cell viability was measured by an MTT assay. The CI at the ED50, ED75 and ED90 were presented (F).
Figure 4: HHT combined with ibrutinib inhibits BCL-2 family signaling. (A) MV4-11 and MOLM-13 cells were treated with 4 nM HHT and/or 1.25 ibrutinib for 6 h. (B) MV4-11, MOLM-13 and primary AML cells were treated with 8 nM HHT and/or 2.5 μM ibrutinib for 6 h. Western blot analysis was conducted for p-Bad, Bad, Bax, Bcl-2, Bcl-xL and Mcl-1protein levels.
Figure 7: HHT combined with ibrutinib inhibits STAT5, AKT signaling. (A) MV4-11 and MOLM-13 cells were treated with 4 nM HHT and/or 1.25 ibrutinib for 6 h. (B) MV4-11, MOLM-13 and primary AML cells were treated with 8 nM HHT or/and 2.5 μM ibrutinib for 6 h. Western blot analysis was conducted for p-AKT-S473, total AKT, p-STAT5, STAT5, p-ERK, ERK, Pim-1, Pim-2 and C-Myc protein levels.
Figure 8: The level of main target proteins were analyzed when cells were exposed to drugs for 6h. MV4-11, MOLM-13 and primary AML cells were treated with 8 nM HHT and/or 2.5 μM ibrutinib for 6h. Western blot analysis was conducted for FLT3, p-FLT3, BTK, and p-BTK223 protein levels.