

Abstract
One postpartum behaviour that may be protective against diabetes is lactation due to its potential role in resetting maternal metabolism after pregnancy. However, the role of lactation in maternal risk of diabetes has not been investigated in Latin American populations, where rates of breastfeeding are suboptimal and diabetes incidence is increasing. Therefore, our aim was to estimate the association between mean duration of lactation per child and maternal incidence of diabetes. We followed 66,573 women from the Mexican Teachers' Cohort free of diabetes at baseline. Incident diabetes was ascertained through triennial questionnaires and lactation history was asked in baseline questionnaire. We used Cox proportional hazards regression models to estimate the hazard ratio (HR) for diabetes by mean duration of lactation per child. We examined the dose–response association between lactation per child and diabetes with restricted cubic splines. We found that 3,168 incident cases of diabetes were diagnosed during 157,510 person years of follow‐up. In comparison with women who did not breastfed, women with a mean lactation per child of 3 to <6 months and 6 to <12 months had HRs of 0.81 (95% CI [0.65, 0.99]) and 0.73 (95% CI [0.59, 0.91]), respectively (p for quadratic term 0.004). There was no further decline in risk of diabetes after ≥12 months of lactation per child. The dose–response association between lactation and diabetes was linear up to 9 months of lactation. Our findings suggest that lactation is associated with reduced incidence of diabetes, indicating considerable potential for diabetes prevention on a population level.
Keywords: breastfeeding, diabetes, lactation, maternal health, Mexican Teachers' Cohort
Key messages.
The greater decrease in maternal risk of diabetes was reached in women who breastfed on average 6 to <12 months per child. Using restricted cubic splines, the association was linear up to 9 months of lactation per child, after which the lower maternal risk of diabetes reached a plateau.
The non‐linear association between the mean duration of lactation per child and maternal risk of diabetes could potentially be explained by the fact that after 12 months of age the frequency and intensity of lactation decrease as breast milk provides just a third of energy needs in children aged 12 and 24 months.
Less long‐term weight gain experienced by women who breastfed do not fully explain the association between lactation and diabetes.
1. INTRODUCTION
Increasing evidence shows that diabetes adversely affects women more than men due to both differential access to health care and biological factors (e.g., reproductive factors such as age at menarche, pregnancy, and lactation; The Lancet Diabetes & Endocrinology, 2017). Thus, identifying easily modifiable lifestyle risk factors to prevent diabetes among women is a public health priority. Longer lactation duration appears to reduce diabetes risk (Aune, Norat, Romundstad, & Vatten, 2014; Jager et al., 2014) by resetting maternal metabolism (Stuebe & Rich‐Edwards, 2009) improving glucose homeostasis, reducing the β cell load, and preserving their function after pregnancy (Karnik et al., 2007; Labriola et al., 2007). However, a recent meta‐analysis suggests that the association between lactation per child and the risk of diabetes reaches a plateau after the first months of lactation (Aune et al., 2014). This suggests that intensity rather than the duration of lactation could have a major role in decreasing the risk of diabetes.
The role of lactation in diabetes risk has not been investigated in Latin American populations, where rates of breastfeeding are suboptimal and diabetes incidence is increasing. Therefore, the aim of this study was to prospectively assess the association between mean duration of lactation per child and maternal incidence of diabetes in a well‐established prospective cohort of Mexican women.
2. METHODS
2.1. Study population
This study was based on the Mexican Teacher's Cohort (MTC), described elsewhere (Lajous et al., 2017). Briefly, MTC is a prospective cohort of female teachers of 25 years and older from 12 states of Mexico enrolled in 2006–2008. Women who responded to the baseline questionnaire in 2006–2008 were eligible for this study. From 115,314 eligible participants, we excluded 3,318 women for having incomplete or invalid information on reproductive history. We further excluded nulliparous women (n = 16,656); women with prevalent diabetes (n = 6,747), cardiovascular disease (n = 1,188), and cancer (n = 2,281); and women with missing data on lactation history (n = 18,551). Thus, the final analytical sample was 66,573 women. All women provided informed consent at baseline. The study was approved by the Institutional Review Board at the National Institute of Public Health of Mexico (INSP for its Spanish name).
2.2. Assessment of mean duration of lactation per child
We used the history of lactation reported in the 2006 baseline questionnaire and added information from the 2008 questionnaire for those women who had not reported their history of lactation in 2006 but did so in 2008. Women who provided information in 2006 were asked if they had breastfed and the total lifetime duration of lactation for all pregnancies in months, and women who provided information in 2008 reported the number of live births and stillbirths. For each live birth, women were asked if they had breastfed and the duration of breastfeeding in months.
For all women, total breastfeeding in months was divided by the number of live births to obtain the mean duration of lactation per child. Mean duration of lactation per child was categorized as follow: 0, <3, 3–<6, 6–<12, and ≥12 months. No information on the type of breastfeeding (i.e., exclusive, predominant, or partial) was available.
2.3. Assessment of incident diabetes
On each triennial questionnaire, participants were asked whether they had been diagnosed with type 2 diabetes during the previous 3 years. We defined incident type 2 diabetes if women answered at least one of three following questions: medical diagnosis of diabetes, the use of pharmacological treatment (hypoglycaemic pills or insulin), and/or date of diabetes diagnosis.
We evaluated the validity of type 2 diabetes self‐reports using a subsample of 3,140 participants who reported having type 2 diabetes at enrolment in the cohort and who responded to a supplementary questionnaire in the first follow‐up with extensive questions on diagnosis, treatment, and diabetes‐related complications. We developed a case‐confirmatory algorithm that utilized information on whether the participant confirmed the diagnosis of type 2 diabetes, the use of pharmacological treatment (hypoglycaemic pills or insulin), and/or control of type 2 diabetes through diet and exercise. Based on the algorithm, the positive predictive value of self‐report was 89% (95% CI [87.5, 90.0]).
2.4. Assessment of covariates
Age, age at first birth, age at menarche, smoking (current, past, and never), diet, physical activity, educational level, socio‐economic status (SES), and marital status were derived from the self‐reported baseline questionnaire. Usual diet during the previous year before enrolment was assessed using a semiquantitative 141‐item food frequency questionnaire. The validity of our dietary assessment questionnaire has been previously described (Hernandez‐Avila et al., 1998). Three major energy adjusted orthogonal‐transformed dietary patterns scores were identified and derived using factor analysis: “Healthy” (based on fruits, vegetables, and legumes); “Western” (pizza, hamburgers, unprocessed, and processed red meats); and “Modern Mexican” (corn tortillas, hot peppers, sodas, and Mexican street‐food; Monge et al., 2018). Physical activity was ascertained by frequency of engaging in common recreational activities, from which metabolic equivalent task hours per week were derived based on the amount and intensity of reported physical activity. SES was defined as tertiles of the sum of questions on ownership of seven household assets: phone, car, computer, vacuum cleaner, microwave oven, cell phone, and internet. We classified women in these tertiles into low, medium, and high SES. Educational level was categorized into high school, graduate, and postgraduate, and marital status was categorized as single, married/cohabitating, and divorce/widow. Weight change was defined as the difference between current weight and weight at 18 years of age. A prior validation study in the MTC showed a correlation coefficient of 0.89 between current self‐reported and objectively measured weight (Ortiz‐Panozo et al., 2017).
2.5. Statistical analysis
The hazard ratio (HR) and 95% confidence intervals (CIs) for incident diabetes by mean duration of lactation per child were estimated using Cox proportional hazards regression models. Women contributed person years from the date they returned their baseline questionnaire to the date of diagnosis of diabetes or the date of response to their last questionnaire, whichever came first. The date of diagnosis was imputed to the midpoint between the date of response to the baseline questionnaire and the date of response to the questionnaire where they self‐report having diabetes.
We defined two models a priori with progressive adjustment of potential confounders: Model 1 (age‐adjusted) and Model 2 (Model 1 + Parity + Family history of diabetes + Age at menarche + History of gestational diabetes + Educational level + SES). Additionally, in an exploratory analysis, we further adjusted for current behaviours, Model 3 (Model 2 + Dietary pattern + Physical activity + Smoking status) that can be considered either confounders (as correlates of previous exposure behaviours) or postexposure variables, and BMI at 18 years, Model 4 (Model 3 + BMI at 18 years). Furthermore, because weight change from 18 years to current age could be a potential mediator of this association, we conducted multivariable analysis with and without adjusting for weight change from 18 years to current age. We conducted tests of linear trend across categories of mean duration of lactation per child by assigning the median value for each category and fitting this continuous variable in the models and a quadratic term of this same variable to evaluate the quadratic trend.
|For covariates with missing values SES (7%), smoking status (3%), educational level (5%), and average gestational weight gain (1.5%), we imputed values using a multiple imputation method to reflect the uncertainty around the “true” value and produce unbiased estimates assuming the missingness at random.
We evaluated potential effect measure modification stratifying the multivariate adjusted Model 4 according to median of age (<44/≥44 years), BMI at 18 years (<21/≥21 kg/m2), age at first pregnancy (<25/≥25 years), parity (<2/≥2 children), and history of gestational diabetes (yes/no). The interaction between lactation per child and potential modifiers was examined using the log‐likelihood ratio test.
We examined the possibility of a non‐linear dose–response relation between mean duration of lactation per child and diabetes risk using restricted cubic splines (Durrleman & Simon, 1989) with knots at 3, 6, 9, and 12 months of lactation per child distribution. Adjustment was made for age, BMI at 18 years, family history of diabetes, age at menarche, history of gestational diabetes, educational level, SES, dietary pattern, physical activity, and smoking status. Tests for non‐linearity used the log‐likelihood ratio test, comparing the model with only the linear term with the model with the linear and the cubic spline terms.
In a sensitivity analysis, we used a more rigorous definition of incident diabetes and conducted analysis using as an exposure variable “total duration of lactation” to enhance comparability with other studies. We defined incident “treated diabetes” if women self‐reported medical diagnosis of diabetes with pharmacological treatment. The positive predictive value for this definition was 92% (95% CI [91.1, 93.3]). All statistical tests were two sided and considered statistically significant if p < .05. All analyses were conducted using Statistical Analysis System software package, Version 9.3 (SAS Institute, Cary, NC).
3. RESULTS
We identified 3,168 incident cases of diabetes during 157,510 person years of follow‐up. The median follow‐up duration was 2.1 years (IQR 0.3, 7.7 years). In this population, the median of total duration of lactation was 12 months (IQR 6, 21), and the median duration of lactation per child was 5.0 months (IQR 3, 8). Women who breastfed for longer periods per child had slightly lower current BMI and weight at 18 years; were more likely to be married, to engage in vigorous physical activity, and to have a healthy dietary pattern; and were less likely to be smokers, compared with women with the shortest duration of lactation per child (Table 1).
Table 1.
Baseline characteristics of 66,573 parous women in the Mexican Teachers' Cohort according to mean duration of lactation per child
| Mean duration of lactation per child | |||||
|---|---|---|---|---|---|
| 0 month (n = 2,746) |
<3 months (Median = 1.8) (n = 15,457) |
3–<6 months (Median = 4.0) (n = 19,938) |
6–< 12 months (Median = 7.7) (n = 20,041) |
≥12 months (Median = 14.7) (n = 8,391) |
|
| Age (year) | 47.4 (6.9) | 46.2 (7.3) | 45.7 (7.2) | 45.0 (7.2) | 44.4 (7.3) |
| Age at first birth (year) | 24.2 (4.3) | 24.9 (4.5) | 24.9 (4.4) | 25.2 (4.5) | 25.4 (4.6) |
| Age at menarche (year) | 12.4 (1.4) | 12.5 (1.4) | 12.5 (1.4) | 12.6 (1.5) | 12.7 (1.7) |
| Parity (median, IQR) | 3 (2,4) | 3 (2,3) | 3 (2,3) | 2 (2,3) | 2 (2,3) |
| Weight at 18 years (kg) | 52.6 (8.3) | 52.6 (8.2) | 52.2 (7.8) | 52.1 (7.5) | 52.1 (7.6) |
| Current weight (kg) | 70.4 (13.2) | 69.4 (12.8) | 68.7 (12.2) | 68.3 (11.9) | 68.3 (12.1) |
| Current BMI (kg/m2) | 28.2 (4.8) | 27.8 (4.6) | 27.6 (4.5) | 27.5 (4.4) | 27.6 (4.4) |
| Weight change from 18 years to current age (kg) | 18.0 (11.5) | 17.0 (11.1) | 16.7 (10.7) | 16.5 (10.6) | 16.4 (10.6) |
| Family history of diabetes (%) | 56.9 | 56.9 | 56.8 | 55.9 | 56.2 |
| History of gestational diabetes (%) | 1.7 | 1.2 | 1.1 | 0.9 | 0.7 |
| Dietary pattern (%) | |||||
| Healthy (Quintile 5) | 19.3 | 19.2 | 20.4 | 20.7 | 19.8 |
| Western (Quintile 5) | 22.1 | 22.4 | 32.8 | 26.8 | 9.5 |
| Modern Mexican (Quintile 5) | 24.0 | 21.6 | 19.2 | 18.7 | 22.2 |
| Physical activity (METs hr/week) | 32.0 (30.6) | 32.9 (31.5) | 34.5 (32.5) | 35.7 (33.5) | 35.7 (33.1) |
| Married (%) | 77.2 | 76.0 | 78.4 | 79.7 | 78.7 |
| Smoking history (%) | |||||
| Never | 72.8 | 75.3 | 76.4 | 80.5 | 83.8 |
| Former | 16.3 | 13.7 | 13.2 | 11.3 | 9.5 |
| Current | 10.9 | 11.0 | 10.4 | 8.2 | 6.7 |
| Postgraduate education (%) | 13.1 | 13.6 | 14.1 | 13.5 | 12.2 |
| Socio‐economic status (%) | |||||
| Low (Tertile 1) | 16.9 | 17.2 | 16.7 | 20.7 | 27.1 |
| Medium (Tertile 2) | 28.0 | 26.9 | 28.8 | 29.6 | 30.5 |
| High (Tertile 3) | 55.1 | 55.8 | 54.4 | 49.6 | 42.4 |
Note. Values are mean (SD) unless otherwise specified.
The association between mean duration of lactation per child and diabetes incidence appeared to be nonlinear. We found that women who breastfed on average 6 to 12 months per child had a lower risk of diabetes compared with women who did not breastfeed and that maternal risk of diabetes no longer decreased after ≥12 months of lactation per child. In comparison with women who did not breastfed, women with a mean duration of lactation per child of <3, 3, to <6 months; 6 to <12 months; and ≥12 months had HRs of 0.85 (95% CI [0.68, 1.10]), 0.81 (95% CI [0.65, 0.99]), 0.73 (95% CI [0.59, 0.91]), and 0.84 (95% CI [0.66, 1.06]), respectively (p for quadratic trend 0.004; Table 2). The magnitude of this association slightly decreased but remained statistically significant, when we further adjusted for weight change from 18 years to current age: HRs of 0.87 (95% CI [0.70, 1.08]), 0.81 (95% CI [0.66, 1.00]), 0.73 (95% CI [0.58, 0.90]), and 0.82 (95% CI [0.64, 1.04]) for <3, 3, to <6 months; 6 to <12 months; and ≥12 months of mean duration of lactation per child, respectively (Table 2).
Table 2.
Hazard ratios (95% CI) of diabetes by mean duration of lactation per child in the Mexican Teachers' Cohort
| Mean duration of lactation per child | p trend | P for quadratic trend | |||||
|---|---|---|---|---|---|---|---|
| 0 months (n = 2,746) |
<3 months (Median = 1.8) (n = 15,457) |
3–<6 months (Median = 4.0) (n = 19,938) |
6–<12 months (Median = 7.7) (n = 20,041) |
≥12 months (Median = 14.7) (n = 8,391) |
|||
| Cases of diabetes (n) | 176 | 823 | 950 | 839 | 380 | ||
| Person years (n) | 6,859 | 37,439 | 47,602 | 46,611 | 18,999 | ||
| Age‐adjusted | Reference | 0.83 [0.70, 0.98] | 0.78 [0.66, 0.92] | 0.71 [0.60, 0.84] | 0.81 [0.68, 0.97] | 0.06 | 0.0001 |
| Multivariate 1a | Reference | 0.88 [0.73, 1.07] | 0.84 [0.69, 1.01] | 0.74 [0.61, 0.90] | 0.84 [0.68, 1.04] | 0.06 | 0.002 |
| Multivariate 2b | Reference | 0.84 [0.68, 1.05] | 0.80 [0.65, 0.99] | 0.73 [0.59, 0.91] | 0.83 [0.65, 1.05] | 0.20 | 0.001 |
| Multivariate 3c | Reference | 0.85 [0.68, 1.06] | 0.81 [0.65, 0.99] | 0.73 [0.59, 0.91] | 0.84 [0.66, 1.06] | 0.20 | 0.004 |
| Multivariate 4d | Reference | 0.87 [0.70, 1.08] | 0.81 [0.66, 1.00] | 0.73 [0.58, 0.90] | 0.82 [0.64, 1.04] | 0.07 | 0.004 |
Adjusted for age, parity, family history of diabetes, age at menarche, history of gestational diabetes, educational level, and socio‐economic status.
Adjusted for age, parity, family history of diabetes, age at menarche, history of gestational diabetes, educational level, socio‐economic status, dietary pattern, physical activity, and smoking status.
Adjusted for age, parity, family history of diabetes, age at menarche, history of gestational diabetes, educational level, socio‐economic status, dietary pattern, physical activity, smoking status, and BMI at 18 years.
Adjusted for age, parity, family history of diabetes, age at menarche, history of gestational diabetes, educational level, socio‐economic status, dietary pattern, physical activity, smoking status, BMI at 18 years, and weight change from 18 years to current age.
All tests for interaction were not statistically significant, except for age at first pregnancy (p for interaction = 0.03). When stratifying the models, the inverse association between mean duration of lactation per child and risk of diabetes was stronger for women with age at first pregnancy below the median (<25 years), for women with current BMI <27 kg/m2, and for those without history of gestational diabetes (Table 3).
Table 3.
Hazard ratios (95% CI) of diabetes by mean duration of lactation per child in the Mexican Teachers' Cohort
| Mean duration of lactation per child | p trend | p for quadratic trend | P for interaction | |||||
|---|---|---|---|---|---|---|---|---|
| 0 months | <3 months | 3–<6 months | 6–<12 months | ≥12 months | ||||
| Current age | ||||||||
| <44 years | Reference | 1.10 [0.57, 2.14] | 0.96 [0.50, 1.85] | 0.97 [0.50, 1.87] | 1.21 [0.61, 2.40] | 0.49 | 0.20 | 0.18 |
| ≥44 years | Reference | 0.87 [0.68, 1.11] | 0.85 [0.66, 1.08] | 0.72 [0.56, 0.92] | 0.80 [0.60, 1.05] | 0.03 | 0.03 | |
| BMI at 18 years | ||||||||
| <21 kg/m2 | Reference | 1.01 [0.72, 1.43] | 0.95 [0.68, 1.33] | 0.82 [0.58, 1.16] | 0.89 [0.60, 1.30] | 0.11 | 0.16 | 0.82 |
| ≥21 kg/m2 | Reference | 0.82 [0.60, 1.12] | 0.79 [0.58, 1.07] | 0.70 [0.51, 0.96] | 0.83 [0.59, 1.17] | 0.43 | 0.02 | |
| Age at first pregnancy | ||||||||
| <25 years | Reference | 0.85 [0.63, 1.14] | 0.78 [0.58, 1.04] | 0.74 [0.55, 0.99] | 0.74 [0.52, 1.04] | 0.08 | 0.17 | 0.03 |
| ≥25 years | Reference | 1.03 [0.69, 1.53] | 1.02 [0.69, 1.52] | 0.83 [0.55, 1.23] | 1.10 [0.72, 1.69] | 0.87 | 0.02 | |
| Parity | ||||||||
| <2 children | Reference | 0.70 [0.25, 1.94] | 0.53 [0.19, 1.48] | 0.53 [0.19, 1.48] | 0.65 [0.23, 1.85] | 0.63 | 0.05 | 0.67 |
| ≥2 children | Reference | 0.90 [0.71, 1.14] | 0.89 [0.70, 1.12] | 0.77 [0.61, 0.98] | 0.86 [0.66, 1.13] | 0.12 | 0.05 | |
| History of gestational diabetes | ||||||||
| Yes | Reference | 1.44 [0.38, 5.40] | 1.22 [0.33, 4.60] | 1.04 [0.27, 3.97] | 1.17 [0.24, 5.77] | 0.57 | 0.81 | 0.98 |
| No | Reference | 0.84 [0.68, 1.03] | 0.81 [0.66, 0.99] | 0.73 [0.59, 0.90] | 0.83 [0.66, 1.04] | 0.20 | 0.004 | |
Note. Adjusted for age, parity, family history of diabetes, age at menarche, history of gestational diabetes, educational level, socio‐economic status, dietary pattern, physical activity, smoking status, and BMI at 18 years.
Results from sensitivity analysis using a rigorous definition of incident diabetes (“treated‐diabetes”) yielded similar results, in that there was lower risk to develop diabetes for women who breastfed on average 6 to 12 months per child and that maternal risk of diabetes no longer decreased after ≥12 months of lactation per child (Table S1). In addition, when using as an exposure variable the total (cumulative) duration of lactation, we observed that the strength of the association is lower (~10–15% lower risk to develop diabetes) and that maternal risk of diabetes did not experience a longer decreased after ≥12 months (Table S2). Using restricted cubic splines, the dose–response association between mean duration of lactation per child and maternal risk of diabetes was linear up to 9 months of lactation per child (p for non‐linearity <0.0001; Figure 1).
Figure 1.
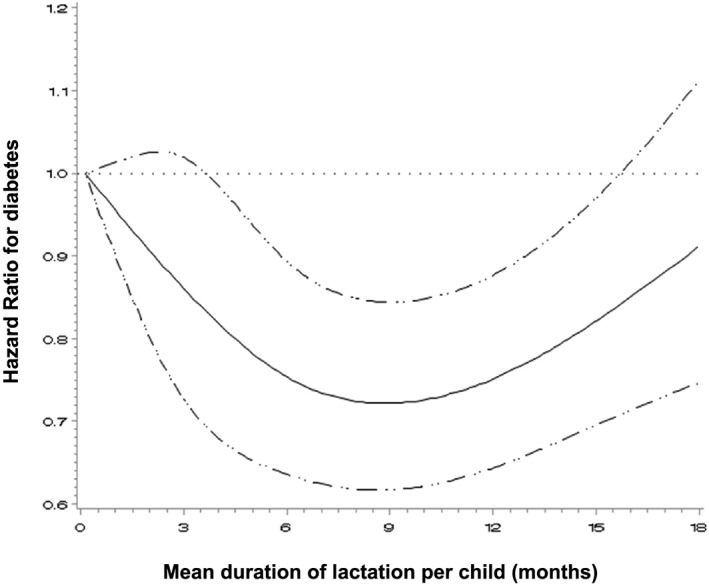
Adjusted dose‐response association between mean duration of lactation per child and diabetes. Data were modeled with a cubic splines regression model with 4 knots (3, 6, 9 and 12 months). Adjustment was made for age, BMI at 18 years, family history of diabetes, age at menarche, history of gestational diabetes, educational level, SES, dietary pattern, physical activity and smoking status. Solid line represents HR for diabetes and dashed lines represents 95% CI. Test for curvature (non‐linear association) <0.0001; Test for overall significance of curve 0.0001; Test for linear association 0.11
4. DISCUSSION
In this prospective cohort study, we found that a mean of 6 to 12 months of lactation per child was associated with lower maternal diabetes incidence. Moreover, we observed that maternal diabetes incidence no longer decreased after a mean of ≥12 months of lactation per child.
We found that women who breastfed an average of 6 to <12 months per child had 27% (95% CI [9, 41]) lower rate to develop diabetes. Our findings are consistent with observed results in the Shanghai Women's Health Study. This study found that women who breastfed on average 6 to <12 months per child had a 13% (95% CI [0, 22]) lower risk to develop diabetes and that, after ≥12 months, the association between lactation per child and diabetes appeared to plateau (Villegas et al., 2008). This non‐linear dose–response association between mean duration of lactation per child and the risk of diabetes was suggested in a recent meta‐analysis, where authors observed that the reduction in risk of diabetes was steeper in the first months of lactation per child (Aune et al., 2014). We were able to demonstrate this non‐linear dose–response association by using restricted cubic splines as we observed a plateau on the risk of diabetes after 9 months of lactation per child. It is worth noting that a non‐linear dose–response association was recently reported for lactation per child and other health outcomes such as breast cancer (Unar‐Munguia, Torres‐Mejia, Colchero, & Gonzalez de Cosio, 2017). We hypothesize that this could potentially be explained by the fact that after 12 months of age, the frequency and intensity of lactation decrease as breast milk provides just a third of energy needs in children aged 12 and 24 months. In this period, complementary food provide most part of the energy and nutrients needs ( World Health Organization ), which in turn leads to lower circulating prolactin levels, and in a reduction of the metabolic burden imposed by breastfeeding.
Lactation could protect against diabetes by promoting postpartum weight loss and less long‐term weight gain during childbearing years (Stuebe & Rich‐Edwards, 2009). Although in our study, women who breastfed experienced less weight gain during childbearing years, adjustment for the weight change since 18 years slightly decreased the association between mean duration of lactation and incident diabetes, but it remained significant, suggesting that the less long‐term weight gain experienced by women who breastfed did not fully explain the less risk of diabetes. We speculate that other biological mechanisms could explain the protection against diabetes provided by lactation. Circulating prolactin levels increase the most in the immediate postpartum period and rise in response to the frequency and intensity of lactation (Tyson, Hwang, Guyda, & Friesen, 1972). This could lead to stronger prolactin effects on glucose metabolism due to the preservation of pancreatic β cells, less inflammation, and improved endothelial function (Ramos‐Roman, 2011) that persist after weaning, thereby decreasing diabetes risk later in life. A recent study conducted in the United States found that women in the highest quartile of circulating prolactin levels had a lower risk of incident diabetes compared with those in the lowest quartile (HR = 0.48, 95% CI [0.26, 0.90]; Wang et al., 2016).
Our finding that up to 12 months of lactation per child was associated with lower risk of diabetes over a 2‐year period is of public health relevance as it could help to reinforce the importance of breastfeeding particularly in low‐income and middle‐income countries where breastfeeding practices are suboptimal (González de Cosío, Escobar‐Zaragoza, González‐Castell, & Rivera‐Dommarco, 2013; Victora et al., 2016).
Population shift strategies aim to move the population distribution towards lower risk, reducing the number of people at high‐risk but also potentially reducing the occurrence of disease in the population as a whole (Rose, 1985). Given our findings on lactation's potential long‐term benefits, breastfeeding may be used as population shift strategy for the prevention of diabetes in parous women and may be incorporated as a recommendation in primary care settings during prenatal and postnatal care. However, developing a breastfeeding population strategy is challenging and requires political commitment (Costa et al., 2012; Gillies et al., 2007). Recently, a group of experts assessed the environment for breastfeeding in Mexico. Their results indicate that there is a need to strengthen evidence‐based advocacy to increase the political will that is needed to secure stable funding and resources for a successful national strategy for protection, promotion, and support of breastfeeding in Mexico (González de Cosío, Ferré, Mazariegos, & Pérez‐Escamilla, 2018). Furthermore, the National Academy of Medicine of Mexico recently issued a position statement calling for strong governmental commitment to develop an effective national breastfeeding programme (González de Cosio, Hernandez‐Cordero, Rivera‐Dommarco, & Hernandez‐Avila, 2017).
Our study had strengths and limitations. The strengths of the study include its prospective design, which allowed us to assess risk of developing diabetes in Latin American population over a 2‐year span. In addition, our study provides novel important information on the dose–response association between mean duration of lactation per child and risk of diabetes. In addition, we adjusted for long‐term weight change in reproductive years, which is relevant because weight history may provide information beyond current weight for diabetes risk. Furthermore, our analysis was adjusted for history of gestational diabetes to minimize reverse causation. However, data on exclusive, partial, or predominant breastfeeding were not assessed. In addition, we relied on self‐report of lactation; however, studies have demonstrated that women are able to accurately recall duration of lactation up to 20 years after pregnancy (Natland, Andersen, Nilsen, Forsmo, & Jacobsen, 2012; Promislow, Gladen, & Sandler, 2005), and given the prospective design with lactation assessment before diabetes diagnosis, it is unlikely this measurement error to be differential according to diabetes diagnosis in the future. In addition, nondifferential misclassification of diabetes is a possibility, especially because some cases could be underdiagnosed (false negative cases). However, given the very large cohort size, this is likely to have only a minimal impact on the estimates. Furthermore, the prevalence of diabetes in the study population (11%) was comparable with the estimated prevalence in Mexican women (13.2%; Villalpando et al., 2010). In addition, all participants were teachers, which may increase internal validity but may decrease generalizability to other populations. Finally, although we adjusted for reproductive, behavioural and socio‐demographic characteristics, confounding by unmeasured and unknown factors, cannot be ruled out. For example, a high pregestational BMI and metabolic alterations like insulin resistance could negatively affect the initiation and duration of breastfeeding. Therefore, a successful breastfeeding may be a marker for adequate prepregnancy BMI and of a nonaltered metabolism that led to a less risk for diabetes later in life.
In conclusion, in the context of the alarming increase in the early onset of diabetes in women of childbearing age in Mexico, there is an urgent call to health providers to provide counselling and support mothers to initiate and maintain optimal breastfeeding practices. This applies not only to women of high risk to develop diabetes such those with overweight/obesity and those who had gestational diabetes history but also to all women of childbearing years.
CONFLICTS OF INTEREST
DS, ML, and RLR received limited salary support from Bloomberg Philanthropies through an institutional grant to the National Institute of Public Health in Mexico. ML and RLR received a nonrestricted investigator‐initiated grant from AstraZeneca. ML and RLR received limited salary support from Bloomberg Philanthropies through an institutional grant to the National Institute of Public Health in Mexico. MM, EOP, and TGdC declare no conflicts of interest.
CONTRIBUTIONS
The authors' responsibilities were as follows: RL‐R and MM conceived and designed the study; MM conducted the statistical analysis; EO‐P and DS made contributions on statistical analysis; MM drafted the original manuscript. All authors contributed to the interpretation of data discussed in the manuscript, revised the manuscript, and approved its final version. RL‐R has primary responsibility for final content.
Supporting information
Table S1. Hazard Ratios (95% CI) of treated diabetes by mean duration of lactation per child in the Mexican Teachers' Cohort
Table S2. Hazard Ratios (95% CI) of diabetes by total duration of lactation in the Mexican Teachers' Cohort
ACKNOWLEDGMENT
We are grateful to all the Mexican Teachers' Cohort participants for their commitment to improve women's health.
Mazariegos M, Ortiz‐Panozo E, Stern D, González de Cosío T, Lajous M, López‐Ridaura R. Lactation and maternal risk of diabetes: Evidence from the Mexican Teachers' Cohort. Matern Child Nutr. 2019;15:e12880 10.1111/mcn.12880
REFERENCES
- Aune, D. , Norat, T. , Romundstad, P. , & Vatten, L. J. (2014). Breastfeeding and the maternal risk of type 2 diabetes: A systematic review and dose‐response meta‐analysis of cohort studies. Nutrition, Metabolism, and Cardiovascular Diseases, 24(2), 107–115. 10.1016/j.numecd.2013.10.028 [DOI] [PubMed] [Google Scholar]
- Costa, B. , Barrio, F. , Cabre, J. J. , Pinol, J. L. , Cos, X. , Sole, C. , & Tuomilehto, J. (2012). Delaying progression to type 2 diabetes among high‐risk Spanish individuals is feasible in real‐life primary healthcare settings using intensive lifestyle intervention. Diabetologia, 55(5), 1319–1328. 10.1007/s00125-012-2492-6 [DOI] [PubMed] [Google Scholar]
- Durrleman, S. , & Simon, R. (1989). Flexible regression models with cubic splines. Statistics in Medicine, 8(5), 551–561. 10.1002/sim.4780080504 [DOI] [PubMed] [Google Scholar]
- Gillies, C. L. , Abrams, K. R. , Lambert, P. C. , Cooper, N. J. , Sutton, A. J. , Hsu, R. T. , & Khunti, K. (2007). Pharmacological and lifestyle interventions to prevent or delay type 2 diabetes in people with impaired glucose tolerance: Systematic review and meta‐analysis. BMJ, 334(7588), 299 10.1136/bmj.39063.689375.55 [DOI] [PMC free article] [PubMed] [Google Scholar]
- González de Cosío, T. , Escobar‐Zaragoza, L. , González‐Castell, L. D. , & Rivera‐Dommarco, J. A. (2013). Prácticas de alimentación infantil y deterioro de la lactancia materna en México. Salud Pública de México, 55, S170–S179. [PubMed] [Google Scholar]
- González de Cosío, T. , Ferré, I. , Mazariegos, M. , & Pérez‐Escamilla, R. (2018). Scaling up breastfeeding programs in Mexico: Lessons learned from the becoming breastfeeding friendly initiative. Current Developments in Nutrition, 2(6), nzy018. 10.1093/cdn/nzy018 [DOI] [PMC free article] [PubMed] [Google Scholar]
- González de Cosio, T. , Hernandez‐Cordero, S. , Rivera‐Dommarco, J. , & Hernandez‐Avila, M. (2017). Recommendations for a multisectorial national policy to promote breastfeeding in Mexico: Position of the National Academy of Medicine. Salud Publica Mex, 59(1), 106–113. 10.21149/8102 [DOI] [PubMed] [Google Scholar]
- Hernandez‐Avila, M. , Romieu, I. , Parra, S. , Hernandez‐Avila, J. , Madrigal, H. , & Willett, W. (1998). Validity and reproducibility of a food frequency questionnaire to assess dietary intake of women living in Mexico City. Salud Pública de México, 40(2), 133–140. 10.1590/S0036-36341998000200005 [DOI] [PubMed] [Google Scholar]
- Jager, S. , Jacobs, S. , Kroger, J. , Fritsche, A. , Schienkiewitz, A. , Rubin, D. , & Schulze, M. B. (2014). Breast‐feeding and maternal risk of type 2 diabetes: A prospective study and meta‐analysis. Diabetologia, 57(7), 1355–1365. 10.1007/s00125-014-3247-3 [DOI] [PMC free article] [PubMed] [Google Scholar]
- Karnik, S. K. , Chen, H. , McLean, G. W. , Heit, J. J. , Gu, X. , Zhang, A. Y. , & Kim, S. K. (2007). Menin controls growth of pancreatic beta‐cells in pregnant mice and promotes gestational diabetes mellitus. Science, 318(5851), 806–809. 10.1126/science.1146812 [DOI] [PubMed] [Google Scholar]
- Labriola, L. , Ferreira, G. B. , Montor, W. R. , Demasi, M. A. , Pimenta, D. C. , Lojudice, F. H. , & Sogayar, M. C. (2007). Prolactin‐induced changes in protein expression in human pancreatic islets. Molecular and Cellular Endocrinology, 264(1–2), 16–27. 10.1016/j.mce.2006.10.004 [DOI] [PubMed] [Google Scholar]
- Lajous, M. , Ortiz‐Panozo, E. , Monge, A. , Santoyo‐Vistrain, R. , Garcia‐Anaya, A. , Yunes‐Diaz, E. , & Lopez‐Ridaura, R. (2017). Cohort profile: The Mexican Teachers' Cohort (MTC). International Journal of Epidemiology, 46(2), e10 10.1093/ije/dyv123 [DOI] [PubMed] [Google Scholar]
- Monge, A. , Lajous, M. , Ortiz‐Panozo, E. , Rodriguez, B. L. , Gongora, J. J. , & Lopez‐Ridaura, R. (2018). Western and Modern Mexican dietary patterns are directly associated with incident hypertension in Mexican women: A prospective follow‐up study. Nutrition Journal, 17(1), 21 10.1186/s12937-018-0332-3 [DOI] [PMC free article] [PubMed] [Google Scholar]
- Natland, S. T. , Andersen, L. F. , Nilsen, T. I. , Forsmo, S. , & Jacobsen, G. W. (2012). Maternal recall of breastfeeding duration twenty years after delivery. BMC Medical Research Methodology, 12, 179 10.1186/1471-2288-12-179 [DOI] [PMC free article] [PubMed] [Google Scholar]
- Ortiz‐Panozo, E. , Yunes‐Diaz, E. , Lajous, M. , Romieu, I. , Monge, A. , & López‐Ridaura, R. (2017). Validity of self‐reported anthropometry in adult Mexican women. Salud Pública de México, 59(3), 10 10.21149/7860 [DOI] [PubMed] [Google Scholar]
- Promislow, J. H. , Gladen, B. C. , & Sandler, D. P. (2005). Maternal recall of breastfeeding duration by elderly women. American Journal of Epidemiology, 161(3), 289–296. 10.1093/aje/kwi044 [DOI] [PubMed] [Google Scholar]
- Ramos‐Roman, M. A. (2011). Prolactin and lactation as modifiers of diabetes risk in gestational diabetes. Hormone and Metabolic Research, 43(9), 593–600. 10.1055/s-0031-1284353 [DOI] [PubMed] [Google Scholar]
- Rose, G. (1985). Sick individuals and sick populations. International Journal of Epidemiology, 14(1), 32–38. 10.1093/ije/14.1.32 [DOI] [PubMed] [Google Scholar]
- Stuebe, A. M. , & Rich‐Edwards, J. W. (2009). The reset hypothesis: Lactation and maternal metabolism. American Journal of Perinatology, 26(1), 81–88. 10.1055/s-0028-1103034 [DOI] [PMC free article] [PubMed] [Google Scholar]
- The Lancet Diabetes and Endocrinology (2017). Sex disparities in diabetes: Bridging the gap. Lancet Diabetes Endocrinol, 5(11), 839 10.1016/S2213-8587(17)30336-4 [DOI] [PubMed] [Google Scholar]
- Tyson, J. E. , Hwang, P. , Guyda, H. , & Friesen, H. G. (1972). Studies of prolactin secretion in human pregnancy. American Journal of Obstetrics and Gynecology, 113(1), 14–20. 10.1016/0002-9378(72)90446-2 [DOI] [PubMed] [Google Scholar]
- Unar‐Munguia, M. , Torres‐Mejia, G. , Colchero, M. A. , & Gonzalez de Cosio, T. (2017). Breastfeeding mode and risk of breast cancer: A dose‐response meta‐analysis. Journal of Human Lactation, 33(2), 422–434. 10.1177/0890334416683676 [DOI] [PubMed] [Google Scholar]
- Victora, C. G. , Bahl, R. , Barros, A. J. , Franca, G. V. , Horton, S. , Krasevec, J. , & Rollins, N. C. (2016). Breastfeeding in the 21st century: Epidemiology, mechanisms, and lifelong effect. Lancet, 387(10017), 475–490. 10.1016/s0140-6736(15)01024-7 [DOI] [PubMed] [Google Scholar]
- Villalpando, S. , de la Cruz, V. , Rojas, R. , Shamah‐Levy, T. , Avila, M. A. , Gaona, B. , … Hernandez, L. (2010). Prevalence and distribution of type 2 diabetes mellitus in Mexican adult population: A probabilistic survey. Salud Pública de México, 52(Suppl 1), S19–S26. 10.1590/S0036-36342010000700005 [DOI] [PubMed] [Google Scholar]
- Villegas, R. , Gao, Y. T. , Yang, G. , Li, H. L. , Elasy, T. , Zheng, W. , & Shu, X. O. (2008). Duration of breast‐feeding and the incidence of type 2 diabetes mellitus in the Shanghai Women's Health Study. Diabetologia, 51(2), 258–266. 10.1007/s00125-007-0885-8 [DOI] [PMC free article] [PubMed] [Google Scholar]
- Wang, T. , Xu, Y. , Xu, M. , Ning, G. , Lu, J. , Dai, M. , & Wang, W. (2016). Circulating prolactin and risk of type 2 diabetes: A prospective study. American Journal of Epidemiology, 184(4), 295–301. 10.1093/aje/kwv326 [DOI] [PubMed] [Google Scholar]
- World Health Organization . Infant and young child feeding (fact sheets). Retrieved from http://www.who.int/news-room/fact-sheets/detail/infant-and-young-child-feeding
Associated Data
This section collects any data citations, data availability statements, or supplementary materials included in this article.
Supplementary Materials
Table S1. Hazard Ratios (95% CI) of treated diabetes by mean duration of lactation per child in the Mexican Teachers' Cohort
Table S2. Hazard Ratios (95% CI) of diabetes by total duration of lactation in the Mexican Teachers' Cohort