

Abstract
Adequate complementary feeding (CF) practices are essential for achieving optimal growth but challenging to measure comprehensively. This paper describes CF practices in 2,034 children aged 6–23 months and investigates their relationships with length‐for‐age z‐score (LAZ) and stunting, using cross‐sectional data collected from May to July 2014 in rural Northern Togo. The World Health Organization infant and young child feeding indicators were computed, along with ancillary indicators on feeding style and timing of introduction of complementary foods. The associations between those indicators and children's LAZ and stunting were assessed using linear and logistic regressions after stratification by age group and adjustment for children, maternal, and household characteristics. CF practices were suboptimal, and their associations with child's growth varied across indicators and age groups. In children aged 6–11 months, reaching the minimum dietary diversity and the minimum acceptable diet was associated with higher LAZ (p < .05). In 18‐ to 23‐month‐old children, only the consumption of iron‐rich food was associated with both LAZ (p = .02) and stunting (p = .05). The late introduction of family foods was associated with higher odds of being stunted and lower LAZ in children aged 12–17 months (p < .001). The untimely introduction of porridge was associated with higher odds of stunting in children aged 9–23 months (p < .05). Unexpectedly, helping the child to eat was negatively associated with linear growth in all age groups. These findings nurture the ongoing process of review of the World Health Organization infant and young child feeding indicators showing that, in their current version, they hardly capture the links between CF and child's growth at different ages.
Keywords: complementary feeding practices, feeding style, infant and young child feeding indicators, linear growth, stunting, Togo
Key messages.
Complementary feeding practices are suboptimal in north Togo, especially in younger children. Their associations with child growth vary across indicators and age groups.
The minimum dietary diversity and the consumption of iron‐rich foods are important predictors of growth in children aged 6–11 and 18–23 months, respectively.
The untimely introduction of complementary foods and, paradoxically, the fact that children are helped to eat are associated with lower length‐for‐age z‐score.
A better picture of infant and young child feeding practices and their association with children growth is given when analyses are disaggregated by age groups and when feeding styles and timely initiation to complementary foods are also examined.
1. INTRODUCTION
The complementary feeding (CF) period, between 6 and 23 months of age, is of paramount importance for linear growth (Prendergast & Humphrey, 2014; Stewart, Iannotti, Dewey, Michaelsen, & Onyango, 2013; White, Bégin, Kumapley, Murray, & Krasevec, 2017). In low‐ and middle‐income countries, most of the decline in height‐for‐age occurs during the ~500‐day transition time when breastmilk is complemented by family food (Aguayo & Menon, 2016; Bégin & Aguayo, 2017). Covering children's nutritional needs during this critical period can be challenging because of their high requirements but small gastric capacity (Dewey, 2016). To ensure optimal growth and proper brain development, complementary foods (CFo) should not only be nutritious but also sufficient in quantity, of adequate consistency, safely stored and prepared, timely introduced, and adequately given using a responsive feeding style (Black & Aboud, 2011; Pan American Health Organization/World Health Organization [WHO], 2003; WHO, 2005). In West Africa where feeding practices are far from optimal and traditional CFo known to be of low nutritional value, 31% of children under 5 were stunted in 2016 (Development Initiatives, 2017; Issaka et al., 2015).
Evidence of association between CF and linear growth varies across studies, countries, indicators, and age groups. As it encompasses several dimensions and interrelated practices, CF is difficult to measure (Ruel, 2017). Over years, various scores and indices have been developed to try to measure it accurately. Researchers' attention was first focused on single aspects of feeding practices. The role of diet quality on child anthropometry was often examined separately from that of age appropriate introduction of CFo (Cohen, Brown, Dewey, Canahuati, & Landa Rivera, 1994; Hop et al., 2000; Marquis, Habicht, Lanata, Black, & Rasmussen, 1997; Simondon & Simondon, 1997). Ruel and Menon (2002) proposed a synthetic child feeding index, which combined breastfeeding, meal frequency, and diet diversity. Using demographic and health survey (DHS) data from five Latin American countries, they found a positive association between adequate feeding practices and length‐for‐age z‐score (LAZ) of children aged 12–36 months in all but one country. Adapted to different settings and at a smaller scale, this index showed mitigated associations with child anthropometric outcomes (Moursi, Trèche, Martin‐Prével, Maire, & Delpeuch, 2009; Ntab et al., 2005; Sawadogo et al., 2006).
In 2008, to address the need for simple indicators to assess children's feeding practices at the population level, the World Health Organization (WHO) introduced eight core infant and young child feeding (IYCF) indicators (WHO, 2008). These indicators have been widely used to describe and compare CF practices across countries and to explore their relationships with child's anthropometry, although they were not originally designed to do so. Pooling data from 14 countries, Marriott et al. found that better IYCF core indicators, except the minimum meal frequency (MMF), were associated with a lower probability of being stunted, whereas studies analysing country‐specific data found less clear‐cut results (Jones et al., 2014; Marriott, White, Hadden, Davies, & Wallingford, 2012; Onyango, Borghi, de Onis, del Casanovas, & Garza, 2014).
Those conflicting results unveiled the need for the development of more precise indicators able to predict child's nutritional status. Although IYCF indicators have enhanced awareness on CF practices and allowed tremendous progress in CF measurement and understanding, they remain limited when it comes to predict child's nutritional status (Jones et al., 2014; Ruel, 2017). They hardly capture the complexity of CF and put aside some critical aspects such as portion size, adequate food texture, and responsive feeding (Ruel, 2017). Besides these indicators are generally used without further distinction of age within the 6–23 month age range, although we know that feeding practices and growth dynamics vary within this age group. For these reasons, a growing number of researchers are now calling for IYCF indicator's review (Jones et al., 2014; Michaelsen, Grummer‐Strawn, & Bégin, 2017; Ruel, 2017; UNICEF, 2017). Awaiting for new indicators, country‐specific studies analysing the association between the whole gamut of WHO CF indicators and child anthropometry are needed to nurture this ongoing process of review and to promote their cautious use in different contexts (Jones et al., 2014).
Using both the WHO IYCF indicators and new ancillary indicators related to the timeliness of introduction of CFo and caregivers' feeding styles, we performed an exploratory analysis on data collected in a rural area in north Togo, where that kind of studies are still very scarce. Overall, our objectives were (a) to characterize CF practices in a Togolese population challenged with undernutrition, (b) to study the associations between CF practices and child's linear growth and stunting through IYCF indicators and ancillary indicators, and (c) to assess how these relationships differed across age groups.
2. METHODS
2.1. Study area and design
This study was part of a cluster‐randomized controlled trial (RCT), which aimed at assessing the impact of a pilot cash transfer programme on the growth retardation of children aged 6–59 months. It was implemented in north Togo within the five districts presenting the worst rates of stunting nationally. A total of 162 rural villages from those districts were randomized in either an “intervention” group, which received cash transfers and behaviour change communication (BCC) activities or a “control” group, which received BCC only. The data analysed here stem from the baseline survey of the RCT, which was carried out in both groups from May to July 2014, before the start of the intervention.
To constitute a sample representative of the children aged 6–59 months living in the 162 villages of the study, the only recent census available was that of the programme, listing households with a pregnant woman, or a 0‐ to 23‐month‐old child, or a 0‐ to 59‐month‐old child with acute malnutrition. From this list, we randomly selected in each village 24 households (plus two back‐up households) and used them as “starting points.” From each “starting point” household, we applied a random‐route sampling method to select households with at least one child aged 6 to 59 months, which was our criteria for eligibility. In practice, one member from the starting point household rolled a dice. When the dice indicated 5 or 6, if eligible, the household was selected, otherwise the nearest eligible household was surveyed. When the dice indicated 1, 2, 3, or 4, even if eligible, the starting point was not selected, for the benefit of the nearest eligible household. Within each household, all mothers/tutors with a child aged 6–59 months were selected to participate to the study. If a mother had more than one eligible child, only one was randomly selected. We applied this procedure until we reached 26 mother–child pairs per village. This sample size allowed to detect a meaningful difference in HAZ between the intervention and control groups as part of the RCT. A total of 3,281 households and 4,201 mother–child pairs were recruited; however, for the present analysis, we only considered children aged 6–23 months and their biological mothers, that is, a subsample of 2,075 mother–child pairs, from whom we excluded 41 children (incoherent anthropometric or dietary data, n = 27 and n = 14, respectively). For the present paper, the analyses were conducted on 2,034 mother–child pairs, disseminated in 1,824 households.
2.2. Data collection and measurements
Data were collected during home visits, using a standardized questionnaire. Originally developed in French, the questionnaire was administered by extensively trained enumerators in the different local languages spoken in the study area. The standardized translations of each question were performed by the enumerators and professional interpreters during specific work group sessions and pretested prior to the survey.
2.2.1. CF practices
Children's CF practices were assessed by the standard WHO IYCF indicators (WHO, 2008; WHO, 2010): Introduction of solid, semi‐solid, soft foods; consumption of iron‐rich, iron‐fortified foods; minimum dietary diversity (MDD), minimum meal frequency (MMF); minimum acceptable diet (MAD). These indicators were computed from a qualitative multiple‐pass 24‐hr dietary recall. The exact composition of each meal, snack, and drink consumed by the child was determined with very special care. Food items were categorized into food groups directly by the enumerators.
We also computed four ancillary indicators to capture important dimensions of CF practices that are not appraised by the IYCF indicators (Table 1): Timely introduction of porridge, which meant to estimate the timing of the regular eating of semisolid foods and Timely introduction of family foods, which sought to approximate that of solid foods consumption. The introduction of such foods was considered as being timely when occurring within the 9‐ to 11‐month‐old “critical window” when food consistency should gradually increase and progressively transit from infant to family foods (Pan American Health Organization/WHO, 2003; WHO, 2000; WHO, 2005). Contrary to the WHO indicator on the introduction of CFo, those two indicators take into account the incremental nature of CF that cannot be captured through a single 24‐hr recall. They were computed on restricted samples, excluding children whose age was ≤ to the upper limit of the time interval recommended to introduce porridge and family meal, that is, 8.99 and 12.99 months, respectively. The two other ancillary indicators relate to the caregivers' feeding style: The child usually eats with the help of a caregiver (yes/no) and The child usually eats in his own plate (yes/no).
Table 1.
Description of WHO and ancillary complementary feeding indicators analysed as independent variables
| Indicators | Description |
|---|---|
| WHO infant and young child feeding (IYCF) indicators | |
| Introduction of solid, semi‐solid, soft foods | Numerator: Infants 6–8 months of age who received solid, semi‐solid, or soft foods on the previous day |
| Denominator: Infants 6–8 months of age | |
| Consumption of iron‐rich, iron‐fortified foods | Numerator: Children 6–23 months of age who received at least one iron‐rich food or iron‐fortified food on the previous daya |
| Denominator: Children 6–23 months of age | |
| Minimum dietary diversity (MDD) | Numerator: Children 6–23 months of age who received foods from four or more food groups (out of sevenb) on the previous day |
| Denominator: Children 6–23 months of age | |
| Minimum meal frequency (MMF) | Numerator: Children 6–23 months of age who received solid, semi‐solid, or soft foods the minimum number of timesc or more on the previous day |
| Denominator: Children 6–23 months of age | |
| Minimum acceptable diet (MAD) | Breastfed children |
| Numerator: Breastfed children 6–23 months of age who had at least the minimum dietary diversity and the minimum meal frequency on the previous day | |
| Denominator: Breastfed children 6–23 months of age | |
| Nonbreastfed children | |
| Numerator: Non‐breastfed children 6–23 months of age who received at least 2 milk feedingsd and had at least the minimum dietary diversity (not including milk feeds) and the minimum meal frequency during the previous day. | |
| Denominator: Nonbreastfed children 6–23 months of age | |
| Ancillary indicators | |
| Timely introduction of porridge | Numerator: Children 9–23 months of age who introduced porridge before 6 months (early); between 6 and 8 months (timely); or after 8 months (late) |
| Denominator: Children 9–23 months of age | |
| Timely introduction of family foods | Numerator: Children 12–23 months of age who started family foods before 9 months (early); between 9 and 11 months (timely); or after 11 months (late) |
| Denominator: Children 12–23 months of age | |
| The child usually eats with the help of a caregiver at the time of the survey | Numerator: Children 6–23 months of age who have started complementary foods and are usually assisted by someone older (relatives, siblings, others caregivers) during meals |
| Denominator: Children 6–23 months of age who have started complementary foods | |
| The child usually eats in his own plate at the time of the survey | Numerator: Children 6–23 months of age who have started complementary foods and usually eat in their own plate |
| Denominator: Children 6–23 months of age who have started complementary foods | |
Iron‐rich foods: flesh foods (meat, organ meats, and fish). Iron‐fortified foods: iron‐fortified formulas, locally available iron‐fortified foods designed especially for infants and young children, foods fortified at home with micronutrient powders/sprinkles, lipid‐based nutrient supplements.
Seven food groups: grains, roots, and tubers; legumes and nuts; dairy products; flesh foods; eggs; vitamin‐A rich fruits and vegetables; and other fruits and vegetables.
Minimum is defined as two times for breastfed infants 6–8 months of age, three times for breastfed children 9–23 months of age, four times for nonbreastfed children, irrespective of child's age. NB: Meals include both meals and snacks other than trivial amounts.
In this study, we considered any milk intake as sufficient regardless of the number of times it was provided to the child.
2.2.2. Anthropometric measurements
All anthropometric measurements were standardized according to the WHO recommendations (WHO, 1995) and carried out by five specifically trained enumerators and assistants. The recumbent length of children was measured to the nearest millimetre with portable devices equipped with height gauges. Their weight was assessed undressed to the nearest 100 g on Seca® electronic taring scales allowing for double weighing. Usual anthropometric indicators: weight‐for‐height (WHZ) and length‐for‐age (LAZ) were computed using the WHO multicentre growth reference standards' macro for R (WHO, 2006). Children with a LAZ < −2 SD were considered as stunted, whereas those having a WHZ < −2 SD or a bilateral oedema were classified as wasted.
2.2.3. Covariates
We also considered in our analyses various covariates that may influence the relationships between CF practices and child growth. They reflected child's general condition and living environment, comprising data on health and hygiene along with information on caregivers' and households' resources. These including the household hunger score (Ballard, Coates, Swindale, & Deitchler, 2011), the MDD for women (Nguyen et al., 2013; WDDP Study Group, 2017), and hygiene assessment from spot checks (Ruel & Arimond, 2002; Sonego & Mosler, 2016). Details on these variables and indicators are given in Figure 1.
Figure 1.
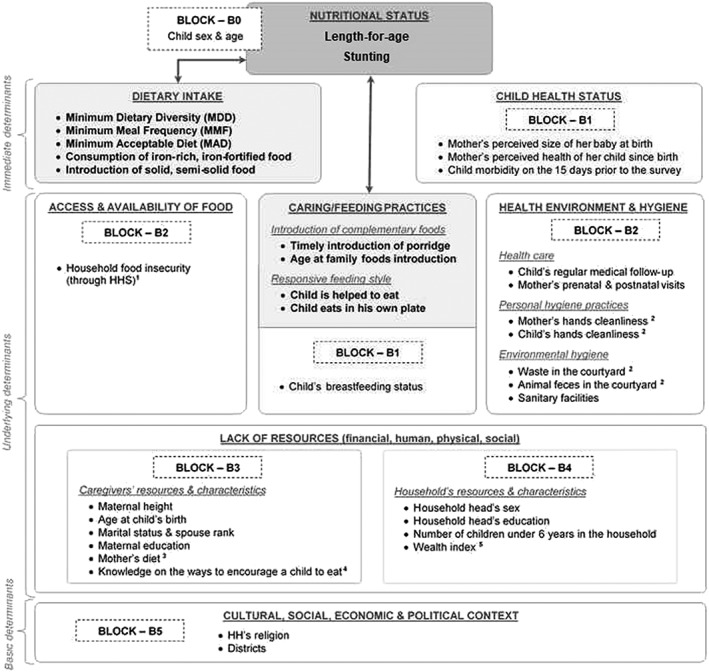
UNICEF's conceptual framework of malnutrition presenting the main predictors and the different blocks of adjustment variables considered in the multivariate analyses
Legend:
 Outcome variables;
  Main predictors;
  Studied associations
1Household Hunger Scale score (HHS): since in our dataset the HHS standard categorical indicator classified too few households in severe hunger to run a consistent analysis, we re‐categorized the households following the HHS score distribution in our sample. Households with a score of 0‐2 were classified as experiencing no to moderate hunger; those with a score of 3‐6 were considered as suffering from severe hunger.
2Hygiene: Household's environmental hygiene was assessed using spot‐check observational method (Ruel & Arimond, 2002; Sonego & Mosler, 2016). The investigators notably checked the household's courtyard condition taking notice of waste and animal feces. Maternal and child hands cleanliness was estimated through the same methodology, differentiating between "clean", "dusty" and "dirty" hands. Given the rural context "clean" and "dusty" were combined and opposed to "dirty".
3Mothers' diet: was assessed through the women dietary diversity score (WDDS ‐10). Usually used to compute the minimum dietary diversity of women (MDD‐W), that score based on a 24‐h recall classifies in ten food groups all food items consumed by women on the last 24‐h (Nguyen et al., 2013).
4Mothers' knowledge on the ways to encourage a child to eat: evaluated through a score allocating or removing one point respectively to each good or bad practices mentioned by mothers, who were then classified in terciles according to their score.
5Wealth index: generated using a multiple correspondence analysis including both data on household's assets (ex: mobile phone, bicycle, motorcycle, flashlight) and information on housing quality and facilities (building materials, toilet facility, main sources of light, drinking water, cooking fuel). All households were classified into quintiles according to their index value.
2.3. Data management and analysis
Data were collected using android tablets allowing for direct quality controls at data entry. Data were regularly sent to an online server allowing for additional quality checks and overall data monitoring throughout the survey. Additional data cleaning and data management were performed using R.3.3.2, whereas data analysis was performed using Stata 14.2.
First, we performed descriptive statistics to characterize our sample, disaggregating analyses on children's anthropometry and CF practices by age groups: 6–11, 12–17, and 18–23 months old (Tables 2 and 3). We tested differences between age groups using unadjusted regressions models (Table 3). Then, to study the associations between children's CF practices and nutritional status, we performed multivariate linear and logistic regressions where LAZ and stunting were the dependent variables, respectively, and CF indicators the primary predictors. We stratified all analyses by age groups and ran separate models with different sets of covariates for each CF indicator and age group, in order to adjust each model for its own potential confounders. To identify the covariates of each fitted model, selected according to their statistical link with the dependent variable and/or primary predictor, we followed a two‐stage procedure.
Table 2.
Description of the analysed sample
| % or mean (±SE) | |
|---|---|
| Statistical unit: households | (n = 1,824) |
| Sociodemographic characteristics | |
| Household head's sex—male | 94.99 |
| Household head's religion | |
|
59.65 |
|
18.81 |
|
12.62 |
|
8.92 |
| Household head's education—none | 55.31 |
| Resources and access to food | |
| Wealth quintiles | |
|
16.18 |
|
18.68 |
|
19.38 |
|
20.56 |
|
25.20 |
| Household food insecurity (using HHS—household hunger scale) | |
|
73.67 |
|
26.33 |
| Water, sanitation and hygiene | |
| Main source of drinking water—unimproved | 48.19 |
| Sanitary facilities—no facilities (open defecation in bush or field) | 85.53 |
| Waste in the household's yard—yes | 44.44 |
| Animal faeces in the household's yard—yes | 41.48 |
| Statistical unit: mothers | (n = 2,034) |
| Sociodemographic characteristics | |
| Education—none | 74.48 |
| Marital status | |
|
43.39 |
|
22.61 |
|
29.91 |
|
4.08 |
| Biological and anthropometric characteristics | |
| Age at child's birth (in years) | 27.35 (±0.23) |
| Height in cm | 159.62 (±0.16) |
| Pregnant at the time of the survey—yes | 5.82 |
| BMI in kg/m2—in nonpregnant women only (n = 1,926) | 20.73 (±0.09) |
| Nutrition, health care, hygiene, and knowledge | |
| Dietary diversity score (WDDS‐10) | 3.41 (±0.03) |
| Minimum dietary diversity women (≥five food groups out of 10)—yes | 15.27 |
| Antenatal visits | |
|
9.64 |
|
33.91 |
|
56.45 |
| Place of delivery—in health facilities | 40.66 |
| Postnatal check‐up—yes | 80.82 |
| Hands cleanliness—clean | 74.46 |
| Knowledge on the ways to encourage a child to eat | |
|
36.29 |
|
36.21 |
|
27.50 |
| Statistical unit: children | (n = 2,034) |
| Biological characteristics | |
| Sex—male | 51.82 |
| Age in months | 15.03 (±0.15) |
| Perceived size at birth (n = 2,027) | |
|
15.62 |
|
53.50 |
|
30.88 |
| Health status and health care | |
| Perceived health since birth | |
|
28.01 |
|
71.99 |
| Morbidity on last 15 days prior to the survey—yes | 35.27 |
| Medical follow‐up | |
|
22.86 |
|
39.16 |
|
37.98 |
Table 3.
Children's anthropometrics and complementary feeding practices by age groups
| % or mean (±SE) | p * | ||||
|---|---|---|---|---|---|
| 6–23 months | 6–11 months | 12–17 months | 18–23 months | ||
| Anthropometrics | (n = 2,034) | (n = 636) | (n = 717) | (n = 681) | |
| Stunted children | 26.47 | 16.31 | 29.78 | 32.55 | .00 |
| Mean LAZ | −1.01 (±0.05) | −0.57 (±0.09) | −1.20 (±0.06) | −1.25 (±0.08) | .00 |
| Wasted children | 14.02 | 17.63 | 13.91 | 10.74 | .05 |
| Mean WHZ | −0.82 (±0.03) | −0.93 (±0.05) | −0.87 (±0.04) | −0.66 (±0.05) | .00 |
| Breastfeeding | |||||
| Breastfeeding status | (n = 2,034) | (n = 636) | (n = 717) | (n = 681) | .00 |
|
4.32 | 1.56 | 2.56 | 8.73 | |
|
87.88 | 97.45 | 92.73 | 73.86 | |
|
7.80 | 0.99 | 4.71 | 17.42 | |
| Early initiation of breastfeeding—yes | (n = 2,020) | (n = 627) | (n = 715) | (n = 678) | .62 |
| 62.17 | 62.50 | 64.21 | 59.75 | ||
| Complementary feeding | |||||
| Diet quality and quantity | (n = 2,026) | (n = 631) | (n = 716) | (n = 679) | |
| Consumption of iron‐rich or iron‐fortified foods—yes | 51.42 | 33.85 | 53.41 | 57.24 | .00 |
| Consumption of at least one animal source food (ASF)—yes | 50.43 | 34.18 | 56.33 | 59.40 | .00 |
| Minimum dietary diversity—yes | 30.77 | 18.25 | 36.15 | 36.82 | .00 |
| Dietary diversity score (… over seven food groups) | 2.72 (±0.05) | 2.04 (±0.08) | 2.98 (±0.06) | 3.09 (±0.07) | .00 |
| Detailed consumption of the seven groups constituting the DDS‐7: | |||||
| Grains, roots and tubers | 88.78 | 78.40 | 91.59 | 95.50 | .00 |
| Vitamin‐A rich fruits and vegetables | 67.08 | 48.15 | 73.23 | 78.28 | .00 |
| Flesh foods (meat, fish, poultry and liver/organ meats) | 45.98 | 28.64 | 51.85 | 55.98 | .00 |
| Legumes, pulses, beans and nuts | 33.83 | 23.43 | 37.96 | 39.21 | .00 |
| Other fruits and vegetables (than vitamin‐A rich) | 25.70 | 15.43 | 30.00 | 30.76 | .00 |
| Dairy products (milk, yogurt, cheese) | 6.57 | 6.25 | 8.19 | 5.18 | .10 |
| Eggs | 4.32 | 3.50 | 4.97 | 4.40 | .61 |
| Minimum meal frequency—yes | 75.30 | 74.88 | 80.04 | 70.77 | .00 |
| Average number of meals and snacks | 3.10 (±0.04) | 2.72 (±0.07) | 3.21 (±0.07) | 3.35 (±0.07) | .00 |
| Minimum acceptable diet—yes | 25.14 | 17.03 | 33.17 | 24.32 | .00 |
| Timeliness of introduction of complementary foods | |||||
| Introduction of solid, semi‐solid, soft foods in children aged 6–8 months (n = 339) | 74.33 | ‐ | ‐ | ‐ | ‐ |
| Introduction of porridge in children aged 9–23 months | (n = 1,628) | (n = 284) | (n = 689) | (n = 655) | .23 |
|
13.20 | 12.28 | 14.59 | 12.16 | |
|
77.50 | 78.34 | 75.00 | 79.73 | |
|
9.30 | 9.39 | 10.41 | 8.11 | |
| Introduction of family foods in children aged 12–23 months | (n = 1,315) | ‐ | (n = 668) | (n = 647) | .21 |
|
40.14 | ‐ | 42.09 | 38.13 | |
|
26.50 | ‐ | 27.97 | 24.98 | |
|
33.37 | ‐ | 29.93 | 36.90 | |
| Meals' organization, feeding style | (n = 1,895) | (n = 571) | (n = 672) | (n = 652) | |
| Child usually eats in his own plate—yes | 66.33 | 69.85 | 65.54 | 64.04 | .24 |
| Someone usually helps the child to eat—yes | 70.26 | 89.22 | 74.09 | 49.74 | .00 |
Abbreviations: DDS, dietary diversity scores; LAZ, length‐for‐age z‐score; WHZ, weight‐for‐height z‐score.
p value of the difference between age groups.
In a first step, we performed, in each age group, unadjusted regressions to study: (a) the associations between each of the variables presented in Figure 1 and stunting/LAZ and (b) the associations between each of those variables and the different CF indicators. For each age group and CF indicator, we selected as potential confounders all variables that were significantly linked to either stunting/LAZ OR the studied CF indicator, with a type I error threshold of 0.05; or stunting/LAZ AND the studied CF indicator, with a type I error threshold of 0.20.
In a second step, to select the covariates to be kept in the final multivariate models among those selected in first step, we used a forward block‐wise selection procedure. Relying on the UNICEF conceptual framework of undernutrition (Figure 1), we grouped the covariates into blocks. Then, we entered those blocks one by one in the models starting with the most immediate causes of undernutrition (Figure 1—Block B1) and ending with the most distant ones (Figure 1—Block B5). In each added block, we ran a forward selection using the same thresholds as in first step. We ran that procedure for each CF indicator and age group using LAZ as a dependent variable, and we used the same set of adjustment variables in models on stunting. Throughout the procedure, we checked for the variation inflation factor to detect potential collinearities.
All analyses took into account the study design—strata (districts), clusters (villages), sampling weights (inverse probability of selection of each household and mother–child pair considering villages' size)—using svy Stata commands. The type I error risk was set at 0.05.
2.4. Ethics
The trial was registered in the ISRCTN registry (ISRCTN83330970), and the protocol was approved by the ethical committee of the Togolese Ministry of Health. Participation in the study was voluntary and each respondent signed a written informed consent prior to be interviewed.
3. RESULTS
3.1. Descriptive statistics
3.1.1. Sociodemographic characteristics of the sample
A total of 2,034 mother–child pairs randomly selected from 1,824 households in 162 villages in rural Northern Togo were included in the study. Households from our sample comprised on average eight members (median = 8). Almost all heads of household were men; more than half of them were animist, and only 45% were literate (Table 2). Maternal level of education was even lower with 75% of women who never received any education or literacy training. A very large majority of women attended at least one prenatal visit when they were pregnant of the eligible child (90%), but only 41% gave birth at a health facility. At the time of the survey, children were on average 15 months old, and 52% were boys. Although one‐third of children were sick on the last 15 days prior to the survey, 70% of mothers considered that their child had been in rather good health since birth.
3.1.2. Children's anthropometrics
Both LAZ and WHZ were normally distributed; their means were −1.01 and −0.82, respectively (Table 3). The mean WHZ increased with child's age, whereas the mean LAZ decreased as the child grew older. The latter felt from −0.56 in children aged 6–11 months to −1.25 in those aged 18–23 months. The mean LAZ was lower for boys than girls, resulting in a prevalence of stunting of 30% for boys versus 20% for girls (p < .001). Overall, 27% of children were stunted, and 14% were wasted.
3.1.3. Diet quality and quantity
Three quarters of children reached the MMF (Table 3). Although children aged 18–23 months had the largest number of eating occasions, they were the least likely to reach the MMF. The latter was the most frequently reached by children aged 12–17 months, of whom 93% were still breastfed versus only 74% of those aged 18–23 months. A total of 31% of children reached the MDD, but this proportion dropped to 18% when considering the 6‐ to 11‐month‐old children compared with approximately 37% in the two other age groups. The 6‐ to 11‐month‐old children ate one food group less than their older counterparts (two food groups vs. three food groups). The three food groups most commonly consumed by children, regardless of their age, were by order of frequency: grains, roots, and tubers; vitamin A‐rich fruits and vegetables; and flesh foods. This matched the usual local diet that consists of a maize paste with a sauce of green leaves to which small dried fish are sometimes added. Besides, the latter accounted for most of the iron‐rich foods consumed by children. Finally, only a quarter of children met the MAD, with significant differences between age groups (Table 3).
3.1.4. Timeliness of CF
Three quarters of children started eating porridge at the recommended time (i.e., between 6 and 8 months of age), but only 40% of children started eating family foods within the preferable 9‐ to 11‐month‐old time frame. Family foods were introduced too late for 33% of children and too early for 27% of them. Although we did not expect differences between age groups, we observed that children aged 18–23 months were more likely to be introduced to family foods late than those aged 12–17 months (37% vs. 30%, p = .03).
3.1.5. Feeding style
Two‐third of children ate in their own bowl. Unexpectedly, there was no significant difference among age groups. However, differences were found in the proportion of children being assisted during meals, which was higher in younger children.
3.2. Multivariate regressions' results
3.2.1. Diet quality and quantity
Children who achieved the MDD had higher LAZ than children who did not (+0.23 z‐score, p = .01); similar results were found using the MAD (+0.20 z‐score, p = .03; Tables 4a and 4b). Those positive associations were mainly driven by the group of children aged 6–11 months. In the age‐disaggregated analyses, associations remained only in this age group. The consumption of iron‐rich food was associated with higher LAZ and with lower rate of stunting within the whole sample (p = .01 for both indicators); but by age group, these associations were statistically significant in the 18‐ to 23‐month‐old children only. Among this age group, children eating iron‐rich foods had a 0.66 reduced risk of being stunted (p = .05) than children who did not.
Table 4a.
Adjusteda logistic and linear regressions for the association of stunting and LAZ with complementary feeding practices (WHO IYCF indicators)
| Stunting | LAZ | ||||||
|---|---|---|---|---|---|---|---|
| WHO IYCF indicators | n | Stunted children (%) | OR [95% CI] | p | Mean LAZ (SE) | Est [95% CI] | p |
| Introduction of solid, semi solid, or soft foods | |||||||
| Children aged 6–8 monthsb | |||||||
|
86 | 18.83 | Ref. | .06 | −0.64 (0.13) | Ref. | .07 |
|
254 | 10.84 | 0.48 [0.22, 1.02] | −0.32 (0.12) | 0.31 [−0.02, 0.65] | ||
| Consumption of iron‐rich or iron‐fortified foods | |||||||
| Children aged 6–23 monthsc | |||||||
|
1,041 | 29.57 | Ref. | .01 | −1.12 (0.05) | Ref. | .01 |
|
943 | 23.44 | 0.69 [0.54, 0.89] | −0.91 (0.06) | 0.21 [0.07, 0.36] | ||
| Children aged 6–11 monthsd | |||||||
|
407 | 16.46 | Ref. | .73 | −0.61 (0.08) | Ref. | .48 |
|
213 | 15.35 | 0.91 [0.54, 1.54] | −0.51 (0.15) | 0.11 [−0.19, 0.41] | ||
| Children aged 12–17 monthse | |||||||
|
334 | 31.78 | Ref. | .23 | −1.20 (0.09) | Ref. | .94 |
|
359 | 27.19 | 0.78 [0.52, 1.17] | −1.19 (0.07) | 0.01 [−0.23, 0.25] | ||
| Children aged 18–23 monthsf | |||||||
|
284 | 37.36 | Ref. | .05 | −1.45 (0.09) | Ref. | .02 |
|
355 | 29.99 | 0.66 [0.44, 0.99] | −1.16 (0.08) | 0.29 [0.05, 0.52] | ||
| Minimum diet diversity (MDD) | |||||||
| Children aged 6–23 monthsg | |||||||
|
1,390 | 27.83 | Ref. | .12 | −1.09 (0.04) | Ref. | .01 |
|
629 | 23.73 | 0.78 [0.57, 1.07] | −0.86 (0.08) | 0.23 [0.05, 0.42] | ||
| Children aged 6–11 monthsh | |||||||
|
508 | 17.60 | Ref. | .10 | −0.66 (0.07) | Ref. | .02 |
|
122 | 10.26 | 0.49 [0.21, 1.16] | −0.19 (0.19) | 0.47 [0.08, 0.87] | ||
| Children aged 12–17 monthsi | |||||||
|
450 | 30.49 | Ref. | .39 | −1.17 (0.08) | Ref. | .56 |
|
243 | 27.25 | 0.84 [0.56, 1.26] | −1.24 (0.08) | −0.07 [−0.29, 0.16] | ||
| Children aged 18–23 monthsj | |||||||
|
394 | 31.90 | Ref. | .55 | −1.33 (0.08) | Ref. | .20 |
|
245 | 34.64 | 1.16 [0.70, 1.93] | −1.19 (0.09) | 0.14 [−0.10, 0.38] | ||
| Minimum meal frequency (MMF) | |||||||
| Children aged 6–23 monthsk | |||||||
|
495 | 30.19 | Ref. | .13 | −1.08 (0.08) | Ref. | .42 |
|
1,524 | 25.34 | 0.76 [0.52, 1.09] | −1.00 (0.05) | 0.08 [−0.12, 0.27] | ||
| Children aged 6–11 monthsl | |||||||
|
155 | 20.51 | Ref. | .17 | −0.61 (0.12) | Ref. | .80 |
|
476 | 14.76 | 0.64 [0.33, 1.21] | −0.57 (0.09) | 0.04 [−0.26, 0.34] | ||
| Children aged 12–17 monthsm | |||||||
|
146 | 34.68 | Ref. | .17 | −1.03 (0.17) | Ref. | .24 |
|
547 | 28.00 | 0.71 [0.43, 1.16] | −1.24 (0.06) | −0.21 [−0.56, 0.14] | ||
| Children aged 18–23 monthsn | |||||||
|
182 | 27.91 | Ref. | .17 | −1.12 (0.14) | Ref. | .33 |
|
476 | 34.57 | 1.45 [0.85, 2.48] | −1.31 (0.09) | −0.19 [−0.57, 0.19] | ||
| Minimum acceptable diet (MAD) | |||||||
| Children aged 6–23 monthso | |||||||
|
1,507 | 27.90 | Ref. | .07 | −1.07 (0.04) | Ref. | .03 |
|
512 | 22.77 | 0.73 [0.52, 1.02] | −0.87 (0.08) | 0.20 [0.02, 0.38] | ||
| Children aged 6–11 monthsp | |||||||
|
518 | 17.60 | Ref. | .09 | −0.66 (0.07) | Ref. | .02 |
|
112 | 9.62 | 0.45 [0.19, 1.12] | −0.18 (0.21) | 0.48 [0.07, 0.90] | ||
| Children aged 12–17 monthsq | |||||||
|
472 | 30.27 | Ref. | .48 | −1.15 (0.07) | Ref. | .21 |
|
221 | 27.40 | 0.86 [0.56, 1.32] | −1.29 (0.08) | −0.15 [−0.37, 0.08] | ||
| Children aged 18–23 monthsr | |||||||
|
471 | 31.99 | Ref. | .51 | −1.27 (0.08) | Ref. | .75 |
|
166 | 35.24 | 1.19 [0.70, 2.03] | −1.31 (0.09) | −0.04 [−0.30, 0.22] | ||
Abbreviations: LAZ, length‐for‐age z‐score; WHO IYCF, World Health Organization Infant and Young Child Feeding.
All multivariate analyses were adjusted for child's age and sex, mother's height, and for various confounders exposed below.
Child's regular medical follow‐up (still)/household's sanitary facilities, wealth index.
Child's perceived size at birth, morbidity, breastfeeding status/mother's diet diversity, age at child's birth/household's food insecurity, waste in the yard, wealth index, number of children under 6, head's sex, sanitary facilities/district.
Child's hands cleanliness/mother's age at child's birth/household's sanitary facilities.
Child's perceived size at birth, perceived health since birth/mother's hands cleanliness, postnatal check‐up, marital status/household's waste in the yard, number of children under 6.
Child's morbidity, hands cleanliness, breastfeeding status, regular medical follow‐up (ever)/mother's prenatal visits, age at child's birth, education, knowledge on the different ways to encourage a child to eat/household's wealth index/district.
Child's perceived size at birth, morbidity, breastfeeding status/mother's diet diversity, age at child's birth/household's food insecurity, wealth index, number of children under 6, head's sex, sanitary facilities/district.
Child's perceived size at birth, regular medical follow‐up (still)/mother's diet diversity, age at child's birth/household's food insecurity, wealth index, sanitary facilities.
Child's perceived size at birth, perceived health since birth/mother's postnatal check‐up, marital status/household's waste in the yard, number of children under 6.
Child's hands cleanliness, breastfeeding status, regular medical follow‐up (ever)/mother's prenatal visits, age at child's birth, education, knowledge on the different ways to encourage a child to eat/household's food insecurity, wealth index, religion/district.
Child's perceived size at birth, morbidity, breastfeeding status/mother's postnatal check‐up, age at child's birth, marital status/household's head sex, sanitary facilities, number of children under 6/district.
Child's regular medical follow‐up (still)/mother's age at child's birth/Household's wealth index, sanitary facilities.
Child's perceived size at birth, perceived health since birth/mother's postnatal check‐up, marital status/household's number of children under 6, waste in the yard.
Child's morbidity, breastfeeding status/Mother's prenatal visits, age at child's birth, education, knowledge on the different ways to encourage a child to eat/household's food insecurity, head's education, religion/district.
Child's perceived size at birth, morbidity, breastfeeding status/mother's diet diversity, age at child's birth/household's food insecurity, head's sex, sanitary facilities, wealth index, number of children under 6/district.
Child's perceived size at birth, medical follow‐up (still)/mother's diet diversity, age at child's birth/household's wealth index, sanitary facilities.
Child's perceived size at birth, perceived health since birth/mother's postnatal check‐up, marital status/household's waste in the yard, number of children under 6.
Child's perceived size at birth, morbidity, medical follow‐up (still), breastfeeding status, hands cleanliness/mother's prenatal visits, age at child's birth, education, knowledge on the different ways to encourage a child to eat/household's food insecurity/district.
Table 4b.
Adjusteda logistic and linear regressions for the association of stunting and HAZ with complementary feeding practices (ancillary indicators)
| Stunting | LAZ | ||||||
|---|---|---|---|---|---|---|---|
| Ancillary indicators | n | Stunted children (%) | OR [95% CI] | p | Mean LAZ (SE) | Est [95% CI] | p |
| Timely introduction of porridge | |||||||
| Children aged 9–23 monthsb | |||||||
|
219 | 28.85 | 1.21 [0.85, 1.72] | .04 | −1.16 (0.10) | −0.00 [−0.23, 0.22] | 1.00 |
|
1,220 | 25.13 | Ref. | −1.16 (0.04) | Ref. | ||
|
148 | 35.48 | 1.64 [1.10, 2.44] | −1.15 (0.18) | 0.01 [−0.32, 0.34] | ||
| Children aged 9–11 monthsc | |||||||
|
38 | 18.53 | 1.02 [0.40, 2.59] | .13 | −0.76 (0.27) | −0.03 [−0.65, 0.59] | .98 |
|
217 | 18.34 | Ref. | −0.74 (0.14) | Ref. | ||
|
23 | 36.36 | 3.03 [0.99, 9.32] | −0.64 (0.54) | 0.09 [−0.87, 1.06] | ||
| Children aged 12–17 monthsd | |||||||
|
96 | 30.71 | 1.18 [0.63, 2.24] | .16 | −0.91 (0.21) | 0.30 [−0.16, 0.75] | .14 |
|
502 | 27.63 | Ref. | −1.21 (0.07) | Ref. | ||
|
69 | 40.02 | 1.88 [0.99, 3.59] | −1.52 (0.20) | −0.31 [−0.73, 0.11] | ||
| Children aged 18–23 monthse | |||||||
|
83 | 34.38 | 1.28 [0.78, 2.10] | .62 | −1.40 (0.15) | −0.09 [−0.39, 0.21] | .03 |
|
498 | 29.08 | Ref. | −1.31 (0.06) | Ref. | ||
|
55 | 31.40 | 1.12 [0.60, 2.06] | −0.82 (0.20) | 0.48 [0.09, 0.88] | ||
| Timely introduction of family foods | |||||||
| Children aged 12–23 monthsf | |||||||
|
533 | 26.73 | 0.92 [0.57, 1.49] | .31 | −1.19 (0.07) | 0.13 [−0.08, 0.34] | .48 |
|
335 | 28.35 | Ref. | −1.32 (0.07) | Ref. | ||
|
441 | 31.55 | 1.17 [0.81, 1.68] | −1.24 (0.09) | 0.08 [−0.15, 0.31] | ||
| Children aged 12–17 monthsg | |||||||
|
274 | 22.11 | 0.76 [0.43, 1.36] | .00 | −1.02 (0.09) | 0.18 [−0.11, 0.47] | .00 |
|
175 | 27.11 | Ref. | −1.20 (0.11) | Ref. | ||
|
196 | 37.43 | 1.61 [0.92, 2.82] | −1.53 (0.11) | −0.33 [−0.65, −0.01] | ||
| Children aged 18–23 monthsh | |||||||
|
241 | 33.52 | 1.22 [0.78, 1.90] | .95 | −1.30 (0.10) | 0.14 [−0.11, 0.40] | .16 |
|
155 | 32.26 | Ref. | −1.44 (0.09) | Ref. | ||
|
230 | 32.13 | 1.10 [0.57, 2.11] | −1.15 (0.11) | 0.29 [−0.01, 0.60] | ||
| The child usually eats in his own plate | |||||||
| Children aged 6–23 monthsi | |||||||
|
640 | 24.20 | Ref | .16 | −1.00 (0.06) | Ref | .65 |
|
1,249 | 27.32 | 1.20 [0.93, 1.56] | −1.04 (0.04) | −0.03 [−0.17, 0.11] | ||
| Children aged 6–11 monthsj | |||||||
|
169 | 14.12 | Ref | .39 | −0.51 (0.14) | Ref | .61 |
|
392 | 16.95 | 1.28 [0.72, 2.26] | −0.59 (0.09) | −0.08 [−0.40, 0.23] | ||
| Children aged 12–17 monthsk | |||||||
|
232 | 27.90 | Ref | .77 | −1.23 (0.09) | Ref | .28 |
|
418 | 28.82 | 1.05 [0.75, 1.48] | −1.12 (0.08) | 0.12 [−0.09, 0.33] | ||
| Children aged 18–23 monthsl | |||||||
|
220 | 31.62 | Ref | .81 | −1.27 (0.09) | Ref | .85 |
|
413 | 32.70 | 1.06 [0.67, 1.68] | −1.29 (0.07) | −0.02 [−0.25, 0.20] | ||
| The child usually eats with an help | |||||||
| Children aged 6–23 monthsm | |||||||
|
550 | 22.96 | Ref. | .03 | −0.70 (0.08) | Ref. | .00 |
|
1,339 | 27.68 | 1.33 [1.02, 1.73] | −1.15 (0.05) | −0.45 [−0.65, −0.25] | ||
| Children aged 6–11 monthsn | |||||||
|
54 | 17.15 | Ref | .84 | 0.06 (0.26) | Ref. | .01 |
|
517 | 16.07 | 0.92 [0.38, 2.19] | −0.65 (0.08) | −0.71 [−1.22, −0.19] | ||
| Children aged 12–17 monthso | |||||||
|
168 | 25.14 | Ref | .28 | −0.70 (0.18) | Ref. | .00 |
|
482 | 29.71 | 1.29 [0.81, 2.04] | −1.32 (0.06) | −0.62 [−1.01, −0.23] | ||
|
Children aged 18–23 monthsp | |||||||
|
303 | 26.88 | Ref | .01 | −1.05 (0.10) | Ref. | .00 |
|
308 | 38.14 | 1.86 [1.17, 2.96] | −1.55 (0.09) | −0.51 [−0.79, −0.22] | ||
All multivariate analyses were adjusted for child's age and sex, mother's height, and for various confounders exposed below.
Child's perceived size at birth, hands cleanliness, breastfeeding status/mother's postnatal check‐up, age at child's birth, education, marital status/household food insecurity, head's sex, number of children under 6/district.
Child's regular medical follow‐up (still), hands cleanliness/mother's age at child's birth/household's food insecurity, wealth index.
Child's perceived size at birth, perceived health since birth/mother's postnatal check‐up, hands cleanliness, marital status, knowledge on the different ways to encourage a child to eat/household's waste in the yard, number of children under 6, religion.
Child's breastfeeding status/mother's prenatal visits, age at child's birth, education/household's food insecurity, head's education/district.
Child's perceived size at birth, regular medical follow‐up (still), breastfeeding status, hands' cleanliness/mother's age at child's birth, education/household's food insecurity, wealth index, number of children under 6, head's sex, head's education/district.
Child's perceived size at birth/household's waste in the yard, animal faeces in the yard, number of children under 6/district.
Child's morbidity, regular medical follow‐up (ever), breastfeeding status/mother's prenatal visits, age at child's birth, education/household head's education, sanitary facilities, religion/district.
Child's perceived size at birth, breastfeeding status/mother's postnatal check‐up, age at child's birth/household's number of children under 6, sanitary facilities, religion/district.
Child's hands cleanliness/household's wealth index, sanitary facilities.
Child's perceived size at birth, perceived health since birth/mother's marital status/household's waste in the yard, number of children under 6, religion.
Child's morbidity, breastfeeding status, hands' cleanliness/mother's age at child's birth, knowledge on the different ways to encourage a child to eat/district.
Child's perceived size at birth, breastfeeding status/mother's postnatal visit, age at child's birth/household's food insecurity, number of children under 6, sanitary facilities/district.
Household's sanitary facilities/district.
Child's perceived size at birth, perceived health since birth/mother's postnatal visit, marital status/household's waste in the yard, number of children under 6.
Child's morbidity, regular medical follow‐up, breastfeeding status, hands' cleanliness/mother's prenatal visits, age at child's birth, education/household's food insecurity/district.
3.2.2. Timeliness of CF
The introduction of solid, semisolid, and soft foods to the diet was not significantly associated with children's nutritional status at 6–8 months old. Those links turned out when looking at the ancillary indicators. Overall, children who timely introduced porridge were less likely to be stunted than those with late initiation. Similar trends were observed when stratifying by age group, in particular in children aged less than 18 months; however, associations were statistically nonsignificant, probably because of small sample size in some of the categories. Surprisingly, among the 18‐ to –23‐month‐old children, higher LAZ were found in those who introduced porridge lately. Even if not statistically significant, analogous associations were observed with family foods in this age group. Among children aged 12–17 months, those who were not introduced to family foods before their first birthday had both significantly lower LAZ and higher odds of stunting.
3.2.3. Feeding style
There was no association between the child's nutritional status and the plate in which he took his meal (individual bowl vs. family plate). Children who received help while eating had both lower LAZ, on average, and higher odds of being stunted than those who ate alone. When analysed by age group, this negative association with LAZ remained in all age groups; however, the negative association with stunting was observed in the oldest children only.
4. DISCUSSION
CF practices were found to be suboptimal in this part of Togo, especially in younger children, and their associations with children's growth varied across indicators and age groups. Reaching the MDD or MAD was associated with higher LAZ in the youngest children, whereas the consumption of iron‐rich food was linked to a better growth in the oldest. The untimely introduction of soft and solid foods and the fact that children were helped to eat during meals were associated with poor linear growth. No association was found with the use of a separate bowl nor with the MMF.
The association between the MDD and LAZ had been observed in other studies from Asia and Africa but very few presented results by age group. One study from India showed, positive associations of MDD with both LAZ and stunting globally, but these associations disappeared when disaggregating by age group (Menon, Bamezai, Subandoro, Ayoya, & Aguayo, 2015). Other studies that used dietary diversity scores either as continuous or categorical variables instead of the MDD also showed that associations with children's anthropometric status were dependent on age. Two longitudinal studies from Zambia and Côte d'Ivoire suggested that dietary diversity was more critical for child's subsequent growth at 6 months than at 12 months of age (Becquet et al., 2006; Mallard et al., 2014). In a pooled analysis using data from 39 DHS, the strongest association of dietary diversity scores with stunting was found in children aged 6–11 months (Krasevec, An, Kumapley, Bégin, & Frongillo, 2017). The author specified that within this age group, the mere introduction of solid foods was likely more important than was greater diet diversity. Our data rather revealed that dietary diversity was important within this age group (and not only the introduction of solid foods), and that consuming at least four food groups led to a drop in stunting and an increase in LAZ. This cut‐off was less clear for the other age groups, suggesting that the MDD indicator might be less sensitive for older children. We also found that the MAD was associated with higher LAZ in younger children only. This is not surprising because the association between the MAD and child's anthropometry is mainly shaped by the dietary diversity component of the indicator (Jones et al., 2014; Mallard et al., 2014). In our sample, the consumption of iron‐rich food was associated with linear growth in 18‐ to 23‐month‐old children only. Except in pooled analyses, this indicator is rarely associated with child anthropometry and less studied than the others (Marriott et al., 2012). Researchers prefer focusing on animal source foods (ASF) which comprise flesh foods, eggs, and dairy products (Allen & Dror, 2011; Krasevec et al., 2017; Michaelsen et al., 2017). Two‐pooled analysis from DHS data showed lower odds of stunting in children who consumed ASF over the last 24 hr than in those who did not (Headey, Hirvonen, & Hoddinott, 2018; Krasevec et al., 2017). Using a similar analysis, we also found that consuming ASF was associated with higher LAZ and lower odds of stunting in the entire sample and also across all age groups (results not shown).
The lack of association between the MMF and anthropometric status has already been reported in other cross‐sectional studies, even in those with large data sets (Jones et al., 2014; Marriott et al., 2012). One common explanation is that this indicator hardly captures child's energy intakes that depend more on the amount of CFo ingested and on their energy density, than on the number of feeding episodes (Jones et al., 2014). Moreover, because children often eat very small quantities, the exact count of feeding episodes is difficult to assess (Ruel, 2017). This is even more difficult in Togo where there is no real structuration of meals and where a significant share of food intakes might happen outside parental supervision (Jaffré, 2015).
In addition to diet quality, the timing of introduction of CFo also matters. We observed a nonsignificant but clear trend towards better growth in children aged 6–8 months who consumed solid, semisolid, or soft foods on the day prior to the survey compared with children who were only breastfed. We postulate that the lack of significance was due to the narrow age range prescribed to compute the indicator, resulting in small sample size and insufficient statistical power. Using the ancillary indicator computed on a larger sample, we found that timely introduction of semisolid foods was significantly associated with lower odds of stunting compared with late introduction. However, early introduction of CFos was not associated with stunting in the whole sample. Among the 12‐ to 17‐month‐old group, children who received porridge before 6 months of age tended to have higher LAZ than children who received it in the recommended time frame. Among the 18‐ to 23‐month‐old children, early introduction of porridge was associated with lower LAZ, whereas late introduction was also associated with higher LAZ. Regarding family foods, the late introduction was associated with both significantly higher odds of stunting and lower LAZ in children aged 12–17 months, but not in children aged 18–23 months. This interaction on age groups might be due to the effect of seasonality, of which the impact on weaning patterns, availability of CFo, and subsequent diet diversity has been documented elsewhere (Sellen, 2001). The recommended time frames to introduce both semisolid and solid foods corresponded to the harvest season for children aged 12–17 months at the time of the study, whereas it corresponded to the hunger gap for children aged 18 to 23 months. During the hunger gap, it seems preferable to delay the introduction of CFo rather than to replace breastmilk by unvaried and nutrient‐poor foods that are available in that season. Although this hypothesis would need to be verified using longitudinal designs, these results highlight the importance of considering seasonality in analyses looking at stunting, not only wasting as commonly acknowledged (Lokshin & Radyakin, 2012; Prentice & Cole, 1994). Overall, late introduction of both porridge and family foods seemed to be more deleterious for the youngest children. Older children are exposed to a wider range of environmental factors than younger children (who are more often tied to the back of their mothers). Therefore, their nutritional status may well be more influenced by these factors (e.g., household's hygiene) and less by feeding practices that occurred in the past. This hypothesis is supported by the higher number of covariates included in the models for children aged 18–23 months compared with other models.
Child's growth was also affected by caregivers' feeding style. Children who ate with the help of someone had significantly lower LAZ than those who ate on their own. Those results seemed to be in contradiction with the literature, which highlights the positive role of responsive assistance in feeding for both food intakes and child growth (Baye, Tariku, & Mouquet‐Rivier, 2018; Bentley, Wasser, & Creed‐Kanashiro, 2011; Engle, Bentley, & Pelto, 2000). Our results might be due to a phenomenon of reverse causality, where children with poor growth are those who are helped to eat. In Togo, mothers tend to have a laissez‐faire style of feeding, doing little to assist or encourage their children to eat. Children are expected to be autonomous at a very young age. There is a strong belief that the child knows what is good for him, and eating is often left to his own initiative (Jaffré, 2015). Likewise in Malawi, Flax et al. (2013) suggested that children aged 6–17 months were fully capable to eat on their own, especially semi‐solid or solid family food. Hence, in such contexts, helping a child to eat may mean that she/he has a problem and needs special attention. The second hypothesis is that assistance may also have negative effects. Because of high workloads, mothers who assist their child may preferentially give porridge rather than solid food because it can be given more quickly (Abubakar, Holding, Mwangome, & Maitland, 2011; Kulwa, Kinabo, & Modest, 2006). In Togo, a well‐known practice is to force‐feed children with maize paste to fill their stomach quickly and ward off the feeling of hunger (Jaffré, 2015). This practice may result in loss of appetite and impair growth. Finally, besides mothers, other members of the family are usually involved in the feeding process, including very young siblings who are not always aware of adequate attitudes and gestures to feed an infant. Further details on the type of help provided, and on the person who provided the help, would be required to differentiate responsive and nonresponsive assistance in feeding and clarify the associations between feeding assistance and children's growth.
Our study has some limitations. Our sample was not strictly representative of the situation in north Togo because the program targeted districts with high rate of stunting; practices in these areas may be worse than in others. The cross‐sectional nature of the data did not allow to capture either the dynamic nature of CF practices, or their long‐term cumulative effects on child's growth. The possibility of a recall bias should also be considered because respondent mothers had been exposed to BCC activities including information on IYCF practices, even though this information was not necessarily assimilated or put into practices. Others limitations relate to the ancillary indicators that were not validated. The indicators relating to the timing of introduction of CFo, based on caregivers' long‐term memory, may be prone to recall errors. The indicator relating to assistance in feeding was not specific enough to be easily interpretable. The best way to analyse caregiver's feeding style remains the observation of feeding episodes. For quicker assessment, the questionnaire should be as specific as possible. For instance, one should ask under what conditions assistance was provided (always, when in a hurry, when child refuses food, when too young to feed him/herself, when appetite is poor due to illness, etc.). Finally, another limitation lies in the construction of the MAD. According to the standard definition of the indicator, two milk feedings are required for nonbreastfed children to reach the MAD, but because we did not record the number of feeds, we considered here, as did Onyango et al. (2014), that any milk intake was sufficient. However, we ran a sensitivity analysis to explore associations between MAD and LAZ or stunting with and without nonbreastfed children, and conclusions were unchanged. Our study also has strengths. Each statistical model was adjusted for its own confounders and not for a common set of covariates that would be applied indiscriminately to all models. Our dataset also allowed to control for numerous and diverse confounders in order to generate the best possible models. Breaking down the analyses by age groups and suggesting new ancillary indicators also provided interesting insights on CF and on its relationship with child's growth.
5. CONCLUSION
To conclude, this study shed light on CF practices among a sample of 6‐ to 23‐month‐old children in north Togo. Although the introduction of CFo was rather timely and the age‐specific feeding frequency quite good, diet diversity and MAD were low. Our findings reassert the importance of diet quality for child's subsequent growth, the MDD, and the consumption of iron‐rich food being both important predictors of children's growth. We also showed that IYCF indicators did not always relate the same way with growth according to child's age, with variations in the direction and strength of associations. In future studies using these indicators, it may be interesting to disaggregate the analyses by age range as we did and, whenever possible, use ancillary measures to provide a global picture of CF practices and help clarify their links with child's growth. A special attention should be paid to the timely introduction of different types of foods, as well as to feeding styles and, more broadly, to caregiver–child interactions around food preparation and eating. An extensive portfolio of indicators able to capture several dimensions of CF practices should help in clarifying the associations between these practices and nutritional status of children across various contexts.
CONFLICTS OF INTEREST
The authors declare that they have no conflicts of interest.
CONTRIBUTIONS
The authors' contributions were as follow: YMP and MS designed the research. JB, MS, YK, and SF conducted the research. AA, MR, and JBo took part and facilitated the conduction of research. JB and SF analysed the data. JB, YMP, MS, and RB wrote the paper and had primary responsibility for final content. All authors have read and approved the final manuscript.
ACKNOWLEDGMENTS
We would like to thank Viviane Van Steirteghem and Christine Jaulmes from Unicef, John Van Dyck and Patrick Eozenou from the World Bank, as well as Jean‐Pierre Somana from PDC Togo, for their inputs on the study protocol and for their valuable help in facilitating the study preparation and data collection. We also thank the field enumerators and supervisors for their hard work on data collection; a special thought to Zumaro Mayimbo and his family, one of our local supervisor who died during the survey. We are also very grateful to women and households who participated to the study for their time and kindness.
Briaux J, Fortin S, Kameli Y, et al. Dissimilarities across age groups in the associations between complementary feeding practices and child growth: Evidence from rural Togo. Matern Child Nutr. 2019;15:e12843 10.1111/mcn.12843
REFERENCES
- Abubakar, A. , Holding, P. , Mwangome, M. , & Maitland, K. (2011). Maternal perceptions of factors contributing to severe under‐nutrition among children in a rural African setting. Rural and Remote Health, 1, 1423. https://doi.org/1423 [pii] [PMC free article] [PubMed] [Google Scholar]
- Aguayo, V. M. , & Menon, P. (2016). Stop stunting: improving child feeding, women's nutrition and household sanitation in South Asia. Maternal & Child Nutrition, 12(Suppl 1), 3–11. 10.1111/mcn.12283 [DOI] [PMC free article] [PubMed] [Google Scholar]
- Allen, L. H. , & Dror, D. K. (2011). Effects of animal source foods, with emphasis on milk, in the diet of children in low‐income countries In Milk and milk products in human nutrition (Vol. 67) (pp. 113–130). Basel: KARGER; 10.1159/000325579 [DOI] [PubMed] [Google Scholar]
- Ballard, T. , Coates, J. , Swindale, A. , & Deitchler, M. (2011). Household hunger scale: Indicator definition and measurement guide. Retrieved from https://www.fantaproject.org/sites/default/files/resources/HHS-Indicator-Guide-Aug2011.pdf
- Baye, K. , Tariku, A. , & Mouquet‐Rivier, C. (2018). Caregiver‐infant's feeding behaviours are associated with energy intake of 9‐11 month‐old infants in rural Ethiopia. Maternal & Child Nutrition, 14(1), e12487 10.1111/mcn.12487 [DOI] [PMC free article] [PubMed] [Google Scholar]
- Becquet, R. , Leroy, V. , Ekouevi, D. K. , Viho, I. , Castetbon, K. , Fassinou, P. , … ANRS 1201/1202 Ditrame Plus Study Group (2006). Complementary feeding adequacy in relation to nutritional status among early weaned breastfed children who are born to HIV‐infected mothers: ANRS 1201/1202 Ditrame Plus, Abidjan, Cote d'Ivoire. Pediatrics, 117(4), e701–e710. 10.1542/peds.2005-1911 [DOI] [PMC free article] [PubMed] [Google Scholar]
- Bégin, F. , & Aguayo, V. M. (2017). First foods: Why improving young children's diets matter. Maternal & Child Nutrition, 13, 1–9. 10.1111/mcn.12528 [DOI] [PMC free article] [PubMed] [Google Scholar]
- Bentley, M. E. , Wasser, H. M. , & Creed‐Kanashiro, H. M. (2011). Responsive feeding and child undernutrition in low‐ and middle‐income countries. The Journal of Nutrition, 141, 502–507. 10.3945/jn.110.130005 [DOI] [PMC free article] [PubMed] [Google Scholar]
- Black, M. M. , & Aboud, F. E. (2011). Responsive feeding is embedded in a theoretical framework of responsive parenting. The Journal of Nutrition, 141(3), 490–494. 10.3945/jn.110.129973 [DOI] [PMC free article] [PubMed] [Google Scholar]
- Cohen, R. J. , Brown, K. H. , Dewey, K. G. , Canahuati, J. , & Landa Rivera, L. (1994). Effects of age of introduction of complementary foods on infant breast milk intake, total energy intake, and growth: A randomised intervention study in Honduras. The Lancet, 344, 288–293. 10.1016/S0140-6736(94)91337-4 [DOI] [PubMed] [Google Scholar]
- Development Initiatives . (2017). Global Nutrition Report 2017: Nourishing the SDGs. Retrieved from https://globalnutritionreport.org/reports/2017-global-nutrition-report/
- Dewey, K. G. (2016). Reducing stunting by improving maternal, infant and young child nutrition in regions such as South Asia: Evidence, challenges and opportunities. Maternal & Child Nutrition, 12(Suppl 1), 27–38. 10.1111/mcn.12282 [DOI] [PMC free article] [PubMed] [Google Scholar]
- Engle, P. L. , Bentley, M. , & Pelto, G. (2000). The role of care in nutrition programmes: Current research and a research agenda. Proceedings of the Nutrition Society, 59(01), 25–35. 10.1017/S0029665100000045 [DOI] [PubMed] [Google Scholar]
- Flax, V. L. , Mäkinen, S. , Ashorn, U. , Cheung, Y. B. , Maleta, K. , Ashorn, P. , & Bentley, M. E. (2013). Responsive feeding and child interest in food vary when rural Malawian children are fed lipid‐based nutrient supplements or local complementary food. Maternal & Child Nutrition, 9(3), 369–380. 10.1111/j.1740-8709.2011.00377.x [DOI] [PMC free article] [PubMed] [Google Scholar]
- Headey, D. , Hirvonen, K. , & Hoddinott, J. (2018). Animal sourced foods and child stunting. American Journal of Agricultural Economics, 100(5), 1302–1319. 10.1093/ajae/aay053 [DOI] [PMC free article] [PubMed] [Google Scholar]
- Hop, L. T. , Gross, R. , Giay, T. , Sastroamidjojo, S. , Schultink, W. , & Lang, N. T. (2000). Premature complementary feeding is associated with poorer growth of Vietnamese children. The Journal of Nutrition, 130, 2683–2690. 10.1093/jn/130.11.2683 [DOI] [PubMed] [Google Scholar]
- Issaka, A. I. , Agho, K. E. , N. Page, A. , L. Burns, P. , Stevens, G. J. , & Dibley, M. J. (2015). The problem of suboptimal complementary feeding practices in West Africa: What is the way forward? Maternal & Child Nutrition, 11, 53–60. 10.1111/mcn.12195 [DOI] [PMC free article] [PubMed] [Google Scholar]
- Jaffré, Y. (2015). Enfances et malnutritions au Nord du Togo: réflexions anthropologiques sur les dimensions sociales de la nutrition dans les régions de Kara et des Savanes. Marseille: Éditions Résurgences; Retrieved from https://g-i-d.org/images/nutritiontogo.pdf [Google Scholar]
- Jones, A. D. , Ickes, S. B. , Smith, L. E. , Mbuya, M. N. N. , Chasekwa, B. , Heidkamp, R. A. , … Stoltzfus, R. J. (2014, January 1). World Health Organization infant and young child feeding indicators and their associations with child anthropometry: A synthesis of recent findings. Maternal & Child Nutrition, 10, 1–17. 10.1111/mcn.12070 [DOI] [PMC free article] [PubMed] [Google Scholar]
- Krasevec, J. , An, X. , Kumapley, R. , Bégin, F. , & Frongillo, E. A. (2017). Diet quality and risk of stunting among infants and young children in low‐ and middle‐income countries. Maternal & Child Nutrition, 13(Suppl 2), S2, e12430 10.1111/mcn.12430 [DOI] [PMC free article] [PubMed] [Google Scholar]
- Kulwa, K. B. M. , Kinabo, J. L. D. , & Modest, B. (2006). Constraints on good child‐care practices and nutritional status in Urban Dar‐Es‐Salaam, Tanzania. Food and Nutrition Bulletin, 27, 236–244. 10.1177/156482650602700306 [DOI] [PubMed] [Google Scholar]
- Lokshin, M. , & Radyakin, S. (2012). Month of birth and children's health in India. Journal of Human Resources, 47, 174–203. 10.3368/jhr.47.1.174 [DOI] [Google Scholar]
- Mallard, S. R. , Houghton, L. A. , Filteau, S. , Mullen, A. , Nieuwelink, J. , Chisenga, M. , … Gibson, R. S. (2014). Dietary diversity at 6 months of age is associated with subsequent growth and mediates the effect of maternal education on infant growth in urban Zambia. The Journal of Nutrition, 144, 1818–1825. 10.3945/jn.114.199547 [DOI] [PubMed] [Google Scholar]
- Marquis, G. S. , Habicht, J. , Lanata, C. F. , Black, R. E. , & Rasmussen, K. M. (1997). Breast milk or animal‐product foods improve linear growth of Peruvian toddlers consuming marginal diets. American Journal of Clinical Nutrition, 66, 1102–1109. 10.1093/ajcn/66.5.1102 [DOI] [PubMed] [Google Scholar]
- Marriott, B. P. , White, A. , Hadden, L. , Davies, J. C. , & Wallingford, J. C. (2012). World Health Organization (WHO) infant and young child feeding indicators: Associations with growth measures in 14 low‐income countries. Maternal & Child Nutrition, 8(3), 354–370. 10.1111/j.1740-8709.2011.00380.x [DOI] [PMC free article] [PubMed] [Google Scholar]
- Menon, P. , Bamezai, A. , Subandoro, A. , Ayoya, M. A. , & Aguayo, V. (2015). Age‐appropriate infant and young child feeding practices are associated with child nutrition in India: Insights from nationally representative data. Maternal & Child Nutrition, 11(1), 73–87. 10.1111/mcn.12036 [DOI] [PMC free article] [PubMed] [Google Scholar]
- Michaelsen, K. F. , Grummer‐Strawn, L. , & Bégin, F. (2017). Emerging issues in complementary feeding: Global aspects. Maternal & Child Nutrition, 13(S2), e12444 10.1111/mcn.12444 [DOI] [PMC free article] [PubMed] [Google Scholar]
- Moursi, M. M. , Trèche, S. , Martin‐Prével, Y. , Maire, B. , & Delpeuch, F. (2009). Association of a summary index of child feeding with diet quality and growth of 6–23 months children in urban Madagascar. European Journal of Clinical Nutrition, 63, 718–724. 10.1038/ejcn.2008.10 [DOI] [PubMed] [Google Scholar]
- Nguyen, P. H. , Avula, R. , Ruel, M. T. , Saha, K. K. , Ali, D. , Tran, L. M. , … Rawat, R. (2013). Maternal and child dietary diversity are associated in Bangladesh, Vietnam, and Ethiopia. The Journal of Nutrition, 143(7), 1176–1183. 10.3945/jn.112.172247 [DOI] [PubMed] [Google Scholar]
- Ntab, B. , Simondon, K. B. , Milet, J. , Cissé, B. , Sokhna, C. , Boulanger, D. , & Simondon, F. (2005). A young child feeding index is not associated with either height‐for‐age or height velocity in Rural Senegalese children. The Journal of Nutrition, 135(3), 457–464. 10.1093/jn/135.3.457 [DOI] [PubMed] [Google Scholar]
- Onyango, A. W. , Borghi, E. , de Onis, M. , del Casanovas, C. , & Garza, C. (2014). Complementary feeding and attained linear growth among 6–23‐month‐old children. Public Health Nutrition, 17(09), 1975–1983. 10.1017/S1368980013002401 [DOI] [PMC free article] [PubMed] [Google Scholar]
- Pan American Health Organization/World Health Organization (2003). Guiding principles for complementary feeding of the breastfed child. Washington, D.C.: Pan American Health Organization; Retrieved from https://www.who.int/nutrition/publications/guiding_principles_compfeeding_breastfed.pdf [Google Scholar]
- Prendergast, A. J. , & Humphrey, J. H. (2014). The stunting syndrome in developing countries. Paediatrics and International Child Health, 34(4), 250–265. 10.1179/2046905514Y.0000000158 [DOI] [PMC free article] [PubMed] [Google Scholar]
- Prentice, A. M. , & Cole, T. J. (1994). Seasonal changes in growth and energy status in the Third World. Proceedings of the Nutrition Society, 53, 509–519. 10.1079/PNS19940061 [DOI] [PubMed] [Google Scholar]
- Ruel, M. T. (2017). Measuring infant and young child complementary feeding practices: Indicators, current practice, and research gaps. Nestle Nutrition Institute Workshop Series, 87, 73–87. 10.1159/000448939 [DOI] [PubMed] [Google Scholar]
- Ruel, M. T. , & Arimond, M. (2002). Spot‐check observational method for assessing hygiene practices: Review of experience and implications for programmes. Journal of Health Population, and Nutrition, 20(1), 65–76. https://pdfs.semanticscholar.org/dacd/666458afbe8999ed2fe8dbdfa65aac44d97e.pdf?_ga=2.98846682.576343304.1552388683-318161236.1552388683 [PubMed] [Google Scholar]
- Ruel, M. T. , & Menon, P. (2002). Child feeding practices are associated with child nutritional status in Latin America: Innovative uses of the demographic and health surveys. The Journal of Nutrition, 132(6), 1180–1187. 10.1093/jn/132.6.1180 [DOI] [PubMed] [Google Scholar]
- Sawadogo, P. S. , Martin‐Prével, Y. , Savy, M. , Kameli, Y. , Traissac, P. , Traoré, A. S. , & Delpeuch, F. (2006). An infant and child feeding index is associated with the nutritional status of 6‐ to 23‐month‐old children in rural Burkina Faso. The Journal of Nutrition, 136, 656–663. https://doi.org/136/3/656 [pii], 10.1093/jn/136.3.656 [DOI] [PubMed] [Google Scholar]
- Sellen, D. W. (2001). Weaning, complementary feeding, and maternal decision making in a Rural East African Pastoral population. Journal of Human Lactation, 17(3), 233–244. 10.1177/089033440101700307 [DOI] [PubMed] [Google Scholar]
- Simondon, K. , & Simondon, F. (1997). Age at introduction of complementary food and physical growth from 2 to 9 months in rural Senegal. European Journal of Clinical Nutrition, 51(10), 703–707. 10.1038/sj.ejcn.1600470 [DOI] [PubMed] [Google Scholar]
- Sonego, I. L. , & Mosler, H.‐J. (2016). Spot‐checks to measure general hygiene practice. International Journal of Environmental Health Research, 26(5–6), 554–571. 10.1080/09603123.2016.1217314 [DOI] [PubMed] [Google Scholar]
- Stewart, C. P. , Iannotti, L. , Dewey, K. G. , Michaelsen, K. F. , & Onyango, A. W. (2013). Contextualising complementary feeding in a broader framework for stunting prevention. Maternal & Child Nutrition, 9(S2), 27–45. 10.1111/mcn.12088 [DOI] [PMC free article] [PubMed] [Google Scholar]
- UNICEF, WHO, FANTA, & USAID (2017). Meeting report on reconsidering, refining, and extending the World Health Organization infant and young child feeding indicators. New York: Unicef, WHO, FANTA, USAID; Retrieved from https://data.unicef.org/wp-content/uploads/2017/11/IYCF-consultation-report-1.pdf [Google Scholar]
- White, J. M. , Bégin, F. , Kumapley, R. , Murray, C. , & Krasevec, J. (2017). Complementary feeding practices: Current global and regional estimates. Maternal & Child Nutrition, 13(S2), e12505 10.1111/mcn.12505 [DOI] [PMC free article] [PubMed] [Google Scholar]
- World Health Organization (1995). Physical status: The use and interpretation of anthropometry—Report of a WHO expert committee (Vol. 854). World Health Organization technical report series Geneva: World Health Organization; Retrieved from https://apps.who.int/iris/bitstream/handle/10665/37003/WHO_TRS_854.pdf?sequence=1 [PubMed] [Google Scholar]
- World Health Organization (2000). Complementary feeding: Family foods for breasfed children. Geneva: World Health Organization; Retrived from https://apps.who.int/iris/bitstream/handle/10665/66389/WHO_NHD_00.1.pdf;jsessionid=0D94D1FCDA6F20526EA71747684280C6?sequence=1 [Google Scholar]
- World Health Organization (2005). Guiding principles for feeding non‐breastfed children 6–24 months of age. Geneva: World Health Organization; Retrieved from https://apps.who.int/iris/bitstream/handle/10665/43281/9241593431.pdf?sequence=1 [Google Scholar]
- World Health Organization (2006). WHO child growth standards: Length/height‐for‐age, weight‐for‐age, weight‐for‐length, weight‐forheight and body mass index‐for‐age: Methods and development. Geneva: World Health Organization; Retrieved from https://www.who.int/childgrowth/standards/Technical_report.pdf?ua=1 [Google Scholar]
- World Health Organization (2008). Indicators for assessing infant and young child feeding practices—Part I: Definitions. Geneva: World Health Organization; Retrieved from https://apps.who.int/iris/bitstream/handle/10665/43895/9789241596664_eng.pdf?sequence=1 [Google Scholar]
- World Health Organization (2010). Indicators for assessing infant and young child feeding practices—Part II: Measurement. Geneva: World Health Organization; Retrieved from https://apps.who.int/iris/bitstream/handle/10665/44306/9789241599290_eng.pdf?ua=1 [Google Scholar]
- Women's Dietary Diversity Project (WDDP) Study Group (2017). Development of a dichotomous indicator for population‐level assessment of dietary diversity in women of reproductive age. Current Developments in Nutrition, 1 10.3945/cdn.117.001701 [DOI] [PMC free article] [PubMed] [Google Scholar]