

Abstract
Infants and toddlers have high nutritional requirements relative to body size but consume small amounts of food and therefore need nutrient‐dense complementary foods. A cross‐sectional study included children aged 6–24 months, stratified in three age categories (6–11 months, 12–17 months and 18–24 months) and randomly selected from an urban (n = 158) and a rural (n = 158) area, both of low socio‐economic status, in the KwaZulu‐Natal Province of South Africa. Dietary diversity and nutrient density of the complementary diet (excluding breast milk and formula milk) based on a repeated 24‐h dietary recall was assessed. For breastfeeding children, nutrient density of the complementary diet was adequate for protein, vitamin A and vitamin C; and inadequate for 100% of children for zinc, for >80% of children for calcium, iron and niacin; and between 60% and 80% of children for vitamin B6 and riboflavin. Urban/rural differences in density for animal and plant protein, cholesterol and fibre occurred in 18–24‐month‐old children. Fewer than 25% of children consumed ≥4 food groups, with no urban/rural differences. Higher dietary diversity was associated with higher nutrient density for protein and several of the micronutrients including calcium, iron and zinc. The poor nutrient density for key micronutrients can probably be ascribed to lack of dietary variety, and little impact of mandatory fortification of maize meal/wheat flour on infants/toddlers' diet. Targeted strategies are needed to enable mothers to feed their children a more varied diet.
Keywords: breastfeeding, infant feeding, complementary foods, micronutrients, food and nutrient intake, infant formula
Introduction
Childhood malnutrition is highly prevalent in developing countries, with inappropriate feeding practices being the major contributing factor to the high morbidity among infants and young children (WHO 2000). Black et al. (2013) estimated that 3.1 million child deaths annually or 45% of all child deaths in 2011 were attributed to undernutrition. Inappropriate feeding practices, including inadequate complementary feeding are recognised by the Innocenti Declaration on Infant and Young Child Feeding (2005) as significant threats to child health. Ensuring adequate nutrition during complementary feeding is a global health priority, but meeting nutritional needs of 6‐ to 24‐month‐old children is challenging (Dewey 2013), with dietary quality, rather than quantity often being the main problem (Lutter & Rivera 2003). Infants and toddlers need nutrient‐dense complementary foods, expressed as the amount of each nutrient per 100 kcal (Dewey 2013). Target nutrient densities for the complementary diet of breastfeeding infants have been set, based on the amounts of energy and nutrients required from complementary foods (Dewey & Brown 2003).
Complementary foods are often nutritionally inadequate in low‐income countries (Gibson et al. 2010). South Africa, although a middle‐income country, is considered as one of the 34 countries with the highest burden of stunting on a global level (Bhutta et al. 2013) and local studies from certain parts of the country have indicated poor infant‐ and young child‐feeding practices. Faber (2005), for example, reported that complementary foods offered to 6‐ to 12‐month‐old breastfeeding infants of poor socio‐economic status was of poor nutritional quality, with low intakes of animal and dairy products contributing towards the low nutrient density of the complementary diet for particularly iron, zinc and calcium. Porridge made with maize meal is commonly used as complementary food by South African mothers (Mamabolo et al. 2004; Faber 2005; Mushaphi et al. 2008) and although fortification of commercial maize meal was mandated in 2003 (Department of Health 2003), the impact thereof on infant nutrition is probably minimal because of the small amounts that infants and young children consume. The dependence on plant‐based staples (such as maize meal) and addition of inexpensive fats and sugar to maize meal porridge as barriers to optimal complementary feeding were highlighted in a review paper by Du Plessis et al. (2013). The World Health Organization (WHO 2002) acknowledges the role of centrally processed fortified foods in ensuring adequate complementary diets. Commercial baby products are available in South Africa but fortified infant cereals are consumed often in inadequate quantities because of the typical use of diluting infant cereals by mothers (Faber & Benadé 2001; Oelofse et al. 2002), probably because of the cost of these products. Poverty, insufficient knowledge on infant feeding and cultural practices may affect the adequacy of the complementary diet (Du Plessis et al. 2013).
A variety of foods in the diet is needed to ensure that the nutrient needs of breastfed and non‐breastfed children are met (WHO 2001, 2005) and the concept of dietary variety is embedded in the South African paediatric food‐based dietary guidelines (Bowley et al. 2007). Dietary diversity may be used as an indicator of the micronutrient adequacy of the diet in infants and children (Steyn et al. 2006; Moursi et al. 2008). It therefore follows that the adequacy of the complementary diet will depend on the availability and affordability of a variety of foods in the household, particularly in households where poverty limits food procurement. Rural–urban differences in dietary diversity for South African adults have been reported (Labadarios et al. 2011). The aim of this study was to determine dietary diversity and nutrient density of the complementary diet for 6‐ to 24‐month‐old urban and rural children, and relate the nutrient density of the complementary diet to achievement of minimum dietary diversity.
Key messages.
Prevalence of breastfeeding was not optimal: ~20% of children were never been breastfed; only 14.4% of 18–24 month old children were breastfeeding.
Nutrient density of the complementary diet was inadequate for zinc, calcium, iron, and, to a lesser extent, niacin and vitamin B6.
Nutrient density was higher for animal protein and cholesterol, and lower for fiber and plant protein for 18–24 month old urban children, compared to rural children.
Minimum dietary diversity was achieved by <25% children; higher dietary diversity was associated with higher nutrient density for protein and several micronutrients.
A strong focus on the nutritional quality of the complementary diet is needed.
Methods
Study population and study participants
The study had a cross‐sectional design. Research participants were recruited through house‐to‐house visits from two study areas in the KwaZulu‐Natal Province of South Africa, i.e. a low socio‐economic urban area near Pinetown and a rural area in the Valley of the Thousand Hills. A stratified sample of primary caregivers of 158 randomly selected children between the ages of 6 and 24 months were recruited per study area, stratified per age category (6–11 months, 12–17 months and 18–24 months).
From July to September 2011, data were collected using an interviewer‐administered questionnaire that was designed to collect information on household socio‐demographics and breastfeeding and complementary feeding, using the guidelines of Gross et al. (1997) and WHO/UNICEF (2010). The questions were adapted according to the local conditions and face validity was determined through discussions with local fieldworkers and key informants from the two study areas. The questionnaire was translated into the local language (i.e. isiZulu), and the translation was verified though back translation and group discussions with Zulu‐speaking fieldworkers. Corrections were made where needed. The questionnaire was piloted on a convenience sample of five primary caregivers per area (these caregivers were excluded from the larger study).
To gain a better understanding of the different foods consumed, a set of unquantified food frequency questions was used to obtain descriptive qualitative information on the usual consumption of foods by the children during the past 7 days. The set of questions that was used has been tested for face and content validity and has previously been used in similar studies (Faber & Benadé 2007; Smuts et al. 2008). The caregiver had a choice of five options to describe the child's usual intake of listed foods. The five options were (1) everyday; (2) most days (not everyday but at least 4 days per week); (3) once a week (at least once a week, but less often than 4 days a week); (4) seldom (less than once a week/infrequently); and (5) never.
Macro‐ and micronutrient intakes for the 6‐ to 24‐month‐old children were quantified through repeated (two) 24‐h dietary recalls that were done approximately 1 week apart and on different days of the week (Gibson 2005). The fieldworkers worked Monday to Friday, and the dietary data collected for the total groups therefore covered one weekend and four weekdays (Sunday through to Thursday). During the 24‐h dietary recall interview, a standardised ‘dietary kit’ that included examples of food containers and wrappers, plastic food models, household utensils and three‐dimensional sponge models was used to help the caregivers and fieldworkers visualize, quantify and record food consumption for the previous day. In addition, dry oats was used to quantify portion sizes of certain food items, especially cooked food. The caregiver used the dry oats to indicate the quantity resembling the amount of food that the child consumed, which the fieldworker then quantified using a measuring cup.
Processing and statistical analysis of the data
Data were entered into either Microsoft Excel or SPSS data files. Quality control was conducted to correct obvious errors in the data set. Questionnaire data were analysed using SPSS for Windows, version 21 (SPSS Inc., Chicago, IL, USA).
For the 24‐h recall data, food intake reported in household measures was converted into weight using the MRC Food Quantities Manual (Langenhoven et al. 1991). The SAS software package (version 9.2; SAS Institute Inc., Cary, NC, USA) was used to convert food intake to macro‐ and micronutrients, using the SAFOODS2000 database (Wolmarans et al. 2010). The nutrient density of the complementary diet (excluding breast milk and formula milk) was calculated (amount of each nutrient per 416 kJ). For breastfeeding children, the nutrient density of the complementary diet was compared with the 2002 WHO recommended nutrient densities as summarized by Dewey & Brown (2003). Food intake data for the first 24‐h recall was used to calculate the dietary diversity score (DDS) and the proportion of children consuming a diet with minimum dietary diversity (at least four of the seven food groups during the 24‐h recall period) was determined (WHO/UNICEF 2010). Children were grouped according to dietary diversity (≤3 groups and ≥4 groups). Nutrient density of the complementary diet was related to dietary diversity, and rural and urban areas were compared. Differences between groups were determined using a non‐parametric t‐test (comparing median values), analysis of variance (comparing mean values) and χ 2 test and Bonferroni z‐test (categorical data). Statistical significance was set at P < 0.05.
Ethical considerations
This dietary survey preceded the study ‘Acceptability and use of a fortified food supplement for infants and young children in South Africa’ that determined the acceptance of a fortified food supplement by primary caregivers of 6‐ to 24‐month‐old children. The joint proposal that included both the dietary survey and the acceptance study was approved by the Ethics Committee of the Medical Research Council (EC10‐012).
Permission to collect the data in the two study areas was obtained from the community leaders/councillors. The primary caregivers were informed verbally regarding the aim and nature of the study and they were asked to sign a consent form.
Results
Socio‐demographic information on the study participants
Information on the study participants is given in Table 1. Education levels and marital status of the caregivers differed between the rural and urban areas. Most of the households had access to tap water, mostly through their own tap outside the house (rural) or communal tap (urban). More urban than rural households had electricity; 38.6% of the rural households used an open fire inside the dwelling to cook food. Nearly all (>90%) of both urban and rural households obtained food from local shops and/or shops in town. The informal market was an important source of food for urban households, while local food production (home gardens, communal gardens and livestock) was a source of food for rural households. More than 80% of both rural and urban households were recipients of a child support grant.
Table 1.
Socio‐demographic characteristics of the study participants
| Rural (n = 158) | Urban (n = 158) | P‐value* | |||
|---|---|---|---|---|---|
| n | % | n | % | ||
| With whom was the interview | 0.175 | ||||
| Mother of the child | 106 | 67.1 | 117 | 74.1 | |
| Caregiver of the child | 52 | 32.9 | 41 | 25.9 | |
| Educational level | <0.001 | ||||
| Did not attend school | 13 | 8.2 | 3 | 1.9 | |
| Grade 1–7 | 35 | 22.2 | 22 | 13.9 | |
| Grade 8–11 | 67 | 42.4 | 100 | 63.3 | |
| Grade 12 or higher | 43 | 27.2 | 33 | 20.9 | |
| Marital status | <0.001 | ||||
| Married | 34 | 21.5 | 18 | 11.4 | |
| Living together | 2 | 1.3 | 33 | 20.9 | |
| Single | 116 | 73.4 | 100 | 63.3 | |
| Widowed | 6 | 3.8 | 7 | 4.4 | |
| Household's source of drinking water | <0.001 | ||||
| Own tap – inside the house | 6 | 3.8 | 9 | 5.7 | |
| Own tap – outside the house | 133 | 84.2 | 42 | 26.6 | |
| Public tap/communal tap | 3 | 1.9 | 101 | 63.9 | |
| Neighbour's tap | 15 | 9.5 | 4 | 2.5 | |
| Borehole | 1 | 0.6 | 2 | 1.3 | |
| Household's toilet facilities | <0.001 | ||||
| Flush toilet | 7 | 4.4 | 14 | 8.9 | |
| Pit toilet | 111 | 70.3 | 144 | 91.1 | |
| Government toilet † | 40 | 25.3 | 0 | 0 | |
| Electricity available inside the home | 0.026 | ||||
| Yes | 123 | 77.8 ‡ | 138 | 87.3 § | |
| No | 35 | 22.2 | 20 | 12.7 | |
| Main energy source for cooking food | <0.001 | ||||
| Electricity | 87 | 55.1 | 123 | 77.8 | |
| Wood, open fire inside dwelling | 61 | 38.6 | 1 | 0.6 | |
| Wood, open fire outside dwelling | 6 | 3.8 | 4 | 2.5 | |
| Gas or paraffin | 4 | 2.5 | 30 | 19.0 | |
| Food sources during the last month | |||||
| Local shops | 151 | 95.6 | 144 | 91.1 | 0.114 |
| Shops in town | 157 | 99.4 | 154 | 97.5 | 0.176 |
| Informal market | 8 | 5.1 | 90 | 57.0 | <0.001 |
| Home garden | 63 | 39.9 | 8 | 5.1 | <0.001 |
| Community garden | 18 | 11.4 | 3 | 1.9 | <0.001 |
| Own livestock | 54 | 34.2 | 1 | 0.6 | <0.001 |
| Food from the veld | 465 | 29.1 | 22 | 13.9 | <0.001 |
| Sources of income during the last month | |||||
| Own and/or husband's income or salary | 34 | 21.5 | 42 | 26.6 | 0.292 |
| Child support or maintenance | 3 | 1.9 | 6 | 3.8 | 0.310 |
| Living in family or friends or borders | 32 | 20.3 | 45 | 28.5 | 0.088 |
| Child social grant | 137 | 86.7 | 128 | 81.0 | 0.169 |
| Old age pension/disability grant | 74 | 46.8 | 35 | 22.2 | <0.001 |
| Sale of food and/or handwork | 36 | 22.8 | 6 | 3.8 | <0.001 |
*χ 2 test. †Materials and specification to build were given by Department of Human Settlement as a way to ensure basic sanitation for all South Africans (http://www.dhs.gov.za/content/Housing%20Programmes/Programmes.htm). ‡13.0% of these households reportedly did not always have electricity during the last month because they did not have enough money to buy electricity. §36.9% of these households reportedly did not always have electricity during the last month because they did not have enough money to buy electricity.
Breastfeeding and complementary feeding practices
Information on breastfeeding and complementary feeding practices is given in Table 2. In both the urban and the rural area, just over 20% of the children were never been breastfed. Prevalence of breastfeeding decreased with age, and only 14.4% of children in the 18–24‐month age category (rural and urban combined) were being breastfed at the time of the survey. For those children who received milk feeds other than breast milk (n = 124), either formula milk (n = 105; 84.7%) or full cream milk powder (n = 19; 15.3%) was given. Prevalence of formula milk decreased with age. For those using formula milk, 25.2% of caregivers mixed the correct amount of formula with water (1 scoop on 25 mL water); 8.8% used less than 25 mL water per scoop formula (too concentrated) while 66% used more than the recommended amount of water (too dilute). The mean age for introducing solid foods was 3.5 months in the rural area and 4.2 months in the urban area. The most popular first solid food was maize meal porridge, followed by infant cereals.
Table 2.
Infant‐feeding practices
| Rural (n = 158) | Urban (n = 158) | |||
|---|---|---|---|---|
| n | % | n | % | |
| Children ever been breastfed | 125 | 79.1 | 124 | 78.5 |
| Currently breastfeeding | ||||
| 6–11 months (n = 54 per area) | 25 | 46.3 | 35 | 64.8 |
| 12–17 months (n = 52 per area) | 24 | 46.2 | 23 | 44.2 |
| 18–24 months old (n = 52 per area) | 6 | 11.5 | 9 | 17.3 |
| Baby gets milk feeds other than breast milk | ||||
| 6–11 months (n = 54 per area) | 33 | 61.1 | 30 | 55.6 |
| 12–17 months (n = 52 per area) | 20 | 38.5 | 15 | 28.8 |
| 18–24 months old (n = 52 per area) | 13 | 25.0 | 13 | 25.0 |
| Mean (SD) age of introducing solids (months)* | 3.5 | (1.6) | 4.2 | (1.7) |
| First solid food given | ||||
| Commercial jarred baby foods | 15 | 9.5 | 14 | 8.9 |
| Infant cereals | 31 | 19.6 | 37 | 23.4 |
| Maize meal porridge | 110 | 69.6 | 94 | 59.5 |
| Porridge, other than maize meal | 1 | 0.6 | 3 | 1.9 |
| Potatoes/rice/butternut | 0 | 0 | 5 | 3.2 |
SD, standard deviation. *Rural vs. urban, analysis of variance, P = 0.002.
As indication at which age foods were either introduced or excluded from the complementary diet, the percentage of children who reportedly ate specific foods at least once during the 7 days preceding the survey is shown in Figs 1, 2, 3, 4, 5, 6. Approximately one in three children in the 6–11‐month‐old age category ate infant cereals and jarred baby foods; this decreased to 11–21% in the 12–17‐month‐old age category and decreased further to <6% in the 18–24‐month‐old age category (Fig. 1).
Figure 1.

Percentage of children who ate infant foods at least once during the past 7 days, per age category and area.
Figure 2.

Percentage of children who ate specific starch foods at least once during the past 7 days, per age category and area. (grey = rural; black = urban)
Figure 3.

Percentage of children who ate animal source foods and legumes at least once during the past 7 days, per age category and area. (grey = rural; black = urban)
Figure 4.
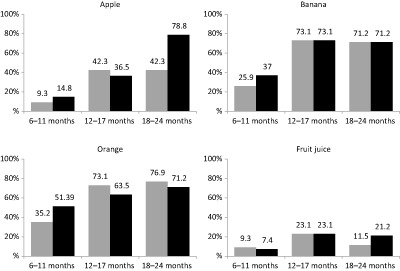
Percentage of children who ate specific fruit and drank fruit juice at least once during the past 7 days, per age category and area. (grey = rural; black = urban)
Figure 5.

Percentage of children who ate specific vegetables at least once during the past 7 days, per age category and area. (grey = rural; black = urban)
Figure 6.

Percentage of children who ate sweets, cakes/biscuits, chips/niknaks and drank cold drink and tea at least once during the past 7 days, per age category and area. (grey = rural; black = urban)
Soft porridge made with maize meal was eaten at least once during the past 7 days by >80% of the children in all three age categories in both areas (Fig. 2; it was eaten daily by 60.8% of the rural children and 42.4% of the urban children). Consumption of stiff maize meal porridge was lower in the 6–11‐month‐old age category (37–44.4%), but in the two older age categories, >80% of the children ate stiff porridge at least once per week. Bread consumption increased with age, with bread consumption being higher in the urban than in the rural area. Home‐made bread was eaten more in the rural area, compared with the urban area. Consumption of rice was lower in the 6–11‐month‐old age category (29.6–37%), but in the two older age categories, >69% of the children ate rice at least once per week.
For legumes and most of the animal source foods (Fig. 3), consumption increased from 6–11 months to 12–17 months, and remained similar thereafter.
For rural and urban children combined, the percentage of children who consumed fruit at least once per week increased from 31.6% in the 6–12‐month‐old age category to 57.7% in the 18–24‐month‐old age category; while for vegetables, it increased from 43.5% to 66.3%. The most frequently consumed fruits were oranges and bananas, followed by apples (Fig. 4). For 6–11‐month‐old children, butternut was the most frequently consumed vegetable, while cabbage was the most frequently consumed vegetable for children 12 months and older (Fig. 5).
Close to 20% of children 12 months and older consumed fizzy drinks at least once a week (Fig. 6). Consumption of cakes/biscuits and sweets increased over the age categories. A high percentage of children ate salty snacks (i.e. niknaks and chips) from a very young age.
Nutrient density of the complementary diet
The median and interquartile range for nutrient density (amount of a specific nutrient per 416 kJ) of the complementary diet (excluding breast milk and formula milk) per age category are given in Table 3. Energy (kJ) provided by the complementary diet increased significantly across the three age categories. Nutrient density increased across the three groups for total protein, poly‐unsaturated fats, vitamin B6 and vitamin E, and from 6–11 months to 12–17 months only for plant protein, animal protein, cholesterol, magnesium and zinc. Nutrients for which the nutrient density decreased across the three age groups are phosphorous, vitamin A and thiamin. Nutrients for which nutrient density decreased from 6–11 months to 12–17 months and then remained more or less stable are total carbohydrates, vitamin C and vitamin D.
Table 3.
Median (interquartile range) for micronutrient density (amount per 416 kJ) of the complementary diet
| 6–11 months | 12–17 months | 18–24 months | P‐value | |
|---|---|---|---|---|
| (n = 108) | (n = 104) | (n = 104) | ||
| Median (interquartile range) | Median (interquartile range) | Median (interquartile range) | ||
| Energy (kJ) | 1627 (1268; 2294) | 3112 (2481; 4278) | 3809 (3335; 4581) | < 0.001 |
| Nutrient/416 kJ | ||||
| Protein (g) | 2.28a (1.92; 2.69) | 2.79b (2.38; 3.33) | 2.78c (2.34; 3.22) | <0.001 |
| Plant protein (g) | 1.48a (1.18; 1.96) | 1.81b (1.51; 2.17) | 1.84b (1.54; 2.18) | 0.015 |
| Animal protein (g) | 0.107a (0.001; 0.686) | 0.784b (0.008; 1.406) | 0.781b (0.280; 1.380) | <0.001 |
| Fat (g) | 2.66 (1.58; 3.36) | 2.88 (2.34; 3.31) | 2.77 (2.34; 3.36) | 0.547 |
| Sat fat (g) | 0.427 (0.206; 0.656) | 0.512 (0.402; 0.644) | 0.502 (0.388; 0.647) | 0.094 |
| MU fat (g) | 0.562 (0.243; 1.134) | 0.643 (0.491; 0.881) | 0.656 (0.469; 0.810) | 0.310 |
| PU fat (g) | 0.733a (0.325; 1.135) | 1.085b (0.819; 1.327) | 1.167c (0.999; 1.462) | <0.001 |
| Cholesterol (mg) | 0.722a (0.000; 2.929) | 2.710b (0.440; 5.424) | 3.165b (1.195; 6.071) | <0.001 |
| Carbohydrates (g) | 16.14a (14.01; 18.91) | 15.06b (13.77; 16.17) | 15.27b (13.99; 16.00) | 0.017 |
| Added sugar (g) | 1.70 (0.46; 2.89) | 1.47 (0.78; 2.76) | 1.89 (0.97; 2.59) | 0.224 |
| Fibre (g) | 1.26 (1.01; 1.64) | 1.41 (1.15; 1.71) | 1.40 (1.16; 1.62) | 0.058 |
| Calcium (mg) | 24.41 (12.60; 48.17) | 19.26 (14.12; 33.21) | 18.60 (11.48; 24.06) | 0.157 |
| Iron (mg) | 0.843 (0.673; 1.101) | 0.823 (0.710; 0.969) | 0.794 (0.639; 0.899) | 0.547 |
| Magnesium (mg) | 13.81a (11.31; 17.22) | 15.54b (13.72; 17.56) | 15.41b (12.81; 16.70) | <0.049 |
| Potassium (mg) | 97.46 (70.36; 127.24) | 1034.54 (88.47; 114.29) | 98.38 (92.55; 112.53) | 0.297 |
| Phosphorous (mg) | 55.02a (43.69; 66.22) | 49.26b (45.08; 57.33) | 45.00c (38.47; 53.00) | <0.001 |
| Zinc (mg) | 0.467a (0.356; 0.594) | 0.543b (0.467; 0.615) | 0.532b (0.467; 0.650) | <0.012 |
| Copper (mg) | 0.062 (0.048; 0.078) | 0.066 (0.058; 0.079) | 0.067 (0.059; 0.076) | 0.172 |
| Vitamin A (µg RE) | 44.49a (30.27; 72.80) | 29.24b (21.88; 42.21) | 24.47c (19.23; 33.36) | <0.001 |
| Thiamin (mg) | 0.116a (0.090; 0.139) | 0.103b (0.090; 0.117) | 0.097c (0.079; 0.110) | <0.001 |
| Riboflavin (mg) | 0.0483 (0.033; 0.070) | 0.0652 (0.040; 0.084) | 0.049 (0.035; 0.069) | 0.451 |
| Niacin (mg) | 0.779 (0.630; 0.974) | 0.767 (0.567; 1.018) | 0.783 (0.617; 0.930) | 0.892 |
| Vitamin B6 (mg) | 0.096a (0.083; 0.119) | 0.118b (0.100; 0.161) | 0.132c (0.111; 0.170) | <0.001 |
| Folate (µg) | 24.48 (15.52; 33.81) | 27.38 (23.17; 33.97) | 26.06 (19.10; 30.80) | 0.356 |
| Vitamin B12 (µg) | 0.052 (0.008; 0.127) | 0.033 (0.009; 0.140) | 0.042 (0.007; 0.114) | 0.638 |
| Panthothenic acid (mg) | 0.200 (0.144; 0.315) | 0.217 (0.156; 0.325) | 0.188 (0.145; 0.306) | 0.382 |
| Vitamin C (mg) | 5.23a (1.79; 10.18) | 3.15b (1.71; 6.45) | 3.14b (1.73; 5.41) | <0.017 |
| Vitamin D (µg) | 0.181a (0.013; 0.600) | 0.091b (0.018; 0.337) | 0.049b (0.011; 0.251) | <0.007 |
| Vitamin E (mg) | 0.591a (0.315; 0.844) | 0.846b (0.644; 1.157) | 1.000c (0.777; 1.218) | <0.001 |
MU, mono‐unsaturated; P, significance of differences across medians, non‐parametric t‐test; PU, poly‐unsaturated; RE, retinol equivalents. Superscript letters that are the same means that the mean values do not differ significantly from each other at the 0.5 significance level. P‐values in bold are statistically significant.
When comparing nutrient density of the complementary diet between the rural and urban children it differed only for a few nutrients (Table 4). For the younger children, aged 6–11 months, the urban complementary diet had a higher vitamin A density compared with the rural complementary diet. For the older children, aged 18–23 months, the urban diet had a higher nutrient density for animal protein, cholesterol and lower nutrient density for plant protein and fibre. No differences in nutrient densities were observed for the 12–17‐month‐old age category.
Table 4.
Median (interquartile range) nutrient densities (amount per 416 kJ) that differed significantly between the rural and urban children
| 6–11 months | 18–24 months | |||
|---|---|---|---|---|
| Rural (n = 54) | Urban (n = 54) | Rural (n = 52) | Urban (n = 52) | |
| Vitamin A (µg RE) | 37.78 (31.58; 57.44) | 56.92 (29.72; 95.60) | ||
| Plant protein (g) | 1.91 (1.58; 2.20) | 1.70 (1.52; 2.05) | ||
| Animal protein (g) | 0.600 (0.141; 1.173) | 1.001 (0.485; 1.620) | ||
| Cholesterol (mg) | 2.34 (0.93; 5.77) | 4.49 (1.18; 6.55) | ||
| Fibre (g) | 1.46 (1.30; 1.63) | 1.311 (1.12; 1.59) | ||
| Niacin (mg) | 0.697 (0.570; 0.831) | 0.858 (0.687; 1.051) | ||
RE, retinol equivalents.
The percentage of breastfeeding children aged 6–17 months (rural and urban combined) for whom the complementary diet was inadequate in terms of density for specific nutrients is shown on Table 5. The two younger age categories were combined because of relatively low numbers of children breastfeeding; the eight children aged 18–24 months who were breastfed at the time of the survey were excluded from these analyses. Nutrient density of the complementary diet was adequate for all breastfeeding children for protein, vitamin A and vitamin C. Nutrient density of the complementary diet was inadequate for all breastfeeding children for zinc, for >80% of children for calcium, iron and niacin, and between 60% and 80% of children for vitamin B6 and riboflavin.
Table 5.
Percentage of breastfeeding children aged 6–17 months (n = 100) for whom the complementary diet had a low* nutrient density
| 6–17 months | |
|---|---|
| (n = 100) | |
| % | |
| Calcium (mg) | 95 |
| Iron (mg) | 94 |
| Zinc (mg) | 100 |
| Vitamin A (µg RE) | 0 |
| Thiamin (mg) | 48 |
| Riboflavin (mg) | 64 |
| Niacin (mg) | 89 |
| Vitamin B6 (mg) | 77 |
| Folate (µg) | 4 |
| Vitamin C (mg) | 0 |
RE, retinol equivalents. *WHO reference values for adequate nutrient density (Dewey & Brown 2003).
Dietary diversity
The percentage of children who consumed at least one food item, during the first 24‐h recall period, from each of the seven food groups that were used to calculate the DDS, is shown in Table 6. ‘Cereals and roots/tubers’ was consumed by >85% of the children across the three age groups in both areas. ‘Legumes’, ‘flesh foods’ and ‘other vegetables and fruit’ were consumed by 30–60% of children in the two older age categories. Differences were found between the two areas in the 18–24‐month‐old age category for ‘legumes’ and ‘flesh foods’. A higher percentage of children from the rural group consumed legumes and a lower percentage consumed flesh foods compared with the urban group. Among the 6–11‐month‐aged children, a lower percentage in the rural group consumed ‘other vegetables and fruit’ compared with the urban group.
Table 6.
Percentage of children who consumed specific food groups during the first 24‐h recall period and dietary diversity score based on the food groups consumed, by age category and area
| Rural | Urban | |||||
|---|---|---|---|---|---|---|
| 6–11 months | 12–17 months | 18–24 months | 6–11 months | 12–17 months | 18–24 months | |
| (n = 54) | (n = 52) | (n = 52) | (n = 54) | (n = 52) | (n = 52) | |
| % | % | % | % | % | % | |
| Cereals and roots/tubers | 88.9 | 98.1 | 100 | 85.2 | 100 | 100 |
| Legumes* | 20.4 | 46.2 | 63.5 | 13.0 | 46.2 | 34.6 |
| Dairy | 11.1 | 23.1 | 19.2 | 18.5 | 30.8 | 28.8 |
| Flesh foods † | 11.1 | 32.7 | 30.8 | 9.3 | 40.4 | 51.9 |
| Eggs | 5.6 | 5.8 | 5.8 | 5.6 | 5.8 | 5.8 |
| Vitamin A‐rich vegetables and fruit | 14.8 | 13.5 | 13.5 | 16.7 | 11.5 | 11.5 |
| Other vegetables and fruit ‡ | 7.4 | 42.3 | 55.8 | 22.2 | 36.5 | 44.2 |
| DDS < 4 | 94.4 | 82.7 | 76.9 | 96.3 | 78.8 | 78.8 |
| DDS ≥ 4 | 5.6 | 17.3 | 23.1 | 3.7 | 21.2 | 21.2 |
DDS, dietary diversity score. *P = 0.003 rural vs. urban: 18–24 months. † P = 0.029 rural vs. urban: 18–24 months. ‡ P = 0.030 rural vs. urban: 6–11 months.
Although some differences were observed in the percentage of children who ate foods from specific food groups, the percentage of children who consumed a diet of adequate diversity (DDS ≥ 4) did not differ between the rural and urban areas. Less than 25% of children achieved the minimum required number of food groups (≥4).
Nutrient density of the complementary diet according to dietary diversity
The median nutrient density of the complementary diet per dietary diversity category (<4 and ≥4) is given in Table 7. Because of the small number of children with a DDS ≥ 4, the comparison of nutrient density according to dietary diversity was done by combining all 12–24‐month‐old urban and rural children. The complementary diet with DDS ≥ 4 provided a higher nutrient density for protein and several of the micronutrients (i.e. calcium, iron, magnesium, potassium, phosphorus, zinc, riboflavin, niacin and vitamin D) than did the diet with DDS < 4.
Table 7.
Median (interquartile range) for micronutrient density (amount per 416 kJ) of the complementary diet according to dietary diversity score (DDS) for children 12–24 months old
| DDS < 4 | DDS ≥ 4 | P‐value | |
|---|---|---|---|
| (n = 165) | (n = 43) | ||
| Median (interquartile range) | Median (interquartile range) | ||
| Energy (kJ) | 4145 (3491; 4928) | 4849 (4303; 5553) | 0.009 |
| Nutrient/416 kJ | |||
| Protein (g) | 2.57 (2.14; 3.02) | 3.00 (2.61; 3.24) | 0.014 |
| Plant protein (g) | 1.59 (1.18; 1.95) | 1.79 (1.26; 2.18) | 0.065 |
| Animal protein (g) | 0.843 (0.458; 1.386) | 1.058 (0.571; 1.516) | 0.073 |
| Fat (g) | 3.28 (2.65; 3.95) | 3.43 (2.70; 4.03) | 0.391 |
| Cholesterol (mg) | 4.06 (1.50; 8.25) | 4.97 (2.25; 11.90) | 0.633 |
| Carbohydrates (g) | 14.25 (13.26; 15.41) | 13.60 (12.67; 15.22) | 0.231 |
| Added sugar (g) | 1.59 (0.80; 2.42) | 1.48 (0.71; 2.50) | 0.313 |
| Fibre (g) | 1.15 (0.86; 1.49) | 1.20 (0.93; 1.42) | 0.119 |
| Calcium (mg) | 23.76 (14.50; 36.49) | 34.22 (21.90; 54.89) | 0.020 |
| Iron (mg) | 0.750 (0.588; 0.896) | 0.887 (0.719; 1.017) | 0.020 |
| Magnesium (mg) | 13.87 (11.78; 15.80) | 13.98 (12.01; 15.81) | 0.020 |
| Potassium (mg) | 98.56 (86.93; 112.60) | 105.94 (96.18; 111.92) | 0.013 |
| Phosphorous (mg) | 43.01 (37.85; 52.25) | 53.12 (44.01; 60.75) | 0.049 |
| Zinc (mg) | 0.519 (0.423; 0.640) | 0.622 (0.545; 0.720) | 0.001 |
| Copper (mg) | 0.067 (0.061; 0.076) | 0.066 (0.056; 0.074) | 0.053 |
| Vitamin A (µg RE) | 37.92 (21.19; 56.36) | 40.27 (27.47; 60.50) | 0.299 |
| Thiamin (mg) | 0.089 (0.073; 0.106) | 0.094 (0.077; 0.107) | 0.935 |
| Riboflavin (mg) | 0.055 (0.042; 0.089) | 0.071 (0.049; 0.103) | 0.038 |
| Niacin (mg) | 0.716 (0.580; 0.900) | 0.897 (0.745; 0.998) | 0.032 |
| Vitamin B6 (mg) | 0.115 (0.088; 0.151) | 0.128 (0.099; 0.170) | 0.160 |
| Folate (µg) | 23.44 (18.23; 28.67) | 24.95 (18.56; 30.37) | 0.599 |
| Vitamin B12 (µg) | 0.070 (0.019; 0.158) | 0.110 (0.056; 0.177) | 0.268 |
| Panthothenic acid (mg) | 0.227 (0.163; 0.339) | 0.309 (0.221; 0.393) | 0.067 |
| Vitamin C (mg) | 4.09 (2.28; 6.81) | 5.35 (3.18; 8.89) | 0.094 |
| Vitamin D (µg) | 0.084 (0.024; 0.441) | 0.324 (0.056; 0.631) | 0.017 |
| Vitamin E (mg) | 0.997 (0.810; 1.186) | 1.052 (0.768; 1.218) | 0.421 |
P, significance of differences across medians – non‐parametric t‐test; RE, retinol equivalents. P‐values in bold are statistically significant.
Discussion
Breastfeeding and complementary feeding practices
Complementary feeding is the transition from a diet of breast milk and/or infant formula to one that includes solid foods and other beverages (Fein et al. 2008). The timing of this transition, how infants are fed and the foods and beverages they are given at various ages can exert short‐term and long‐term health implications (Fein et al. 2008). In spite of several programmes and guidelines developed to promote, protect and support exclusive breastfeeding of infants until 6 months of age with continued breastfeeding up to 2 years or beyond (WHO 2002; Hendricks et al. 2007; Department of Health 2013), we found that a consistent percentage (∼20%) of children was never breastfed, and only 14.4% of 18–24‐month‐old children were currently breastfeeding. It may well be that the relatively high percentage of children who were never breastfed reflects the previous guidelines for HIV‐infected mothers, i.e. either exclusive breastfeeding or exclusive formula feeding for the first 6 months, and the policy that allowed distribution of free formula milk through primary health care facilities in South Africa to mitigate the risk of HIV transmission through breast milk (Department of Health 2007). South Africa consequently adopted the 2010 WHO guidelines on HIV and infant feeding to rectify this situation, recommending that all HIV‐infected mothers should breastfeed their infants and receive antiretroviral drugs to prevent HIV transmission (The Tshwane Declaration of Support for Breastfeeding in South Africa 2011).
Early cessation of breastfeeding is common in South Africa (Doherty et al. 2012) and a qualitative study in a peri‐urban community showed that awareness of the benefits of breastfeeding was not sufficient to motivate mothers to breastfeed, as the benefits were outweighed by several social factors that resulted in formula feeding being the preferred infant‐feeding choice (Ijumba et al. 2014). Moreover, contrary to WHO recommendations (WHO 2001), but in line with other studies in the South African context (Mamabolo et al. 2004; MacIntyre et al. 2005; Mostert et al. 2005; Sibeko et al. 2005; Ghuman et al. 2009), our results confirmed that complementary feeding was initiated before the recommended age of 6 months. Various inappropriate infant‐feeding practices were followed. In particular, the high percentage of children who ate salty snacks from a very young age as well the percentages of children 12 months and older who consumed cakes/biscuits, sweets and carbonated drinks are of concern. The results of a systematic review showed that consumption of sugar‐sweetened beverages during the first 5 years of life was associated with overweight and obesity later in life (Monasta et al. 2010). Furthermore, the excessive use of foods/beverages with a high content in fat, sodium and sugars early in life may in fact lead to increased risk of long‐term diseases (Agostoni et al. 2009; Du Plessis et al. 2013). The frequent consumption of tea, which has an inhibitory effect on iron bioavailability because of its polyphenol content, may have a negative impact on iron status (Zaida et al. 2006). In rural South African infants, tea intake was shown to be a risk factor for anaemia (Faber 2007).
Renewed commitments have been made by the South African government to address the poor local breastfeeding figures, and, through the Tshwane Declaration South Africa ‘has been declared as a country that actively promotes, protects and supports exclusive breastfeeding, and takes actions to demonstrate this commitment’ (The Tshwane Declaration of Support for Breastfeeding in South Africa 2011). These commitments and the capacity for the necessary actions need to be filtered down to the decentralised government system in order to create an enabling environment at district level to implement most needed interventions (Gillespie et al. 2013).
Nutrient density of and dietary diversity of complementary diet
Although the WHO defines formula milk as a complementary food (to emphasize and encourage breastfeeding), we excluded formula milk when defining the complementary diet, based on the view that complementary feeding is the transition from a diet of breast milk and/or infant formula to one that includes solid foods and other beverages (Fein et al. 2008). In vulnerable communities, the ability of local complementary foods to satisfy the requirements for iron, zinc and calcium is a great challenge as the diets are usually dominated by cereal‐based porridges with low nutrient density and poor mineral bioavailability (Dewey 2013). With regard to iron, the European Society for Paediatric Gastroenterology, Hepatology and Nutrition Committee (Agostoni et al. 2009) states that ‘During the complementary feeding period, >90% of the iron requirements of a breast‐fed infant must be met by complementary foods, which should provide sufficient bioavailable iron’. Nevertheless, in disadvantaged populations, while protein density of typical complementary diets is generally adequate, iron and zinc, followed by other micronutrients depending on the types of foods consumed, are ‘problem nutrients’ (Dewey 2013).
When compared with the WHO target nutrient densities of the complementary diet (Dewey & Brown 2003), the protein density of the complementary diet for breastfeeding children in our sample was adequate for all children while a large number of children showed inadequacy of density for calcium, iron, zinc and niacin. Calcium, iron and zinc have been identified as problem nutrients in the complementary diet of infants in developing countries (Vossenaar & Solomons 2012; Vossenaar et al. 2013), and it will probably be difficult for the complementary diet to provide adequate amounts of these nutrients in the absence of fortified foods (Gibson et al. 2010). According to Pelto et al. (2013), home fortification through the use of, e.g. micronutrient powders and lipid‐based nutrient supplements are potentially feasible interventions to be introduced in South Africa, but thoughtful behaviour change communication programmes to support their adoption would be required (Pelto et al. 2013), and of course, mothers of nutritionally vulnerable children should have easy access to these products. Kimmons et al. (2005) showed in 6–12‐month‐old Bangladeshi infants that overall low nutrient intakes were attributed to the poor nutrient density of the complementary diet, and argued that much larger amounts of animal foods were needed in the complementary diet to ensure adequate iron and zinc intakes. Animal source foods are good sources of protein and micronutrients and low intakes of these foods are a risk factor for stunting in children (Black et al. 2008).
Low dietary diversity is common in South Africa in all age groups and in different settings (Steyn et al. 2006; Faber et al. 2009; Labadarios et al. 2011; Acham et al. 2012; Drimie et al. 2013). Diets low in micronutrients probably reflect the infrequent intake of foods of animal origin as well as of fruits and vegetables. Although data from the 24‐h dietary recall showed that fortified staple foods were frequently consumed, with more than 90% of the children across the three age categories eating maize meal porridge during the recall period, the micronutrient density of the complementary diet was inadequate for several key nutrients such as calcium, iron and zinc. This seems to confirm that the national food fortification programme of maize meal and wheat flour is not sufficient to ensure adequate nutrient intake in infants and toddlers because of the small amounts of food that these paediatric populations consume.
Only a few differences between the urban and rural groups in nutrient density were observed. Most notably was the finding that compared with that of the rural peers, the urban diet for 18–24‐month‐old children had a higher nutrient density for animal protein and cholesterol and lower nutrient density for fibre and plant protein. This reflects the higher consumption of flesh foods and lower consumption of legumes in the urban area, compared with the rural area. These results seem to indicate that the effect of urbanization on dietary intake was already prevalent at this very young age. In South Africa, the Nutrition Transition (i.e. the departure from traditional prudent diets towards westernised eating patterns and lifestyles) has been well documented across all ages (Bourne et al. 2002; Vorster et al. 2005; Feeley et al. 2009; Van Zyl et al. 2010). It has been established that western food choices are associated with increases in overweight, obesity and non‐communicable chronic disease risks (Bourne et al. 2002; Vorster et al. 2005; Kimani‐Murage et al. 2010), which may exert deleterious immediate and/or long‐term impacts on children and adolescent health when starting early in life (Biro & Wien 2010). It is worthwhile to recall that the South African context is typified by a complex series of challenges for health workers and policy makers; they include the coexistence of under‐ and over‐nutrition; infectious diseases associated with poverty and under‐nutrition; chronic diseases linked to over‐nutrition and a western type of diet and lifestyle; HIV/AIDS epidemic and injury‐related deaths (Pillay‐van Wyk et al. 2013; Shisana et al. 2013)
Dietary diversification is one of the main strategies advocated internationally for the improvement of micronutrient intake and status. DDSs have been positively correlated with increased mean micronutrient adequacy of complementary foods (Moursi et al. 2008). More than 70% of the children in our study consumed a complementary diet of inadequate variety, with no urban/rural differences. Cereals and starchy foods, especially maize‐based foods, were the foods consumed most, while the intake of animal/dairy products, fruits and vegetables was smaller. As expected, higher dietary diversity of the current complementary diet provided higher nutrient densities for key nutrients such as calcium, iron and zinc. It may well be that the low DDS achieved in the study resulted in the low nutrient density of the complementary diet for iron, zinc and calcium.
These results support the concept of promoting a more varied diet from a very young age to improve nutritional status and functional outcomes of infants and small children in poor socio‐economic communities. However, the question remains though whether poor households have the ability to feed their children a more varied (and nutritionally more adequate) diet. Studies in South Africa revealed that households with low dietary diversity were also the most impoverished (Faber et al. 2009; Labadarios et al. 2011). In our sample, the majority of the caregivers were single, and less than 30% earned a salary, suggesting that it may be challenging for the caregivers to feed their children a nutritionally more adequate diet. In this context, it is worthwhile to note that within the South African context, healthier food choices were shown to be more expensive than commonly consumed foods, and it was argued that a healthy diet was unaffordable for the large majority of the population (Temple et al. 2011; Schönfeldt et al. 2013).
However, opportunities present itself for education on the importance of infant and young child feeding. Poor food choices, as reflected in the poor breastfeeding and formula‐feeding practices, use of expensive jarred baby foods, consumption of fizzy drinks, tea, cakes and pastries as well as sugary and salty snacks, among others, could be addressed through various channels, i.e. during consultations at antenatal and well‐baby clinic visits, testing and utilization of paediatric food‐based dietary guidelines, messages in the Road to Health Booklet, advocacy linked to the child support grant via social services and campaigns aimed at awareness around the importance of nutrition during the first thousand days of life.
Furthermore, improving dietary diversity through agricultural biodiversity, specifically in the rural areas where home and community gardens are in use, could make an important contribution to nutrition‐sensitive intervention programmes, which could hold promise for supporting improvements in nutritional outcomes (Ruel & Alderman 2013).
The results of this study clearly indicate that there should be a much stronger focus on the nutritional quality of the complementary diet. Targeted strategies are needed to enable mothers to feed their children a more varied diet. Consequently, messages and guidelines about the use of high‐quality, locally available foods and enriched complementary foods, must be implemented and strengthened to improve caregiver practices.
Source of funding
This work was supported by a grant from the South African Sugar Association (project 223). The South African Sugar Association had no role in the design, analysis or writing of this paper.
Conflicts of interest
The authors declare that they have no conflicts of interest.
Contributions
MF: conceptualised and designed the study; data collection and analysis; drafted the manuscript. RL: dietary analysis; academic input in writing of the manuscript. CB: academic input in writing of the manuscript.
Acknowledgements
The authors thank the mothers and children who participated in the study; the fieldworkers and nutrition monitors who assisted with data collection; and Lee‐Ann Human who captured the data.
Faber, M. , Laubscher, R. , and Berti, C. (2016) Poor dietary diversity and low nutrient density of the complementary diet for 6‐ to 24‐month‐old children in urban and rural KwaZulu‐Natal, South Africa. Maternal & Child Nutrition, 12: 528–545. doi: 10.1111/mcn.12146.
References
- Acham H., Oldewage‐Theron W.H. & Egal A.A. (2012) Dietary diversity, micronutrient intake and their variation among black women in informal settlements in South Africa: a cross‐sectional study. International Journal of Nutrition and Metabolism 4, 24–39. [Google Scholar]
- Agostoni C., Braegger C., Decsi T., Kolacek S., Koletzko B., Michaelsen K.F. et al (2009) Breast‐feeding: a commentary by the ESPGHAN Committee on Nutrition. Journal of Pediatric Gastroenterology and Nutrition 49, 112–125. [DOI] [PubMed] [Google Scholar]
- Bhutta Z.A., Das J.K., Rizvi A., Gaffey M.F., Walker N., Horton S. et al (2013) Evidence‐based interventions for improvement of maternal and child nutrition: what can be done and at what cost? Lancet 382, 452–477. [DOI] [PubMed] [Google Scholar]
- Biro F.M. & Wien M. (2010) Childhood obesity and adult morbidities. The American Journal of Clinical Nutrition 91, 1499S–1505S. [DOI] [PMC free article] [PubMed] [Google Scholar]
- Black R.E., Allen L.H., Bhutta Z.A., Caulfield L.E., de Onis M., Ezzati M. et al (2008) Maternal and child undernutrition: global and regional exposures and health consequences. Lancet 371, 243–260. [DOI] [PubMed] [Google Scholar]
- Black R.E., Victora C.G., Walker S.P., Bhutta Z.A., Christian P., de Onis M. et al (2013) Maternal and child undernutrition and overweight in low‐income and middle income countries. Lancet 382, 427–451. [DOI] [PubMed] [Google Scholar]
- Bourne L.T., Lambert E.V. & Steyn K. (2002) Where does the black population of South Africa stand on the nutrition transition? Public Health Nutrition 5, 157–162. [DOI] [PubMed] [Google Scholar]
- Bowley N.A., Pentz‐Kluyts M.A., Bourne L.T. & Marino L.V. (2007) Feeding the 1 to 7‐year‐old child. A support paper for the South African paediatric food‐based dietary guidelines. Maternal and Child Nutrition 3 (4), 281–291. [DOI] [PMC free article] [PubMed] [Google Scholar]
- Department of Health (2003. ). Government Notice: Department of Health. Foodstuffs, Cosmetics and Disinfectants Act, No. R 2003. (Act No. 54 of 1972). Regulations relating to the fortification of certain foodstuffs. South African Department of Health: Pretoria.
- Department of Health (2007) Infant and Young Child Feeding Policy. South African Department of Health: Pretoria. [Google Scholar]
- Department of Health (2013) Infant and Young Child Feeding Policy. South African Department of Health: Pretoria. [Google Scholar]
- Dewey K.G. (2013) The challenge of meeting nutrient needs of infants and young children during the period of complementary feeding: an evolutionary perspective. The Journal of Nutrition 143, 2050–2054. [DOI] [PMC free article] [PubMed] [Google Scholar]
- Dewey K.G. & Brown K.H. (2003) Update on technical issues concerning complementary feeding of young children in developing countries and implications for intervention programs. Food and Nutrition Bulletin 24, 5–28. [DOI] [PubMed] [Google Scholar]
- Doherty T., Sanders D., Jackson D., Swanevelder S., Lombard C., Zembe W. et al (2012) Early cessation of breastfeeding amongst women in South Africa: an area needing urgent attention to improve child health. BMC Pediatrics 12, 105. [DOI] [PMC free article] [PubMed] [Google Scholar]
- Drimie S., Faber M., Vearey J. & Nunez L. (2013) Dietary diversity of formal and informal residents in Johannesburg, South Africa. BMC Public Health 13, 911–919. [DOI] [PMC free article] [PubMed] [Google Scholar]
- Du Plessis L.M., Kruger H.S. & Sweet L. (2013) Complementary feeding: a critical window of opportunity from six months onwards. South African Journal of Clinical Nutrition 26, S129–S140. [Google Scholar]
- Faber M. (2005) Complementary foods consumed by 6–12‐month‐old rural infants in South Africa are inadequate in micronutrients. Public Health Nutrition 8, 373–381. [DOI] [PubMed] [Google Scholar]
- Faber M. (2007) Dietary intake and anthropometric status differ for anemic and non‐anemic rural South African infants aged 6–12 months. Journal of Health, Population, and Nutrition 25 (3), 285–293. [PMC free article] [PubMed] [Google Scholar]
- Faber M. & Benadé A.J.S. (2001) Perceptions of infant cereals and dietary intakes of children aged 4–24 months in a rural South African community. International Journal of Food Sciences and Nutrition 52, 359–365. [DOI] [PubMed] [Google Scholar]
- Faber M. & Benadé A.J.S. (2007) Breastfeeding, complementary feeding and nutritional status of 6–12‐month‐old infants in rural KwaZulu‐Natal. South African Journal of Clinical Nutrition 20, 16–24. [Google Scholar]
- Faber M., Schwabe C. & Drimie S. (2009) Dietary diversity in relation to other household food security indicators. International Journal of Food Safety, Nutrition, and Public Health 2, 1–15. [Google Scholar]
- Feeley A., Pettifor J. & Norris S. (2009) Fast‐food consumption among 17‐year‐olds in the birth to twenty cohort. South African Journal of Clinical Nutrition 22, 118–123. [Google Scholar]
- Fein S.B., Labiner‐Wolfe J., Scanlon K.S. & Grummer‐Strawn L.M. (2008) Selected complementary feeding practices and their association with maternal education. Pediatrics 122, S91–S97. [DOI] [PubMed] [Google Scholar]
- Ghuman M.R., Saloojee H. & Morris G. (2009) Infant feeding practices in a high HIV prevalence rural district of KwaZulu‐Natal, South Africa. South African Journal of Clinical Nutrition 22, 74–79. [Google Scholar]
- Gibson R.S. (2005) Principles of Nutritional Assessment, 2nd edn Oxford University Press: Oxford. [Google Scholar]
- Gibson R.S., Bailey K.B., Gibbs M. & Fergusson E.L. (2010) A review of phytate, iron, zinc, and calcium concentrations in plant‐based complementary foods used in low‐income countries and implications for bioavailability. Food and Nutrition Bulletin 31, S134–S146. [DOI] [PubMed] [Google Scholar]
- Gillespie S., Haddad L., Mannar V., Menon P. & Nisbett N. (2013) The politics of reducing malnutrition: building commitment and accelerating progress. Lancet 382, 552–569. [DOI] [PubMed] [Google Scholar]
- Gross R., Kielmann A., Korte R., Scheneberger H. & Schultink W. (1997) Guidelines for Nutrition Baseline Surveys in Communities. T.W. System (Thailand) Co., Ltd.: Thailand. [Google Scholar]
- Hendricks M.K., Goeiman H. & Dhansay A. (2007) Food‐based dietary guidelines and nutrition interventions for children at primary healthcare facilities in South Africa. Maternal and Child Nutrition 3, 251–258. [DOI] [PMC free article] [PubMed] [Google Scholar]
- Ijumba P., Doherty T., Jackson D., Tomlinson M., Sanders D. & Persson L.‐A. (2014) Social circumstances that drive early introduction of formula milk: an exploratory qualitative study in a peri‐urban South African community. Maternal and Child Nutrition 10, 102–111. [DOI] [PMC free article] [PubMed] [Google Scholar]
- Innocenti Declaration on Infant and Young Child Feeding 2005. Available at: http://www.unicef.org/nutrition/files/innocenti2005m_FINAL_ARTWORK_3_MAR.pdf (accessed 10 April 2014).
- Kimani‐Murage E.W., Kahn K., Pettifor J.M., Tollman S.M., Dunger D.B., Gómez‐Olivé X.F. et al (2010) The prevalence of stunting, overweight and obesity, and metabolic disease risk in rural South African children. BMC Public Health 10, 158–170. [DOI] [PMC free article] [PubMed] [Google Scholar]
- Kimmons J.E., Dewey K.G., Haque E., Chakraborty J., Osendarp S.J.M. & Brown K.H. (2005) Low nutrient intakes among infants in rural Bangladesh are attributable to low intake and micronutrient density of complementary foods. The Journal of Nutrition 135, 444–451. [DOI] [PubMed] [Google Scholar]
- Labadarios D., Steyn N.P. & Nel J. (2011) How diverse is the diet of adult South Africans? Nutrition Journal 10, 33 Available at: http://www.nutritionj.com/content/10/1/33 (accessed 27 August 2011). [DOI] [PMC free article] [PubMed] [Google Scholar]
- Langenhoven M.L., Conradie P.J., Wolmarans P. & Faber M. (1991) MRC Food Quantities Manual, 1991, 2nd edn South African Medical Research Council: Parow. [Google Scholar]
- Lutter C.K. & Rivera J.A. (2003) Nutritional status of infants and young children and characteristics of their diets. The Journal of Nutrition 133, 2941S–2949S. [DOI] [PubMed] [Google Scholar]
- MacIntyre U.E., de Villiers F.P.R. & Baloyi P.G. (2005) Early infant feeding practices of mothers attending a postnatal clinic in Ga‐Rankuwa. South African Journal of Clinical Nutrition 18, 70–75. [Google Scholar]
- Mamabolo R.L., Alberts M., Mbenyane G.X., Steyn N.P., Nthangeni N.G., Delemarre‐Van de Waal H.A. et al (2004) Feeding practices and growth of infants from birth to 12 months in the central region of the Limpopo Province of South Africa. Nutrition 20, 327–333. [DOI] [PubMed] [Google Scholar]
- Monasta L., Batty G.D., Cattaneo A., Lutje V., Ronfani L., Van Lenthe F.J. et al (2010) Early‐life determinants of overweight and obesity: a review of systematic reviews. Obesity Reviews 11 (10), 695–708. [DOI] [PubMed] [Google Scholar]
- Mostert D., Steyn N.P., Temple N.J. & Olwagen R. (2005) Dietary intake of pregnant women and their infants in a poor black South African community. Curationis 28, 12–19. [DOI] [PubMed] [Google Scholar]
- Moursi M.M., Arimond M., Dewey K.G., Trèche S., Ruel M.T. & Delpeuch F. (2008) Dietary diversity is a good predictor of the micronutrient density of the diet of 6‐ to 23‐month‐old children in Madagascar. The Journal of Nutrition 138, 2448–2453. [DOI] [PubMed] [Google Scholar]
- Mushaphi L.F., Mbhenyane X.G., Khoza L.B. & Amey A.K.A. (2008) Infant‐feeding practices of mothers and the nutritional status of infants in the Vhembe District of Limpopo Province. South African Journal of Clinical Nutrition 21 (2), 36–41. [Google Scholar]
- Oelofse A., van Raaij J.M.A., Benadé A.J.S., Dhansay M.A., Tolboom J.J.M. & Hautvast J.G.A.L. (2002) Disadvantaged black and coloured infants in two urban communities in the Western Cape, South Africa differ in micronutrient status. Public Health Nutrition 5, 289–294. [DOI] [PubMed] [Google Scholar]
- Pelto G.H., Armar‐Klemesu M., Siekmann J. & Schofield D. (2013) The focused ethnographic study ‘assessing the behavioral and local market environment for improving the diets of infants and young children 6 to 23 months old’ and its use in three countries. Maternal and Child Nutrition 9 (Suppl. 1), 35–46. [DOI] [PMC free article] [PubMed] [Google Scholar]
- Pillay‐van Wyk V., Msemburi W., Laubscher R., Dorrington R.E., Groenewald P., Richard Matzopoulos R. et al (2013) Second National Burden of Disease Study South Africa: national and subnational mortality trends, 1997–2009. Lancet 381, S113. [Google Scholar]
- Ruel M.T. & Alderman H. (2013) Nutrition‐sensitive interventions and programmes: how can they help to accelerate progress in improving maternal and child nutrition? Lancet 382, 552–569. [DOI] [PubMed] [Google Scholar]
- Schönfeldt H.C., Hall N. & Bester M. (2013) Relevance of food‐based dietary guidelines to food and nutrition security: a South African perspective. Nutrition Bulletin 38, 226–235. [Google Scholar]
- Shisana O., Labadarios D., Rehle T., Simbayi L., Zuma K., Dhansay A. et al (2013) South African National Health and Nutrition Examination Survey (SANHANES‐1). HSRC Press: Cape Town. [Google Scholar]
- Sibeko L., Dhansay M.A., Charlton K.E., Johns T. & Gray‐Donald K. (2005) Beliefs, attitudes, and practices of breastfeeding mothers from a periurban community in South Africa. Journal of Human Lactation 21, 31–38. [DOI] [PubMed] [Google Scholar]
- Smuts C.M., Faber M., Schoeman S.E., Laubscher J.A., Oelofse A., Benadé A.J.S. et al (2008) Socio‐demographic profiles and anthropometric status of 0‐ to 71‐month‐old children and their caregivers in rural districts of the Eastern Cape and KwaZulu‐Natal provinces of South Africa. South African Journal of Clinical Nutrition 21 (3), 117–124. [Google Scholar]
- Steyn N.P., Nel J.H., Nantel G., Kennedy G. & Labadarios D. (2006) Food variety and dietary diversity scores in children: are they good indicators of dietary adequacy? Public Health Nutrition 9, 644–650. [DOI] [PubMed] [Google Scholar]
- Temple N.J., Steyn N.P., Fourie J. & De Villiers A. (2011) Price and availability of healthy food: a study in rural South Africa. Nutrition (Burbank, Los Angeles County, Calif.) 27 (2), 55–58. [DOI] [PubMed] [Google Scholar]
- The Tshwane Declaration of Support for Breastfeeding in South Africa (2011) South African Journal of Clinical Nutrition 24 (4), 214. [Google Scholar]
- Van Zyl M.K., Steyn N.P. & Marais M.L. (2010) Characteristics and factors influencing fast food intake of young adult consumers in Johannesburg, South Africa. South African Journal of Clinical Nutrition 23, 124–130. [Google Scholar]
- Vorster H.H., Venter C.S., Wissing M.P. & Margetts B.M. (2005) The nutrition and health transition in the North West Province of South Africa: a review of the THUSA (Transition and Health during Urbanisation of South Africans) study. Public Health Nutrition 8, 480–490. [DOI] [PubMed] [Google Scholar]
- Vossenaar M. & Solomons N.W. (2012) The concept of ‘critical nutrient density’ in complementary feeding: the demands on the ‘family foods’ for the nutrient adequacy of young Guatemalan children with continued breastfeeding. The American Journal of Clinical Nutrition 95 (4), 859–866. [DOI] [PubMed] [Google Scholar]
- Vossenaar M., Hernández L., Campos R. & Solomons N.W. (2013) Several ‘problem nutrients’ are identified in complementary feeding of Guatemalan infants with continued breastfeeding using the concept of ‘critical nutrient density’. European Journal of Clinical Nutrition 67 (1), 108–114. [DOI] [PubMed] [Google Scholar]
- WHO (2000) Infant and Young Child Nutrition. Technical Consultation on Infant and Young Child Feeding. World Health Organization: Geneva. A53/INF.DOC/2. [Google Scholar]
- WHO (2001) Guiding Principles for Complementary Feeding of the Breastfed Child. World Health Organization: Geneva. [Google Scholar]
- WHO (2002) Complementary Feeding. Report of the Global Consultation. Geneva, 10–13 December 2001. World Health Organization: Geneva. [Google Scholar]
- WHO (2005) Guiding Principles for Feeding Non‐Breastfed Children 6–24 Months of Age. World Health Organization: Geneva. [Google Scholar]
- WHO/UNICEF (2010) Indicators for Assessing Infant and Young Child Feeding Practices. Part 2: Measurement. World Health Organization: Geneva. [Google Scholar]
- Wolmarans P., Danster N., Dalton A., Rossouw K. & Schönfeldt H. (2010) Condensed Food Composition Tables for South Africa. Medical Research Council: Cape Town. [Google Scholar]
- Zaida F., Bureau F., Guyot S., Sedki A., Lekouch N., Arhan P. et al (2006) Iron availability and consumption of tea, vervain and mint during weaning in Morocco. Annals of Nutrition and Metabolism 50 (3), 237–241. [DOI] [PubMed] [Google Scholar]