

Abstract
Pregnant women and newborns are at increased risk of vitamin D deficiency. Our objective was to create a global summary of maternal and newborn vitamin D status. We completed a systematic review (1959–2014) and meta‐analysis of studies reporting serum 25‐hydroxyvitamin D [25(OH)D] concentration in maternal and newborn populations. The 95 identified studies were unevenly distributed by World Health Organization (WHO) region: Americas (24), European (33), Eastern Mediterranean (13), South‐East Asian (7), Western Pacific (16) and African (2). Average maternal 25(OH)D concentrations (nmol L−1) by region were 47–65 (Americas), 15–72 (European), 13–60 (Eastern Mediterranean), 20–52 (South‐East Asian), 42–72 (Western Pacific) and 92 (African). Average newborn 25(OH)D concentrations (nmol L−1) were 35–77 (Americas), 20–50 (European), 5–50 (Eastern Mediterranean), 20–22 (South‐East Asian), 32–67 (Western Pacific) and 27–35 (African). The prevalences of 25(OH)D <50 and <25 nmol L−1 by WHO region in pregnant women were: Americas (64%, 9%), European (57%, 23%), Eastern Mediterranean (46%, 79%), South‐East Asian (87%, not available) and Western Pacific (83%, 13%). Among newborns these values were: Americas (30%, 14%), European (73%, 39%), Eastern Mediterranean (60%, not available), South‐East Asian (96%, 45%) and Western Pacific (54%, 14%). By global region, average 25(OH)D concentration varies threefold in pregnant women and newborns, and prevalence of 25(OH)D <25 nmol L−1 varies eightfold in pregnant women and threefold in newborns. Maternal and newborn 25(OH)D concentrations are highly correlated. Addressing vitamin D deficiency in pregnant women and newborns should be a global priority. To protect children from the adverse effects of vitamin D deficiency requires appropriate interventions during both pregnancy and childhood.
Keywords: prevalence, 25‐hydroxyvitamin D, vitamin D deficiency, pregnancy, newborn, vitamin D
Introduction
Two recent meta‐analyses have shown that lower serum 25‐hydroxyvitamin D [25(OH)D] concentrations during pregnancy are associated with poor health outcomes for pregnant women and newborns (Aghajafari et al. 2013; Wei et al. 2013). The first meta‐analysis examined 31 observational studies using a range of serum 25(OH)D concentration cut‐off values (from 20 to 80 nmol L−1) and showed that lower serum 25(OH)D concentration during pregnancy was associated with an increased risk of gestational diabetes, pre‐eclampsia and small for gestational age (Aghajafari et al. 2013). The second meta‐analysis examined 24 studies and showed that a serum 25(OH)D concentration <50 nmol L−1 was associated with an increased risk of gestational diabetes, pre‐eclampsia, preterm birth and small for gestational age (Wei et al. 2013).
Likewise, four global summaries of vitamin D status across the complete age range were published in the past 5 years (Hagenau et al. 2009; Mithal et al. 2009; Arabi et al. 2010; Hilger et al. 2014). The first meta‐analysis examined 394 studies published from 1970 to 2004, including all studies globally that reported original data on serum 25(OH)D concentration (Hagenau et al. 2009). Mean serum 25(OH)D concentration was 54 nmol L−1; serum 25(OH)D concentrations were higher in women compared with men, in Caucasians compared with non‐Caucasians and in subjects >15 years old vs. those younger (Hagenau et al. 2009). The second meta‐analysis examined 195 studies published from 1990 to 2011, including data from 44 countries, to describe patterns of 25(OH)D concentration worldwide by age, sex and region (Hilger et al. 2014). This review reported a mean 25(OH)D concentration range of 5–137 nmol L−1 with 37% of the included studies reporting mean 25(OH)D concentrations <50 nmol L−1 (Hilger et al. 2014). Age‐related differences in 25(OH)D concentrations were observed in the Asia/Pacific and Middle East/African regions, with newborns and institutionalized elderly generally at higher risk of lower serum 25(OH)D concentrations (Hilger et al. 2014). The third meta‐analysis examined 121 published studies from 1962 to 2009 to describe vitamin D status in six global regions: Asia, Europe, Middle East and Africa, Latin America, North America and Oceania (Mithal et al. 2009). This review found that the prevalence of serum 25(OH)D <75 nmol L−1 varied widely (2–97%) in all six study regions. Serum 25(OH)D concentrations <25 nmol L−1 were more prevalent in the Asian (18–48%) and Middle Eastern (9–80%) regions (Mithal et al. 2009). The fourth meta‐analysis focused on the prevalence of vitamin D deficiency in developing countries (Arabi et al. 2010). The review showed wide variability in serum 25(OH)D concentrations between and within different regions. In one‐third to one‐half of those living in sub‐Saharan and Middle Eastern regions serum 25(OH)D concentrations were <25 nmol L−1 (Arabi et al. 2010). Vitamin D status was also described to be lower in China and Mongolia, especially in children, of whom up to 50% were reported to have serum 25(OH)D concentrations <12.5 nmol L−1 (Arabi et al. 2010).
Pregnant women and newborns are recognized as populations at increased risk of poor vitamin D status (Dawodu & Wagner 2007). All four meta‐analyses on vitamin D status in the general population identified women and newborns as groups at increased risk of serum 25(OH)D concentrations <25 nmol L−1 (Hagenau et al. 2009; Mithal et al. 2009; Arabi et al. 2010; Hilger et al. 2014). To date, however, there has been no specific attempt to describe vitamin D status in maternal and newborn populations at a global level. Given the potential for poor vitamin D status during pregnancy to affect maternal and child outcomes that remain important determinants of global health, our objective was to provide a global summary of vitamin D status in pregnant women and newborns.
Key messages.
Globally, vitamin D deficiency, 25‐hydroxyvitamin D [25(OH)D] concentration <50 nmol L−1, is present in 54% of pregnant women and 75% of newborns, and severe vitamin D deficiency, 25(OH)D concentration <25 nmol L−1 in 18% of pregnant women and 29% of newborns.
Currently, vitamin status is poorly defined in the African, South‐East Asian and Eastern Mediterranean regions and in non‐European populations in the Western Pacific region.
Future studies of vitamin D status should report 25(OH)D results using standard cut‐off values of <50 and <25 nmol L−1.
Future studies of vitamin D status should measure 25(OH)D concentrations using assays that have greater accuracy and precision and strong correlation with each other.
Methods
Search method
We identified published epidemiological studies that describe vitamin D status in women, either during pregnancy or at delivery (maternal studies), or in babies at birth (newborn studies). Publications were identified initially through searches of three databases: MEDLINE (Ovid), Embase and Cochrane Library. The search engines of MEDLINE (Ovid) and Embase are similar and, in both, the advanced search engine option was used. A Cochrane Library search was performed using title, abstract or keyword and could not be combined using Boolean operators.
The initial search was for publications reporting vitamin D status in pregnant women. The keywords used were ‘pregnancy’, ‘mother’, ‘maternal’, ‘gestation’, ‘vitamin D’ and ‘cholecalciferol’. Searches using keywords with the same meaning such as pregnancy, mother, maternal and gestation were combined using the Boolean operator ‘OR’. Vitamin D and cholecalciferol were also combined using ‘OR’. Combining similar searches using ‘OR’ resulted in two major searches: maternal and vitamin D that were combined using ‘AND’.
A similar search strategy was used to identify publications on newborn vitamin D status. The keywords used were ‘neonatal’, ‘newborn’, ‘cord blood’, ‘fetal blood’ and ‘infant’. These keywords were combined with ‘OR’ and then combined using ‘AND’ with the keywords for vitamin D (vitamin D or cholecalciferol).
An initial review of titles and abstracts was undertaken followed by an in‐depth review of full papers that could not be excluded by title and abstract alone. We excluded (1) non‐human studies; (2) studies not in English; (3) case reports and commentaries that did not report data on vitamin D status; (4) studies that described vitamin D deficiency outcomes in pregnant women and/or newborns but without actual data on vitamin D status; and (5) other topics unrelated to the objectives of this review such as those papers reporting 25(OH)D data on general populations or on specific population age groups excluding maternal and newborn populations.
Identification and selection of studies
We identified 359 publications through our database searches (Fig. 1). Twenty publications from the 359 retrieved articles were excluded during initial screening. The remaining 339 articles were exported into an EndNote reference manager database. The titles and/or abstracts of all identified studies were reviewed and full manuscripts obtained for all those that appeared potentially relevant. This title/abstract review identified 273 articles as being not relevant and 66 publications as being relevant to this review. Through bibliographic searches of these 66 studies, 29 additional studies were identified. A total of 95 papers were identified as relevant to the review (Supplementary http://onlinelibrary.wiley.com/doi/10.1111/mcn.12210/suppinfo).
Figure 1.
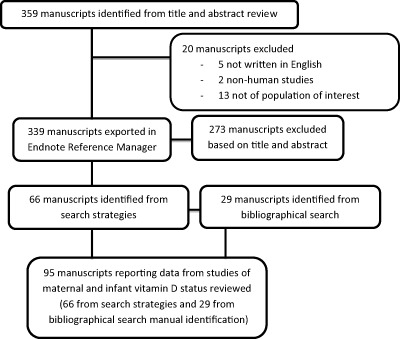
Screening and identification of studies on maternal and infant vitamin D status.
Study characteristics
Study region and time interval
The 95 publications that reported circulating 25(OH)D concentrations in maternal and newborn populations were grouped by World Health Organization (WHO) global region of the study sample (Americas, European, Eastern Mediterranean, South‐East Asian, Western Pacific and African). Once grouped by global region, the studies were further categorized according to decade during which the study was completed. Decade categories used were 1959–1979, 1980–1989, 1990–1999, 2000–2009 and 2010–2014 (Table 1). For publications where the date of sample enrolment was not provided, year of publication was used to define the study decade (Supplementary http://onlinelibrary.wiley.com/doi/10.1111/mcn.12210/suppinfo).
Table 1.
Number of publications reporting vitamin D status in pregnant women and newborns in each WHO region according to decade of sample enrolment or study publication
| WHO region | Region population (in millions; United Nations 2013) | Women aged 15–64 years (in millions; United Nations 2013) | Study year | Total | ||||
|---|---|---|---|---|---|---|---|---|
| 1959–1979 | 1980–1989 | 1990–1999 | 2000–2009 | 2010–2014 | ||||
| Americas | 1497 | 983 | 2 (1) | 1 | 4 (1) | 16 | 1 | 24 |
| European | 740 | 505 | 2 | 5 (4) | 4 (1) | 18 | 2 (1) | 31 |
| Eastern Mediterranean | 4165 | 2821 | 2 (2) | 4 | 9 | 15 | ||
| South‐East Asian | 1 | 4 | 4 (1) | 9 | ||||
| Western Pacific | 37 | 24 | 1 (1) | 1 | 7 (1) | 5 (2) | 14 | |
| African | 1863 | 1016 | 1 | 1 | 2 | |||
| Total | 8302 | 5349 | 4 | 10 | 18 | 55 | 8 | 95 |
WHO, World Health Organization. Numbers in parentheses indicate studies categorized by date of publication rather than of study sample enrolment.
Reporting of maternal and newborn vitamin D status
The 95 publications were then categorized depending upon whether they reported vitamin D status in mothers only (34 publications), newborns only (9 publications) or both (52 publications) (Supplementary http://onlinelibrary.wiley.com/doi/10.1111/mcn.12210/suppinfo). The number of publications was unevenly distributed across the six WHO regions (Fig. 2): Americas (24 publications), European (33), Eastern Mediterranean (13), South‐East Asian (7), Western Pacific (16) and African (2). In the Americas (14/24), European (19/33) and the Eastern Mediterranean (9/13) regions a larger proportion of the studies were on pregnant woman–newborn pairs then on either mothers or newborns separately (Fig. 2).
Figure 2.
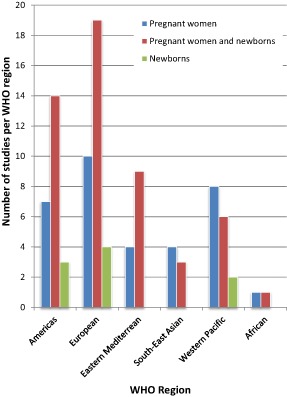
Number of studies of vitamin D status of pregnant women and of newborn populations by World Health Organization (WHO) region.
Meta‐analysis
Without access to the raw data reported in each publication, we performed a meta‐analysis to allow statistical comparison between WHO regions for the following outcomes: maternal and newborn 25(OH)D concentrations and prevalences of vitamin D deficiency and severe deficiency in these same two groups. In order to combine all the studies per region and to be able to generate a single mean 25(OH)D value for each region, the mean, standard deviation and sample size of each included study were used to calculate the standard error (SE), weight percentage (W%) and weight percentage average 25(OH)D (W% × mean) concentration (Cleophans & Zwinderman 2007). The W% × mean for each study per region was added to provide an overall average serum 25(OH)D concentration for each region. Similarly, for prevalence of deficiency (<50 nmol L−1) and severe deficiency (<25 nmol L−1), W% × prevalence was calculated for all studies with the required information.
Defining vitamin D status
Of the 95 papers identified, 27 reported mean serum 25(OH)D concentration, four reported median serum 25(OH)D concentration and nine reported prevalence of deficiency (Table 2 and Supplementary http://onlinelibrary.wiley.com/doi/10.1111/mcn.12210/suppinfo). Two measures: mean 25(OH)D concentration and prevalence of deficiency were reported in 42 studies, median 25(OH)D concentration and prevalence of deficiency in 12 studies, and mean and median 25(OH)D concentration in one study (Table 2 and Supplementary http://onlinelibrary.wiley.com/doi/10.1111/mcn.12210/suppinfo).
Table 2.
Measures used to report maternal and newborn vitamin D status by WHO region
| WHO region | Vitamin D status measure | |||||
|---|---|---|---|---|---|---|
| Mean 25(OH)D | Median 25(OH)D | Deficiency prevalence | Mean 25(OH)D and deficiency | Median 25(OH)D and deficiency | Mean and median 25(OH)D | |
| Americas | 7 | 2 | 12 | 2 | ||
| European | 13 | 3 | 2 | 10 | 4 | |
| Eastern Mediterranean | 2 | 1 | 2 | 9 | 1 | |
| South‐East Asian | 3 | 1 | 4 | 1 | ||
| Western Pacific | 2 | 2 | 6 | 4 | ||
| African | 1 | 1 | ||||
| Total | 27 | 4 | 9 | 42 | 12 | 1 |
25(OH)D, 25‐hydroxyvitamin D; WHO, World Health Organization.
Serum 25(OH)D concentrations used to define vitamin D deficiency
In publications describing prevalence of maternal and newborn vitamin D deficiency, different 25(OH)D concentrations were used (Table 3). The serum 25(OH)D concentrations most frequently used to define abnormally low serum 25(OH)D concentrations were <25 and <50 nmol L−1. Twenty‐eight studies used <25 nmol L−1, and 22 used <50 nmol L−1 (Supplementary http://onlinelibrary.wiley.com/doi/10.1111/mcn.12210/suppinfo).
Table 3.
Serum 25‐hydroxyvitamin D concentrations used to categorize vitamin D status by WHO region
| Units | 25‐hydroxyvitamin D concentration in nmol L−1 | |||||||||||
|---|---|---|---|---|---|---|---|---|---|---|---|---|
| nmol L−1 | <12.5 | <20 | <25 | <27.5 | <28 | <30 | <31.2 | <35 | <37.5 | <50 | <75 | <80 |
| WHO region | ||||||||||||
| Americas | 2 | 1 | 6 | 6 | 1 | |||||||
| European | 1 | 2 | 8 | 1 | 1 | 5 | ||||||
| EM | 8 | 1 | 1 | 1 | 1 | 1 | ||||||
| SE Asian | 4 | 1 | 4 | |||||||||
| WP | 6 | 1 | 6 | 1 | ||||||||
| African | 1 | |||||||||||
| Total | 1 | 2 | 28 | 3 | 1 | 3 | 1 | 1 | 6 | 22 | 2 | 1 |
EM, Eastern Mediterranean; SE, South‐East; WHO, World Health Organization; WP, Western Pacific.
It was not possible to use all 12 25(OH)D cut‐off values (Table 3) reported by the 95 studies to define vitamin D deficiency. We chose to focus on two 25(OH)D cut‐off values, <50 and <25 nmol L−1, with 25(OH)D <50 nmol L−1 defining vitamin D deficiency and 25(OH)D <25 nmol L−1 defining severe vitamin D deficiency. For the purpose of this review, regional comparisons of vitamin D deficiency prevalence were made only using studies that reported serum 25(OH)D concentration cut‐off values of <50 and <25 nmol L−1.
Measurement of serum 25(OH)D concentration
Thirteen different assays were used to measure serum 25(OH)D concentration. The detection limit and reported inter‐ and intra‐assay coefficients of variance of these assays vary widely (Table 4). The most commonly used assays were radioimmunoassays (RIA), competitive protein binding assays and liquid chromatography tandem mass spectrometry (LC‐MS/MS). The LC‐MS/MS assay, which is increasingly viewed as the gold standard technique for measuring 25(OH)D concentrations, has been used in only nine (Cockburn et al. 1980; Newhook et al. 2008; Sulaiman et al. 2010; Bendall et al. 2012; Amukele et al. 2013; Gernand et al. 2013; Haggarty et al. 2013; Streym et al. 2013; Grant et al. 2014) of the 95 studies included in the review. However, excellent correlations have been shown between LC‐MS/MS assay and RIA (DiaSorin) (r 2 = 0.95) and LIAISON 25(OH)D assay (r 2 = 0.94) (Eyles et al. 2009; Hee‐Won et al. 2012). Five studies did not report the assay techniques used to measure vitamin D status (Mallet et al. 1986; Ainy et al. 2006; Lee et al. 2007; Karim et al. 2011; Vercruyssen et al. 2012).
Table 4.
Assays used to measure vitamin D concentration and their precision and the use of different assays by WHO region
| Assay | Assay precision | WHO region | Total | |||||||
|---|---|---|---|---|---|---|---|---|---|---|
| Detection limit | Inter‐assay CV (%) | Intra‐assay CV (%) | Americas | European | EM | SE Asian | WP | African | ||
| Chemiluminescence immunoassay | – | 5 | 2–6 | 2 | 2 | 2 | 2 | 8 | ||
| Radioimmunoassay | – | 3–5 | 5–8 | 7 | 7 | 6 | 7 | 3 | 1 | 31 |
| High‐performance liquid chromatography | 1–4 nmol L−1 | 6–8 | – | 3 | 3 | 2 | 8 | |||
| Competitive protein binding assay | 13 nmol L−1 | 5–10 | 10–15 | 4 | 4 | 3 | 3 | 14 | ||
| Liquid chromatography tandem mass spec. | 0.2 nmol L−1 | 6–8 | 8–10 | 2 | 4 | 2 | 1 | 9 | ||
| ELISA | 5–300 nmol L−1 | 2–4 | 4–6 | 3 | 2 | 1 | 1 | 7 | ||
| Roche modular analyser | – | 10–19 | – | 1 | 1 | 1 | 3 | |||
| Radioligand assay | 5 | 6–10 | 1 | 1 | 2 | |||||
| Nichols advantage assay | 5–6 | – | 1 | 1 | 2 | |||||
| LIAISON DiaSorin assay | <10 | <10 | 1 | 1 | 2 | |||||
| Enzyme immunoassay | 1 | 1 | 2 | |||||||
| Radioprotein binding assay | 11 | – | 1 | 1 | 1 | |||||
| IncStar kit | – | 9 | 16 | 1 | ||||||
| 90 | ||||||||||
CV, coefficient of variance; ELISA, enzyme‐linked immunosorbent assay; EM, Eastern Mediterranean; SE South‐East; WHO, World Health Organization; WP, Western Pacific.
Results
Availability of data on maternal and newborn vitamin D status in each WHO region
Of the 95 studies, 63 (66%) have been performed since 2000. The number of studies varied widely by WHO region (from 2 to 31 studies per region). Fifty‐five (58%) of the studies were conducted in the Americas and European regions, in which live 28% of the world's population of women 15–64 years of age (Table 1).
Maternal vitamin D status during pregnancy
Maternal serum 25(OH)D concentration during pregnancy
Large differences were evident between and within most regions in the distribution of mean serum 25(OH)D concentrations in pregnant women (Table 5). In the studies from the Americas region, mean and median 25(OH)D concentrations were within a relatively narrow range (mean 52–60, median 47–65 nmol L−1) (Ginde et al. 2010; Shand et al. 2010; Hollis et al. 2011; Gernand et al. 2013). In contrast, mean 25(OH)D concentrations in pregnant populations in the European region varied more widely (range of means 15–72 nmol L−1). One study from the European region reported a mean 25(OH)D concentration of <25 nmol L−1 (Heckmatt et al. 1979), six studies between 30 and 45 nmol L−1 (Cockburn et al. 1980; Bouillon et al. 1981; Delvin et al. 1982; Nicolaidou et al. 2006; Viljakainen et al. 2010; Halicioglu et al. 2012) and seven between 50 and 72 nmol L−1 (Axelson & Christensen 1988; Javaid et al. 2006; Gale et al. 2008; Vercruyssen et al. 2012; Streym et al. 2013; Weisse et al. 2013; Harvey et al. 2014).
Table 5.
Serum 25(OH)D concentration (nmol L−1) by WHO region and country within each region
| Country | Year* | First author | Maternal and newborn serum 25‐hydroxyvitamin D concentration | |||
|---|---|---|---|---|---|---|
| Maternal | Newborn | |||||
| Mean (±SD) | Median (IQR) | Mean (±SD) | Median (IQR) | |||
| Americas | ||||||
| USA | 1959–1965 | Gernand | 52 ± 27 | |||
| USA | 2001–2006 | Ginde | 65 (60–67) | |||
| Canada | 2004–2007 | Shand | 47 (35–67) | |||
| USA | 2004–2009 | Hollis, 2011 | 60 ± 25 | |||
| USA | 2006–2009 | Belderbos | 77 ± 3 | |||
| USA | 2007 | Basile | 35 ± 20 | |||
| European | ||||||
| UK | 1978–1979 | Heckmatt | 15 ± 13 | |||
| Scotland | 1980 | Cockburn | 17 | 28 | ||
| Belgium | 1981 | Bouillon | 35 ± 15 | 20 ± 10 | ||
| France | 1982 | Delvin | 45 ± 5 | 30 ± 25 | ||
| Sweden | 1986 | Axelson | 50 ± 15 | 35 ± 13 | ||
| UK | 1991–1992 | Gale | 50 (30–75) | |||
| UK | 1991–1992 | Javaid | 50 ± 15 | 35 ± 13 | ||
| UK | 1998–2001 | Harvey | 60 (42–87) | |||
| France | 2003 | Baiz, 2014 | 45 ± 37 | |||
| France | 2003 | Baiz, 2012 | 39 (40) † | |||
| Netherlands | 2003–2004 | Leffelaar | 55 (32–75) | |||
| Greece | 2003–2004 | Nicolaidou | 40 (28–52) | 50 (35–75) | ||
| Germany | 2006–2008 | Weisse | 55 (35–80) | 28 (18–42) | ||
| Finland | 2007 | Viljakainen | 40 ± 13 | 50 ± 15 | ||
| Turkey | 2008 | Halicioglu | 30 ± 13 | 30 ± 18 | ||
| Denmark | 2008–2010 | Streym | 72 ± 30 | 42 ± 20 | ||
| Belgium | 2009–2010 | Vercruyssen | 55 ± 30 | |||
| Eastern Mediterranean | ||||||
| Iran | 1997 | Bassir | 13 ± 25 | 5 ± 10 | ||
| Iran | 1999 | Andiran | 30 ± 10 | 20 ± 8 | ||
| Iran | 2002 | Maghbooli, 2007 | 28 ± 23 | 18 ± 13 | ||
| Iran | 2005 | Salek | 130 ± 90 | 67 ± 28 | ||
| Iran | 2005 | Kazemi | 20 ± 5 | 17 ± 3 | ||
| Pakistan | 2008 | Karim | 60 ± 30 | 50 ± 28 | ||
| Iran | 2008–2009 | Asemi | 18 ± 5 | |||
| South‐East Asian | ||||||
| India | 1997 | Farrant | 37 (25–57) | |||
| India | 1997–1998 | Krishnaveni | 47 (32–67) | |||
| Nepal | 1998–2001 | Jiang | 52 ± 25 | |||
| India | 2002 | Sachan | 35 ± 23 | 20 ± 15 | ||
| India | 2005–2006 | Sahu | 40 (25–57) | |||
| India | 2006–2007 | Marwaha | 20 ± 8 | 22 ± 10 | ||
| Western Pacific | ||||||
| Japan | 1980 | Seino | 42 ± 13 | 32 ± 13 | ||
| NZ | 1997–2001 | Camargo | 45 (30–77) | |||
| Australia | 2008 | Bowyer | 52 (18–175) | 60 (18–245) | ||
| Beijing | 2010–2011 | Song | 72 ± 25 | |||
| Australia | 2011 | Thomas | 47 ± 20 | 67 ± 40 | ||
| Australia | 2011 | Bendall | 115 ± 28 | |||
| Australia | 2012 | Novakovic | 55 ± 15 | 60 ± 18 | ||
| African | ||||||
| Malawi | 2000–2004 | Amukele | 92 ± 5 | 90 (75–110) | 35 ± 8 | 27 (20–47) |
25(OH)D, 25‐hydroxyvitamin D; IQR, interquartile range; SD, standard deviation; WHO, World Health Organization. All mean and median with single values: no SD or IQR provided by the author. *Year of study or if not available year of publication. †Median and IQR: author provided the median as 39.2 nmol L−1 and IQR as 39.7 nmol L−1.
Mean serum 25(OH)D concentrations during pregnancy reported from the Eastern Mediterranean region ranged from 13 to 130 nmol L−1 (Bassir et al. 2001; Andiran et al. 2002; Maghbooli et al. 2007; Salek et al. 2008; Kazemi et al. 2009; Asemi et al. 2010; Karim et al. 2011). Three of the eight studies describing pregnant maternal 25(OH)D status reported a mean 25(OH)D concentration <25 nmol L−1 (Bassir et al. 2001; Kazemi et al. 2009; Asemi et al. 2010) and two a mean 25(OH)D concentrations of 28 and 30 nmol L−1 (Andiran et al. 2002; Maghbooli et al. 2007). Two studies reported 25(OH)D concentrations of 60 and 130 nmol L−1 (Salek et al. 2008; Karim et al. 2011). One of the eight studies, of Isfahani women living in central Iran, reported high 25(OH)D concentrations (130 nmol L−1) (Salek et al. 2008). The authors of this study acknowledged that the values were high compared with other Middle Eastern studies particularly two from Tehran (Bassir et al. 2001; Ainy et al. 2006). They attributed the lower mean serum 25(OH)D concentration in Tehran to the air pollution in Tehran decreasing UVB exposure (Bassir et al. 2001; Ainy et al. 2006; Salek et al. 2008). In the South‐East Asian region, mean serum 25(OH)D concentrations during pregnancy ranged from 20 to 52 nmol L−1. Of the six studies, one reported a mean 25(OH)D concentration <25 nmol L−1 (Marwaha et al. 2011), four reported mean or median 25(OH)D concentrations between 35 and 47 nmol L−1 (Sachan et al. 2005; Farrant et al. 2009; Sahu et al. 2009; Krishnaveni et al. 2011) and one study reported a mean 25(OH)D concentration of 52 nmol L−1 (Jiang et al. 2005).
Data from the Western Pacific region were available from four studies conducted in Australia (Bowyer et al. 2009; Thomas et al. 2011; Bendall et al. 2012; Novakovic et al. 2012), one in Japan (Seino et al. 1982) and one in Beijing (Song et al. 2013). Mean maternal serum 25(OH)D concentration in three of the four Australian (Adelaide, Sydney and Melbourne) studies were 47, 52 and 55 nmol L−1, respectively (Bowyer et al. 2009; Thomas et al. 2011; Novakovic et al. 2012). The fourth study reported a higher mean value of 115 nmol L−1 (Bendall et al. 2012). The possible explanation for this outlier value is that the study enrolled pregnant women living in Cairns (latitude 17°S) where an average of 7.5 h of sunshine per day is recorded from May to September, with enrolment into this study occurring in July and August (Bendall et al. 2012).
The one study from the African region reported a mean maternal 25(OH)D concentration of 92 nmol L−1 (Amukele et al. 2013), with this mean value being the third highest of all 33 global studies of maternal serum 25(OH)D concentration during pregnancy. The two highest values were 130 nmol L−1 reported in a study from Iran (Salek et al. 2008) and 115 nmol L−1 reported from Cairns, Australia (Bendall et al. 2012).
When the different studies from each region were combined using a meta‐analysis mean maternal serum 25(OH)D in nmol L−1, and then ranked by region, we observed large differences: Eastern Mediterranean 20, European 30, South‐East Asian 30, Western Pacific 57, Americas 60 and African 92 (Fig. 3a).
Figure 3.
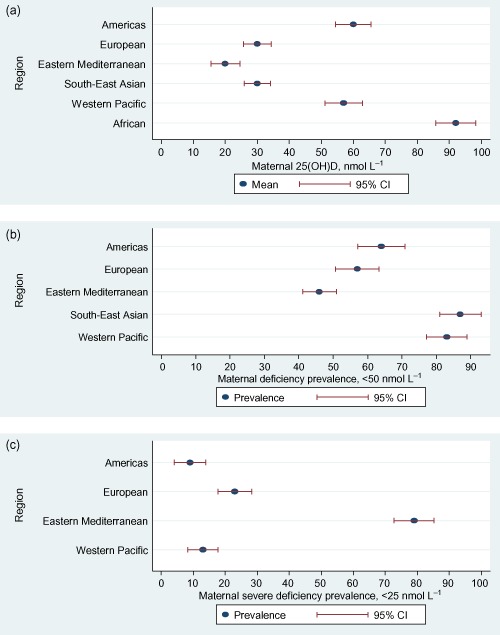
(a) Global maternal mean 25‐hydroxyvitamin D [25(OH)D] concentrations in different World Health Organization regions. (b) Global prevalence of maternal 25(OH)D deficiency (<50 nmol L−1). (c) Global prevalence of maternal 25(OH)D severe deficiency (<25 nmol L−1). CI, confidence interval.
Maternal vitamin D deficiency during pregnancy (Table 6)
Table 6.
Prevalence of maternal and newborn vitamin D deficiency [25(OH)D <50 nmol L−1] and severe vitamin D deficiency [25(OH)D <25 nmol L−1] by WHO region
| Country | Year* | First author | Maternal and newborn vitamin D status deficiency and insufficiency | |||
|---|---|---|---|---|---|---|
| Maternal 25(OH)D | Newborn 25(OH)D | |||||
| Deficiency % <50 nmol L−1 |
Severe def. % <25 nmol L−1 |
Deficiency % <50 nmol L−1 |
Severe def. % <25 nmol L−1 |
|||
| Americas | ||||||
| USA | 1959–1965 | Gernand | 56 | |||
| Canada | 2004–2007 | Shand | 53 | |||
| USA | 2005–2006 | Newhook | 42 | 2 | 35 | 4 |
| USA | 2006–2009 | Belderbos | 27 | |||
| USA | 2008–2009 | Collins‐Fulea | 72 | |||
| USA | 2010–2011 | Burris | 20 | 22 | ||
| European | ||||||
| UK | 1991–1992 | Javaid | 18 | |||
| Scotland | 2000–2006 | Haggarty | 22 | 50 | ||
| France | 2003 | Baiz, 2012 | 28 | |||
| Greece | 2003–2004 | Nicolaidou | 20 | 8 | ||
| Netherlands | 2004–2006 | Dijkstra | 43 | |||
| Turkey | 2005 | Karatekin | 68 | 88 | ||
| UK | 2007 | Yu | 40 | |||
| Turkey | 2008 | Halicioglu | 90 | 50 | ||
| Denmark | 2008–2010 | Streym | 23 | 61 | 66 | |
| Eastern Mediterranean | ||||||
| Iran | 1997 | Bassir | 80 | |||
| Iran | 1999 | Andiran | 46 | |||
| Iran | 1999–2000 | Molla | 40 | 60 | ||
| Iran | 2005 | Kazemi | 86 | |||
| Iran | 2005 | Maghbooli, 2008 | 71 | |||
| Pakistan | 2008 | Karim | 46 | 88 | ||
| Iran | 2008–2009 | Asemi | 96 | |||
| South‐East Asian | ||||||
| India | 1997 | Farrant | 66 | |||
| India | 1997–1998 | Krishnaveni | 67 | |||
| Nepal | 1998–2001 | Jiang | 14 | |||
| India | 2002 | Sachan | 84 | 96 | 43 | |
| India | 2005–2006 | Sahu | 74 | |||
| India | 2006–2007 | Marwaha | 96 | |||
| Western Pacific | ||||||
| NZ | 1997–2001 | Camargo | 57 | 19 | ||
| Australia | 2002–2003 | Morley | 7 | |||
| NZ | 2006 | Judkins | 87 | 61 | ||
| Australia | 2007–2008 | Lau | 41 | |||
| Japan | 2008 | Shibata | 90 | |||
| Australia | 2008–2009 | Perampalam | 35 | |||
| Australia | 2008–2009 | Perampalam | 26 | |||
| Australia | 2008–2009 | Teale | 5 | |||
| NZ | 2010–2011 | Grant | 54 | 54 | ||
| Beijing | 2010–2011 | Song | 97 | 45 | ||
| Australia | 2011 | Bowyer | 15 | 11 | ||
| Australia | 2011 | Thomas | 56 | 12 | 33 | 4 |
25(OH)D, 25‐hydroxyvitamin D; WHO, World Health Organization. *Year of study or if not available year of publication.
Vitamin D deficiency [25(OH)D <50 nmol L−1] during pregnancy was present in 42–72% of women from the Americas, 18–90% from the European, 46% from the Eastern Mediterranean, 66–96% from South‐East Asian and 41–97% from the Western Pacific region. Regional ranking of the proportion of pregnant women with serum 25(OH)D <50 nmol L−1 was: South‐East Asian 87%, Western Pacific 83%, Americas 64%, European 57% and Eastern Mediterranean 46% (Fig. 3b).
Severe vitamin D deficiency [25(OH)D <25 nmol L−1] during pregnancy was present in 2–20% of women from the Americas, 20–40% from the European, 40–96% from the Eastern Mediterranean and 5–61% from the Western Pacific region. Regional ranking of the proportion of pregnant women with serum 25(OH)D <25 nmol L−1 was: Eastern Mediterranean 79%, European 23%, Western Pacific 13% and Americas 9% (Fig. 3c).
Newborn vitamin D status during pregnancy
Newborn serum 25(OH)D concentration
Mean newborn 25(OH)D concentrations varied widely in the two studies from the Americas region [35 nmol L−1 (Basile et al. 2007) and 77 nmol L−1 (Belderbos et al. 2011)]. The mean/median 25(OH)D concentrations in newborn studies from the European region were all ≤50 nmol L−1, with one of these studies reporting mean newborn 25(OH)D concentrations of 20 nmol L−1 (Bouillon et al. 1981) and 11 reported mean values of 28–50 nmol L−1 (Cockburn et al. 1980; Delvin et al. 1982; Axelson & Christensen 1988; Javaid et al. 2006; Nicolaidou et al. 2006; Leffelaar et al. 2010; Viljakainen et al. 2010; Halicioglu et al. 2012; Streym et al. 2013; Weisse et al. 2013; Baiz et al., 2014). Of the six studies of newborn vitamin D status from the Eastern Mediterranean region, four reported mean serum 25(OH)D of <25 nmol L−1 (Bassir et al. 2001; Andiran et al. 2002; Maghbooli et al. 2007; Kazemi et al. 2009) and two ≥50 nmol L−1 (Salek et al. 2008; Karim et al. 2011). Both studies from the South‐East Asian region had mean 25(OH)D concentrations <50 nmol L−1 (Sachan et al. 2005; Marwaha et al. 2011). In the Western Pacific region, two studies reported a median newborn 25(OH)D concentrations of 32 nmol L−1 (Seino et al. 1982) and 45 nmol L−1 (Camargo et al. 2010), and three studies reported newborn vitamin D concentrations in the range of 60–67 nmol L−1 (Bowyer et al. 2009; Thomas et al. 2011; Novakovic et al. 2012). In the one study from the African region, mean 25(OH)D concentration was 35 nmol L−1 (median 27 nmol L−1) (Amukele et al. 2013).
When different studies from each region were combined using a meta‐analysis newborn mean serum 25(OH)D in nmol L−1, and then ranked by region, we observed large differences: Eastern Mediterranean 17, South‐East Asian 22, African 35, European 35, Western Pacific 55 and Americas 82 (Fig. 4a).
Figure 4.
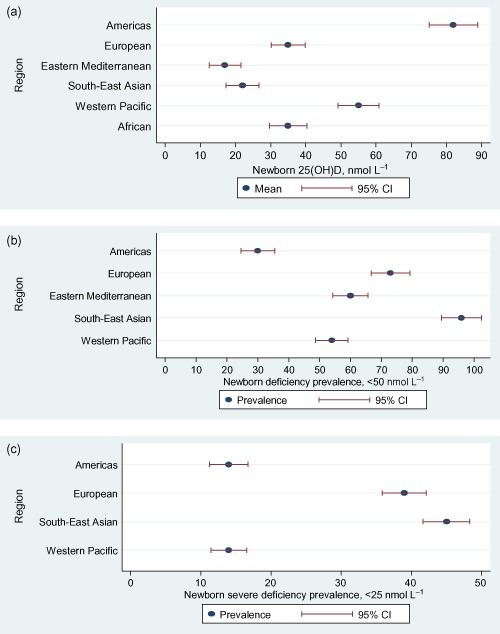
(a) Global newborn mean 25‐hydroxyvitamin D [25(OH)D] concentrations in different World Health Organization regions. (b) Global prevalence of newborn 25(OH)D deficiency (<50 nmol L−1). (c) Global prevalence of newborn 25(OH)D severe deficiency (<25 nmol L−1). CI, confidence interval.
Newborn vitamin D deficiency
In the two studies from the Americas region, newborn vitamin D deficiency [25(OH)D <50 nmol L−1] was present in 27% and 35% of newborns (Newhook et al. 2008; Belderbos et al. 2011). The prevalence of 25(OH)D <50 nmol L−1 was 61% and 88% in the two studies from the European (Karatekin et al. 2009; Streym et al. 2013), 60% and 88% in the two studies from the Eastern Mediterranean (Molla et al. 2005; Karim et al. 2011), 96% in one study from the South‐East Asian (Sachan et al. 2005) and 33% and 57% in the two studies from the Western Pacific region (Camargo et al. 2010; Thomas et al. 2011). Regional ranking of the proportion of newborns with serum 25(OH)D <50 nmol L−1 was: South‐East Asian 96%, European 73%, Eastern Mediterranean 60%, Western Pacific 54% and Americas 30% (Fig. 4b).
In the two studies from the Americas region severe vitamin D deficiency [25(OH)D <25 nmol L−1] was present in 4% and 22% of newborns (Newhook et al. 2008; Belderbos et al. 2011). Prevalence of 25(OH)D <25 nmol L−1 in the European region was between 8% and 66% (Nicolaidou et al. 2006; Dijkstra et al. 2007; Baiz et al. 2012; Halicioglu et al. 2012; Haggarty et al. 2013; Streym et al. 2013), in the South‐East Asian region 14% and 43% (Jiang et al. 2005; Sachan et al. 2005) and in the Western Pacific region 4–45% (Table 6) (Bowyer et al. 2009; Camargo et al. 2010; Thomas et al. 2011; Song et al. 2013). Regional ranking of the proportion of newborns with serum 25(OH)D <25 nmol L−1 was: South‐East Asian 45%, European 39%, Americas 14% and Western Pacific 14% (Fig. 4c).
Relationship between maternal and newborn vitamin D status
Fifty‐two studies described vitamin D status in both mothers and their newborns. Serum 25(OH)D concentration was measured in cord blood samples in all but one Australian study where dried blood spots obtained from newborn screening cards were used (Thomas et al. 2011). Two studies compared 25(OH)D concentrations on cord blood samples and venous blood samples taken from newborns (Heckmatt et al. 1979; Ergur et al. 2009).
In 40 of the 52 studies, the relationship between maternal and newborn vitamin D status was described using correlation coefficients (r) (Table 7). Thirty‐seven of the 40 studies reported maternal 25(OH)D concentrations to be higher than newborn concentrations (Table 7). Only one study reported the actual difference between maternal and newborn 25(OH)D concentration. In this study from New Zealand the mean maternal serum 25(OH)D concentration measured at 36 weeks gestation was 35 nmol L−1 higher than the cord blood 25(OH)D concentration (maternal 72 vs. cord blood 37 nmol L−1) (Grant et al. 2014). Other studies that have quantified the relationship between maternal and cord blood 25(OH)D describe cord blood 25(OH)D concentration being 36% (Amukele et al. 2013), 67% (Waiters et al. 1998) and 80% (Hillman & Haddad 1974) of the matched maternal serum 25(OH)D concentration. The first two studies reported maternal 25(OH)D concentrations higher than cord blood 25(OH)D (Waiters et al. 1998; Amukele et al. 2013), and the third study reported cord blood 25(OH)D to be higher (Hillman & Haddad 1974).
Table 7.
Correlation between maternal and newborn serum 25(OH)D concentrations by WHO region
| Country (first author) | Year | Correlation coefficient | P‐value | Maternal sample taken at | Relationship between maternal and newborn 25(OH)D | |
|---|---|---|---|---|---|---|
| Newborn 25(OH)D lower | Newborn 25(OH)D higher | |||||
| Americas | ||||||
| USA (Hillman) | 1974 | 0.76 | <0.0005 | Pre‐delivery | ✓ | |
| USA (Hollis, 1984) | 1984 | 0.76 | 0.01 | At delivery | ✓ | |
| USA (Bodnar c) | 1997–2001 | 0.89 | <0.001 | At delivery | ✓ | |
| USA (Bodnar b) | 1997–2001 | 0.97 | <0.0001 | Pre‐delivery | ✓ | |
| USA (Lee) | 2002–2003 | 0.68 | <0.001 | 24–48 h after delivery | ✓ | |
| USA (Dror, 2012) | 2006–2008 | 0.78 | <0.0001 | Pre‐delivery | ✓ | |
| USA (Dror, 2011) | 2008–2009 | 0.79 | <0.0001 | Pre‐delivery | ✓ | |
| European | ||||||
| London (Brooke) | 1977–1979 | 0.93 | <0.001 | 28–32 weeks | ✓ | |
| UK (Heckmatt) | 1978–1979 | 0.93 | <0.001 | 24 h after delivery | ✓ | |
| Edinburg (Cockburn) | 1980 | 0.71 | <0.001 | At delivery | ✓ | |
| France (Mallet) | 1980–1989 | 0.95 | <0.001 | At delivery | ✓ | |
| Belgium (Bouillon) | 1981 | 0.83 | <0.001 | At delivery | ✓ | |
| France (Delvin) | 1982 | 0.90 | <0.0005 | At delivery | ✓ | |
| Israel (Shany) | 1984 | 0.91 | <0.001 | At delivery | ✓ | |
| Sweden (Axelson) | 1986 | 0.83 | <0.0001 | At delivery | ✓ | |
| Scotland (Haggarty) | 2000–2006 | 0.50 | <0.001 | 19 weeks | ✓ | |
| Norway (Godang) | 2001–2008 | 0.42 | <0.001 | 30–32 weeks | ✓ | |
| Cardiff (Nicolaidou) | 2003–2004 | 0.63 | <0.001 | At delivery | ✓ | |
| Turkey (Karatekin) | 2005 | 0.79 | <0.05 | At delivery | ✓ | |
| Germany (Weisse) | 2006–2008 | 0.81 | <0.001 | 34 weeks | ✓ | |
| UK (Yu) | 2007 | 0.45 | <0.0001 | At delivery | ✓ | |
| Turkey (Halicioglu) | 2008 | 0.65 | <0.001 | Pre‐delivery | ✓ | |
| Denmark (Streym) | 2008–2010 | 0.83 | <0.001 | 1–2 weeks post delivery | ✓ | |
| Eastern Mediterranean | ||||||
| Saudi Arab (Serenius) | 1984 | 0.80 | <0.001 | At delivery | ✓ | |
| Iran (Bassir) | 1997 | 0.88 | <0.0001 | At delivery | ✓ | |
| Iran (Andiran) | 1999 | 0.63 | 0.01 | During consent | ✓ | |
| Kuwait (Molla) | 1999–2000 | 0.79 | <0.001 | At delivery | ✓ | |
| Iran (Maghbooli, 2007) | 2002 | 0.71 | 0.0001 | At delivery | ✓ | |
| Iran (Salek) | 2005 | 0.79 | <0.001 | At delivery | ✓ | |
| Iran (Kazemi) | 2005 | 0.55 | <0.001 | Pre‐delivery | ✓ | |
| Pakistan (Karim) | 2008 | 0.03 | <0.003 | No indication | ✓ | |
| Pakistan (Hossain) | 2010 | 0.68 | <0.001 | At delivery | ✓ | |
| South‐East Asian | ||||||
| Korea (Namguang) | 1993–1994 | 0.81 | 0.0001 | At delivery | ✓ | |
| India (Sachan) | 2002 | 0.79 | <0.001 | Pre‐delivery | ✓ | |
| India (Marwaha) | 2006–2007 | 0.78 | 0.0001 | Third trimester | ✓ | |
| Western Pacific | ||||||
| Japan (Seino) | 1980 | 0.85 | <0.0005 | At delivery | ✓ | |
| Australia (Bowyer) | 2008 | 0.74 | <0.001 | 30–32 weeks | ✓ | |
| NZ (Grant) | 2010 | 0.79 | <0.001 | 36 weeks | ✓ | |
| Australia (Thomas) | 2011 | 0.23 | 0.02 | Third trimester | ✓ | |
| Australia (Novakovic) | 2012 | 0.19 | <0.001 | 28 weeks | ✓ | |
25(OH)D, 25‐hydroxyvitamin D; WHO, World Health Organization.
Three studies reported cord blood 25(OH)D concentrations to be higher than maternal serum 25(OH)D concentration (Hillman & Haddad 1974; Heckmatt et al. 1979; Novakovic et al. 2012). Two of the three studies, one in the Americas region and the other from the Western Pacific region, observed this relationship to be present when maternal 25(OH)D concentrations were low (Hillman & Haddad 1974; Novakovic et al. 2012). In the US study, newborn 25(OH)D concentrations were higher than maternal concentrations only when maternal 25(OH)D concentrations were in the range of 7–12 nmol L−1 (Hillman & Haddad 1974). In the Australian study, newborn 25(OH)D concentrations were observed to be higher than maternal concentration only when maternal 25(OH)D was <45 nmol L−1 (Novakovic et al. 2012). In contrast, the third of these studies, from the United Kingdom, observed that newborn serum 25(OH)D concentration was higher than maternal 25(OH)D concentration across the whole range of 25(OH)D values (Heckmatt et al. 1979). Different assay techniques may have accounted for these differences. In the Australian study (Novakovic et al. 2012), serum 25(OH)D concentrations were measured using LIAISON vitamin D total kit (DiaSorin, Stillwater, MN, USA) whereas both American studies (Hillman & Haddad 1974; Heckmatt et al. 1979) have used modified versions of competitive protein binding assays (Haddad & Chyu 1971; Morris & Peacock 1976).
In all 40 studies where correlations were described, there was a significant positive correlation between maternal and newborn 25(OH)D concentrations. The range of correlation coefficients between maternal and newborn 25(OH)D concentrations, by region, was: Americas 0.68–0.97, European 0.42–0.95, Eastern Mediterranean 0.03–0.88, South‐East Asian 0.78–0.81 and Western Pacific 0.19–0.85.
The correlation between maternal and newborn 25(OH)D concentration varied with timing of sample collection. In one study from the Americas region (Bodnar et al. 2007), serum 25(OH)D concentrations were measured in early pregnancy (4–21 weeks) and at delivery in 2211 study participants and newborn 25(OH)D concentrations were measured on cord blood samples collected at delivery. Cord blood 25(OH)D concentrations had moderate positive correlations with maternal serum 25(OH)D measured during early pregnancy (r = 0.58, P < 0.001) and a stronger relationship with maternal serum 25(OH)D concentrations measured at delivery (r = 0.89, P < 0.001).
The effect of gestation on the correlation between maternal and newborn 25(OH)D concentration was investigated in one study from the Americas region that sampled mothers at delivery (Hillman & Haddad 1974). The correlations of maternal and newborn 25(OH)D concentration were r = 0.86 (P < 0.001) for newborns born preterm and r = 0.76 (P < 0.0005) for newborns born at term.
Discussion
This systematic review of vitamin D status of pregnant women and newborns worldwide, from 1959 to 2014, showed mean maternal 25(OH)D concentrations ranging from 13 to 130 nmol L−1 and mean newborn 25(OH)D concentrations ranging from 5 to 77 nmol L−1. Vitamin D deficiency, as defined by a serum 25(OH)D concentration <50 nmol L−1, was present in 54% of pregnant women and 75% of newborns, and severe vitamin D deficiency as defined by a serum 25(OH)D concentration <25 nmol L−1 in 18% of pregnant women and 29% of newborns.
Wide variability in vitamin D status between WHO regions was evident. From the meta‐analysis, average maternal 25(OH)D concentrations were <25 nmol L−1 in the Eastern Mediterranean region, between 25 and <50 nmol L−1 in the South‐East Asian and European regions, 50 to <75 nmol L−1 in the Americas and Western Pacific regions, and 75 to <100 nmol L−1 in the African region. Average newborn 25(OH)D concentrations were <25 nmol L−1 in the Eastern Mediterranean and South‐East Asia regions, between 25 and <50 nmol L−1 in the European and African regions, 50 to <75 nmol L−1 in the Western Pacific region, and >75 nmol L−1 in the Americas region.
Consistent with the low mean 25(OH)D concentration, studies where the proportion of pregnant women with serum 25(OH)D <50 and <25 nmol L−1 was defined showed that the majority of pregnant women in the South‐East Asian region had vitamin D deficiency (87%) and the majority in the Eastern Mediterranean region had severe vitamin D deficiency (79%). Similarly, a higher proportion of pregnant women in the Western Pacific, Americas and European regions were vitamin D deficient (Western Pacific 83%, Americas 64%, Europe 57%) but a smaller proportion of pregnant women in these three regions had severe vitamin D deficiency (Western Pacific 13%, Americas 9%, Europe 23%). Vitamin D deficiency was more frequent in pregnant women in the South‐East Asian (87%) than any other WHO region, but no data are available to estimate whether severe vitamin D deficiency is prevalent in pregnant women in the South‐East Asian region.
As was seen with the studies of pregnant women, vitamin D deficiency (96%) was prevalent in newborns from the South‐East Asian region. A large proportion of newborns in the Eastern Mediterranean region were vitamin D deficient (60%), but no data were available to estimate the prevalence of severe vitamin D deficiency in newborns in the Eastern Mediterranean region. In the European region both vitamin D deficiency (73%) and severe vitamin D deficiency (39%) were observed more frequently in newborns than pregnant women. As with pregnant women, in the Americas and Western Pacific regions severe vitamin D deficiency was less prevalent (Americas 14%, Western Pacific 14%) than vitamin D deficiency (Americas 30%, Western Pacific 54%).
The amount of within‐region variability in vitamin D status differed by global region. Variability in average maternal serum 25(OH)D concentration between studies within the same region was 23% in the Americas, twofold in the Western Pacific, threefold in the South‐East Asian, fourfold in the European and 10‐fold in the Eastern Mediterranean region. Among newborns, within‐region study variance in mean serum 25(OH)D concentration was 9% in the South‐East Asian; twofold in the Western Pacific, Americas and European regions; and 13‐fold in the Eastern Mediterranean region.
As described in the Introduction section, four reviews have been conducted previously that describe vitamin D status across the age range worldwide (Hagenau et al. 2009; Mithal et al. 2009; Arabi et al. 2010; Hilger et al. 2014). In the systematic review by Hilger et al. (2014; 195 studies in 44 countries), the prevalence of serum 25(OH)D <50 nmol L−1 was 37%. In comparison, in our review, the prevalence of serum 25(OH)D <50 ng/mL was 54% in pregnant women and 75% in newborns. As was evident from our study of pregnant women and newborns, Hilger observed that mean 25(OH)D values in the general populations were higher in the Americas (North America) (75 nmol L−1) than in Europe (52 nmol L−1) or the Middle East (50 nmol L−1). Consistent with the reviews by Mithal et al. (2009) and Arabi et al. (2010), our review showed that vitamin D deficiency [25(OH)D <50 nmol L−1] and severe vitamin D deficiency [25(OH)D <25 nmol L−1] were more common in the South‐East Asian and Eastern Mediterranean regions for both maternal and newborn populations.
The increase in number of studies that have described maternal and newborn vitamin D status over time is apparent as is the uneven distribution of studies between global regions. Most studies (74%) were from three of the six WHO regions: Americas 25%, Europe 31% and Eastern Mediterranean 18%. Currently, the published data are insufficient to allow maternal and newborn vitamin status to be defined in the African region and in non‐European pregnant women living in the Western Pacific region. Data from the South‐East Asian and Eastern Mediterranean regions are also limited particularly in view of the large populations of those two regions. The limited data that are available from South‐East Asia and the Eastern Mediterranean suggest vitamin D status that is poor relative to other global regions.
Our meta‐analysis confirms the close relationship of maternal pregnancy with newborn serum 25(OH) concentrations. All 39 studies with paired maternal and cord concentrations of 25(OH)D showed a high correlation. In all but three studies, maternal pregnancy 25(OH)D concentration was higher than newborn 25(OH)D concentration. These relationships are expected as the fetus cannot synthesize 25(OH)D, and thus this compound must be transferred from the mother via the placenta (Ron et al. 1984). Maternal vitamin D is the sole source of vitamin D to the fetus. The lower mean serum 25(OH)D concentrations seen in newborns compared with pregnant women in all regions, but the Americas, and higher prevalence of vitamin D deficiency and severe vitamin D deficiency in newborns compared with pregnant women observed in all regions is consistent with this relationship.
In the five global regions for which data are available, all but one (Eastern Mediterranean for pregnant women, Americas for newborns) show that vitamin D deficiency was present in more than half of pregnant women and newborns. In all but one region (Americas), vitamin D deficiency was present in at least one‐third of newborns. With the recent evidence indicating that 25(OH)D <20 nmol L−1 is associated with an increased risk of poor pregnancy and early infant outcomes (Aghajafari et al. 2013; Wei et al. 2013), there is an urgent need to develop national and regional approaches aimed at improving vitamin D status in these populations.
The close relationship between maternal pregnancy and newborn vitamin D status implies that addressing vitamin D status during pregnancy is necessary if newborn vitamin D status is to be improved. Some regions, such as Europe and the Americas, have national policies that recommend supplementation of pregnant women to ensure the mother's requirements for vitamin D are met and to prevent vitamin D deficiency in young infants. However, recommended supplementary doses vary from country to country with current recommendations bearing little relationship with the national and regional data that describe vitamin D status. For example, in the European region, the recommended daily vitamin D supplementary doses are 10 μg day−1 (400 IU day−1) in the Netherlands and Scandinavia, and 20 μg day−1 (800 IU day−1) in Germany and Belgium (Nordic Council of Ministers 2004; Health Council of the Netherlands 2008; Gezondheidsraad 2009; Deutsche et al. 2013). Average serum 25(OH)D concentrations in nmol L−1 in pregnant women from these countries are: the Netherlands 55 (Leffelaar et al. 2010), Sweden 50 (Axelson & Christensen 1988), Denmark 72 (Streym et al. 2013), Germany 55 (Weisse et al. 2013) and Belgium 35 (Bouillon et al. 1981) and 55 (Vercruyssen et al. 2012).
Lower serum 25(OH)D concentrations during pregnancy are associated with poorer outcomes during pregnancy, at birth and during infancy and childhood (Hossain‐nezhad & Holick 2013). Children born to mothers with lower 25(OH)D concentrations during pregnancy were at higher risk of being born preterm (Aghajafari et al. 2013; Wei et al. 2013) or small for gestation age (Wei et al. 2013), and are at higher risk of having reduced bone mineral content at birth (Viljakainen et al. 2010). In studies performed in the United States and Scotland higher maternal intakes of vitamin D during pregnancy were associated with a reduction in risk of recurrent wheezing in children during preschool years (Camargo et al. 2007; Devereux et al. 2007). In New Zealand cord blood 25(OH)D concentrations have been shown to be inversely related to the risk of parent‐reported respiratory infections in the first 3 months of life (Camargo et al. 2011). Children born with low serum 25(OH)D concentrations had reduced bone mass at 9 years of age (Javaid et al. 2006).
Our review indicates that, even in countries where fortification of food with vitamin D is mandatory, and where the use of vitamin D supplements is recommended, substantial proportions of women will have poor vitamin D status during their pregnancy and, as a result, their offspring will very likely be born with vitamin D deficiency. Currently, recommended doses of vitamin D during pregnancy will not achieve serum 25(OH)D concentrations in the normal range in populations who because of skin pigmentation or lifestyle are less able to generate vitamin D from sunlight exposure (Hollis et al. 2011).
We believe that current policy for maintenance of adequate vitamin D status during pregnancy and at birth has not kept pace with the dramatic changes in lifestyle that have occurred in human populations over recent generations. Populations with traditional lifestyles and who have year‐round exposure to sunlight have serum 25(OH)D concentrations that average 112 nmol L−1 (Luxwolda et al. 2012). In studies of lactating women performed in Europe and the United States daily vitamin D intakes of at least 2000 IU, two to four times the currently recommended daily intakes, are required in order for breast milk vitamin D activity to be increased (Ala‐Houhala et al. 1988; Hollis & Wagner 2004). Randomized controlled trials consistently show such doses to be safe (Hollis et al. 2011; Grant et al. 2014). These data imply that our current approach to vitamin D requirements, which is based upon a disease avoidance model (Heaney & Armas 2015), will inevitably result in substantial proportions of the pregnant women and newborns globally being vitamin D deficient.
Our study has several limitations. Design and methodological differences between the individual studies limited the precision of our global estimates of vitamin D status in pregnant women and newborns. Thirteen different assays were used in the 95 studies included in our review. Of the different assays that are available, the LC‐MS/MS is increasingly considered the gold standard technique for measuring 25(OH)D concentration due to its high accuracy and precision (Farrell & Herrmann 2013). Within and between‐run coefficients of variance are 2.4% and 2%, respectively (Farrell et al. 2012). Only 9/95 (9%) of the studies included in this review used this gold standard assay. Excellent correlations have been shown for the measurement of 25(OH)D concentration by LC‐MS/MS and RIA and by the LIAISON assay (Eyles et al. 2009; Hee‐Won et al. 2012). Of the studies included in our review 31/95 (33%) used RIA and only 2/95 (2%) used the LIAISON assay. The ability of our review to create precise estimates of the prevalence of vitamin D deficiency and severe vitamin D deficiency was also limited by the variability in 25(OH)D values used to report vitamin D status (Table 3). Data from 29% (21/72) of the studies could not be included because 25(OH)D cut‐off values other than 25 and 50 nmol L−1 were used to define vitamin D status. An investigation of variance by global region in maternal and newborn vitamin D status with season or other demographic factors was considered beyond the scope of this meta‐analysis.
In summary, this review shows that vitamin D deficiency [25(OH)D <50 nmol L−1] is more prevalent in pregnant women and newborns than has been described in the general population globally. Wide variability is evident between WHO regions in serum 25(OH)D concentrations, within regions in the extent to which 25(OH)D varies between studies, and in the extent to which vitamin D status has been characterized. Vitamin D status during pregnancy is currently poorly defined in the South‐East Asian, Eastern Mediterranean and African regions, and in non‐European populations in the Western Pacific region. The high prevalence during pregnancy of vitamin D deficiency in the South‐East Asian region implies a high likelihood of vitamin D deficiency and indicates that determining this should be a priority, as should be characterizing vitamin D status among non‐European populations in the Western Pacific. To improve comparability of data between studies and hence between countries and WHO regions, standardization of the 25(OH)D cut‐off values (e.g. <50 and <25 nmol L−1), and development of a standard measurement of 25(OH)D or utilizing assays that have shown good correlation with each other is necessary.
Source of funding
Rajneeta Saraf was supported by a research grant from Curekids.
Conflicts of interest
The authors declare that they have no conflicts of interest.
Contributions
RS conceived and designed the study, analysed and interpreted the data, and completed the first and final drafts of the manuscript. SMBM conceived and designed the study, reviewed the manuscript and approved the final version as submitted. CAC helped with the interpretation of data, critically reviewed the manuscript and approved the manuscript as submitted. CCG conceived and designed the study, reviewed and revised the manuscript and approved the final manuscript as submitted.
Supporting information
Table S1. Manuscripts included in the review by WHO region and by their reporting of maternal and/or newborn vitamin D status.
Table S2. Manuscripts included in review by the serum 25‐hydroxyvitamin D [25(OH)D] concentration values used to describe vitamin D status.
Supporting info item
Acknowledgements
We acknowledge all those many authors of the publications that we have used in our systematic review. Many thanks to those authors whom we had contacted and who were kind enough to provide us with the information we could not find in their papers, such as the year of study performance.
Saraf, R. , Morton, S. M. B. , Camargo, C. A. Jr. , and Grant, C. C. (2016) Global summary of maternal and newborn vitamin D status – a systematic review. Maternal & Child Nutrition, 12: 647–668. doi: 10.1111/mcn.12210.
References
- Aghajafari F., Nagulesapillai T., Ronksley P., Tough S., O'Beirne M. & Rabi D. (2013) Association between maternal serum 25‐hydroxyvitamin D level and pregnancy and neonatal outcomes: systematic review and meta‐analysis of observational studies. British Medical Journal 346, 1–14. [DOI] [PubMed] [Google Scholar]
- Ainy E., Ghazi A. & Azizi F. (2006) Changes in calcium, 25(OH)D3 and other biochemical factors during pregnancy. Journal of Endocrinological Investigation 29, 303–307. [DOI] [PubMed] [Google Scholar]
- Ala‐Houhala M., Koskinen T., Parviainen M. & Visakorpi J. (1988) 25‐Hydroxyvitamin D and vitamin D in human milk: effects of supplementation and season. American Journal of Clinical Nutrition 48, 1057–1060. [DOI] [PubMed] [Google Scholar]
- Amukele T.K., Soko D., Katundu P., Kamanga M., Sun J., Kumwenda N.I. et al (2013) Vitamin D levels in Malawian infants from birth to 24 months. Archives of Disease in Childhood 98, 180–183. [DOI] [PubMed] [Google Scholar]
- Andiran N., Yordam N. & Ozon A. (2002) Risk factors for vitamin D deficiency in breast‐fed newborns and their mothers. Nutrition (Burbank, Los Angeles County, Calif.) 18, 47–50. [DOI] [PubMed] [Google Scholar]
- Arabi A., Rassi R.E. & Fuleihan G.E. (2010) Hypovitaminosis D in developing countries – prevalence, risk factors and outcomes. Nature Reviews. Endocrinology 6, 550–561. [DOI] [PubMed] [Google Scholar]
- Asemi Z., Taghizadeh M., Sarahroodi S., Jazayeri S., Tabasi Z. & Seyyedi F. (2010) Assessment of the relationship vitamin D with serum antioxidant vitamins E and A and their deficiencies in Iranian pregnant women. Saudi Medical Journal 31, 179–183. [PubMed] [Google Scholar]
- Axelson M. & Christensen N.J. (1988) Vitamin D metabolism in human pregnancy. Concentrations of free and sulphated 25‐hydroxyvitamin D, in maternal and fetal plasma at term. Journal of Steroid Biochemistry 31, 35–39. [DOI] [PubMed] [Google Scholar]
- Baiz N., Dargent‐Molina P., Wark J.D., Souberbielle J., Annesi‐Maesano I. & EDEN Mother‐Child Cohort Study Group (2012) Gestational exposure to urban air pollution related to a decrease in cord blood vitamin D levels. Journal of Clinical Endocrinology and Metabolism 97, 4087–4095. [DOI] [PubMed] [Google Scholar]
- Baiz N., Dargent‐Molina P., Wark J.D., Souberbielle J., Annesi‐Maesano I. & EDEN Mother‐Child Cohort Study Group (2014) Cord serum 25‐hydroxyvitamin D and risk of early childhood transient wheezing and atopic dermatitis. Journal of Allergy and Clinical Immunology 133, 147–153. [DOI] [PubMed] [Google Scholar]
- Basile L.A., Taylor S.N., Wagner C.L., Quinones L. & Hollis B.W. (2007) Neonatal vitamin D status at birth at latitude 32 degrees 72′: evidence of deficiency. Journal of Perinatology 27, 568–571. [DOI] [PubMed] [Google Scholar]
- Bassir M., Laborie S., Lapillonne A., Claris O., Chappuis M. & Salle B.L. (2001) Vitamin D deficiency in Iranian mothers and their neonates: a pilot study. Acta Paediatrica 90, 577–579. [PubMed] [Google Scholar]
- Belderbos M.E., Houben M.L., Wilbrink B., Lentjes E., Bloemen E.M., Kimpen J.L.L. et al (2011) Cord blood vitamin D deficiency is associated with respiratory syncytial virus bronchiolitis. Pediatrics 127, 1513–1520. [DOI] [PubMed] [Google Scholar]
- Bendall A., De Costa C., Woods C. & Howat P. (2012) Vitamin D levels in pregnant women booking antenatal care in Far North Queensland. Australian and New Zealand Journal of Obstetrics and Gynaecology 52, 391–394. [DOI] [PubMed] [Google Scholar]
- Bodnar L.M., Simhan H.N., Powers R.W., Frank M.P., Cooperstein E. & Roberts J.M. (2007) High prevalence of vitamin D insufficiency in black and white pregnant women residing in the Northern United States and their neonates. The Journal of Nutrition 137, 447–452. [DOI] [PMC free article] [PubMed] [Google Scholar]
- Bouillon R., Van Assche F.A., Van Baelen H., Heyns W. & De Moor P. (1981) Influence of vitamin D binding protein on the serum concentration of 1,25‐dihydroxyvitamin D3. Journal of Clinical Investigation 67, 589–596. [DOI] [PMC free article] [PubMed] [Google Scholar]
- Bowyer L., Catling‐Paull C., Diamond T., Homer C., Davis G. & Craig M.E. (2009) Vitamin D, PTH, and calcium levels in pregnant women and their neonates. Clinical Endocrinology 70, 372–377. [DOI] [PubMed] [Google Scholar]
- Camargo C.A. Jr, Ingham T., Wickens K., Thadhani R., Silvers K.M., Epton M.J. et al (2011) Cord‐blood 25‐hydroxyvitamin D levels and risk of respiratory infection, childhood wheezing, and asthma. Pediatrics 127, e180–e187. [DOI] [PubMed] [Google Scholar]
- Camargo C.J., Rifas‐Shiman S., Litonjua A., Rich‐Edwards J., Weiss S. & Gold D. (2007) Maternal intake of vitamin D during pregnancy and risk of recurrent wheeze in children at 3 y of age. American Journal of Clinical Nutrition 85, 788–795. [DOI] [PMC free article] [PubMed] [Google Scholar]
- Camargo C.J., Ingham T., Wickens K., Thadhani R.I., Silvers K., Epton M. et al (2010) Vitamin D status of newborns in New Zealand. British Journal of Nutrition 104, 1051–1057. [DOI] [PubMed] [Google Scholar]
- Cleophans T.J. & Zwinderman A.H. (2007) Meta‐analysis. Circulation 115, 2870–2875. [DOI] [PubMed] [Google Scholar]
- Cockburn F., Belton N.R., Purvis R., Giles M.M., Brown J.K., Turner T.L. et al (1980) Maternal vitamin D intake and mineral metabolism in mothers and their newborn infants. British Medical Journal 281, 11–14. [DOI] [PMC free article] [PubMed] [Google Scholar]
- Dawodu A. & Wagner C.L. (2007) Mother‐child vitamin D deficiency: an international perspective. Archives of Disease of Childhood 92, 737–740. [DOI] [PMC free article] [PubMed] [Google Scholar]
- Delvin E.E., Glorieux F.H., Salle B.L., David L. & Varenne J.P. (1982) Control of vitamin D metabolism in preterm infants: feto‐maternal relationships. Archives of Disease in Childhood 57, 754–757. [DOI] [PMC free article] [PubMed] [Google Scholar]
- Deutsche G.F.E., Österreichische G.F.E., Schweizerische G.F.E. & Schweizerische V.F.E. 2013. Vitamin D. 1.Auflage, 5., korrigierte Nachdruck. Neustadt a.d.Weinstrasse: Neuer Umschau Buchverlag;Referenzwerte für die Nährstoffzufuhr [Reference values for nutrient provision.
- Devereux G., Litonjua A.A., Turner S.W., Craig L.C., McNeill G., Martindale S. et al (2007) Maternal vitamin D intake during pregnancy and early childhood wheezing. American Journal of Clinical Nutrition 85(3), 853–859. [DOI] [PubMed] [Google Scholar]
- Dijkstra S.H., Van Beek A., Janssen J.W., De Vleeschouwer L.H.M., Huysman W.A. & Van Den Akker E.L.T. (2007) High prevalence of vitamin D deficiency in newborn infants of high‐risk mothers. Archives of Disease in Childhood 92, 750–753. [DOI] [PMC free article] [PubMed] [Google Scholar]
- Ergur A.T., Berberoglu M., Atasay B., Siklar Z., Bilir P., Arsan S. et al (2009) Vitamin D deficiency in Turkish mothers and their neonates and in women of reproductive age. Journal of Clinical Research in Pediatric Endocrinology 1, 266–269. [DOI] [PMC free article] [PubMed] [Google Scholar]
- Eyles D., Anderson C., Ko P., Jones A., Thomas A., Burne T. et al (2009) A sensitive LC/MS/MS assay of 25OH vitamin D3 and 25OH vitamin D2 in dried blood spots. Clinica Chimica Acta 403, 145–151. [DOI] [PubMed] [Google Scholar]
- Farrant H.J.W., Krishnaveni G.V., Hill J.C., Boucher B.J., Fisher D.J., Noonan K. et al (2009) Vitamin D insufficiency is common in Indian mothers but is not associated with gestational diabetes or variation in newborn size. European Journal of Clinical Nutrition 63, 646–652. [DOI] [PMC free article] [PubMed] [Google Scholar]
- Farrell C. & Herrmann M. (2013) Determination of vitamin D and its metabolites. Best Practice and Research. Clinical Endocrinology and Metabolism 27, 675–688. [DOI] [PubMed] [Google Scholar]
- Farrell C., Martin S. & McWhinney B. (2012) State‐of‐the‐art vitamin D assays: a comparison of automated immunoassays with liquid chromatography‐tandem mass spectrometry methods. Clinical Chemistry 58, 531–542. [DOI] [PubMed] [Google Scholar]
- Gale C., Robinson S., Harvey N., Javaid M., Jiang B., Martyn C. et al (2008) Maternal vitamin D status during pregnancy and child outcomes. European Journal of Clinical Nutrition 62, 68–77. [DOI] [PMC free article] [PubMed] [Google Scholar]
- Gernand A.D., Simhan H.N., Klebanoff M.A. & Bodnar L.M. (2013) Maternal serum 25‐hydroxyvitamin D and measures of newborn and placental weight in a US multicenter cohort study. Journal of Clinical Endocrinology and Metabolism 98, 398–404. [DOI] [PMC free article] [PubMed] [Google Scholar]
- Gezondheidsraad H. 2009. Voedingsaanbevelingen voor België. herziening 2009. Brussel: Hoge Gezondheidsraad.
- Ginde A.A., Sullivan A.F., Mansbach J.M. & Camargo C.A.J. (2010) Vitamin D insufficiency in pregnant and nonpregnant women of childbearing age in the United States. American Journal of Obstetrics & Gynecology 202, 1–8. [DOI] [PMC free article] [PubMed] [Google Scholar]
- Grant C.C., Stewart A.W., Scragg R., Milne T., Rowden J., Ekeroma A. et al (2014) Vitamin D during pregnancy and infancy and infant serum 25‐hydroxyvitamin D concentration. Pediatrics 133, e143–e153. [DOI] [PubMed] [Google Scholar]
- Haddad J.G. & Chyu K.J. (1971) Competitive protein‐binding radioassay for 25‐hydroxycholecalciferol. Journal of Clinical Endocrinology and Metabolism 33, 992–995. [DOI] [PubMed] [Google Scholar]
- Hagenau T., Vest R., Gissel T., Poulsen C., Erlandsen M., Mosekilde L. et al (2009) Global vitamin D levels in relation to age, gender, skin pigmentation and latitude: an ecologic meta regression analysis. Osteoporosis International 20, 133–140. [DOI] [PubMed] [Google Scholar]
- Haggarty P., Campbell D.M., Knox S., Horgan G.W., Hoad G., Boulton E. et al (2013) Vitamin D in pregnancy in high latitude in Scotland. British Journal of Nutrition 109, 898–905. [DOI] [PubMed] [Google Scholar]
- Halicioglu O., Aksit S., Koc F., Akman S.A., Albudak E., Yaprak I. et al (2012) Vitamin D deficiency in pregnant women and their neonates in spring time in western Turkey. Paediatric and Perinatal Epidemiology 26, 53–60. [DOI] [PubMed] [Google Scholar]
- Harvey N.C., Moon R.J., Sayer A.A., Ntani G., Davies J.H., Javaid M.K. et al (2014) Maternal antenatal vitamin D status and offspring muscle development: findings from the Southampton Women's Survey. Journal of Clinical Endocrinology & Metabolism 99, 330–337. [DOI] [PMC free article] [PubMed] [Google Scholar]
- Health Council of the Netherlands (2008) Towards an Adequate Intake of Vitamin D. Health Council of the Netherlands: The Hague. [Google Scholar]
- Heaney R. & Armas L. (2015) Screening for vitamin d deficiency: is the goal disease prevention or full nutrient repletion? Annals of Internal Medicine 162, 144–145. [DOI] [PubMed] [Google Scholar]
- Heckmatt J.Z., Peacock M., Davies A.E.J., McMurray J. & Isherwood D.M. (1979) Plasma 25‐hydroxyvitamin D in pregnant Asian women and their babies. Lancet 15, 546–548. [DOI] [PubMed] [Google Scholar]
- Hee‐Won M., Jin‐Hee C., Hura M., Song J., Oh G., Parka C. et al (2012) Comparison of four current 25‐hydroxyvitamin D assays. Clinical Biochemistry 45, 326–330. [DOI] [PubMed] [Google Scholar]
- Hilger J., Friedel A., Herr R., Rausch T., Roos F., Wahl D. et al (2014) A systematic review of vitamin D status in populations worldwide. British Journal of Nutrition 111, 23–45. [DOI] [PubMed] [Google Scholar]
- Hillman L.S. & Haddad J.G. (1974) Human perinatal vitamin D metabolism I: 25‐hydroxyvitamin D in maternal and cord blood. The Journal of Pediatrics 84, 742–749. [DOI] [PubMed] [Google Scholar]
- Hollis B.W. & Wagner C.L. (2004) Vitamin D requirements during lactation: high‐dose maternal supplementation as therapy to prevent hypovitaminosis D for both the mother and the nursing infant. American Journal of Clinical Nutrition 80, 1752S–1758S. [DOI] [PubMed] [Google Scholar]
- Hollis B.W., Johnson D., Hulsey T.C., Ebeling M. & Wagner C.L. (2011) Vitamin D supplementation during pregnancy: double‐blind, randomized clinical trial of safety and effectiveness. Journal of Bone and Mineral Research 26, 2341–2357. [DOI] [PMC free article] [PubMed] [Google Scholar]
- Hossain‐nezhad A. & Holick M.F. (2013) Vitamin D for health: a global perspective. Mayo Clinic Proceedings 88, 720–755. [DOI] [PMC free article] [PubMed] [Google Scholar]
- Javaid M.K., Crozier S.R., Harvey N.C., Gale C.R., Dennison E.M., Boucher B.J. et al (2006) Maternal vitamin D status during pregnancy and childhood bone mass at age 9 years: a longitudinal study. Lancet 367, 36–43. [DOI] [PubMed] [Google Scholar]
- Jiang T., Christian P., Khatry S.K., Wu L. & West J. (2005) Micronutrient deficiencies in early pregnancy are common, concurrent, and vary by season among rural Nepali pregnant women. Journal of Nutrition 135, 1106–1112. [DOI] [PubMed] [Google Scholar]
- Karatekin G., Kaya A., Salihoglu O., Balci H. & Nuhoglu A. (2009) Association of subclinical vitamin D deficiency in newborns with acute lower respiratory infection and their mothers. European Journal of Clinical Nutrition 63, 473–477. [DOI] [PubMed] [Google Scholar]
- Karim S.A., Nusrat U. & Aziz S. (2011) Vitamin D deficiency in pregnant women and their newborns as seen at a tertiary‐care in Karachi, Pakistan. International Journal of Gynecology and Obstetrics 112, 59–62. [DOI] [PubMed] [Google Scholar]
- Kazemi A., Sharifi F., Jafari N. & Mousavinasab N. (2009) High prevalence of vitamin D deficiency among pregnant women and their newborns in an Iranian population. Journal of Women's Health 18, 835–839. [DOI] [PubMed] [Google Scholar]
- Krishnaveni G.V., Veena S.R., Winder N.R., Hill J.C., Noonan K., Boucher B.J. et al (2011) Maternal vitamin D status during pregnancy and body composition and cardiovascular risk markers in Indian children: the Mysore Parthenon study. American Journal of Clinical Nutrition 93, 628–635. [DOI] [PMC free article] [PubMed] [Google Scholar]
- Lee J.M., Smith J.R., Philipp B.L., Chen T.C., Mathieu J. & Holick M.F. (2007) Vitamin D deficiency in a healthy group of mothers and newborn infants. Clinical Pediatrics 46, 42–44. [DOI] [PubMed] [Google Scholar]
- Leffelaar E.R., Vrijkotte T.G.M. & Van Eijsden M. (2010) Maternal early pregnancy vitamin D status in relation to fetal and neonatal growth: results of the multi‐ethnic Amsterdam born children and their development cohort. British Journal of Nutrition 104, 108–117. [DOI] [PubMed] [Google Scholar]
- Luxwolda M., Kuipers R., Kema I., Dijck‐Brouwer D. & Muskiet F. (2012) Traditionally living populations in East Africa have a mean serum 25‐hydroxyvitamin D concentration of 115 nmol/l. British Journal of Nutrition 108, 1557–1561. [DOI] [PubMed] [Google Scholar]
- Maghbooli Z., Hossein‐Nezhad A., Shafaei A.R., Karimi F., Madani F.S. & Larijani B. (2007) Vitamin D status in mothers and their newborns in Iran. BMC Pregnancy and Childbirth 7, 1–6. [DOI] [PMC free article] [PubMed] [Google Scholar]
- Mallet E., Gugi B., Brunelle A., Henocq A., Basuyau J. & Lemeur H. (1986) Vitamin D supplementation in pregnancy: a controlled trial of two methods. Obstetrics and Gynecology 68, 300–304. [DOI] [PubMed] [Google Scholar]
- Marwaha R.K., Tandon N., Chopra S., Agarwal N., Garg M.K., Sharma B. et al (2011) Vitamin D status in pregnant Indian women across trimesters and different seasons and its correlation with neonatal serum 25‐hydroxyvitamin D levels. British Journal of Nutrition 106, 1383–1389. [DOI] [PubMed] [Google Scholar]
- Mithal A., Wahl D.A., Bonjour J.P., Burckhardt P., Dawson‐Hughes B., Eisman J. et al (2009) Global vitamin D status and determinants of hypovitaminosis D. Osteoporosis International 20, 1807–1820. [DOI] [PubMed] [Google Scholar]
- Molla A.M., Al Badawi M., Hammoud M.S., Molla A.M., Shukkur M., Thalib L. et al (2005) Vitamin D status of mothers and their neonates in Kuwait. Pediatrics International 47, 649–652. [DOI] [PubMed] [Google Scholar]
- Morris J. & Peacock M. (1976) Assay of plasma 25‐hydroxy vitamin D. Clinica Chimica Acta 72, 383–391. [DOI] [PubMed] [Google Scholar]
- Newhook L.A., Sloka S., Grant M., Randell E., Kovacs C.S. & Twells L.K. (2008) Vitamin D insufficiency common in newborns, children and pregnant women living in Newfoundland and Labrador, Canada. Maternal and Child Nutrition 5, 186–191. [DOI] [PMC free article] [PubMed] [Google Scholar]
- Nicolaidou P., Hatzistamatiou Z., Papadopoulou A., Kaleyias J., Floropoulou E., Lagona E. et al (2006) Low vitamin D status in mother‐newborn pairs in Greece. Calcified Tissue International 78, 336–341. [DOI] [PubMed] [Google Scholar]
- Nordic Council of Ministers (2004) Integrating Nutrition and Physical Activity, 4th edn Nordic Council of Ministers: Copenhagen. [Google Scholar]
- Novakovic B., Galati J.C., Chen A., Morley R., Criag J.M. & Saffery R. (2012) Maternal vitamin D predominates over genetic factors in determining neonatal circulating vitamin D concentrations. American Journal of Clinical Nutrition 96, 188–195. [DOI] [PubMed] [Google Scholar]
- Ron M., Leviz M., Chuba J. & Dancis J. (1984) Transfer of 25‐hydroxyvitamin D3 and 1,25‐dihydroxyvitamin D3 across the perfused human placenta. American Journal of Obstetrics & Gynecology 148, 370–374. [DOI] [PubMed] [Google Scholar]
- Sachan A., Gupta R., Das V., Agarwal A., Awasthi P. & Bhatia V. (2005) High prevalence of vitamin D deficiency among pregnant women and their newborns in northern India. American Journal of Clinical Nutrition 81, 1060–1064. [DOI] [PubMed] [Google Scholar]
- Sahu M., Bhatia V., Aggarwal A., Rawat V., Saxena P., Pandey A. et al (2009) Vitamin D deficiency in rural girls and pregnant women despite abundant sunshine in northern India. Clinical Endocrinology 70, 680–684. [DOI] [PubMed] [Google Scholar]
- Salek M., Hashemipour A., Gheiratmand A., Kelishadi R., Ardestani P., Nejadnik H. et al (2008) Vitamin D deficiency among pregnant women and their newborns in Isfahan, Iran. Experimental and Clinical Endocrinology and Diabetes 116, 352–356. [DOI] [PubMed] [Google Scholar]
- Seino Y., Ishida M., Yamaoka K., Ishii T., Hiejima T., Ikehara C. et al (1982) Serum calcium regulating hormones in the perinatal period. Calcified Tissue International 34, 131–135. [DOI] [PubMed] [Google Scholar]
- Shand A.W., Nassar N., Von Dadelszen P., Innis S.M. & Green T.J. (2010) Maternal vitamin D status in pregnancy and adverse pregnancy outcomes in a group at high risk for pre‐eclampsia. British Journal of Obstetrics and Gynaecology 117, 1593–1598. [DOI] [PubMed] [Google Scholar]
- Song S.J., Zhou L., Si L., Liu J., Zhou J., Feng K. et al (2013) The high prevalence of vitamin D deficiency and its related maternal factors in pregnant women in Beijing. PLoS ONE 8, 1–8. [DOI] [PMC free article] [PubMed] [Google Scholar]
- Streym S., Molla U.K., Rejnmark L., Heickendorff L., Mosekilde L. & Vestergaard P. (2013) Maternal and infant vitamin D status during the first 9 months of infant life – a cohort study. European Journal of Clinical Nutrition 67, 1022–1028. [DOI] [PubMed] [Google Scholar]
- Sulaiman R.A., Sharratt C.L., Lee P., Skinner A., Griffiths M.J., Webster C. et al (2010) Ethnic differences in umbilical cord blood vitamin D and parathyroid hormone‐South Asians compared to whites born in UK. The Journal of Maternal‐Fetal and Neonatal Medicine 23, 1315–1317. [DOI] [PubMed] [Google Scholar]
- Thomas S.D.C., Fudge A.N., Whiting M. & Coates P.S. (2011) The correlation between third trimester maternal and newborn serum 25‐hydroxy‐vitamin D in a selected South Australian group of newborn samples. British Medical Journal 1, 1–4. [DOI] [PMC free article] [PubMed] [Google Scholar]
- United Nations (2013) World Population Prospects: The 2012 Revision, Volume 1: Comprehensive Tables. Department of Economic and Social Affairs, Population Division: New York. [Google Scholar]
- Vercruyssen J., Jacquemyn Y. & Ajaji M. (2012) Effect of sun exposure and 25‐hydroxyvitamin D status among pregnant women in Antwerp, Belgium. International Journal of Gynecology and Obstetrics 116, 76–86. [DOI] [PubMed] [Google Scholar]
- Viljakainen H.T., Saarnio E., Hytinantti T., Miettinen M., Surcel H., Makitie O. et al (2010) Maternal vitamin D status determines bone variables in the newborn. Journal of Clinical Endocrinology & Metabolism 95, 1749–1757. [DOI] [PubMed] [Google Scholar]
- Waiters B., Godel J.C. & Basu T.K. (1998) Perinatal vitamin D and calcium status of Northern Canadian mothers and their newborn infants. Journal of American College of Nutrition 18, 122–126. [DOI] [PubMed] [Google Scholar]
- Wei S., Qi H., Luo Z. & Fraser W. (2013) Maternal vitamin D status and adverse pregnancy outcomes: a systematic review and meta‐analysis. Journal of Maternal‐ Fetal and Neonatal Medicine 26, 889–899. [DOI] [PubMed] [Google Scholar]
- Weisse K., Winkler S., Hirche F., Herberth G., Hinz D., Bauer M. et al (2013) Maternal and newborn vitamin D status and its impact on food allergy development in the German LINA cohort study. Allergy 68, 220–228. [DOI] [PubMed] [Google Scholar]
Associated Data
This section collects any data citations, data availability statements, or supplementary materials included in this article.
Supplementary Materials
Table S1. Manuscripts included in the review by WHO region and by their reporting of maternal and/or newborn vitamin D status.
Table S2. Manuscripts included in review by the serum 25‐hydroxyvitamin D [25(OH)D] concentration values used to describe vitamin D status.
Supporting info item