

Abstract
Household food security shows little indication of nutrient inadequacy among children, according to reports made by parents. We examined the associations of food insecurity as reported by children and mothers with children's consumption of energy, macronutrients such as vitamin A, calcium, iron and zinc, and selected foods, and whether these associations differed by child's gender. This cross‐sectional study had non‐probabilistic 128 Venezuelan mother–child pairs. We assessed food insecurity and management strategies in children using 10‐ and nine‐item instruments, respectively. Mothers' report of food insecurity came from a previously validated 12‐item instrument. Nutrient intake of children was assessed with a 67‐item food frequency questionnaire. Comparisons were made using chi‐square test for contingency tables and t‐tests for trends (P < 0.05). Linear regression models were used for intakes of nutrients and selected foods. We tested for interactions with gender. Prevalence of child‐ and mother‐reported food insecurity was 83.6 and 61.7%, respectively (P < 0.01). Greater food insecurity or management strategies reported by boys was associated with lower calcium, iron and zinc intake (P < 0.05), but reported intakes were low in girls who are even food secure. Rice and corn flour consumption was higher with higher food insecurity in children. Papaya and banana were less consumed by food‐insecure children. We found shifts in 13 of 67 foods consumed, with less quality in those food insecure, as reported by children. Mother‐reported food insecurity was associated only with rice intake of children. In contrast to mothers' reports, food insecurity reported by children was associated with children's lower quality of diet and shifts in foods consumed.
Keywords: inequalities, childhood diet, food security, calcium, iron, zinc
Introduction
Children and adolescents should have access to adequately safe, nutritious and culturally appropriate food at all times that promotes optimal physical, cognitive and social growth and development (American Dietetic Association 2003; American Dietetic Association 2010), but there are still 66 million children who attend school hungry worldwide (World Food Program 2014). Hunger is a severe consequence of lack of food, i.e. food insecurity (National Research Council 2006). In the United States, 8.6 million children lived in food‐insecure households (USDA 2013). In Venezuela, 69% of households with children and 54% of adolescents reported being food insecure (Bernal & Lorenzana 2007; Hernández et al. 2011).
Children have been a focus of study about food insecurity in the last 15 years (Alaimo et al. 2001; Connell et al. 2004, 2005; Nord 2009; Bernal 2010; Fram et al. 2011; Bernal et al. 2012; Nalty et al. 2013). Child food insecurity is associated with non‐nutritional and nutritional outcomes. Detrimental non‐nutritional outcomes include altered parenting (Casey et al. 2004; Whitaker et al. 2006; Nanama & Frongillo 2012), behavioural problems, poor health (Casey et al. 2005), disrupted social interactions, delayed early childhood language development (Saha et al. 2010), compromised school performance (Jyoti et al. 2005; National Research Council 2006), lower physical activity (Fram et al. 2013) and altered daily activities (Bernal et al. 2014). Food‐insecure children are more likely to do child labour, cook, take care of siblings and be absent from school (Bernal et al. 2014). Nutritional outcomes include poor dietary intake (Fram et al. 2015) and infant feeding practices (Saha et al. 2008).
Food insecurity measured at household level has been inconsistently associated with energy and macronutrient intake in adults (Kendall et al. 1995, 1996; Rose & Oliveira 1997; Tarasuk & Beaton 1999; Bhattacharya et al. 2004; Rosas et al. 2009; Sulaiman et al. 2011; Huet et al. 2012; Mohamadpour et al. 2012; Dharod et al. 2013; Ghattas et al. 2013). Food insecurity is associated with lower intake of micronutrients in adults; however, such that when food insecurity is higher, micronutrient intakes are lower (Kendall et al. 1996; Rose & Oliveira 1997; Tarasuk & Beaton 1999; Champagne et al. 2007; Sulaiman et al. 2011). These differences among studies could be explained by their diverse cultural contexts.
Household food security shows little indication of nutrient inadequacy among children (Kirkpatrick & Tarasuk 2008), but reporters were parents not their children. Hispanic food‐insecure children, as reported by parents, had lower intake of total carbohydrates, dairy and vitamin B6 in Texas, USA (Rosas et al. 2009). From information obtained when parents and children were interviewed together, food‐insecure children significantly consumed more energy, protein, added sugars and saturated fat (Keita et al. 2009; Sharkey et al. 2012), and less vitamin D and potassium (Sharkey et al. 2012), than their food‐secure counterparts. From information obtained when parents were interviewed, food‐insecure children consumed more junk foods (Rosas et al. 2009). Self‐reported food insecurity in adolescents was associated with less consumption of fruits and vegetables (Kirkpatrick & Tarasuk 2008; Utter et al. 2012). Self‐reported food insecurity in elementary school children was associated with higher consumption of energy, fat, sugar and fibre, and lower intake of vegetables (Fram et al. 2015). These studies showed diverse perspectives depending on who is the reporter.
Children's dietary intake may differ by gender. Some studies reported that boys and girls have similar dietary intakes (Rothausen et al. 2012; Torres et al. 2014). Others reported that girls have better dietary intakes (Lazarou & Newby 2011; Lee et al. 2011), whereas others still reported that boys consume more energy, protein, meat and dairy products (Lopez et al. 2012), but also are longer breastfed, get more vitamin supplementation and have an advantage in height and weight relative to girls (Barcellos et al. 2014).
Parents' and children's reports of food insecurity and diet have low agreement (Fram et al. 2013; Nalty et al. 2013; Sharkey et al. 2013; Bernal et al. 2014). Adults, usually mothers, are more or less likely to report food insecurity at the household level than their children (Kuku et al. 2011; Sharkey et al. 2013). Depending on the intra‐household allocation of resources, individuals could be food secure in a food‐insecure household, just as it is possible for individuals not to be poor in a poor household (National Research Council 2006). Accuracy of parents' and children's reports on child dietary intake is a concern; children eat meals at school where parents are not present, so parents may not accurately report children's intake (Baxter et al. 2014).
The aim of this study was to examine the associations of food insecurity as reported by children and mothers with the consumption of energy and macronutrients such as vitamin A, calcium, iron and zinc, and selected foods. We hypothesized that child diet would be of lower quality on food‐insecure children, and that child diet would be more strongly associated with child than with maternal report of food insecurity. We also examine whether these associations differ by gender of the child.
Key messages.
Food‐insecure children have less healthy diet.
Food‐insecure children have low‐intake adequacies of micronutrients such as calcium, iron and zinc.
Greater food insecurity or management strategies reported by boys is significantly associated with lower calcium, iron and zinc intake, but reported intakes are low in girls who are even food secure.
There are shifts in 13 of 67 foods consumed, with less food quality in those food insecure, as reported by children. Mother‐reported food insecurity is associated only with rice intake of children.
Materials and methods
Study setting
The study protocol was reviewed and approved by the Bioethics Committee of the Universidad Simón Bolívar. Informed consent was obtained from the director of the school, from parents and verbally from children. Data collection was carried out in Spanish.
The study was carried out in a poor, peri‐urban community in Miranda State, Venezuela. This community is close to Caracas, the capital of the country, but has deficiencies in access to school‐feeding programmes, domestic water and sanitation services. This community includes both urban and rural areas where tropical fruits such as bananas, mangoes and plantains are produced. Miranda is the second most densely populated state of Venezuela, with a density of 870/sq. miles (Instituto Nacional de Estadística 2011). In 2011, about 65 000 (1%) children between 7 and 12 years were not attending school nationally, and 10% of households lived without basic services such as water and in small spaces. In 2012, 32% of the total population was poor.
Study sample
Data collection was performed during the school year from April to July 2009. Seasonality was not an issue in data collection because the weather is stable, with average temperature from 68 to 90°F all year. Based on a power calculation, we aimed to collect data on 128 mother–child pairs. A total of 545 children (7–17 years old) from two schools and their legal guardians were invited to participate in the study. Recruitment was performed using personal letters signed by the researchers and the directors of the schools that were given to the children, and children were also encouraged to participate through the school billboard. Of this total, 334 (61%) parents did not provide informed consent or refused to participate. All 211 children of parents who gave consent were interviewed and measured, but 80 mothers of these children did not attend the day of their interview and could not be reached by telephone. The most common reasons for mothers not participating were working or being too busy.
In total, 128 mother–child pairs were recruited. All children were attending public schools, meaning that families did not have enough income to pay for a private school, which is considered to provide better quality education. Sixty of these 128 mothers were interviewed by telephone. Personal interviews of both children and mothers were conducted by two trained nutritionists and the lead author. The legal guardian interviewed was in 91% of cases the mother; other guardians were the father or the grandparents. Henceforth, all these adults will be referred to as ‘mothers’. We verified with the teacher, the mother and the child that no two children in the sample shared the same mother or lived in the same household.
Assessment of food insecurity
The process of development and refinement of the instruments to assess food insecurity from children was based on the methodological guide of the Food and Nutrition Technical Assistance Project (FANTA; Frongillo et al. 2004). Initially, 50 items were developed from our qualitative data (Bernal et al. 2012), which were then refined after cognitive interviews with four girls and four boys who are aged 10–15. This process led us to develop two instruments for use with children: the first one to assess experiences of food insecurity with 10 items and the other to assess management strategies to alleviate food insecurity with nine items.
The authors and four professionals with expertise in food security, design of measuring instruments and population studies reviewed the items and provided suggestions. We did cognitive interviews on the 50 items with eight children to assure the comprehension of the items. We also tested options for the item responses (always, frequent, sometimes and never) and the period that children can recall easily. The response ‘frequent’ was almost never selected by children, but children were able to distinguish always, sometimes and never over a month. Therefore, we chose a response set with these three responses. From the first instrument that contained 50 items and that we examined through the cognitive interviews and review by four experts, we selected 28 items to test in a community other than the main study community (sample n = 118, mean age: 11.76 ± 1.71 years, range: 9, 16, equally gender distributed). From the data collected, we used factor analysis and reliability tests to select the most appropriate items. Two instruments emerged: 10 items on food insecurity and nine items on management strategies, which were used in the sample of 128 children for this study.
The instruments that were developed and refined for assessing food insecurity and management strategies in children (Bernal 2010; Bernal et al. 2014) and a previously developed and validated instrument for Venezuelan households (Lorenzana & Sanjur 1999) were administered in the sample of 128 child–mother pairs. The 10 items used to measure food insecurity in children were: (1) Do you settle for the food you have because there is nothing more? (2) Would you like to eat more food but there is nothing else in your house? (3) Do you have to eat the same food because there is no other? (4) Have you worried because you have nothing to eat? (5) Has it occurred that the refrigerator is empty and you have nothing to eat? (6) Have you gone to sleep hungry for lack of food? (7) When the groceries finish in your house, do you spend several days without food? (8) Have you skipped any meal (breakfast, lunch or dinner) for lack of food? (9) Have you gone to school without eating for lack of food in your house? (10) Have you spent a day without eating for lack of food? The nine items used to capture the management strategies were: (1) Have you used your own money to buy food? (2) Have you not eaten so that another child can eat? (3) Does anyone (mom or dad) eat less so you can eat more? (4) Do you store food for times when you have nothing to eat? (5) Have you not eaten so that an adult can eat? (6) Have you ever asked for food ‘on loan’ or sold ‘on credit?’ (7) Do you visit anyone (grandparents, uncles or aunts, neighbours) so he or she gives you food? (8) Have you searched for mangoes, plantains or eggs outside the house, because there is nothing else to eat? (9) Do you run errands for others to obtain money to eat?
The possible responses in the two instruments for children were never (assigned 0 points), sometimes (1 point) and always (2 points). The possible responses in the 12‐item instrument for food insecurity from mothers were never (0 points), rarely (1 point), usually (2 points) and always (3 points). Responses across the 10 items for food insecurity and nine items for management strategies were reported by children, and the 12 items reported by mothers were summed to form three scales; reliability values (i.e. internal consistency from Cronbach's α) were 0.76, 0.74 and 0.90, respectively. Higher values on the scales meant more frequent indications of food insecurity or engaging in management strategies.
Assessment of children's diet
A semi‐quantitative food frequency questionnaire was developed using methodology proposed by Gibson (2005), with the objective of assessing nutrient intake levels of energy; macronutrients such as vitamin A, calcium, iron and zinc; and foods eaten by children. As a first step, to construct the food items in the food frequency questionnaire, we assessed the food eaten by 20 children through the 24‐h recall method of the previous day (Gibson 2005). These children were not in our final sample, but had similar characteristics in terms of age and living conditions. As a second step, we enriched the list of food items in the food frequency questionnaire with a list of foods more frequently consumed by the Venezuelan population, according to the National Statistical Institute for the same period of time (Instituto Nacional de Estadística 2009).
The preliminary food frequency questionnaire was tested in a sample of 10 children, enabling the reduction of the original 118 food items to a total of 67 food items. The food frequency questionnaire applied directly in children had five options in response to the previous month: daily, weekly, biweekly, monthly and never. To determine quantities, we used household measures such as cups, glasses, plates, spoons and physical models that helped estimate the portion sizes of foods. The amounts detailed in the food frequency questionnaire were standardized, considering for each food item: the small, medium and large portion sizes. For example, for the group of fruits and vegetables, three rations of each food were measured to make up an average amount that represented the small, medium and large portion. For the group of miscellaneous foods such as sweets and salty snacks, the original packaging was used to identify the nutritional content provided, supplied by the company producing the food, when it did not appear in the Venezuelan Food Composition Table. Frequency of consumption for each food was converted into a continuous scale with a unit of frequency eaten per day: 30.40 for daily, 4.34 for weekly, 2.03 for bi‐monthly, 1.00 for monthly and 0 for never consumed.
The translation from food to nutrient values was based on data from the Venezuelan Food Composition Table (Ministerio de Salud y Desarrollo Social & Instituto Nacional de Nutrición 1999). For foods such as sweets and salty snacks that did not appear in the food composition tables, the data in the original packaging were used to identify the nutritional value, as supplied by the company producing the food. The adequacy of energy, macronutrients and micronutrients studied was calculated using the mean nutrients requirement for the Venezuelan population (Ministerio de Salud y Desarrollo Social & Instituto Nacional de Nutrición 2000) by gender and age of each child. A nutrient database was constructed with the reported amounts of each food by each child. Then, a database that summarized the children's intake was constructed.
Data analysis
SPSS v.15 software (SPSS 2012) was used to carry out the statistical analysis. Comparisons were made using chi‐square test for contingency tables and t‐tests for trends. P‐values <0.05 were accepted as statistically significant. Linear regression models were used to assess the association of food insecurity as reported by children or mothers and nutrient intakes of energy (kcal), carbohydrates (g), protein (g), fat (g), vitamin A (ER), calcium (mg), iron (mg) and zinc (mg), and frequency of selected eaten foods (times per day). Regression models had nutrients or foods consumed as dependent variables, and gender and either food insecurity reported by children, strategies reported by children or food insecurity reported by mothers as independent variables. We tested for interactions between gender and food insecurity or strategies by including product terms. For nutrients or foods with significant interactions, we stratified the analyses by gender. We report regression results as regression coefficients that quantify the difference in consumption of a nutrient or food for each one‐point difference in food insecurity or strategies.
Results
Children's mean age (±standard deviation) was 12.5 ± 2.2 years (range: 7–17), with 50.8% of the sample girls. The mothers' mean age was 42.4 ± 9.8 years (range: 21–69). Families had on average six members, of which three were children (Table 1). The per capita income per month in the household was USD126.5, which was obtained using the official exchange rate of 4.3 Bolívares per USD1 for the period of data collection. Four of 10 girls, in contrast with 3 of 10 boys, were classified under the poverty line (P < 0.01). A total of 13.3% of the households did not have access to buy one food basket (a list of suggested standard foods and prices subsidized by the government) in a month to reach their minimum nutritional needs (Instituto Nacional de Estadística 2009). Those children who were classified as food secure applied on average less than one management strategy (0.7 ± 1.1), mild food‐insecure children applied less than two management strategies (1.5 ± 1.4), moderate food‐insecure children applied four management strategies (3.9 ± 2.3) and severe food‐insecure applied on average six management strategies (6.1 ± 2.4; P < 0.01). Children reporting food insecurity were 83.6% of the total sample studied, whereas their mothers reported food insecurity in 61.7% of the households (P < 0.01). Food insecurity and strategies reported by children were highly related with each other (r = 0.70, P < 0.001), but food insecurity and strategies reported by children were weakly correlated with the food insecurity according to the mothers (r = 0.21, P = 0.010, and r = 0.17, P = 0.05, respectively). Girls tended to report higher prevalence of food insecurity than boys (P = 0.08).
Table 1.
Characteristics of the children and their households (n = 128)
| Girls (n = 63) | Boys (n = 65) | All (n = 128) | P‐value | |
|---|---|---|---|---|
| Family size (mean ± SD, min–max) | 5.57 ± 2.10 (2–13) | 5.79 ± 2.15 (2–14) | 5.68 ± 2.12 (2–14) | 0.73 |
| Number of children at home (mean ± SD, min–max) | 2.92 ± 1.53 (1–9) | 2.89 ± 1.48 (1–6) | 2.91 ± 1.50 | 0.46 |
| Per capita income USD † (mean ± SD, min–max) | 123.47 ± 90.08 (25.56–511.62) | 129.53 ± 78.21 (26.57–403.10) | 126.45 ± 84.17 (25.34–511.62) | 0.66 |
|
Under poverty line Freq. (%)* |
26 (40%) | 21 (33.3%) | 47 (36.71%) | <0.01* |
|
Less than one food basket per household Freq. (%) |
8 (12.3%) | 9 (14.3%) | 17 (13.3%) | 0.10 |
| Number of strategies used by children to alleviated food insecurity | 2.67 ± 2.44 (1–10) | 3.03 ± 2.78 (1–10) | 2.85 ± 2.61 (1–10) | 0.44 |
| Food insecurity reported by children | 58 (89.2%) | 49 (77.8%) | 107 (83.6%) | 0.08 |
| Food insecurity reported by mothers | 39 (60.0%) | 40 (63.5%) | 79 (61.7%) | 0.68 |
SD, standard deviation. *Significance level at P < 0.05 for difference in frequencies between girls and boys. †The official exchange rate was 4.30 bolívares by USD1.
Excess intakes of energy, carbohydrates and vitamin A were found in girls, whereas carbohydrates, vitamin A and iron were found in boys (Table 2). Children had intakes high for carbohydrates, adequate for proteins and low for fat (particularly for boys). Calcium and zinc were classified as low intake (≤85% of adequacy) when compared against the Venezuelan nutrient requirements for children, particularly for girls.
Table 2.
Nutrient intake† in children stratified by gender
| Girls (n = 63) | Boys (n = 65) | All (n = 128) | P‐value | ||||
|---|---|---|---|---|---|---|---|
| Mean ± SD | % Adequacy* | Mean ± SD | % Adequacy* | Mean ± SD | % Adequacy* | ||
| Energy (kcal) | 2353.42 ± 1004.47 | 116 | 2401 ± 1175.78 | 105 | 2377.02 ± 1088.09 | 111 | 0.42 |
| Carbohydrates (g) | 279.56 ± 23.13 | 140 | 322.47 ± 42.41 | 123 | 300.68 ± 40.14 | 132 | 0.93 |
| Protein (g) | 68.52 ± 28.63 | 102 | 76.48 ± 43.64 | 103 | 72.44 ± 36.86 | 103 | <0.01 |
| Fat (g) | 59.52 ± 30.15 | 88 | 58.28 ± 38.15 | 77 | 58.91 ± 34.19 | 83 | 0.35 |
| Vitamin A (ER) | 1194.54 ± 717.19 | 150 | 1311.22 ± 930.54 | 136 | 1251.97 ± 827.86 | 143 | 0.20 |
| Calcium (mg) | 782.25 ± 447.53 | 67 | 893.42 ± 612.01 | 84 | 836.97 ± 535.63 | 75 | 0.03 |
| Iron (mg) | 15.33 ± 6.50 | 110 | 17.98 ± 10.06 | 193 | 16.64 ± 8.52 | 151 | <0.01 |
| Zinc (mg) | 4.03 ± 2.52 | 34 | 5.57 ± 4.02 | 39 | 4.79 ± 3.42 | 37 | <0.01 |
ER, Equivalent of retinol; SD, standard deviation.
*Adequacy calculations were performed based on the average daily requirements per person recommended in the text Values of Energy and Nutrients for the Venezuelan Population. Cut‐off points used to establish % of adequacy were 85–115% (Ministerio de Salud y Desarrollo Social & Instituto Nacional de Nutrición 2000).
†The calculation considers the sex and age corresponding to children and adolescents recommended in the references Values of Energy and Nutrients for the Venezuelan Population (Ministerio de Salud y Desarrollo Social & Instituto Nacional de Nutrición 2000).
Greater food insecurity or management strategies reported by boys was associated with lower calcium, iron and zinc (P < 0.05, Table 3); the relationship is depicted in Fig. 1 for zinc and was similar for calcium and iron. Food insecurity reported by girls or mothers was not associated with any of the nutrients. Food insecurity or management strategies reported by children was associated with 13 of 67 foods, whereas food insecurity reported by mothers was associated only with rice. Rice and arepa (made with enriched corn flour) consumption was higher by about one time per day for each point of food insecurity reported by children. Breakfast cereal, papaya, banana, packed fruit juice and instant beverage were less frequently consumed by food‐insecure children. Salty crackers and barley beverage (malta) were reported more consumed when children applied more management strategies. For boys, salty crackers were more consumed with more management strategies, whereas packed fruit juice was less consumed with greater food insecurity and more management strategies.
Table 3.
Nutrients and foods selected according to strategies and food insecurity in children and their mothers (n = 128)
| Nutrients (unit) and selected foods (times/day) | Food insecurity reported by children | Strategies reported by children | Food insecurity reported by mother | |||
|---|---|---|---|---|---|---|
| β | P‐value | β | P‐value | β | P‐value | |
| Energy (kcal) | −41.49 | 0.22 | −32.03 | 0.38 | −7.21 | 0.72 |
| Carbohydrates (g) | 0.90 | 0.47 | 0.14 | 0.92 | 0.53 | 0.48 |
| Protein (g) | −1.16 | 0.31 | −0.82 | 0.51 | 0.15 | 0.83 |
| Fat (g) | −1.78 | 0.09 | −1.57 | 0.18 | −0.10 | 0.87 |
| Vitamin A (ER) | −5.47 | 0.83 | −5.16 | 0.85 | −17.38 | 0.26 |
| Calcium (mg) | −25.51 | 0.13 | −23.05 | 0.20 | 9.86 | 0.33 |
| Girls | −2.05 | 0.92 | 18.10 | 0.43 | 10.54 | 0.30 |
| Boys | −43.81 | 0.08 | −58.49 | 0.03 | 10.27 | 0.61 |
| Iron (mg) | −0.39 | 0.14 | −0.41 | 0.15 | 0.02 | 0.89 |
| Girls | 0.12 | 0.69 | 0.36 | 0.28 | 0.01 | 0.96 |
| Boys | −0.78 | 0.05 | −1.09 | 0.02 | 0.13 | 0.70 |
| Zinc (mg) | −0.22 | 0.04 | −0.24 | 0.04 | 0.02 | 0.74 |
| Girls | 0.04 | 0.74 | 0.02 | 0.83 | 0.01 | 0.80 |
| Boys | −0.42 | 0.01 | −0.49 | <0.01 | 0.06 | 0.64 |
| Rice | 0.93 | 0.02 | 0.89 | 0.04 | 0.47 | 0.05 |
| Precooked corn flour (Arepa) | 0.85 | 0.03 | 0.46 | 0.28 | 0.29 | 0.22 |
| Breakfast cereal | −1.10 | <0.01 | −0.91 | 0.01 | −0.27 | 0.19 |
| Salty crackers | 0.62 | 0.06 | 0.76 | 0.04 | −0.09 | 0.67 |
| Girls | −0.22 | 0.67 | −0.15 | 0.80 | −0.20 | 0.41 |
| Boys | 1.25 | <0.01 | 1.47 | <0.01 | 0.17 | 0.64 |
| Soup | 0.12 | 0.57 | 0.51 | 0.03 | −0.01 | 0.91 |
| Cheese | −0.55 | 0.09 | −0.32 | 0.38 | −0.30 | 0.13 |
| Papaya | −0.55 | <0.01 | −0.59 | <0.01 | −0.07 | 0.58 |
| Banana | −0.84 | <0.01 | −0.40 | 0.26 | 0.17 | 0.37 |
| Lettuce | −0.57 | 0.10 | −0.17 | 0.66 | −0.38 | 0.07 |
| Raw salad | −0.39 | 0.08 | −0.27 | 0.27 | 0.18 | 0.17 |
| Packed fruit juice | −0.64 | 0.02 | −0.17 | 0.57 | −0.27 | 0.12 |
| Girls | −0.20 | 0.65 | 0.66 | 0.16 | −0.34 | 0.10 |
| Boys | −0.97 | <0.01 | −0.82 | 0.04 | −0.11 | 0.71 |
| Barley beverage (Malta) | 0.29 | 0.44 | 0.91 | 0.03 | −0.09 | 0.66 |
| Instant beverage | −0.53 | 0.01 | −0.37 | 0.12 | −0.12 | 0.37 |
ER, Equivalent of retinol.
Figure 1.
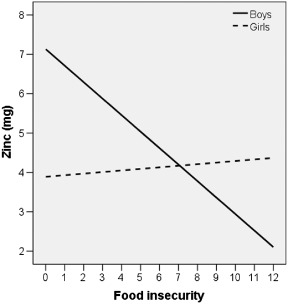
Fitted regression lines for food insecurity reported by children and dietary zinc by gender (n = 128, interaction P < 0.01).
Discussion
Dietary quality characterized by nutrients and foods eaten was associated with child report of food insecurity and management strategies, but not with maternal report of food insecurity. Food‐insecure children had poorer quality diet than food‐secure children and had shifts in foods consumed.
Food insecurity and management strategies reported by children were not associated with energy or macronutrients, but were associated with lower calcium, iron and zinc in boys (not in girls). Food‐insecure children, reported by themselves (Sharkey et al. 2012), also had shifts in their diets. These Texan children increased dietary intakes for energy, protein and added sugars, but they did not meet the nutrient recommendations for potassium or vitamin D.
Zinc was the micronutrient most deficient among all children, even in food‐secure children, when we compare against the reference value of this population (Ministerio de Salud y Desarrollo Social & Instituto Nacional de Nutrición 2000). Zinc has been used as an indicator of dietary quality, related with adequate health and development of human capital (Buttha et al. 2008; Moreno‐Tamayo et al. 2011). In Mexican mother–child pairs, as food insecurity varied, maternal dietary adequacy of intake was not compromised in favour of her child, in neither quantity nor quality as measured by zinc intake (Moreno‐Tamayo et al. 2011). But they measured food insecurity with an integrated instrument that focused on food production, access, household availability and purchasing power, and not from individual food insecurity experience.
Calcium was the second micronutrient most deficient among children who were food insecure. Sources of calcium in low‐income settings, such as Venezuela, are expensive and, as in the case of milk, are viewed as prestige food (Prentice 2014). Moreover, the country is facing shortages in milk (Landaeta‐Jiménez et al. 2012), which makes it difficult to access. Calcium adequacy should be reached during childhood to reach the optimal bone health throughout life (Orlet Fisher et al. 2000; Greer & Krebs 2006). Texan children also had lower calcium intake when food insecurity was higher (Sharkey et al. 2012).
Iron was another critical micronutrient consumed in lower quantities when food insecurity was higher, even in our sample that none of the children had low adequacy. Iron deficiency anaemia is the most common form of malnutrition in the world, affecting more than 2 billion people globally, but children and women in childbearing ages are among the most at‐risk populations (World Health Organization 2014). The dietary pattern of the Venezuelans makes the access to iron affordable because it is included in precooked corn flour (García‐Casal & Layrisse 2002) and is subsidized by the government.
Food‐insecure children had shifts in foods consumed. They consumed frequently basic staples, but less of expensive foods such as breakfast cereal, banana, papaya, juices and salads. In Venezuela, staple foods are mainly represented by rice and arepas (made of precooked corn flour enriched) that are consumed by at least 94% of the population (Instituto Nacional de Estadística 2011). Venezuelan children could obtain 38% of iron and 10% of vitamin A to their diets if this flour is included in their meals (Del Real et al. 2002). Ready‐to‐eat foods or beverages are reported by children, such as eating salty crackers, barley beverage (malta) that increase energy, salt and sugar intake. These foods are classified as processed, and have a role in the pandemic of overweight and obesity worldwide (Moubarac et al. 2014).
Gender differences were found in the relationship with food insecurity. Calcium, iron, zinc, salty crackers and packed fruit juice were significantly associated with food insecurity among boys but not girls. Whereas intake of these micronutrients was lower with greater food insecurity for boys, there was no association for girls, meaning that girls with low food insecurity had relatively low intakes. The most likely explanation is the cultural difference in the foods provided to boys and girls. A predominant view in Venezuela is that boys should be given more animal protein than girls, trying to grow boys taller and healthier so that they can work and generate income from their early years; girls, in contrast, need to be protected, thinner, stay at home and avoid early pregnancies. Gender bias in food intake has been reported in Latin America previously (Frongillo & Bégin 1993), and a recent study documents that boys consume more meat than girls in Venezuela (López‐Sayers et al. 2015). Others' findings in dietary intakes in children by gender are different; some reported similar intake by gender (Rothausen et al. 2012) whereas others reported better dietary intakes for girls (Lazarou & Newby 2011; Lee et al. 2011; Torres et al. 2014) or boys (Adeel et al. 2012; Lopez et al. 2012), and even better nutritional outcomes in boys (Barcellos et al. 2014). Gender differences among children with food insecurity need to be further studied; probably the diverse cultural context could influence it. Although we did not find an association of dietary intake for girls with food insecurity, girls need to be protected, as well as boys, especially because girls had inadequacy even when they were food secure. Achieving gender equality necessitates the transformation of related social norms that assign disproportionate responsibility to one or another gender (Hendra et al. 2013), but it also demands from leaders at community and family levels to treat boys, girls, women and men equally, to challenge discrimination in all its forms; it demands rethinking and transforming gender stereotypes and traditional norms of masculinity and femininity (Hendra et al. 2013).
The dietary and food security data we collected were cross‐sectional, which only reflect one point in a period of time. The cross‐sectional design does not allow claiming causality. The semi‐quantitative food frequency questionnaire was developed using standard methodology (Gibson 2005) and was pretested, but it has not been validated against another measure of dietary intake in Venezuela. Given that several linear regression models were used to examine the pattern of relationships of food insecurity and strategies with dietary and food constituents, the P‐values reported should best be interpreted as revealing relative strengths of relationships.
Conclusion
Food insecurity and management strategies in children were associated with less healthy diets and having low adequacies of the micronutrients such as calcium, iron and zinc. Nutrition experts have been advising about these deficiencies for a long time, but we still need to incorporate in policy responses that go beyond energy and macronutrient intake. This means that it is not only a matter of providing meals rich in energy‐dense foods but it is also necessary to include high‐quality foods such as fruits, vegetables and nuts in the everyday diet of children.
Food‐insecure children are more vulnerable to negative nutritional outcomes. They need to satisfy their full potential in growth and development, even if they live in low‐income settings. Our results help us to understand what food resources children use to manage their situation, and what nutritional differences occur in their diets. We do not know what the dietary and nutritional consequences are in the long‐term of being food insecure for a child. Some potential strategies to improve the quality of the children diets and ensure gender equity are repositioning nutritional education, increasing access to high‐quality meals, fortification and supplementation.
Source of funding
Universidad Simon Bolivar.
Conflicts of interest
The authors declare that they have no conflicts of interest.
Contributions
J.B., E.F., and J.R. designed the research; J.B. conducted the research; J.B., and E.F. analyzed the data; J.B. and E.F. wrote the paper; and all the authors had responsibility, read and approved the final manuscript.
Acknowledgement
The authors wish to acknowledge all children and their mothers who participated in the study.
Bernal, J. , Frongillo, E. A. , and Rivera, J. A. (2016) Food insecurity reported by children, but not by mothers, is associated with lower quality of diet and shifts in foods consumed. Maternal & Child Nutrition, 12: 546–557. doi: 10.1111/mcn.12206.
References
- Adeel F.F.A., Awan M.A., Anjum N., Ahmed H., Ahmed Z. & Afreen A. (2012) Dietary practices among adolescents: do boys eat better than girls? NURTURE: Journal of Pakistan Home Economics Association 6, 1–8. [Google Scholar]
- Alaimo K., Olson C.M. & Frongillo E.A. (2001) Food insufficiency and U.S. school age children's cognitive, academic, and psychosocial development. Pediatrics 108, 44–53. [PubMed] [Google Scholar]
- American Dietetic Association (2003) Position of the American Dietetic Association: addressing world hunger, malnutrition, and food insecurity. Journal of the American Dietetic Association 103, 1046–1057. [DOI] [PubMed] [Google Scholar]
- American Dietetic Association (2010) Position of the American Dietetic Association: food insecurity in the United States. Journal of the American Dietetic Association 110, 1368–1377. [DOI] [PubMed] [Google Scholar]
- Barcellos S.H., Carvalho L.S. & Lleras‐Muney A. (2014) Child gender and parental investments in India: are boys and girls treated differently? American Economic Journal: Applied Economics 6, 157–189. [DOI] [PMC free article] [PubMed] [Google Scholar]
- Baxter S.D., Hitchcock D.B., Guinn C.H., Vaadi K.K., Puryear M.P., Royer J.A. et al (2014) A validation study concerning the effects of interview content, retention interval, and grade on children's recall accuracy for dietary intake and/or physical activity. The Journal of the Academy of Nutrition and Dietetics 114, 1902–1914. [DOI] [PMC free article] [PubMed] [Google Scholar]
- Bernal J. (2010) Inseguridad alimentaria y hambre en niños: diseño y validación de instrumento para su estudio. Dissertation. Universidad Simón Bolívar: Caracas.
- Bernal J. & Lorenzana P. (2007) La Escala de Seguridad Alimentaria en Hogares Aplicada a Adolescentes en Caracas: una medida valida y confiable. Agroalimentaria 24, 47–54. [Google Scholar]
- Bernal J., Frongillo E.A., Herrera H.A. & Rivera J.A. (2012) Children live, feel, and respond to experiences of food insecurity that compromise their development and weight status in peri‐urban Venezuela. Journal of Nutrition 142, 1343–1349. [DOI] [PubMed] [Google Scholar]
- Bernal J., Frongillo E.A., Herrera H.A. & Rivera J.A. (2014) Food insecurity in children but not in their mothers is associated with altered activities, school absenteeism, and stunting. Journal of Nutrition 144, 1619–1626. [DOI] [PubMed] [Google Scholar]
- Bhattacharya J., Currie J. & Haider S. (2004) Poverty, food insecurity, and nutritional outcomes in children and adults. Journal of Health Economic 23, 839–862. [DOI] [PubMed] [Google Scholar]
- Buttha Z., Ahmed T., Black R.E., Cousens S., Dewey K., Giugliani E. et al (2008) What works? Interventions for maternal and child undernutrition and survival. Lancet 371, 417–440. [DOI] [PubMed] [Google Scholar]
- Casey P.H., Goolsby S., Berkowitz C., Frank D., Cook J., Cutts D. et al (2004) Maternal depression, changing public assistance, food security, and child health status. Pediatrics 113, 298–304. [DOI] [PubMed] [Google Scholar]
- Casey P.H., Szeto K.L., Robbins J.M., Stuff J.E., Connell C., Gossett J.M. et al (2005) Child health‐related quality of life and household food security. Archives of Pediatrics Adolescent Medicine 159, 51–56. [DOI] [PubMed] [Google Scholar]
- Champagne C., Casey P.H., Connell C.L., Stuff J., Gossett J., Harsha D. et al (2007) Poverty and food intake in rural America: diet quality is lower in food insecure adults in the Mississippi Delta. Journal of the American Dietetic Association 107, 1886–1894. [DOI] [PubMed] [Google Scholar]
- Connell C.L., Nord M., Lofton K. & Yadrick K. (2004) Food security of older children can be assessed using a standardized survey instrument. The Journal of Nutrition 134, 2566–2572. [DOI] [PubMed] [Google Scholar]
- Connell C.L., Lofton K.L., Yadrick K. & Rehner T.A. (2005) Children's experiences of food insecurity can assist in understanding its effects on their well‐being. The Journal of Nutrition 135, 1683–1690. [DOI] [PubMed] [Google Scholar]
- Del Real S., Páez M.C., Solano L. & Fajardo Z. (2002) Consumo de harina de maíz precocida y su aporte de hierro y vitamina A en preescolares de bajos recursos económicos. Archivos Latinoamericanos de Nutrición 52, 274–281. [PubMed] [Google Scholar]
- Dharod J.M., Croom J.E. & Sady C.G. (2013) Food insecurity: its relationship to dietary intake and body weight among Somali refugee women in the United States. Journal of Nutrition Education and Behavior 45, 47–53. [DOI] [PubMed] [Google Scholar]
- Fram M.S., Frongillo E.A., Jones S.J., Williams R.C., Burke M.P., DeLoach K.P. et al (2011) Children are aware of FI and take responsibility for managing food resources. The Journal of Nutrition 141, 1114–1119. [DOI] [PubMed] [Google Scholar]
- Fram M.S., Frongillo E.A., Draper C. & Fishbein E. (2013) Development and validation of a child report assessment of child FI and comparison to parent report assessment. Journal of Hunger & Environmental Nutrition 8, 128–145. [Google Scholar]
- Fram M.S., Ritchie L.D., Rosen N. & Frongillo E.A. (2015) Child experience of food insecurity is associated with child diet and physical activity. The Journal of Nutrition 145, 499–504. [DOI] [PubMed] [Google Scholar]
- Frongillo E.A. & Bégin F. (1993) Gender bias in food intake favors male preschool Guatemalan children. The Journal of Nutrition 123, 189–196. [DOI] [PubMed] [Google Scholar]
- Frongillo E.A., Nanama S. & Wolfe W.S. (2004) Technical Guide to Developing a Direct, Experience‐Based Measurement Tool for Household Food Insecurity. Food and Nutrition Technical Assistance. Academy for Educational Development: Washington, DC. [Google Scholar]
- García‐Casal M.N. & Layrisse M. (2002) Iron fortification of flours in Venezuela. Nutrition Reviews 60, S26–S29. [DOI] [PubMed] [Google Scholar]
- Ghattas H., Barbour J.M., Nord M., Zurayk R. & Sahyoun N.R. (2013) Household food security is associated with agricultural livelihoods and diet quality in a marginalized community of rural Bedouins in Lebanon. The Journal of Nutrition 143, 1666–1671. [DOI] [PubMed] [Google Scholar]
- Gibson R.S. (2005) Principles of Nutritional Assessment, 2nd edn Oxford University Press: Oxford. [Google Scholar]
- Greer F.R. & Krebs N.F. (2006) Optimizing bone health and calcium intakes of infants, children and adolescents. Pediatrics 117, 578–586. [DOI] [PubMed] [Google Scholar]
- Hendra J., Fitzgerald I. & Seymour D. (2013) Towards a new transformative development agenda: the role of men and boys in achieving gender equality. Journal of International Affairs 67, 105–122. [Google Scholar]
- Hernández R., Herrera H., Pérez A. & Bernal J. (2011) Estado nutricional y seguridad alimentaria del hogar en niños y jóvenes de zonas suburbanas de Caracas. Anales Venezolanos de Nutrición 24, 21–26. [Google Scholar]
- Huet C., Rosol R. & Egeland G.M. (2012) The prevalence of food insecurity is high and the diet quality poor in Inuit communities. The Journal of Nutrition 142, 541–547. [DOI] [PubMed] [Google Scholar]
- Instituto Nacional de Estadística (2009) Encuesta de seguimiento al consumo de alimentos. Caracas, 2009–2011. Available at: http://www.ine.gov.ve/index.php?option=com_content&id=244&Itemid=38;tmpl=component/ (Accessed 6 March 2014).
- Instituto Nacional de Estadística (2011) Indicadores vitales. Available at: http://www.ine.gov.ve/documentos/Boletines_Electronicos/Estadisticas_Demograficas/Estadisticas_Vitales/pdf/20112007.pdf (Accessed 4 March 2014).
- Jyoti D., Frongillo E.A. & Jones S. (2005) Food insecurity affects school children's academic performance, weight gain, and social skills. The Journal of Nutrition 135, 2831–2839. [DOI] [PubMed] [Google Scholar]
- Keita A.D., Casazza K., Thomas O. & Fernandez J.R. (2009) Neighborhood‐level disadvantage is associated with reduced dietary quality in children. Journal of the American Dietetic Association 109, 1612–1616. [DOI] [PMC free article] [PubMed] [Google Scholar]
- Kendall A., Olson C.M. & Frongillo E.A. Jr (1995) Validation of the Radimer/Cornell measures of hunger and food insecurity. The Journal of Nutrition 125, 2793–2801. [DOI] [PubMed] [Google Scholar]
- Kendall A., Olson C.M. & Frongillo E.A. Jr (1996) Relationship of hunger and food insecurity to food availability and consumption. Journal of the American Dietetic Association 96, 1019–1024. [DOI] [PubMed] [Google Scholar]
- Kirkpatrick S.I. & Tarasuk V. (2008) Food insecurity is associated with nutrient inadequacies among Canadian adults and adolescents. The Journal of Nutrition 138, 604–612. [DOI] [PubMed] [Google Scholar]
- Kuku O., Gundersen C. & Garaksy S. (2011) Differences in food insecurity between adults and children in Zimbabwe. Food Policy 36, 311–317. [Google Scholar]
- Landaeta‐Jiménez M., Aliaga C., Sifontes Y., Herrera M., Candela Y., Delgado A. et al (2012) El derecho a la alimentación en Venezuela. Anales Venezolanos de Nutrición 25, 73–84. [Google Scholar]
- Lazarou C. & Newby P.K. (2011) Use of dietary indexes among children in developed countries. Advances in Nutrition 2, 295–303. [DOI] [PMC free article] [PubMed] [Google Scholar]
- Lee J.S., Kim H.Y., Choi Y.S., Kwak T.K., Chung H.R., Kwon S. et al (2011) Comparison of perception and practice levels of dietary life in elementary school children according to gender and obesity status. Korean Journal of Nutrition 44, 527–536. [Google Scholar]
- López‐Sayers M., Bernal J. & López M. (2015) Dietary potential renal load in Venezuelan children. Nutrición Hospitalaria 31 (5), 2057–2064. [DOI] [PubMed] [Google Scholar]
- Lopez M., Bernal J. & Lopez M. (2012) Carga acida potencial renal de la dieta en niños de 2 a 6 años. Archivos Venezolanos de Pediatría y Puericultura 65, 68–74. [Google Scholar]
- Lorenzana P. & Sanjur D. (1999) Abbreviated measures of food sufficiency validly estimate the food security level of poor households: measuring household food security. The Journal of Nutrition 129, 687–692. [DOI] [PubMed] [Google Scholar]
- Ministerio de Salud y Desarrollo Social, Instituto Nacional de Nutrición (1999) Tabla de Composición de Alimentos para uso práctico. Serie cuadernos azules: Caracas. [Google Scholar]
- Ministerio de Salud y Desarrollo Social, Instituto Nacional de Nutrición (2000) Valores de referencia de energía y nutrientes para la población venezolana. Serie de cuadernos azules: Caracas. [Google Scholar]
- Mohamadpour M., Sharif Z.M. & Keysami M.A. (2012) Food insecurity, health and nutritional status among sample of palm‐plantation households in Malaysia. Journal of Health, Population, and Nutrition 30, 291–302. [DOI] [PMC free article] [PubMed] [Google Scholar]
- Moreno‐Tamayo K., Gonzalez de Cossío T., Flores‐Aldana M., Rodriguez‐Ramirez S. & Ortiz‐Hernandez L. (2011) Does food insecurity compromise maternal dietary zinc or energy intake in favor of her child, in rural poor Mexican households? Salud Pública de México 53, 299–311. [DOI] [PubMed] [Google Scholar]
- Moubarac J.C., Parra D.C., Cannon G. & Monteiro C.A. (2014) Food classification systems based on food processing: significance and implications for policies and actions: a systematic literature review and assessment. Current Obesity Report 3, 256–272. [DOI] [PubMed] [Google Scholar]
- Nalty C.C., Sharkey J.R. & Dean W.R. (2013) Children's reporting of food insecurity in predominately food insecure households in Texas border colonias. Nutrition Journal 12, 15. [DOI] [PMC free article] [PubMed] [Google Scholar]
- Nanama S. & Frongillo E.A. (2012) Altered social cohesion and adverse psychological experiences with chronic food insecurity in the non‐market economy and complex households of Burkina Faso. Social Science and Medicine 74, 444–451. [DOI] [PubMed] [Google Scholar]
- National Research Council (2006) Food Insecurity and Hunger in the United States: An Assessment of the Measure. Panel to Review the U.S. Department of Agriculture's Measurement of Food Insecurity and Hunger. The National Academies Press: Washington, DC. [Google Scholar]
- Nord M. (2009) Food Insecurity in Children. Prevalence, Severity, and Household Characteristics. USDA Research Service Economic Information Bulletin 56: Washington, DC. [Google Scholar]
- Orlet Fisher J., Mitchell D.C., Smiciklas‐Wright H. & Lipps Birch L. (2000) Maternal milk consumption predicts the tradeoff between milk and soft drink in young girls diets. The Journal of Nutrition 131, 246–250. [DOI] [PMC free article] [PubMed] [Google Scholar]
- Prentice A.M. (2014) Dairy products in global public health. American Journal of Clinical Nutrition 99, 1212S–1216S. [DOI] [PubMed] [Google Scholar]
- Rosas L.G., Harley K., Fernald L.C., Guendelman S., Mejia F., Neufeld L.M. et al (2009) Dietary associations of household food insecurity among children of Mexican descent: results of a binational study. Journal of the American Dietetic Association 109, 2001–2009. [DOI] [PMC free article] [PubMed] [Google Scholar]
- Rose D. & Oliveira V. (1997) Nutrient intakes of individuals from food‐insufficient households in the United States. American Journal of Public Health 87, 1956–1961. [DOI] [PMC free article] [PubMed] [Google Scholar]
- Rothausen B.W., Matthiessen J., Hoppe C., Brockhoff P.B., Andersen L.F. & Tetens I. (2012) Differences in Danish children's diet quality on weekdays vs. weekend days. Public Health Nutrition 15, 1653–1660. [DOI] [PubMed] [Google Scholar]
- Saha K.K., Frongillo E.A., Alam D.S., Arifeen S.E., Persson L.A. & Rasmussen K.M. (2008) Appropriate infant feeding practices result in better growth of infants and young children in rural Bangladesh. American Journal of Clinical Nutrition 87, 1852–1859. [DOI] [PMC free article] [PubMed] [Google Scholar]
- Saha K.K., Tofail F., Frongillo E.A., Rasmussen K.M., Arifeen S.E., Persson L.A. et al (2010) Household food security is associated with early childhood language development: results from a longitudinal study in rural Bangladesh. Child: Care, Health and Development 36, 309–316. [DOI] [PubMed] [Google Scholar]
- Sharkey J., Dean W. & Nalty C.C. (2013) Child hunger and the protective effects of supplemental nutrition assistance program (SNAP) and alternative food sources among Mexican‐origin families in Texas border colonias. BMC Pediatrics 13, 143. [DOI] [PMC free article] [PubMed] [Google Scholar]
- Sharkey J.R., Nalty C., Johnson C.M. & Dean W.R. (2012) Children's very low food security is associated with increased dietary intakes in energy, fat, and added sugar among Mexican‐origin children (6–11 y) in Texas border colonias. BMC Pediatrics 12, 16. [DOI] [PMC free article] [PubMed] [Google Scholar]
- SPSS (2012) 21.0 Statistical Packaged for Social Sciences for Windows®. SPSS.: Chicago, IL. [Google Scholar]
- Sulaiman N., Shariff Z.M., Jalil R.A., Taib M.N., Kandiah M. & Samah A.A. (2011) Validation of the Malaysian coping strategy instrument to measure household food insecurity in Kelantan, Malaysia. Food and Nutrition Bulletin 32, 354–364. [DOI] [PubMed] [Google Scholar]
- Tarasuk V. & Beaton G. (1999) Women's dietary intakes in the context of household food insecurity. The Journal of Nutrition 129, 672–679. [DOI] [PubMed] [Google Scholar]
- Torres R., Santos E., Orraca L., Elias A. & Palacios C. (2014) Diet quality, social determinants, and weight status in Puerto Rican children aged 12 years. Journal of the Academy of Nutrition and Dietetics 114, 1230–1235. [DOI] [PMC free article] [PubMed] [Google Scholar]
- USDA (2013) Key Statistics & Graphics. Available at: http://www.ers.usda.gov/topics/food-nutrition-assistance/food-security-in-the-us/key-statistics-graphics.aspx (Accessed 30 December 2014).
- Utter J., Denny S., Robinson E., Teevale T., Crengle S., Ameratunga S. et al (2012) Food security concerns among young people: impact on eating behaviors and weight status. Journal of Hunger & Environmental Nutrition 7, 101–111. [Google Scholar]
- Whitaker R.C., Phillips S.M. & Orzol S.M. (2006) Food insecurity and the risks of depression and anxiety in mothers and behavior problems in their preschool‐aged children. Pediatrics 118, 859–868. [DOI] [PubMed] [Google Scholar]
- World Food Program (2014) Hunger. Who Are the Hunger? Available at: http://www.wfp.org/hunger/who-are (Accessed 3 March 2014).
- World Health Organization (2014) Micronutrient Deficiencies. Iron Deficiency Anaemia. Available at: http://www.who.int/nutrition/topics/ida/en/ (Accessed 6 June 2014).