

Abstract
The Food and Drug Administration (FDA) uses a p < 0.05 null‐hypothesis significance testing framework to evaluate “substantial evidence” for drug efficacy. This framework only allows dichotomous conclusions and does not quantify the strength of evidence supporting efficacy. The efficacy of FDA‐approved antidepressants for the treatment of anxiety disorders was re‐evaluated in a Bayesian framework that quantifies the strength of the evidence. Data from 58 double‐blind placebo‐controlled trials were retrieved from the FDA for the second‐generation antidepressants for the treatment of anxiety disorders. Bayes factors (BFs) were calculated for all treatment arms compared to placebo and were compared with the corresponding p‐values and the FDA conclusion categories. BFs ranged from 0.07 to 131,400, indicating a range of no support of evidence to strong evidence for the efficacy. Results also indicate a varying strength of evidence between the trials with p < 0.05. In sum, there were large differences in BFs across trials. Among trials providing “substantial evidence” according to the FDA, only 27 out of 59 dose groups obtained strong support for efficacy according to the typically used cutoff of BF ≥ 20. The Bayesian framework can provide valuable information on the strength of the evidence for drug efficacy. Copyright © 2016 John Wiley & Sons, Ltd.
Keywords: second‐generation antidepressants, FDA, Bayesian statistics, Bayes factor, significance testing
Introduction
The Food and Drug Administration (FDA) is responsible for evaluating new drug applications in the United States. Whenever a pharmaceutical company wants to market a new drug, trials must be registered with the FDA before these are carried out. After completion of a trial, the FDA reviews the results according to their guidelines (US Food and Drug Administration, 1998). Since the “Drug Efficacy Amendment” in 1962, drug manufacturers have been required to present “substantial evidence” of drug effectiveness, i.e. the FDA requires “at least two adequate and well‐controlled studies, each convincing on its own, to establish effectiveness” (US Food and Drug Administration, 1998). The term “effectiveness” or “efficacy” (i.e. the strength of evidence) refers to the decision whether there is a treatment effect, made on the basis of results from randomized controlled clinical trials and other data. To evaluate efficacy, the FDA uses a null‐hypothesis significance testing (NHST) framework. A trial is deemed positive when the drug has a statistically significant effect (e.g. p < 0.05) on the primary endpoint(s) compared to placebo. However, the NHST framework, which is based on frequentist statistics, is associated with a number of problems (Goodman, 1999a; Ioannidis, 2005a; Wagenmakers et al., 2011; Grendár, 2012; Simonsohn et al., 2014). First, the p‐value is prone to misinterpretation (e.g. “p‐values provide measures of evidence”, or “a p‐value of 0.05 means that the null hypothesis has a probability of only 5% of being correct”), leading researchers to overestimate the evidence against the null‐hypothesis (Edwards et al., 1963; Johnson, 2013). Second, the criterion p < 0.05 induces a binary “all or none” mind set since p‐values are used as a reference to either accept or reject the null‐hypothesis. For example, even when two drugs may both have p < 0.05, the evidence for the efficacy can differ massively. Consequently, the current state of affairs harbors the following dangers: (a) the FDA may approve a drug whose efficacy is only minimally supported by the data; (b) the evidence in favor of efficacy cannot be assessed on a gradual scale.
Bayes factors (BFs), which stem from Bayesian statistics, can be used to alleviate these concerns (Goodman, 1999a, 1999b; Lavine and Schervish, 1999). Although BFs stem from a different framework than p‐values, it does not necessarily mean that the conclusions with respect to a trial will be different (Wetzels et al., 2011). However, Bayesian statistics have considerable advantages over p‐values and the NHST framework. For instance, a BF grades the degree to which observed data are more likely under the alternative hypothesis (H1) than under the null hypothesis (H0):
This ratio quantifies the extent to which data support H1 over H0. If BF10 is larger than one, H1 has stronger support than H0 and if BF10 is smaller than one, H0 has stronger support than H1. The larger the ratio, the stronger the data favors H1 over H0. BFs can be especially useful to compare drug efficacy. Suppose we define two hypotheses: there is no effect of the drug (H0) and there is a positive effect of the drug (H1) and obtain BF10 = 10 and BF10 = 100 for Drug A and Drug B, respectively from two independent trials. These BFs are directly comparable when these drugs are compared to the same control, i.e. placebo. We can conclude that the data support the efficacy of Drug B 10 times more than Drug A. Such a direct comparison between trials is impossible with p‐values (Goodman, 1999a, Grendár, 2012; Johnson, 2013).
In 2010, the FDA revised guidance for the use of Bayesian statistics in medical device clinical trials (US Food and Drug Administration, 2010). However, guidelines for human drugs and biological products have not changed since 1998 and rely on the NHST framework (US Food and Drug Administration, 1998). The addition of BFs to determine the strength of the evidence could be a valuable contribution to the medical knowledge base, which to date has been based almost exclusively on the NHST framework (Goodman, 1999b). This contribution may be particularly welcome in fields for which evidence of efficacy of interventions is less conclusive, such as psychiatry (Ioannidis, 2005b). For example, the effect of pharmacological treatments for psychiatric disorders, including second‐generation antidepressants, has been subject to ongoing debate (Turner et al., 2008; Kirsch et al., 2008; Eyding et al., 2010; Roest et al., 2015).
The present study was conducted to illustrate the potential of BFs to document the evidence base of existing pharmacological treatments in the medical field. As a proof of principle, we chose the application of second‐generation antidepressants for anxiety, where the evidence base is rather uncertain but the prevalence and burden of disease is high.
Materials and methods
Data from FDA reviews
We focused on all FDA‐approved selective serotonin reuptake inhibitors (SSRIs) and serotonin norepinephrine reuptake inhibitors (SNRIs) for the following disorders: generalized anxiety disorder (GAD), panic disorder (PD), social anxiety disorder (SAD), post‐traumatic stress disorder (PTSD), and obsessive compulsive disorder (OCD). In total, seven SSRIs (paroxetine, paroxetine controlled release [CR], sertraline, fluoxetine, fluvoxamine, fluvoxamine CR, and escitalopram), and two SNRIs (venlafaxine extended release [ER] and duloxetine) were examined. The FDA reviews were retrieved from the FDA's website or, when these were not available, were requested from the FDA's Freedom of Information Office (Turner, 2013). Fifty‐nine short‐term phase 2/3 clinical trials, which were registered at the FDA, were previously identified and the data for these trials were extracted from the reviews (Roest et al., 2015; de Vries et al., 2016). Some trials used a fixed‐dose design, meaning drug dosages were set before the trial. Other trials used a flexible‐dose design, where drug dosage could be increased over time. In the current study, for fixed‐dose trials, each dose group was re‐evaluated separately, while for flexible‐dose trials, the dose range was evaluated as a single entity. Trial numbers are shown in Table 1. (Henceforth, they are shown in braces.) Efficacy data comparing the drug with a placebo was extracted for the primary endpoint of the trial (Roest et al., 2015). For trials with multiple primary endpoints, we chose the endpoint that was most consistent with other trials for the same disorder. Specifically, data on Hamilton Anxiety Rating Scale (HAM‐A; Hamilton, 1959), the Clinician‐Administered PTSD Scale (CAPS‐2; Blake et al., 1995; Weathers et al., 2001), and the Yale–Brown Obsessive Compulsive Scale (Y‐BOCS; Goodman et al., 1989) were extracted as the primary endpoint for trials of GAD, PTSD and OCD, respectively. All PD trials set “reduction in the number of panic attacks” as primary outcome, although different measurement approaches were taken. For SAD trials, the Liebowitz Social Anxiety Scale (LSAS; Liebowitz, 1987) was used for all trials except for {STL‐NY‐94‐004}, which used the Brief Social Phobia Scale (BSPS; Davidson et al., 1997) as a primary endpoint. SAD trial {95‐003} was excluded from the current analysis because test statistics were not presented in the FDA review, leaving 58 trials in the current study.
Table 1.
Summary of the analyzed FDA trial numbers, p‐values and Bayes factors (BF10)
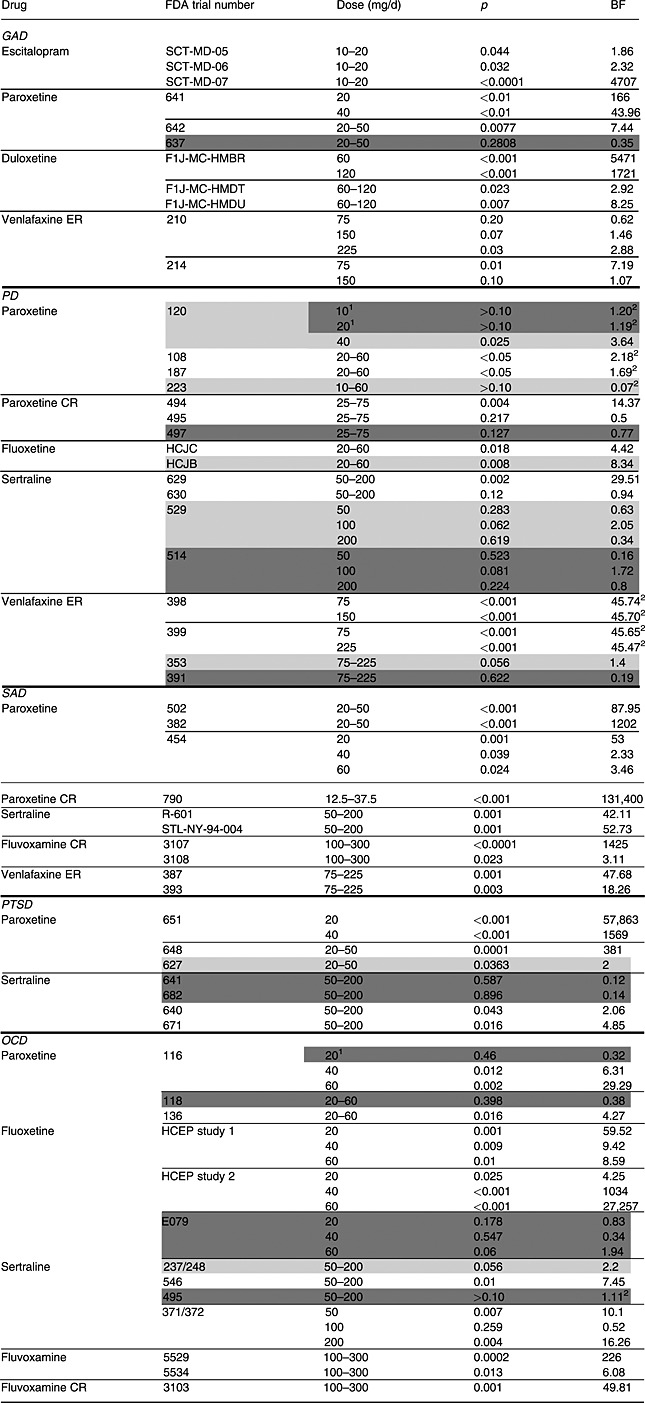
Note: GAD, generalized anxiety disorder; PD, panic disorder; SAD, social anxiety disorder; PTSD, post‐traumatic stress disorder; OCD, obsessive compulsive disorder. Trial numbers shaded in lighter and darker colors belong to the “questionable” and the “negative” category, respectively. The rest of the trials are in the “positive” category. However, when the FDA did not approve the specific dose level, those dose levels were shaded in darker colors regardless of the overall conclusion of the trial.
Indicates dose level not approved by the FDA.
Indicates Bayes factors obtained by replacing inequality signs of P‐values by equals.
The FDA's decisions were classified into three categories (Roest et al., 2015): “positive” (clearly supporting efficacy), “questionable” (neither clearly positive nor clearly negative), and “negative” (clear lack of support for efficacy). For fixed‐dose trials with multiple dose levels, the FDA's overall decision on the trial was extracted (Roest et al., 2015). In contrast to other studies (Turner et al., 2008; Turner et al., 2012; Roest et al., 2015), we included data for unapproved dosages (paroxetine 20 mg for OCD and paroxetine 10 and 20 mg for PD) in this study because our focus was to re‐assess the efficacy of the drugs in question. These specific dose groups were included in the “negative” category since the FDA did not approve these dosages (see footnote 1 in Table 1). Trials characterized as “marginally” or “borderline positive” were included in the “questionable” category. These trials generally had p > 0.05 for one or more of the primary endpoints (indicating that there was no clear evidence of treatment efficacy, according to the FDA; US Food and Drug Administration, 1998), but were considered supportive of other positive trials due to significant findings on secondary endpoints (Turner et al., 2008; Turner et al., 2012; Roest et al., 2015). In concordance with the FDA strategy, the “questionable” category also included “failed” trials in which neither the study drug nor the active comparator demonstrated statistical superiority to placebo (Turner et al., 2008; Turner et al., 2012; Roest et al., 2015). The analyzed data are provided as Supplementary Material.
Statistical analysis
Test statistics
The t‐statistics were required to calculate the associated BFs. Therefore, the t‐statistics were first calculated by using the following three approaches (see Roest et al., 2015): (a) when a precise p‐value was available, the combined sample size and the Microsoft Excel's TINV function was used, (b) when a p‐value was reported to lie in a specific range (i.e. p > 0.10 or p < 0.05), other statistics, mainly standard error and 95% confidence intervals around the mean difference, were used, and (c) when a p‐value was reported to lie in a specific range and neither earlier‐mentioned statistics were available, the p‐value was set at the value that was reported (i.e. p = 0.10 or p = 0.05) and the Microsoft Excel's TINV function was used (see footnote 2 in Table 1). When placebo performed better than the study drug, the t‐statistic was multiplied by −1.
One‐sided Jeffreys–Zellner–Siow Bayes factors (JZS BFs)
BFs were calculated from aforementioned t‐statistics and the overall sample sizes of the drug and placebo groups by using the BayesFactor package in R (Morey and Rouder, 2015). In our study default, Jeffreys–Zellner–Siow Bayes factors (JZS BFs; Rouder et al., 2009) were calculated. The JZS prior distribution is a Cauchy prior distribution on the effect size. This prior distribution has a mode at zero and a scale of r = (or 0.707, see Sensitivity analysis section for more details). This prior distribution has favorable theoretical properties, such as independence of the measurement scale of the dependent variable (Rouder et al., 2009; Rouder and Morey, 2011; Morey et al., 2015). The effects of the drugs were expected to be either zero or positive and not negative, since it is unethical to conduct a randomized clinical trial without theoretical rationale and empirical justification for the drug effect, and since marketing approval was already obtained for these drugs in the treatment of depression. Thus, one‐sided BFs were calculated instead of two‐sided. All BFs were calculated by using a default prior scale, i.e. r = (see details on the scale of the prior distribution in Morey et al., 2015). The one‐sided JZS BFs were considered with respect to their association with p‐values and the FDA conclusion categories.
Meta‐analysis
Fixed‐effects meta‐analytic BFs were calculated for replicated experiments; fixed‐dose trials with the same dosage levels, target disorder, and primary outcome were combined. Three, four, and two meta‐analytic BFs were calculated for OCD, PD, and GAD, respectively. Meta‐analytic BFs were calculated by the BayesFactor package version 0.9.12‐2 (Morey and Rouder, 2015).
Sensitivity analysis
To determine how one‐sided JZS BFs differ with different scales of the prior distribution, sensitivity analyses were conducted. In the sensitivity analyses, BFs were calculated with the scales between and (i.e. 0.24 and 2.12, respectively). When the scale is set to , the prior distribution has a high peak around score zero, which indicates more “skeptical” prior belief and reflects a more modest expectation about the size of the treatment benefits compared to the “medium scale” r = (0.707). Conversely, when the scale is set to , the prior distribution reflects “optimistic” expectation about the size of the treatment benefits. All statistical analyses were performed using R version 3.2.3 and the code for the analyses is provided as Supplementary Material.
Results
One‐sided JZS BFs
p‐Values and BFs
Table 1 shows the results of the one‐sided JZS BFs and extracted p‐values for 58 trials. Table 1 shows a large variance of BFs (0.07 to 131,400), which indicates diverse strength of evidence among the trials. To illustrate the relationships between BFs and p‐values for each of the earlier‐mentioned three categories of the FDA decisions, logarithms of BFs and p‐values are plotted in Figure 1. Figure 1 shows that the relationship between p‐values and the BFs was similar for SSRIs and SNRIs for all disorders; the lower the p‐value, the higher the BF. Note that when a p‐value was given only as a range (see footnote 2 in Table 1), they were set equal to the upper or lower bound of the reported range, which is the reason for the four peaks (p = 0.0001, 0.001, 0.05, 0.10) in Figure 1 (left).
Figure 1.
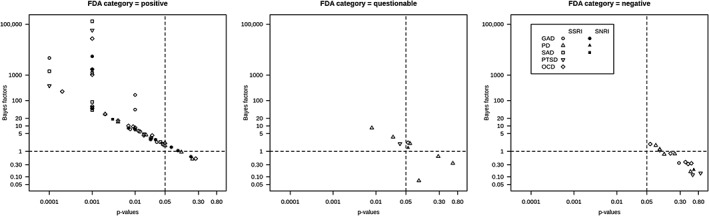
Bayes factors (BFs) for dose groups with p‐values for each of the FDA's regulatory decisions categories.
FDA conclusion categories and BFs
Figure 1 shows that all dose groups which had p < 0.05 attained BFs larger than one, indicating support in favor of the existence of a treatment effect (H1). Most of the drugs in the “positive” category had BFs larger than one, but these ranged from 0.50 {495} to 131,400 {790}. Since a BF equaling one indicates no support for either hypothesis, it may appear worrisome that dose groups with BFs around one were included in the “positive” category. It is remarkable that only 27 out of 59 dose groups (46%) in this category had BFs larger than 20, which can be considered as a strong evidence for efficacy (Kass and Raftery, 1995; Johnson, 2013). Moreover, we identified four BFs smaller than one (i.e. stronger support for a lack of efficacy) in the “positive” category: venlafaxine ER 75 mg for GAD {210}, paroxetine CR 25–75 mg for PD {495}, sertraline 50–200 mg for PD {630} and sertraline 100 mg for OCD {371/372} (Table 1). For these dose groups, the corresponding p‐values were non‐significant as well. The FDA reviews for these trials were re‐inspected and summarized later. First, venlafaxine ER 75 mg for GAD {210} was considered “positive” by the FDA since all reviewers agreed that the trial offered compelling evidence for the other doses included in the trial and this dose performed better than a higher dose of venlafaxine ER in another trial {214}. Also, sertraline 100 mg for OCD {371/372} was deemed positive since results for other dose levels of sertraline (50 mg and 200 mg) were statistically significant in this trial. Finally, both paroxetine CR 25–75 mg {495} and sertraline 50–200 mg {630} for PD were considered positive since analyses of observed cases were statistically significant for the primary endpoint {495} and/or significant results were obtained for other (secondary) endpoints {495, 630}. Basically, when BFs were smaller than one within the FDA's “positive” category, the reason was either because other analyses or endpoints than the primary were emphasized or because the fixed‐dose trial was evaluated as a whole.
In the “questionable” category, BFs ranged from 0.07 {223} to 8.34 {HCJB}. Predictably, the BFs in this category indicate that there is not enough evidence to conclude that the drugs were efficacious in these trials.
For the “negative” category, BFs varied from 0.12 {641} to 1.94 {E079}. Expectedly, these BFs indicated no support for drug efficacy in these trials.
Meta‐analytic BFs
The meta‐analytic BFs are shown in Table 2. The meta‐analytic BFs for all dose groups of fluoxetine for OCD indicated strong support for efficacy (meta‐analytic BFs 431 to 129,880), although one out of three trials of fluoxetine with OCD was concluded as “negative” trial by the FDA. For PD, meta‐analytic BFs indicated that venlafaxine ER 75 mg has most evidence in favor of efficacy, even compared with other tested drugs in Table 1. For GAD, venlafaxine ER did not attain stronger evidence than duloxetine 60 mg, even by combining two trials (see Table 1).
Table 2.
Meta‐analytic Bayes factors (BF)
| Drug | FDA study numbers of combined trials | Disorder | Meta‐analytic Bayes factor |
|---|---|---|---|
| Fluoxetine 20 mg | HCEP study 1, HCEP study 2, E079 | OCD | 431 |
| Fluoxetine 40 mg | HCEP study 1, HCEP study 2, E079 | OCD | 679 |
| Fluoxetine 60 mg | HCEP study 1, HCEP study 2, E079 | OCD | 129,880 |
| Sertraline 50 mg | 514, 529 | PD | 0.23 |
| Sertraline 100 mg | 514, 529 | PD | 7.26 |
| Sertraline 200 mg | 514, 529 | PD | 0.57 |
| Venlafaxine ER 75 mg | 398, 399 | PD | 7,399 |
| Venlafaxine ER 75 mg | 210, 214 | GAD | 8.48 |
| Venlafaxine ER 150 mg | 210, 214 | GAD | 4.15 |
Sensitivity analysis
A part of the sensitivity analyses for GAD are illustrated in Figure 2. Logarithms of a scale selection and BFs were plotted in Figure 2. Figure 2 indicates that the conclusions drawn from the BFs did not differ based on scale selection of the prior distribution when the BF obtained with a “medium scale” was either small or large (Figure 2, left and right). Conversely, when a BF was “marginal” (i.e. BF around one) with the “medium scale” for the prior, the conclusion changed according to the selection of the prior distributions (Figure 2, middle). This tendency applied to all (all sensitivity analyses are provided in the Supplementary Material).
Figure 2.
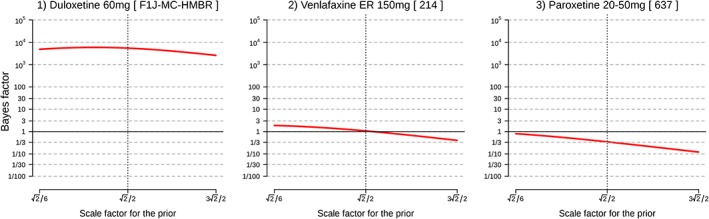
Examples of sensitivity analyses for generalized anxiety disorder (GAD). Note: FDA study numbers are shown in square brackets.
Discussion
We re‐evaluated the efficacy of second‐generation antidepressants used for the treatment of anxiety disorders in a Bayesian framework. First, we found that evidence for antidepressants efficacy within the FDA's “positive” category was often only modest. Second, it was demonstrated how one‐sided BFs can be used to quantify the evidence that the data provide for the efficacy of a particular drug, which allows us to evaluate the statistical evidence coming from a trial in a continuous manner. Third, meta‐analytic BFs showed that combining multiple trials increased BFs toward stronger support for treatment efficacy when those trials were consistently positive under the NHST framework. However, when the individual trials showed inconsistent results under the NHST framework, meta‐analytic BFs were lower than the individual BFs obtained for the positive trials.
The results of our study highlight some of the advantages of BFs. First, in contrast to p‐values, BFs allow researchers to separate evidence for absence from absence of evidence. For instance, a trial can give p = 0.15 but BF10 = 2, indicating some evidence in favor of H1; another trial can give p = 0.15 but BF10 = 1/8, indicating moderate evidence against H1. Clearly it is important to be able to distinguish between these scenarios. Second, BFs allow researchers to quantify evidence on a continuous scale, which is an antidote to the cliff effect (Rosenthal and Gaito, 1963), i.e. the tendency to believe that findings with p < 0.05 are quantitatively different from those with p > 0.05. Indeed, Figure 1 showed the linear relationship between p‐values and BFs (Johnson, 2013; Wetzels et al., 2011), indicating that conclusions based on p‐values are not necessarily in conflict with those based on BFs. It is possible to set more stringent p‐values, e.g. p = 0.001, which could be another option to secure “strong” efficacy. However, the problem remains: variation of the strength of the evidence cannot be quantified by p‐values. Values of p < 0.001 can correspond to BF = 0.0001, 1 or 100,000. One may argue that the use of a p‐value as a measure of evidence has been criticized before and that confidence intervals (CIs) around an effect size should be used instead. Indeed, various journals require the reporting of CIs for the parameter estimates, but Morey et al. (2015) showed that CIs do not necessarily reflect the estimate precision and cannot be used as a measure for the quality or strength of evidence. A third advantage of the Bayesian framework is the possibility of comparing evidence for drug efficacy by simply comparing the BFs. For example, using BFs and meta‐analytic BFs, we can examine which drug has the highest level of evidence for the efficacy for a specific disorder. This could help clinicians to select a specific drug to start a treatment. Assuming that trials are comparable with respect to their experimental design and quality of measurement, Tables 1 and 2 showed that the data support the efficacy of duloxetine (60 mg), paroxetine CR (12.5–37.5 mg), paroxetine (20 mg), and fluoxetine (60 mg) the most for GAD, SAD, PTSD and OCD, respectively. For PD, venlafaxine ER (75 mg) was supported the most when we set “percentage of patients having zero full attacks”, which was the most widely used measurement, as a primary outcome. However, these conclusions should be interpreted with some caution. Several trials were not taken into account in this analysis since we only calculated meta‐analytic BFs for fixed‐dose trials. Moreover, this selection may be affected by differences in experimental designs and measurement errors. Furthermore, the assumption of all tested trials being comparable may not be realistic.
The earlier‐mentioned advantages of BFs can be expected since p‐values and BFs answer different questions. Values of p answer the question: “what is the probability of obtaining results that are at least as extreme as the observed results, assuming that the tested drug has no efficacy?”, while BFs answer the question: “how much stronger is the evidence that the tested drug has efficacy compared to the evidence that the tested drug has no efficacy?”. Therefore, the evidence from the BF is comparative, involving both H0 and H1, whereas the p‐values only consider H0. Moreover, BFs are calculated from the data we have obtained, so we can update our state of knowledge as we accumulate more data.
A typical criticism on Bayesian statistics, subjective selection of the prior distribution, was addressed by performing sensitivity analyses on the impact of the JZS prior scale to the obtained BFs. For our dataset, when the obtained BF with medium scale was larger than 20, the smallest BF was 13 for a larger prior scale (( . This indicates that the cutoff score of BF 20 as “significant” support of evidence may be too low for our study if we want to obtain “significant” support regardless of the prior scale. Additionally, sensitivity plots (see Supplementary Material) showed that conclusions drawn from the marginal BFs (BFs around one) can be affected by the selection of prior scale. For these trials, strong conclusions could not be attained from the analyzed data. Collecting more data or combining similar trials by meta‐analytic BF is required in these cases before it can be concluded that “significant” evidence was provided. However, it should be noted that although p‐values almost systematically become p < 0.05 with large sample sizes, BFs will generally show stronger support for either the presence or absence of a treatment effect (Kass and Raftery, 1995).
The current study has some specific limitations. The retrieved data were restricted to trials that were registered at the FDA and drugs that were ultimately approved by the FDA; trials that were conducted but not registered at the FDA, or registered trials examining drugs that were not approved by the FDA, were excluded from the analysis. This selection may have influenced our results. However, our results for the included drug‐indication combinations are not affected by publication bias (Turner et al., 2008; Roest et al., 2015) since we had access to all trials (both positive and negative) conducted in order to receive marketing approval for approved drugs. Another limitation is that we focused on evaluating the strength of the evidence for the efficacy and not on the effect sizes of antidepressants, which is of great interest for clinicians. As a future study, we suggest to evaluate the efficacy of antidepressants by estimating the effect sizes in a Bayesian framework as well, in order to further enhance the current knowledge of antidepressants: “how strong are the effect sizes and how strongly are they supported by the data?”
Conclusion
This study showed that the Bayesian framework can provide valuable information in addition to the NHST framework for research on the strength of evidence for the efficacy of antidepressants. Furthermore, though Bayesian statistics were previously difficult for computational reasons, since the arrival of faster computers and better software (such as R or JASP; Love et al., 2015), it is a worthwhile alternative statistical practice. We hope that future studies will adopt this framework in addition to the NHST framework when examining evidence for efficacy of other treatments.
Declaration of interest statement
The authors have no competing interests.
Supporting information
Supporting info item
Supporting info item
Supporting info item
Acknowledgments
The authors gratefully acknowledge the advice on the manuscript by Dr Eric H Turner. The current study was supported by a VICI grant (no: 91812607) received by Peter de Jonge from the Netherlands organization for Scientific research (NWO‐ZonMW).
Monden, R. , de Vos, S. , Morey, R. , Wagenmakers, E. ‐J. , de Jonge, P. , and Roest, A. M. (2016) Toward evidence‐based medical statistics: a Bayesian analysis of double‐blind placebo‐controlled antidepressant trials in the treatment of anxiety disorders. Int J Methods Psychiatr Res, 25: 299–308. doi: 10.1002/mpr.1507.
References
- Blake D.D., Weathers F.W., Nagy L.M., Kaloupek D.G., Gusman F.D., Charney D.S., Keane T.M. (1995) The development of a clinician‐administered PTSD scale. Journal of Traumatic Stress, 8(1), 75–90. [DOI] [PubMed] [Google Scholar]
- Davidson J.R., Miner C.M., De Veaugh‐Geiss J., Tupler L.A., Colket J.T., Potts N.L.S. (1997) The brief social phobia scale: a psychometric evaluation. Psychological Medicine, 27(1), 161–166. [DOI] [PubMed] [Google Scholar]
- De Vries Y.A., de Jonge P., van der Heuvel E., Turner E.H., Roest A.M. (2016) The British Journal of Psychiatry, 1–7. DOI: 10.1192/bjp.bp.115.173450 [DOI] [Google Scholar]
- Edwards W., Lindman H., Savage L.J. (1963) Bayesian statistical inference for psychological research. Psychological Review, 70(3), 193. [Google Scholar]
- Eyding D., Lelgemann M., Grouven U., Härter M., Kromp M., Kaiser T., Kerekes M.F., Gerken M., Wieseler B. (2010) Reboxetine for acute treatment of major depression: systematic review and meta‐analysis of published and unpublished placebo and selective serotonin reuptake inhibitor controlled trials. British Medical Journal, 341. [DOI] [PMC free article] [PubMed] [Google Scholar]
- Goodman S.N. (1999a) Toward evidence‐based medical statistics. 1: The P value fallacy. Annals of Internal Medicine, 130(12), 995–1004. [DOI] [PubMed] [Google Scholar]
- Goodman S.N. (1999b) Toward evidence‐based medical statistics. 2: The Bayes factor. Annals of Internal Medicine, 130(12), 1005–1013. [DOI] [PubMed] [Google Scholar]
- Goodman W.K., Price L.H., Rasmussen S.A., Mazure C., Fleischmann R.L., Hill C.L., Heninger G.R., Charney D.S. (1989) The Yale–Brown obsessive compulsive scale: I. Development, use, and reliability. Archives of General Psychiatry, 46(11), 1006–1011. [DOI] [PubMed] [Google Scholar]
- Grendár M. (2012) Is the p‐value a good measure of evidence? Asymptotic consistency criteria. Statistics & Probability Letters, 82(6), 1116–1119. [Google Scholar]
- Hamilton M.A.X. (1959) The assessment of anxiety states by rating. British Journal of Medical Psychology, 32(1), 50–55. [DOI] [PubMed] [Google Scholar]
- Ioannidis J.P. (2005a) Why most published research findings are false. Chance, 18(4), 40–47. [DOI] [PMC free article] [PubMed] [Google Scholar]
- Ioannidis J.P. (2005b) Contradicted and initially stronger effects in highly cited clinical research. Jama, 294(2), 218–228. [DOI] [PubMed] [Google Scholar]
- Johnson V.E. (2013) Revised standards for statistical evidence. Proceedings of the National Academy of Sciences, 110(48), 19313–19317. [DOI] [PMC free article] [PubMed] [Google Scholar]
- Kass R.E., Raftery A.E. (1995) Bayes factors. Journal of the American Statistical Association, 90(430), 773–795. [Google Scholar]
- Kirsch I., Deacon B.J., Huedo‐Medina T.B., Scoboria A., Moore T.J., Johnson B.T. (2008) Initial severity and antidepressant benefits: a meta‐analysis of data submitted to the Food and Drug Administration. PLoS Medicine, 5(2), e45. [DOI] [PMC free article] [PubMed] [Google Scholar]
- Lavine M., Schervish M.J. (1999) Bayes factors: what they are and what they are not. The American Statistician, 53(2), 119–122. [Google Scholar]
- Liebowitz M.R. (1987) Social Phobia, pp. 141–173, Basel: Karger Publishers. [Google Scholar]
- Love J., Selker R., Marsman M., Jamil T., Dropmann D., Verhagen A.J., Ly A., Gronau Q.F., Smira M., Epskamp S., Matzke D., Wild A., Rouder J.N., Morey R.D., Wagenmakers, E.‐J. (2015) JASP (Version 0.7)[Computer software].
- Morey R.D., Rouder J.N. (2015) BayesFactor. http://cran.r-project.org/web/packages/BayesFactor/BayesFactor.pdf
- Morey R.D., Hoekstra R., Rouder J.N., Lee M.D., Wagenmakers E.J. (2015) The fallacy of placing confidence in confidence intervals. Psychonomic Bulletin & Review, 1–21. [DOI] [PMC free article] [PubMed] [Google Scholar]
- Roest A.M., de Jonge P., Williams C.D., de Vries Y.A., Schoevers R.A., Turner E.H. (2015) Reporting bias in clinical trials investigating the efficacy of second‐generation antidepressants in the treatment of anxiety disorders: a report of 2 meta‐analyses. JAMA Psychiatry, 72(5), 500–510. [DOI] [PubMed] [Google Scholar]
- Rouder J.N., Speckman P.L., Sun D., Morey R.D., Iverson G. (2009) Bayesian t tests for accepting and rejecting the null hypothesis. Psychonomic Bulletin & Review, 16(2), 225–237. [DOI] [PubMed] [Google Scholar]
- Rouder J.N., Morey R.D. (2011) A Bayes factor meta‐analysis of Bem's ESP claim. Psychonomic Bulletin & Review, 18(4), 682–689. [DOI] [PubMed] [Google Scholar]
- Rosenthal R., Gaito J. (1963) The interpretation of level of evidence by psychological researchers. The Journal of Psychology, 55, 33–38. [Google Scholar]
- Simonsohn U., Nelson L.D., Simmons J.P. (2014) P‐curve: a key to the file‐drawer. Journal of Experimental Psychology: General, 143(2), 534. [DOI] [PubMed] [Google Scholar]
- Turner E.H. (2013) How to access and process FDA drug approval packages for use in research. British Medical Journal, 347, f5992. [DOI] [PubMed] [Google Scholar]
- Turner E.H., Knoepflmacher D., Shapley L. (2012) Publication bias in antipsychotic trials: an analysis of efficacy comparing the published literature to the US Food and Drug Administration database. PLoS Medicine, 9(3), 293. [DOI] [PMC free article] [PubMed] [Google Scholar]
- Turner E.H., Matthews A.M., Linardatos E., Tell R.A., Rosenthal R. (2008) Selective publication of antidepressant trials and its influence on apparent efficacy. New England Journal of Medicine, 358(3), 252–260. [DOI] [PubMed] [Google Scholar]
- US Food and Drug Administration (FDA) . (1998) Guidance for Industry: Providing Clinical Evidence of Effectiveness for Human Drug and Biological Products. http://www.fda.gov/downloads/drugs/guidancecomplianceregulatoryinformation/guidances/ucm078749.pdf [15 May 1998].
- US Food and Drug Administration (FDA) . (2010) Guidance for the Use of Bayesian Statistics in Medical Device Clinical Trials. http://www.fda.gov/MedicalDevices/DeviceRegulationandGuidance/GuidanceDocuments/ucm071072.htm [5 February 2010].
- Wagenmakers E.J., Wetzels R., Borsboom D., Van Der Maas H.L. (2011) Why psychologists must change the way they analyze their data: the case of psi: comment on Bem (2011). ▪▪. [DOI] [PubMed] [Google Scholar]
- Weathers F.W., Keane T.M., Davidson J.R. (2001) Clinician‐administered PTSD scale: a review of the first ten years of research. Depression and Anxiety, 13(3), 132–156. [DOI] [PubMed] [Google Scholar]
- Wetzels R., Matzke D., Lee M.D., Rouder J.N., Iverson G.J., Wagenmakers E.J. (2011) Statistical evidence in experimental psychology an empirical comparison using 855 t tests. Perspectives on Psychological Science, 6(3), 291–298. [DOI] [PubMed] [Google Scholar]
Associated Data
This section collects any data citations, data availability statements, or supplementary materials included in this article.
Supplementary Materials
Supporting info item
Supporting info item
Supporting info item