

Abstract
Growth patterns in early life are associated with later health. The effect of nutrition during in utero development on later body composition is unclear. We evaluated whether prenatal early invitation to food and/or multiple micronutrient supplementation (MMS) in pregnancy has an effect on offspring body composition at 54 months of age. In Maternal and Infant Nutrition Interventions in Matlab trial (ISRCTN16581394) in Bangladesh, 4436 pregnant women were randomised into six equally sized groups: double‐masked supplementation with capsules of either 30 mg Fe and 400 μg folic acid, or 60 mg Fe and 400 μg folic acid, or MMS (15 micronutrients), was combined with a randomised early invitation (around 9 weeks) or a usual invitation (around 20 weeks) to start food supplementation (608 kcal 6 days per week). At 54 months, the body composition of the offspring was assessed by leg‐to‐leg bioelectrical impedance analysis. Of the 3267 live singletons with birth anthropometry, 2290 children were measured at 54 months, representing 70% of the live births. There was no interaction between the food and micronutrient supplementation on body composition outcomes. There were no significant differences in a range of anthropometric and body composition measurements, including weight, height, mid‐upper arm circumference, head circumference, skinfold thickness, and fat mass and fat‐free mass between the different prenatal food and micronutrient groups using an intention‐to‐treat analysis. This analysis shows that early invitation to food supplementation and MMS provided to rural Bangladeshi women during pregnancy did not affect offspring body composition at 54 months of age.
Keywords: body composition, child growth, food supplementation, multiple micronutrients, pregnancy, socio‐economic status
Introduction
Events in early life are associated with a variety of later health outcomes, including body size and body composition, and may influence the development of chronic diseases later in life (Barker et al. 2002). The effect on later body size and body composition is less clear; however, two recent reviews have concluded that there is strong evidence of a positive linear relationship between size at birth and body mass index (BMI) in later life (Oken & Gillman 2003; Rogers 2003). Most of the evidence, however, is derived from studies that lack information on mothers’ nutrition during pregnancy and which have used birth anthropometry (e.g. birthweight) as proxy indicator for fetal nutrition. Therefore, in these studies poor fetal nutrition cannot be separated from other factors that cause intrauterine growth restriction (Kuzawa 2004). To enable an evaluation of the importance of fetal nutrition and more direct estimates of factors influencing fetal development, studies are needed that address maternal nutrition, preferably by randomised nutrition intervention trials.
Protein‐energy supplements given to pregnant women in the Gambia have increased birthweight and improved neonatal survival (Ceesay et al. 1997), but has not been associated with differences in offspring body composition at 11–17 years of age (Hawkesworth et al. 2008). In Indonesia, protein‐energy supplements resulted in a modest improvement in birthweight, and children were taller throughout the first 5 years (Kusin et al. 1992). Some researchers have raised concern, however, that improved nutrition in utero may actually increase fat mass (FM) and therefore in itself be a risk factor for later diseases, such as coronary heart disease (Yajnik 2004). Children's adiposity may be influenced by their mother's own fatness during pregnancy. The distribution of body fat (BF) is important in terms of risk of chronic disease; abdominal fat distribution is associated with metabolic disturbances (Snijder et al. 2006). Consequently, the programming of body composition in early life may play a key role in the potential developmental origins of such diseases (Wells et al. 2007). In India, it has been shown that small, light mothers give birth to small babies who preserve BF to such an extent that it may lead to later insulin resistance (Yajnik et al. 2003). This occurs on the background of a characteristic body composition: Indians are thin by conventional criteria (low BMI) but are centrally obese. Because this so‐called ‘thin‐fat baby phenomenon’ could potentially be exaggerated or may be prevented by nutritional interventions, it is therefore of great importance to include assessments of body composition in evaluations of effects of nutrition interventions.
The Maternal and Infant Nutrition Interventions in Matlab (MINIMat) trial (ISRCTN 16581394) is a prospective, population‐based food and micronutrient intervention aimed to improve maternal and infant health in Matlab, Bangladesh. We have shown that early invitation to prenatal food supplementation reduced stunting while multiple micronutrient supplementation (MMS) increased stunting during 0–54 months of age (Khan et al. 2011) in spite of no differential effect on birthweight. Further, MMS in combination with early invitation to food supplementation reduced under‐5 mortality (Persson et al. 2012). These findings indicate programming effects by the prenatal nutrition interventions. In this paper, we analyse whether prenatal early invitation to food and/or MMS in pregnancy has any effect on offspring body composition at 54 months of age. We postulated that an early assignment to prenatal food supplementation (vs. the usual, later timing) would improve fetal and childhood growth and reduce the risk of a later increase in subcutaneous fat and FM, and that the addition of multiple micronutrients (vs. iron‐folate) would further reduce the risk.
Key messages
Previous findings suggest that an early invitation to food supplementation reduces stunting and MMS combined with an early invitation to food supplementation increases child survival.
This paper focuses on the effects of prenatal food and MMS on offspring body composition at 54 months.
No significant differences were found in a range of anthropometric and body composition measurements in children aged 54 months between the different prenatal food and micronutrient intervention groups.
Subjects and methods
Study site, participants and original trial
The MINIMat trial was conducted in Matlab, a rural subdistrict 57 km south‐east of the capital, Dhaka, Bangladesh, that now has a population of about 220 000 people. The main economic activities in the area are farming and fishing. Since 1996, the International Centre for Diarrhoeal Disease Research, Bangladesh (ICDDR,B) is running a health and demographic surveillance system in the area that records health and demographic information on a monthly basis.
All pregnant women in the ICDDR,B service area were eligible for enrolment in the present study if they met the following eligibility criteria: viable fetus, gestational age <14 weeks by ultrasound examination, absence of severe illness in the woman and consent for participation. In total, 4436 pregnant women were enrolled in the MINIMat study between November 2001 and October 2003, and 3267 infants with birth anthropometry were eligible for follow‐up at 54 months that took place between May 2007 and March 2009. Written informed consent was obtained from all participating mothers (separately for the original trial and the follow‐up) and the study was approved by the Research and Ethical Review Committees of the ICDDR,B.
Interventions
Details of the MINIMat food and micronutrient supplementation trial are described elsewhere (Khan et al. 2011; Persson et al. 2012). In brief, after enrolment, pregnant women were individually randomised to be invited to the feeding programme, assigned to one of two food supplement groups: either early invitation [with the offer of supplementation made immediately after ascertainment of pregnancy, at around 9 weeks of pregnancy (E)] or usual invitation [at the time of their choosing, i.e. standard care in this community, at around 20 weeks of pregnancy (U)]. Food supplementation came from the ongoing government‐supported national programme providing an energy‐protein supplement to all pregnant women, irrespective of BMI. This was different from the national programme, where only pregnant women with BMI < 18.5 kg m−2 were eligible to receive the food supplements. The supplement was provided in plastic packets to be mixed with water and contained 80 g of roasted rice powder, 40 g of roasted pulse powder, 20 g of molasses and 12 mL (6 g) of soybean oil. The food supplement provided 608 kcal d−1, and was made available through community nutrition centres 6 days per week. Women randomised to early invitation were encouraged to attend nutrition centres and their names were given to the nutrition programme. Food supplementation was continued up to the end of pregnancy. In addition, all pregnant women were also randomised at the 14‐week clinic visit to one of three micronutrient groups: 30 mg Fe fumarate + 400 μg folate (Fe30F group), or 60 mg Fe fumarate + 400 μg folate (Fe60F group), or MMS consisting of a total of six food and micronutrient groups. MMS containing 15 recommended micronutrients (UNICEF/UNU/WHO 1999) [30 mg of iron (fumarate), 400 μg of folic acid, 800 μg of retinol equivalent vitamin A (retinyl acetate), 200 IU of vitamin D (D3), 10 mg of vitamin E (α‐tocopherol acetate), 70 mg of vitamin C, 1.4 mg of vitamin B1 (thiamine mononitrate), 1.4 mg of vitamin B2 (riboflavin), 18 mg of niacin, 1.9 mg of vitamin B6 (pyridoxine hydrochloride), 2.6 μg of vitamin B12 (cyanocobalamin), 15 mg of zinc (sulphate), 2 mg of copper (sulfate), 65 μg of selenium (sodium selenite), and 150 μg of iodine (potassium iodide)].
A computer‐generated register of study identity numbers with random assignment of food (early or usual invitations) and micronutrient groups was used for randomisation. Each micronutrient group had been given four different number codes to decrease the risk of unblinding, with randomisation performed in blocks of 12, and independently for each of four ICDDR,B clinics. The micronutrient supplementation was thus, double‐blinded and the food supplementation was randomly allocated but not blinded. Randomisation codes were safely kept at the administrative office of ICDDR,B and were not broken until after performing the intention‐to‐treat (ITT) analyses.
The three types of micronutrient supplements to be taken daily looked identical, and were distributed in special pill bottles. The first supply of micronutrient supplements was distributed to the enrolled women at the 14‐week clinic visit. Each bottle contained 35 capsules and refills were provided by interviewers during monthly home visits. The MINIMat trial evaluated the effect of prenatal supplementation on size at birth, gestational age at birth and under‐5 mortality as primary outcomes. Being one of the secondary objectives of the trial, the effects of prenatal early invitation to food supplementation and MMS on body composition at 54 months are reported in this paper.
Adherence to supplement intake
At every monthly home visits, the interviewers asked a series of questions to assess compliance with food supplementation in the previous 30 days. The micronutrient bottles in the study were equipped with a microprocessor inside the cap (eDEM; Aprex, Fremont, CA, USA) that recorded the date and time of every opening of the cap. This information was downloaded into a computer when the bottles were collected from women. The capsule‐counting eDEM is regarded as the best available method for measuring adherence (Jasti et al. 2006).
Measurements during the original trial
All birthweights were measured using Seca electronic or beam scales (Seca GmbH & Co., Hamburg, Germany) with a precision of 0.01 kg. Birth anthropometry was in most cases performed within 72 h after birth. Measurements were made even if the newborns were born after 72 h, and in those cases adjusted using a standard deviation (SD) score transformation back to the day of birth. Maternal weight and height were measured at enrolment at around 8 weeks gestation. Maternal weight was measured using electronic scales (UNIscale, UNICEF, Copenhagen, Denmark) with a precision of 0.10 kg, and height was measured to the nearest 0.1 cm using a stadiometer. The recumbent length of the newborn was measured by locally manufactured, collapsible length boards, with a precision of 0.1 cm. Weight and length were measured every month up to 1 year, thereafter every 3 months until 24 months of age. Weighing equipment was calibrated daily with standard weights, and refresher training was conducted periodically on data collection methods and anthropometric measurements.
Measurements at the 54‐month follow‐up
All singleton, live‐born babies with birth anthropometry in the original MINIMat trial were eligible for the 54‐month follow‐up. The initial visit at home included informed consent and an interview regarding socio‐economic status (SES) including information on family wealth (i.e. assets), household structure, etc. The remaining data collection was performed at the local subcentres run by the ICDDR,B in the Matlab area. A health worker from the study accompanied the participants to the study location early in the morning, following an overnight fast. All measurements were conducted by one of two teams, each of which consisted of a medical doctor, a nurse and a laboratory technician, with the help of trained field staff. Each observer performed the same measurement and each measurement was conducted at a similar time of the day. At these visits, body weight was recorded to the nearest 0.1 kg using a digital scale (Tanita Corporation, Tokyo, Japan) with the subject wearing light clothing and barefoot. The scale's accuracy was checked with a standard 20 kg weight on each study day. Height was measured to the nearest 0.1 cm using a daily calibrated, freestanding stadiometer Leicester Height Measure (Seca 214, Leicester Height Measure; Seca Ltd, Birmingham, UK). Mid‐upper arm circumference (MUAC) was measured to the nearest 0.1 cm with a nonelastic metric measuring tape at the midpoint of the upper arm, with the arm hanging straight by the subject's side. Skinfold thickness was measured in triplicate to the nearest 0.2 mm at four sites (biceps, triceps, subscapular and suprailiac skinfolds) using Holtain callipers (Holtain, Crymych, UK). All skinfold and MUAC measurements were performed in the same order on the left side of the body. The average of three measurements at each site was used to estimate body fatness. Anthropometric measurements (height, weight and MUAC) were conducted by one field research assistant, while skinfold measurements were performed by the study nurse.
Body composition was further assessed by leg‐to‐leg bioelectrical impedance analysis (BIA) using a Tanita TBF‐300 MA Body Composition Analyzer (Tanita Corporation, Tokyo, Japan). The BIA measurements were made according to the manufacturer's guidelines and at a measurement frequency of 50 kHz. Height, sex and age were entered manually while weight was recorded automatically using 0.5 kg as an adjustment for weight of clothes in all subjects. Body composition measurements were performed by the trained study nurse. The Tanita software uses in‐built prediction equations to estimate FM and fat‐free mass (FFM). These built‐in prediction equations are based on Caucasian populations of age 7 and older. In a validation study conducted in the Matlab population, the equations were found to be inaccurate, compared with deuterium oxide dilution, at predicting FFM (Khan 2012). To create novel prediction equations for estimating FFM in this population, the FFM values derived from the deuterium oxide dilution were used as the reference method and impedance values from the Tanita system in the study sample of Bangladeshi children were used. We therefore predicted FFM from our own equation, which was previously derived in this population using deuterium oxide dilution as a reference method (Khan 2012).
Statistical analysis
The outcome for this study was body composition at 54 months of age. Body composition was assessed in several ways including BMI [defined as weight(kg)/height(m)2], FM and FFM obtained using BIA analysis, and both arm fat area (AFA) and arm muscle area (AMA) derived from triceps skinfold thickness and MUAC measurements (Gibson 2005). Parental SES was assessed by a continuous wealth index previously generated in this population and which included data on land ownership, the construction materials of house walls, ownership of household assets, ownership of sarees or shalwer kameez for ceremonial use and pairs of shoes or sandals owned (Saha et al. 2008).
Means and SDs were calculated for continuous variables, while proportions were calculated for categorical variables. Differences between categorical variables were compared using chi‐squared tests. T‐tests and analysis of variance with post hoc Bonferroni corrections were used to compare group differences. The effect of randomisation to food or micronutrient interventions was evaluated using an ITT analysis using linear regression. Variables that were potential correlates of child growth and body composition were assessed by simple linear regression analysis, and those that were found to have an association were included in the adjusted regression models. There were three stages of regression models used to investigate the impact of the maternal interventions: unadjusted (model 1), adjusted for covariates (age at follow‐up, sex, maternal BMI at 8 weeks gestational age and asset scores) unrelated to the maternal intervention, but related to child growth (model 2), and as for model 2, but additionally adjusted for child birthweight and length (model 3). Model 1 is unadjusted model and the other socio‐economic variables collected at baseline were tested in the models. Model 2 is the adjusted intervention effect (i.e.: to provide a tighter estimate by removing ‘noise’ due to covariates) while model 3 is looking at the potential pathway of impact (birthweight and length could be affected directly by the intervention). Statistical analyses were performed using PASW statistics 18.0 (IBM Corporation, Somers, NY, USA).
Results
Of the 3267 live singleton births in the MINIMat trial, body composition at 54 months was measured in 2290 children, representing 70% of the original trial live births; 2526 children completed anthropometry measurements at 54 months. Losses from birth anthropometry to 54 months follow‐up included out‐migration (n = 162), withdrawn consent (n = 207), death (n = 85) and not located (n = 287). Losses to follow‐up did not differ across the intervention groups. The distribution of pregnant women and their children in the different supplementation groups and the numbers lost to follow‐up are shown in Fig. 1.
Figure 1.
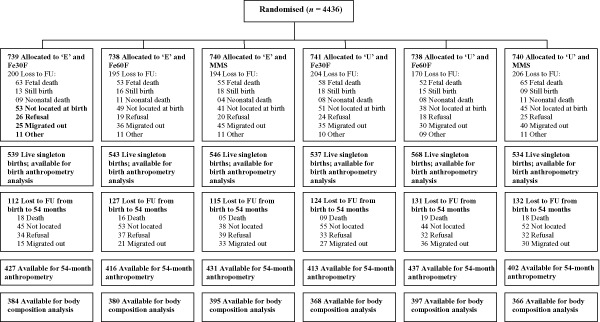
Flow diagram of women and infants participating in the Maternal and Infant Nutrition Interventions in Matlab (MINIMat) trial with 54 months follow‐up. E, early invitation food supplementation; Fe30F, 30 mg iron and 400 μg folic acid; Fe60F, 60 mg iron and 400 μg folic acid; FU, follow‐up; MMS, multiple micronutrients supplementation (15 micronutrients including 30 mg iron and 400 μg folic acid); U, usual invitation food supplementation.
Among those individuals enrolled in the follow‐up, maternal baseline characteristics remained equally distributed between the six nutritional supplementation arms of the trial (Table 1). There were significant differences in characteristics between mothers whose children completed the study and mothers whose children did not complete the body composition measurements; children whose body composition measurements were not completed were more likely to be first‐born and of smaller birth size (Table 1). There were also small differences in maternal BMI and asset scores. An almost equal proportion of boys (51%) and girls (49%) completed the follow‐up (data not shown). The average age of participating children was 54.6 months (SD 1.8), mean weight 13.8 kg (SD 1.7), height 99.8 cm (SD 4.3), MUAC 15.2 cm (SD 1.1) and head circumference 47.9 cm (SD 1.5).
Table 1.
Baseline characteristics and differences between individuals completing the Maternal and Infant Nutrition Interventions in Matlab (MINIMat) trial follow‐up at 54 months and individuals who did not complete the follow‐up
| Characteristics | Early invitation food supplementation | Usual invitation food supplementation | Analysed (n = 2290) | Not completed (n = 977) | P‐ value | ||||
|---|---|---|---|---|---|---|---|---|---|
| Fe30F | Fe60F | MMS | Fe30F | Fe60F | MMS | ||||
| n = 384 | n = 380 | n = 395 | n = 368 | n = 397 | n = 366 | ||||
| Maternal age (years) | 25.64 ± 5.76 | 25.91 ± 6.05 | 26.25 ± 6.34 | 26.15 ± 6.03 | 25.84 ± 5.87 | 25.36 ± 5.75 | 25.86 ± 5.97 | 25.73 ± 5.78 | 0.544 |
| Maternal BMI (kg m−2)at 8 weeks’ gestation | 20.20 ± 2.59 | 20.24 ± 2.84 | 20.14 ± 2.68 | 20.15 ± 2.72 | 20.19 ± 2.76 | 20.33 ± 2.47 | 20.21 ± 2.68 | 20.01 ± 2.63 | 0.052 |
| Gestational age (weeks) | 38.74 ± 1.69 | 38.81 ± 1.54 | 38.67 ± 1.74 | 38.70 ± 1.80 | 38.79 ± 1.60 | 38.89 ± 1.53 | 38.77 ± 1.65 | 38.71 ± 1.90 | 0.447 |
| Birthweight (kg) | 2.72 ± 0.42 | 2.71 ± 0.37 | 2.70 ± 0.39 | 2.73 ± 0.44 | 2.71 ± 0.39 | 2.71 ± 0.38 | 2.71 ± 0.40 | 2.65 ± 0.44 | <0.001 |
| Birth length (cm) | 47.78 ± 2.22 | 47.95 ± 1.96 | 47.72 ± 1.93 | 47.81 ± 2.30 | 47.91 ± 2.07 | 47.75 ± 2.15 | 47.82 ± 2.11 | 47.42 ± 2.32 | <0.001 |
| Maternal education (% illiterate) | 118/384 (30.7) | 107/380 (28.2) | 135/395 (34.2) | 116/368 (31.5) | 135/397 (34.0) | 109/366 (29.8) | 720/2290 (31.4) | 296/977 (30.3) | 0.791 |
| Maternal occupation (% housewives) | 352/384 (91.7) | 351/380 (92.4) | 352/395 (89.1) | 340/368 (92.4) | 366/397 (92.2) | 347/366 (94.8) | 2108/2290 (92.1) | 886/977 (90.6) | 0.169 |
| Parity (%) | 0.394 | ||||||||
| 0 | 126/384 (32.8) | 124/380 (32.6) | 121/395 (30.6) | 113/368 (30.7) | 113/396 (28.5) | 122/366 (33.3) | 719/2289 (31.4) | 322/977 (33.0) | |
| 1 | 106/384 (27.6) | 104/380 (27.4) | 111/395 (28.1) | 98/368 (26.6) | 108/396 (27.3) | 109/366 (29.8) | 636/2289 (27.8) | 281/977 (28.8) | |
| ≥2 | 152/384 (39.6) | 152/380 (40.0) | 163/395 (41.3) | 157/368 (42.7) | 175/396 (44.2) | 135/366 (36.9) | 934/2289 (40.8) | 374/977 (38.3) | |
| Asset scores (%) (quintiles) at enrolment | 0.009 | ||||||||
| Q1 (Poor) | 69/384 (18.0) | 66/380 (17.4) | 94/395 (23.8) | 63/368 (17.1) | 82/397 (20.7) | 57/366 (15.6) | 431/2290 (18.8) | 226/977 (23.1) | |
| Q2 (Lower middle) | 80/384 (20.8) | 78/380 (20.5) | 73/395 (18.5) | 77/368 (20.9) | 84/397 (21.2) | 82/366 (22.4) | 474/2290 (20.7) | 198/977 (20.2) | |
| Q3 (Middle) | 90/384 (23.4) | 84/380 (22.1) | 74/395 (18.7) | 74/368 (20.1) | 77/397 (19.4) | 81/366 (22.1) | 480/2290 (21.0) | 171/977 (17.5) | |
| Q4 (Upper middle) | 80/384 (20.8) | 89/380 (23.4) | 77/395 (19.5) | 77/368 (20.9) | 77/397 (19.4) | 71/366 (19.4) | 471/2290 (20.6) | 179/977 (18.3) | |
| Q5 (Well‐off) | 65/384 (16.9) | 63/380 (16.6) | 77/395 (19.5) | 77/368 (20.9) | 77/397 (19.4) | 75/366 (20.5) | 434/2290 (19.0) | 204/977 (20.9) | |
BMI, body mass index; Fe30F, 30 mg iron and 400 μg folate; Fe60F, 60 mg iron and 400 μg folate; MMS, multiple micronutrient supplementation. Values are given as means ± standard deviation (SD) or n/N (percentages) where indicated; P‐value refers to the difference between children who completed the study and children who did not complete the study, calculated by chi‐squared test or t‐test as appropriate.
Weight, height, BMI, MUAC and head circumference were not found to be different across the different intervention groups at 54 months of age (Table 2). Furthermore, the mean of three skinfold thickness measurements and body composition, assessed by BIA, including FM, percentage BF (BF%) and FFM did not differ across intervention groups at 54 months of age (Table 2).
Table 2.
Anthropometry and body composition (n = 2290) among the different supplementation groups in the Maternal and Infant Nutrition Interventions in Matlab (MINIMat) trial study at 54 months follow‐up
| Characteristics | Early invitation food supplementation | Usual invitation food supplementation | ||||||
|---|---|---|---|---|---|---|---|---|
| Mean ± SD | Fe30F | Fe60F | MMS | All | Fe30F | Fe60F | MMS | All |
| Age (months) | 54.52 ± 1.74 | 54.57 ± 1.73 | 54.58 ± 1.69 | 54.56 ± 1.72 | 54.67 ± 1.95 | 54.63 ± 1.84 | 54.62 ± 1.78 | 54.64 ± 1.86 |
| Weight (kg) | 13.91 ± 1.57 | 13.88 ± 1.53 | 13.83 ± 1.55 | 13.87 ± 1.55 | 13.96 ± 1.79 | 13.83 ± 1.76 | 13.89 ± 1.60 | 13.89 ± 1.72 |
| Height (cm) | 100.11 ± 4.13 | 100.30 ± 3.95 | 99.90 ± 4.18 | 100.10 ± 4.09 | 100.14 ± 4.48 | 99.81 ± 4.52 | 99.80 ± 4.15 | 99.91 ± 4.39 |
| BMI (kg m−2) | 13.85 ± 0.93 | 13.77 ± 0.94 | 13.83 ± 0.93 | 13.81 ± 0.93 | 13.87 ± 0.99 | 13.84 ± 0.97 | 13.91 ± 0.93 | 13.87 ± 0.96 |
| MUAC (cm) | 15.24 ± 1.00 | 15.30 ± 1.12 | 15.24 ± 1.03 | 15.26 ± 1.05 | 15.30 ± 1.15 | 15.26 ± 1.06 | 15.37 ± 1.12 | 15.31 ± 1.11 |
| Head circumference(cm) | 48.08 ± 1.30 | 47.95 ± 1.52 | 48.07 ± 1.45 | 48.04 ± 1.42 | 48.07 ± 1.49 | 47.97 ± 1.61 | 47.99 ± 1.59 | 48.01 ± 1.56 |
| Skinfolds (mm) | ||||||||
| Biceps | 4.92 ± 1.05 | 4.86 ± 1.04 | 4.90 ± 1.03 | 4.89 ± 1.04 | 4.89 ± 1.03 | 4.86 ± 1.01 | 4.90 ± 1.11 | 4.89 ± 1.05 |
| Triceps | 7.25 ± 1.49 | 7.22 ± 1.52 | 7.28 ± 1.49 | 7.25 ± 1.50 | 7.28 ± 1.42 | 7.26 ± 1.45 | 7.27 ± 1.57 | 7.27 ± 1.48 |
| Subscapular | 5.13 ± 1.02 | 5.14 ± 1.12 | 5.16 ± 1.01 | 5.14 ± 1.05 | 5.18 ± 1.07 | 5.19 ± 1.08 | 5.21 ± 1.18 | 5.19 ± 1.11 |
| Suprailiac | 5.02 ± 1.47 | 4.99 ± 1.51 | 5.04 ± 1.42 | 5.02 ± 1.47 | 5.06 ± 1.47 | 5.04 ± 1.42 | 5.06 ± 1.56 | 5.05 ± 1.48 |
| BIA | ||||||||
| FFM (kg)* | 12.19 ± 1.23 | 12.15 ± 1.16 | 12.10 ± 1.22 | 12.15 ± 1.20 | 12.20 ± 1.35 | 12.11 ± 1.34 | 12.17 ± 1.23 | 12.16 ± 1.31 |
| FM (kg)* | 1.72 ± 0.55 | 1.72 ± 0.60 | 1.73 ± 0.56 | 1.72 ± 0.57 | 1.76 ± 0.62 | 1.72 ± 0.61 | 1.72 ± 0.59 | 1.73 ± 0.61 |
| BF (%)* | 12.19 ± 3.09 | 12.24 ± 3.34 | 12.33 ± 3.24 | 12.25 ± 3.22 | 12.38 ± 3.29 | 12.19 ± 3.30 | 12.18 ± 3.24 | 12.25 ± 3.28 |
| AFA (cm2) † | 5.13 ± 1.21 | 5.15 ± 1.30 | 5.16 ± 1.24 | 5.15 ± 1.25 | 5.19 ± 1.25 | 5.15 ± 1.21 | 5.21 ± 1.37 | 5.18 ± 1.28 |
| AMA (cm2) † | 18.13 ± 2.38 | 18.33 ± 2.69 | 18.14 ± 2.45 | 18.20 ± 2.51 | 18.31 ± 2.77 | 18.20 ± 2.56 | 18.49 ± 2.74 | 18.33 ± 2.69 |
AFA, arm fat area; AMA, arm muscle area; BF, body fat; BIA, bioelectrical impedance analysis; BMI, body mass index; Fe30F, 30 mg iron and 400 μg folate; Fe60F, 60 mg iron and 400 μg folate; FFM, fat‐free mass; FM, fat mass; MMS, multiple micronutrient supplementation; MUAC, mean upper arm circumference; SD, standard deviation. *FFM and FM were derived from BIA (Tanita TBF‐300MA; Tanita Corporation, Tokyo, Japan) using PoP‐specific equations (Khan 2012). †Both AFA and AMA derived from triceps skinfold thickness and MUAC measurements (Gibson 2005). T‐tests and analysis of variance with post hoc Bonferroni corrections were used to compare group differences, no significant difference found.
We further assessed the effect of randomisation to food and micronutrient supplementation on child nutritional status and body composition at 54 months by an ITT analysis using unadjusted and adjusted linear regression models. In a model adjusted for size at birth, child height was positively associated with maternal early invitation to food supplementation group (P = 0.08) (Table 3). There was no interaction between the food and micronutrient supplementation on child body composition at 54 months (FFM P = 0.65; FM P = 0.69). There were no other differences in anthropometry or body composition variables between children in the early and the usual start of food supplementation groups. Similarly, there were no differences in anthropometry or body composition between individuals born to women receiving the different micronutrient supplementations (Table 4). We stratified maternal height and BMI by median value (dichotomised) to evaluate any effect on child body composition at 54 months in subgroups of maternal nutritional status. There was no interaction between maternal BMI or height and food supplementation, or with multiple micronutrient intervention on child body composition at 54 months (data not shown).
Table 3.
Effect of prenatal food supplementation on offspring nutritional status and body composition at 54 months in Bangladesh: intention‐to‐treat (ITT) analysis
| Model 1* (95% CI) | P‐value | Model 2 † (95% CI) | P‐value | Model 3 ‡ (95% CI) | P‐value | |
|---|---|---|---|---|---|---|
| Nutritional status | ||||||
| Weight (kg) | −0.006 (−0.153, 0.115) | 0.783 | 0.001 (−0.119, 0.128) | 0.945 | 0.002 (−0.109, 0.125) | 0.894 |
| Height (cm) | 0.022 (−0.161, 0.535) | 0.292 | 0.032 (−0.049, 0.585) | 0.098 | 0.031 (−0.029, 0.562) | 0.077 |
| BMI (kg m−2) | −0.031 (−0.0136, 0.019) | 0.140 | −0.031 (−0.135, 0.17) | 0.128 | −0.029 (−0.130, 0.020) | 0.148 |
| Skinfolds (mm) | ||||||
| Biceps | 0.004 (−0.078, 0.093) | 0.865 | 0.004 (−0.076, 0.094) | 0.834 | 0.004 (−0.076, 0.094) | 0.830 |
| Triceps | −0.006 (−0.140, 0.105) | 0.774 | −0.007 (−0.142, 0.098) | 0.719 | −0.008 (−0.143, 0.097) | 0.710 |
| Subscapular | 0.024 (−0.141, 0.037) | 0.249 | −0.024 (−0.138, 0.034) | 0.234 | −0.024 (−0.138, 0.033) | 0.230 |
| Suprailiac | −0.011 (−0.153, 0.90) | 0.609 | −0.011 (−0.150, 0.088) | 0.609 | −0.010 (−0.150, 0.089) | 0.615 |
| BIA | ||||||
| FFM (kg) § | −0.004 (−0.114, 0.092) | 0.834 | 0.002 (−0.082, 0.093) | 0.897 | 0.003 (−0.74, 0.091) | 0.837 |
| FM (kg) § | −0.007 (−0.056, 0.041) | 0.751 | −0.001 (0.044, 0.042) | 0.948 | −0.001 (0.042, 0.041) | 0.972 |
| AFA (cm2) ¶ | −0.013 (−0.136, 0.072) | 0.547 | 0.012 (−0.133, 0.070) | 0.548 | −0.012 (−0.132, 0.070) | 0.550 |
| AMA (cm2) ¶ | −0.025 (−0.342, 0.085) | 0.237 | −0.021 (−0.311, 0.097) | 0.305 | −0.020 (−0.304, 0.099) | 0.318 |
AFA, arm fat area; AMA, arm muscle area; BIA, bioelectrical impedance analysis; BMI, body mass index; CI, confidence interval; FFM, fat‐free mass; FM, fat mass. Results are given as the difference in mean outcome (95% CI) between individuals born to women receiving early invitation food supplementation (coded 1) and born to women receiving usual invitation food supplementation (coded 0), derived from linear regression analysis. *Model 1 = unadjusted. †Model 2 = adjusted for age at 54 months, sex, maternal BMI at 8 weeks gestation and maternal asset score. ‡Model 3 = as for model 2 but additionally adjusted for child birthweight and birth length.
Table 4.
Effect of prenatal micronutrient supplementation on offspring nutritional status and body composition at 54 months in Bangladesh: intention‐to‐treat (ITT) analysis
| Model 1* (95% CI) | P‐value | Model 2 † (95% CI) | P‐value | Model 3 ‡ (95% CI) | P‐value | |
|---|---|---|---|---|---|---|
| Nutritional status | ||||||
| Weight (kg) | 0.001 (−0.160, 0.164) | 0.980 | −0.003 (−0.158, 0.139) | 0.898 | 0.004 (−0.128, 0.156) | 0.847 |
| Height (cm) | −0.023 (−0.619, 0.224) | 0.358 | −0.026 (−0.601, 0.168) | 0.270 | −0.010 (−0.449, 0.278) | 0.645 |
| BMI (kg m−2) | 0.034 (−0.031, 0.159) | 0.185 | 0.031 (−0.035, 0.150) | 0.220 | 0.024 (−0.045, 0.137) | 0.321 |
| Skinfolds (mm) | ||||||
| Biceps | 0.019 (0.065, 0.145) | 0.455 | 0.019 (−0.065, 0.143) | 0.460 | 0.019 (−0.065, 0.143) | 0.461 |
| Triceps | 0.012 (−0.116, 0.186) | 0.647 | 0.013 (−0.107, 0.188) | 0.591 | 0.012 (−0.113, 0.183) | 0.641 |
| Subscapular | 0.008 (−0.093, 0.127) | 0.765 | 0.009 (−0.087, 0.124) | 0.729 | 0.011 (−0.081, 0.130) | 0.651 |
| Suprailiac | 0.010 (−0.118, 0.179) | 0.688 | 0.010 (−0.115, 0.175) | 0.689 | 0.012 (−0.112, 0.180) | 0.646 |
| BIA | ||||||
| FFM (kg) § | 0.000 (−0.123, 0.125) | 0.991 | −0.004 (0.115, 0.095) | 0.847 | 0.003 (−0.093, 0.107) | 0.895 |
| FM (kg) § | 0.001 (−0.058, 0.061) | 0.965 | 0.000 (−0.052, 0.053) | 0.983 | 0.006 (−0.044, 0.58) | 0.781 |
| AFA (cm2) ¶ | 0.012 (−0.099, 0.158) | 0.647 | 0.012 (−0.094, 0.156) | 0.629 | 0.010 (−0.099, 0.151) | 0.684 |
| AMA(cm2) ¶ | 0.008 (−0.218, 0.305) | 0.746 | 0.004 (−0.228, 0.273) | 0.862 | 0.004 (−0.230, 0.268) | 0.880 |
AFA, arm fat area; AMA, arm muscle area; BIA, bioelectrical impedance analysis; BMI, body mass index; CI, confidence interval; FFM, fat‐free mass; FM, fat mass. Results are given as the difference in mean outcome (95% CI) between individuals born to women receiving multiple micronutrient supplementation (coded 1) and born to women receiving Fe60F supplementation (coded 0), derived from linear regression analysis. *Model 1 = unadjusted. †Model 2 = adjusted for age at 54 months, sex, maternal BMI at 8 weeks gestation and maternal asset score. ‡Model 3 = as for model 2 but additionally adjusted for child birthweight and birth length.
Discussion
We have shown that children of women who were randomised to an early invitation to prenatal food supplementation combined with multiple micronutrient supplements in comparison with the usual timing of invitation to food supplementation combined with 60 mg iron and folate did not have any differences in body composition at 54 months. In a model adjusted for size at birth, we observed a marginal impact on child height of 0.03 cm. This effect size is of no public health importance and the findings have not been adjusted for the impact of multiple testing therefore, allowing us to conclude that there was no impact of the intervention.
We have previously demonstrated that the early invitation to food supplementation reduced stunting from 0 to 54 months and that multiple micronutrients, as compared with iron‐folate supplements, increased the frequency of stunting in this age interval (Khan et al. 2011). Consequently, there are indications of programming effects of the nutrition intervention in pregnancy that have health consequences during the first 5 years of life but are not reflected in differences in body composition at 54 months. Animal (Hoet & Hanson 1999) and human studies (Roseboom et al. 2006) have shown that there are critical periods in the mother's dietary intake during pregnancy that can influence future health without altering the size at birth. The positive effect on child growth and survival in the MINIMat trial was evidently not mediated by changes in the fetal growth trajectory and size at birth. However, the combination of early invitation to food supplementation from approximately week 9 of gestation with MMS from week 14 implied a fetal nutrient supply that favoured healthy fetal development and infant survival (Persson et al. 2012). In animal experiments, undernutrition in early gestation is associated with impaired responses of the hypothalamic‐pituitary‐adrenal axis (Hoet & Hanson 1999). Dietary insufficiencies during the early gestational period may also affect other homeostatic mechanisms. Food supplementation in early gestation combined with MMS may therefore have the potential to promote adequate responses on the offspring (McArdle & Ashworth 1999). However, prenatal supplementation in the Gambia found an increased birthweight and improved neonatal survival (Ceesay et al. 1997), but was not associated with the body composition of children at 11–17 years of age (Hawkesworth et al. 2008).
The MINIMat trial was a large, randomised, controlled trial with a double‐blinded micronutrient intervention. The food supplementation groups, however, were randomly allocated but not blinded. Retention into the 54‐month follow‐up was satisfactory and did not differ by intervention group although there were minor differences in some baseline characteristics between children recruited and children lost to follow‐up. These are unlikely to have biased the results presented. However, it is possible that unmeasured characteristics were affected by loss to follow‐up and that this would have implications in terms of bias. Anthropometric and body composition assessments were conducted by only two teams, and each observer performed the same measurement. The pregnant mothers received almost 4 months of daily micronutrient supplements. Allocation to food and micronutrient supplementation was performed according to the protocol, and masking was maintained for the micronutrient supplementation groups until the completion of ITT analysis of the primary outcomes and also up to 54 months follow‐up. The supplement doses were chosen to match those used in other trials to optimise comparability and also to avoid micronutrient interaction (UNICEF/UNU/WHO 1999). The usual care invitation with daily dose of 60 mg of iron and 400 μg of folic acid was included as part of the standard programme. The rationale for providing the treatment with 30 mg of iron and 400 μg of folic acid was to offer an iron‐folate alternative with the same amount of iron as in the MMS group. The iron content of the supplements differed between the micronutrient supplements (60 mg in one group and 30 mg in the other two groups) in line with expert opinion, but we did not find a significant differential effect in infant iron status between micronutrient supplements (Eneroth et al. 2010).
There is a lack of information about the effect of the timing of food supplementation during pregnancy and subsequent child growth and body composition. There are also few or no other combined antenatal food and micronutrient trials with substantial postnatal follow‐up against which to compare our results. A trial of antenatal zinc supplementation in a poor population from urban Bangladesh resulted in no improvements in growth between birth and 6 months of age (Osendarp et al. 2001). One study from Peru found that addition of zinc to prenatal folic acid + iron supplementation had no effect on duration of pregnancy or birth anthropometric measures (Caulfield et al. 1999), but maternal zinc supplementation in this population was associated with offspring growth, i.e. significantly larger average growth measures beginning in month 4 and continuing through month 12 (Iannotti et al. 2008). Another study from Nepal (Vaidya et al. 2008) found that the effects of maternal MMS on the fetus persisted into childhood, with increases in both weight and body size than children in the iron‐folate group. One recent randomised antenatal micronutrient trial in Nepal (Stewart et al. 2009) found that maternal supplementation with folic acid + iron + zinc resulted in an increase in mean height and a reduction in mean triceps skinfold thickness, subscapular skinfold thickness and AFA, but no significant differences between groups were found in mean weight or BMI‐for‐age z‐scores, waist circumference or AMA at 6–8 years of age. One recent randomised trial in Burkina Faso found that prenatal MMS reduced the stunting rate during infancy by 27% (Roberfroid et al. 2012).
This study is the first of its kind to present body composition data from a follow‐up of children randomly exposed to multiple micronutrients with different timing of food supplementation during gestation. The randomised design is a major strength of this study. Other strengths include its large sample size, a high rate of follow‐up over a long period of time, and an extensive collection of anthropometric and body composition data among a study population in which 30% of infants had a low birthweight (Khan et al. 2011), the mothers were at risk of multiple micronutrient deficiencies during pregnancy (Lindström et al. 2011) and childhood malnutrition and infection are common (Arifeen et al. 2000). Another strength of the study is the relatively accurate measure of body composition obtained. FFM (and hence FM) was estimated in this population using a bioelectrical impedance analyser that had previously been validated and population‐specific equations were available for converting impedance data into BF data (Khan 2012).
However, our study also has limitations. These children were relatively young and lean at follow‐up, and the method used to assess body composition was BIA although multicomponent models are now considered sufficiently accurate to measure body composition (distinguishing fat and FFMs) (Wells & Fewtrell 2006). The food supplementation was ‘invitation’ only, but we have data to suggest a real difference in group intakes was obtained (Khan et al. 2011). As designed, there was a difference of approximately 30 food packages received by those allocated to an early (average start was around 9 weeks gestation) as compared with a usual timing (average start was around 20 weeks) of the invitation to food supplementation. The study was not designed to examine potential risks of excess micronutrient supplementation or to examine potential adverse interactions between the micronutrients. A placebo group could not be added due to ethical reasons. Therefore, it is not appropriate to conclude that food and/or micronutrient supplementation does not have any beneficial effect on the birth outcome or body composition at early childhood. Judgement regarding benefit of the combined interventions should be based on several outcomes: growth, survival, child development, body composition, metabolic markers, etc. Further studies are needed to assess the full benefit of the interventions under study. This study was conducted in a low‐income country, and further studies in different populations are needed to assess consistency of the findings. The lack of association between prenatal supplementation and later body composition may be related to the age at which the children were measured for body composition. It may be that fetal programming influences are only apparent at a later age. Findings from the same cohort showed that maternal early food supplementation group resulted in a more favourable lipid status in the children at 54 months compared with usual food group, and prenatal MMS lowered the children's glucose, insulin, HOMA‐IR and growth factors compared with Fe60F (Lindstrom 2012). Consequently, the investigators have initiated a follow‐up of this cohort at 10 years of age.
In conclusion, early invitation to food supplementation (as compared with usual timing) and MMS (as compared with 60 mg iron and folate) provided to rural Bangladeshi women during pregnancy had no differential effect on body composition of their offspring at 54 months of age.
Source of funding
The MINIMat research study was funded by the ICDDR,B, the United Nations Children's Fund, the Swedish International Development Cooperation Agency (SIDA), the UK Medical Research Council, the Swedish Research Council, the Department for International Development (DfID), the Japan Society for the Promotion of Science (JSPS), the Child Health and Nutrition Research Initiative (CHNRI), Uppsala University and the US Agency for International Development. The International Atomic Energy Agency (IAEA) also partly supported the body composition validation study. The ICDDR,B acknowledges the following donors who provided unrestricted support: the Australian Agency for International Development, the Canadian International Development Agency, the DfID, the Government of the People's Republic of Bangladesh, the Kingdom of the Netherlands, the Swiss Agency for Development and Cooperation and SIDA.
Conflicts of interest
The authors declare that they have no conflicts of interest.
Contributions
LÅP, IK and AIK designed the study. LÅP, E‐CE, SA and EAF designed the MINIMat research study. AIK, E‐CE, SA and LÅP supervised the data collection. AIK, LÅP, SH and EAF did the statistical analysis and interpretation of data. LÅP supervised the data analysis and interpretation. AIK analysed and interpreted the data and wrote the first draft of the manuscript. All authors contributed to subsequent discussions and revisions. All authors have read and approved the final manuscript.
Acknowledgements
We would like to thank the participants and their families in Matlab for their continuing involvement in the MINIMat trial, and the field team members and data management staff for their excellent work.
The study is registered as an International Standard Randomized Controlled Trial, No. ISRCTN16581394
References
- Arifeen S.E., Black R.E., Caulfield L.E., Antelman G., Baqui A.H., Nahar Q. et al (2000) Infant growth patterns in the slums of Dhaka in relation to birth weight, intrauterine growth retardation, and prematurity. The American Journal of Clinical Nutrition 72, 1010–1017. [DOI] [PubMed] [Google Scholar]
- Barker D.J., Eriksson J.G., Forsen T. & Osmond C. (2002) Fetal origins of adult disease: strength of effects and biological basis. International Journal of Epidemiology 31, 1235–1239. [DOI] [PubMed] [Google Scholar]
- Caulfield L.E., Zavaleta N., Figueroa A. & Leon Z. (1999) Maternal zinc supplementation does not affect size at birth or pregnancy duration in Peru. The Journal of Nutrition 129, 1563–1568. [DOI] [PubMed] [Google Scholar]
- Ceesay S.M., Prentice A.M., Cole T.J., Foord F., Weaver L.T., Poskitt E.M. et al (1997) Effects on birth weight and perinatal mortality of maternal dietary supplements in rural Gambia: 5 year randomised controlled trial. British Medical Journal (Clinical Research Ed.) 315, 786–790. [DOI] [PMC free article] [PubMed] [Google Scholar]
- Eneroth H., El Arifeen S., Persson L.Å., Lönnerdal B., Hossain M.B., Stephensen C.B. et al (2010) Maternal multiple micronutrient supplementation has limited impact on micronutrient status of Bangladeshi infants compared with standard iron and folic acid supplementation. The Journal of Nutrition 140, 618–624. [DOI] [PubMed] [Google Scholar]
- Gibson R.S. (2005) Principles of Nutritional Assessment. 2nd edn, Oxford University Press: New York. [Google Scholar]
- Hawkesworth S., Prentice A.M., Fulford A.J. & Moore S.E. (2008) Dietary supplementation of rural Gambian women during pregnancy does not affect body composition in offspring at 11–17 years of age. The Journal of Nutrition 138, 2468–2473. [DOI] [PMC free article] [PubMed] [Google Scholar]
- Hoet J.J. & Hanson M.A. (1999) Intrauterine nutrition: its importance during critical periods for cardiovascular and endocrine development. The Journal of Physiology 514 (Pt 3), 617–627. [DOI] [PMC free article] [PubMed] [Google Scholar]
- Iannotti L.L., Zavaleta N., Leon Z., Shankar A.H. & Caulfield L.E. (2008) Maternal zinc supplementation and growth in Peruvian infants. The American Journal of Clinical Nutrition 88, 154–160. [DOI] [PMC free article] [PubMed] [Google Scholar]
- Jasti S., Siega‐Riz A.M., Cogswell M.E. & Hartzema A.G. (2006) Correction for errors in measuring adherence to prenatal multivitamin/mineral supplement use among low‐income women. The Journal of Nutrition 136, 479–483. [DOI] [PubMed] [Google Scholar]
- Khan A.I., Kabir I., Ekstrom E.C., Åsling‐Monemi K., Alam D.S., Frongillo E.A. et al (2011) Effects of prenatal food and micronutrient supplementation on child growth from birth to 54 months of age: a randomized trial in Bangladesh. Nutrition Journal 10, 134. [DOI] [PMC free article] [PubMed] [Google Scholar]
- Khan A.I., Hawkesworth S., Hossain D., Arifeen S., Moore S., Hills A.P. et al (2012) Body composition of Bangladeshi children: comparison and development of leg‐to‐leg bioelectrical impedance equation. Journal of Health, Population, and Nutrition 30, 281–290. [DOI] [PMC free article] [PubMed] [Google Scholar]
- Kusin J.A., Kardjati S., Houtkooper J.M. & Renqvist U.H. (1992) Energy supplementation during pregnancy and postnatal growth. Lancet 340, 623–626. [DOI] [PubMed] [Google Scholar]
- Kuzawa C.W. (2004) Modeling fetal adaptation to nutrient restriction: testing the fetal origins hypothesis with a supply‐demand model. The Journal of Nutrition 134, 194–200. [DOI] [PubMed] [Google Scholar]
- Lindstrom E. (2012) Nutritional and Oxidative Parameters in Pregnancy, Size at Birth and Metabolic Status of the OffSpring at 4.5 Years . The MINIMat trial in rural Bangladesh. Acta Universitatis Upsaliensis Uppsala, Digital comprehensive summaries of Uppsala Dissertations from the faculty of Medicine 764.
- Lindström E., Hossain M.B., Lonnerdal B., Raqib R., El Arifeen S. & Ekstrom E.C. (2011) Prevalence of anemia and micronutrient deficiencies in early pregnancy in rural Bangladesh, the MINIMat trial. Acta Obstetricia et Gynecologica Scandinavica 90, 47–56. [DOI] [PubMed] [Google Scholar]
- McArdle H.J. & Ashworth C.J. (1999) Micronutrients in fetal growth and development. British Medical Bulletin 55, 499–510. [DOI] [PubMed] [Google Scholar]
- Oken E. & Gillman M.W. (2003) Fetal origins of obesity. Obesity Research 11, 496–506. [DOI] [PubMed] [Google Scholar]
- Osendarp S.J., Van Raaij J.M., Darmstadt G.L., Baqui A.H., Hautvast J.G. & Fuchs G.J. (2001) Zinc supplementation during pregnancy and effects on growth and morbidity in low birthweight infants: a randomised placebo controlled trial. Lancet 357, 1080–1085. [DOI] [PubMed] [Google Scholar]
- Persson L.Å., Arifeen S., Ekstrom E.C., Rasmussen K.M., Frongillo E.A. & Yunus M. et al (2012) Effects of prenatal micronutrient and early food supplementation on maternal hemoglobin, birth weight, and infant mortality among children in Bangladesh: the MINIMat randomized trial. The Journal of the American Medical Association 307, 2050–2059. [DOI] [PubMed] [Google Scholar]
- Roberfroid D., Huybregts L., Lanou H., Ouedraogo L., Henry M.C., Meda N. et al (2012) Impact of prenatal multiple micronutrients on survival and growth during infancy: a randomized controlled trial. The American Journal of Clinical Nutrition 95, 916–924. [DOI] [PubMed] [Google Scholar]
- Rogers I. (2003) The influence of birthweight and intrauterine environment on adiposity and fat distribution in later life. International Journal of Obesity and Related Metabolic Disorders 27, 755–777. [DOI] [PubMed] [Google Scholar]
- Roseboom T., De Rooij S. & Painter R. (2006) The Dutch famine and its long‐term consequences for adult health. Early Human Development 82, 485–491. [DOI] [PubMed] [Google Scholar]
- Saha K.K., Frongillo E.A., Alam D.S., Arifeen S.E., Persson L.Å. & Rasmussen K.M. (2008) Appropriate infant feeding practices result in better growth of infants and young children in rural Bangladesh. The American Journal of Clinical Nutrition 87, 1852–1859. [DOI] [PMC free article] [PubMed] [Google Scholar]
- Snijder M.B., Van Dam R.M., Visser M. & Seidell J.C. (2006) What aspects of body fat are particularly hazardous and how do we measure them? International Journal of Epidemiology 35, 83–92. [DOI] [PubMed] [Google Scholar]
- Stewart C.P., Christian P., Leclerq S.C., West K.P. Jr & Khatry S.K. (2009) Antenatal supplementation with folic acid + iron + zinc improves linear growth and reduces peripheral adiposity in school‐age children in rural Nepal. The American Journal of Clinical Nutrition 90, 132–140. [DOI] [PMC free article] [PubMed] [Google Scholar]
- UNICEF/UNU/WHO (1999) Composition of a Multiple Micronutrient Supplement to be used in Pilot ProGrammes among Pregnant Women in Developing Counries. Report of a Workshop Held at UNICEF Headquarters. UNICEF: New York. [Google Scholar]
- Vaidya A., Saville N., Shrestha B.P., Costello A.M., Manandhar D.S. & Osrin D. (2008) Effects of antenatal multiple micronutrient supplementation on children's weight and size at 2 years of age in Nepal: follow‐up of a double‐blind randomised controlled trial. Lancet 371, 492–499. [DOI] [PMC free article] [PubMed] [Google Scholar]
- Wells J.C. & Fewtrell M.S. (2006) Measuring body composition. Archives of Disease in Childhood 91, 612–617. [DOI] [PMC free article] [PubMed] [Google Scholar]
- Wells J.C., Chomtho S. & Fewtrell M.S. (2007) Programming of body composition by early growth and nutrition. The Proceedings of the Nutrition Society 66, 423–434. [DOI] [PubMed] [Google Scholar]
- Yajnik C.S. (2004) Obesity epidemic in India: intrauterine origins? The Proceedings of the Nutrition Society 63, 387–396. [DOI] [PubMed] [Google Scholar]
- Yajnik C.S., Fall C.H., Coyaji K.J., Hirve S.S., Rao S., Barker D.J. et al (2003) Neonatal anthropometry: the thin‐fat Indian baby. The Pune Maternal Nutrition Study. International Journal of Obesity and Related Metabolic Disorders 27, 173–180. [DOI] [PubMed] [Google Scholar]