Abstract
This paper aims to introduce a method for mapping local service provision to local demographic and health outcome data, to inform evidence‐based policy and practice in public health. A mapping exercise was conducted in London, England with the aims of: (1) describing services provided for breastfeeding women in primary and tertiary health care sectors and government, voluntary and private sectors; and (2) linking this information with routine data on deprivation, breastfeeding rates and health outcomes. Quantitative data on local breastfeeding services were collected via an online questionnaire by a designated ‘mapping lead’ in each locality. Data were collected at the level of individual health care organisations on the provision, nature and management of breastfeeding services, and related organisational inputs such as leadership, staffing, accreditation and policy. Demographic and health outcome data were identified from existing routine national data collections. Ninety‐one per cent of eligible acute and primary care organisations participated in the mapping exercise. A range of mapping tools and profile were developed and launched in 2009 (http://atlas.chimat.org.uk/IAS/dataviews/view?viewId=66). These tools can be used for descriptive analyses of service provision on the basis of local need. Comparative analyses on the impact of service provision on breastfeeding or health outcomes will be feasible from 18 months of data collection onwards. This case study has demonstrated the potential utility of this mapping method to inform effective implementation and evaluation of public health policy in practice consistent with the World Health Organisation framework. Formal evaluation of the utility of the tools is recommended.
Keywords: public health, evidence‐based practice, breastfeeding health outcomes, evaluation, infant feeding
Introduction
An international gold standard for the development, implementation, monitoring and evaluation of evidence‐based policy in public health and practice has been developed for the World Health Organisation (WHO) by collaborative national centres of excellence in Chile and the UK (WHO 2007). This framework illustrates the cyclical nature of evidence to inform policy and local practice in public health and in turn, the generation of evidence from evaluation of local practice to inform public health policy and practice (WHO 2007) (Fig. 1).
Figure 1.
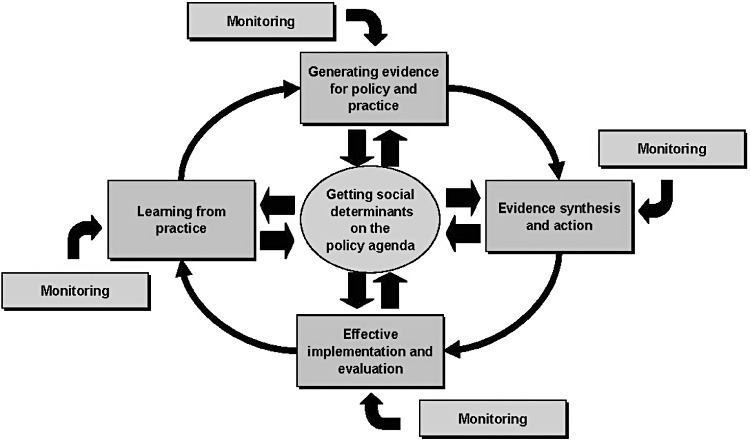
Framework for developing, implementing, monitoring and evaluating policy.
A fundamental constraint on the effective implementation of evidence‐based health care is the ability to tailor the intervention to the specific needs of different population groups in a range of settings (Muir Gray 2004; WHO 2007). Such service planning to meet the needs of local populations requires that good quality local information on the health needs, lifestyle behaviours and/or contributing factors such as deprivation is available (Muir Gray 2004).
No formal consensus on particular model(s) or tools to collect such local data, or for routine monitoring of evidence‐based policy in local practice, has been reached (WHO 2007) despite long‐standing recommendations for further research in this area (e.g. Flay 1986; Tilford 2000). Examples of international projects that collect and/or collate evidence from practice include contextual evidence gathered from observational studies or surveys (Aro 2008; Aro et al. 2008), social capital and community alliances and networks (Health Development Agency 2004; Gillies 1998) and a global interactive, web‐based atlas developed for the WHO to systematically map existing mental health resources (http://www.who.int/mental_health/evidence/atlas/en/).
The purpose of this paper is to introduce a method for collection and mapping of local data. Such mapping data could potentially be used to inform the effective implementation of national public health policy in practice, and to generate practice‐based evidence to inform future public health policy and practice. The paper presents a case study of a web‐based atlas for mapping local breastfeeding service provision to local demographic and health outcomes data across London, England. Breastfeeding is a good model for a case study as it is an important public health policy priority in the UK and internationally (WHO 2003; NICE 2011). The potential utility of this mapping model to improve local and national planning and purchasing of breastfeeding services and to generate practise‐based evidence of what works on the ground in different settings will be discussed.
Aims of mapping project
The substantial short‐, medium‐ and long‐term health risks of not breastfeeding for both mothers and babies are widely established (Kramer et al. 2001; Ip et al. 2007; Quigley et al. 2007), and the current policy recommendation in the UK is for exclusive breastfeeding for at least 6 months (Department of Health 2010). Despite this, in the UK, exclusive breastfeeding rates are very low (21% at 6 weeks), and 52% of women who do initiate breastfeeding discontinue within the first 6 weeks of birth (Bolling et al. 2007). Initiation, duration and exclusivity rates are especially low among young, white women on low incomes (Bartington et al. 2005; Bolling et al. 2007; Renfrew 2011).
Despite relatively high breastfeeding rates for London as a whole, England's capital city demonstrates marked area variations in the number of women who start to breastfeed (69% lowest to 96% highest) and in the number of women who are breastfeeding at 6–8 weeks (35% lowest to 83% highest). Consistent with national trends, the lowest breastfeeding rates are reported for areas with higher levels of deprivation and/or number of teenage pregnancies; these factors are reported to be particularly common in London compared with the rest of England (London Health Observatory/NHS London 2009). The significant health benefits of prolonged breastfeeding are still not being experienced by many mothers and babies in London therefore, particularly those living in deprived areas.
In recognition of this, the Department of Health London funded a project to map services for breastfeeding women in London. The overarching goal of the mapping was to provide essential information for commissioners and service providers to improve provision of appropriate local breastfeeding services on the basis of population need, to enable more women to start and to continue to breastfeed.
In the absence of a recognised mapping tool, the primary objective of the London Breastfeeding Mapping project was to develop and test the feasibility of a method for a mapping tool, which could present data on the provision of services and the use of routine National Health Service (NHS) data on population characteristics, in combination, to give a geographic and graphical means of showing comparative service provision for each Primary Care Trust (PCT). In addition, the mapping tool should have the potential to show trends over time to be used as an evaluation tool.
The specific aim and objectives of the project presented in this paper are presented in Fig. 2.
Figure 2.
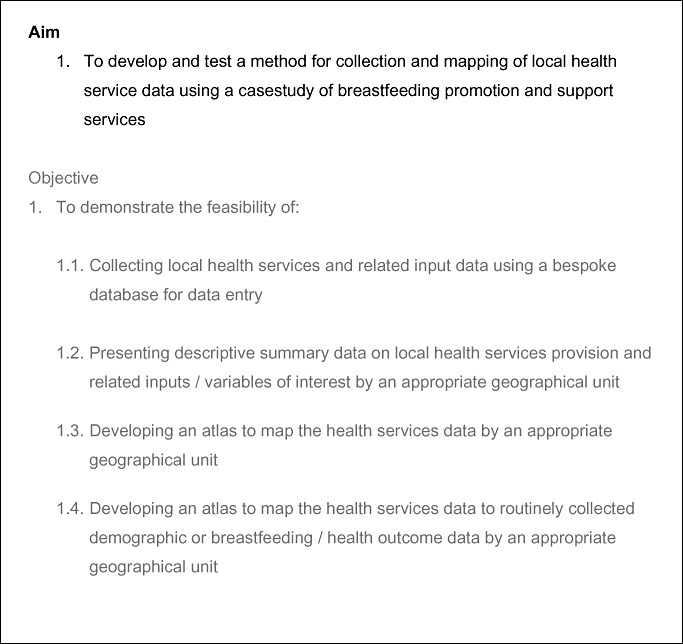
Aim and objectives of the London Breastfeeding Mapping Project.
Key messages
Population health services data can be collected and mapped onto routine demographic and outcome data for defined geographical areas.
Mapping tools can generate descriptive analyses of service provision on the basis of local need.
Within this study, mapping provided information for commissioners on the provision of breastfeeding promotion and support services for local women.
Over time, mapping data can provide comparative analysis on the possible impact of service provision on behavioural or health outcomes.
Further research is needed to evaluate the utility of mapping tools and their scope to include qualitative input from service users.
Materials and methods
New data on current breastfeeding service provision were collected via an online questionnaire and were then mapped with existing demographic and outcome data collected via national routine data collections.
Service data were collected at the level of individual primary or tertiary care organisations on the provision, nature and management of breastfeeding services for women and related organisational inputs such as leadership, staffing, accreditation with UNICEF Baby Friendly Initiative (http://www.babyfriendly.org.uk/page.asp?page=11) and breastfeeding policy. Breastfeeding services provided with or by other organisations, for example, local government and the independent sector were also included. The primary care organisations responsible for delivery of breastfeeding services for women in England are currently PCTs, which manage the provision of primary care services in a locality including services provided by doctors' surgeries, dental practices, opticians and pharmacies, although this structure is under review. Relevant acute trust‐based services provided by maternity units include antenatal, birthing, post‐natal and some community‐based services.
The PCT was selected as the most appropriate unit of analysis at that time for all service and outcome data. This decision reflects current NHS practice in England to map service use back to the PCT via registration with a general practitioner and the routine reporting of breastfeeding and health outcome data at the level of the PCT. Each PCT(s) served by an acute trust was identified in the data collection stage to enable acute services to be mapped back to the PCT. This structure is likely to change as a result of planned NHS changes (Health and Social Care Bill 2010–2011); if so, future mapping work would have to develop an appropriate unit of analysis within the new structures. Other units of analysis for which demographic and/or services data may be routinely collected and analysed within existing mapping tools include Local Authorities, Top Tier Local Authority, NHS Trust or Lower Super Output Areas.
Service data were collected by an identified ‘mapping lead’ who represented a primary or acute care organisation. The breastfeeding mapping model incorporated two characteristics we considered to be fundamental to the potential success of the mapping process. Firstly, the Infant Feeding Lead or equivalent was identified as the designated ‘mapping lead’ for breastfeeding services data in their geographical area. This person was employed by a PCT or acute trust and was responsible for promotion and support of local breastfeeding services. Secondly, we used an in‐depth questionnaire on breastfeeding services to collect data that were sufficiently detailed to enable analysis of the scope and quality of service provision within each health care organisation. It took approximately 20–30 min for each Infant Feeding Lead to record data for each breastfeeding service.
The content of the service data questionnaire was developed and piloted by the Infant Feeding Leads prior to adaptation and reformatting as an online data entry tool. The multidisciplinary mapping team provided three 5‐h face‐to‐face training sessions on data collection and entry using the bespoke online tool for Infant Feeding Leads. A total of 40/50 (80%) Infant Feeding Leads attended one training session with nearly one third (14/50) attending two sessions. An expert help desk provided daily telephone and email support for the mapping process. This ranged from advice on individual queries to tutorials for online data entry.
Service data were collected by Infant Feeding Leads over a 3‐month period, to provide a snapshot of breastfeeding services and related inputs at or around 30 June 2009. A copy of the dataset was frozen for baseline data for future trend analyses.
Following completion of data collection, the appropriate senior manager at each relevant Trust, for example, the Head of Midwifery or Director of Public Health, signed off a pre‐designed report summarising reported breastfeeding services in their area.
A range of demographic, breastfeeding behaviour and health outcome variables and routine data sources were identified and assessed for inclusion in the mapping exercise at the level of the PCT. This was carried out by data analysts with expertise in routine maternal and child health datasets in the national Child and Maternal Health Observatory (ChiMat, http://www.chimat.org.uk/). Primary services data for the agreed variables were imported into the ChiMat dataset to generate a number of mapping outputs using existing electronic mapping software.
Full details of the study methods are available in the project report http://www.chimat.org.uk/resource/item.aspx?RID=98799.
Results
One hundred per cent of primary (n = 25 PCTs) and acute (n = 24 maternity units) care organisations (trusts) with an Infant Feeding Lead post participated in, and completed, data collection using the online bespoke database. This represented 100% (n = 24/24) of eligible acute trusts and 81% (n = 24/31) of eligible PCTs (six PCTs did not have an Infant Feeding Lead in post during the mapping). The high participation rates and compliance with data entry via the bespoke web site demonstrate that it is feasible to collect local breastfeeding services and related input data using this data collection method from a designated health professional within the topic area (Objective 1.1).
Following the successful importation of primary breastfeeding services data by geographical unit (PCT) into the ChiMat dataset, a range of descriptive and mapping outputs were generated for the London Breastfeeding Services Project (see Fig. 3) using existing mapping software. Live examples of these outputs can be accessed for each PCT via the web link provided. These outputs demonstrate the feasibility of incorporating primary breastfeeding services data and secondary routine data sources into the appropriate software to generate descriptive and analytical mapping outputs for a health service of interest (Objectives 1.2–1.4).
Figure 3.
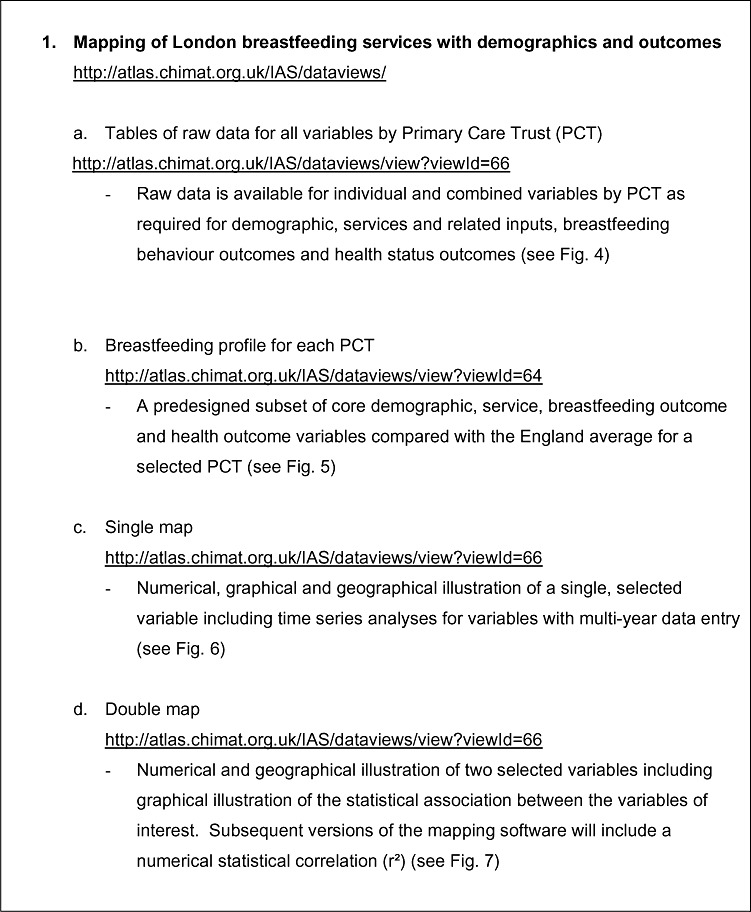
Mapping tools.
The raw data for each variable can be presented by PCT in table format for each of the individual or combined variables for the four data categories: (1) demographic; (2) breastfeeding services; (3) breastfeeding outcomes; and (4) health outcomes data. The table in Fig. 4 provides an illustration of a selection of variables from each category for a selection of PCTs. A full list of variables and associated tables is available for all PCTs via the link in Fig. 3. Preliminary analyses indicated that only 27% (15/55) of all providers (trusts) were delivering targeted services to any priority population group(s), with only 8% (21/266) of all breastfeeding services across London described as being targeted on the basis of local need. These data are based on the Infant Feeding Lead's assessment of a priority population group based on their knowledge of both, the evidence base, which identifies individual population groups least likely to breastfeed, e.g. young, white teenage women, and their local population needs.
Figure 4.
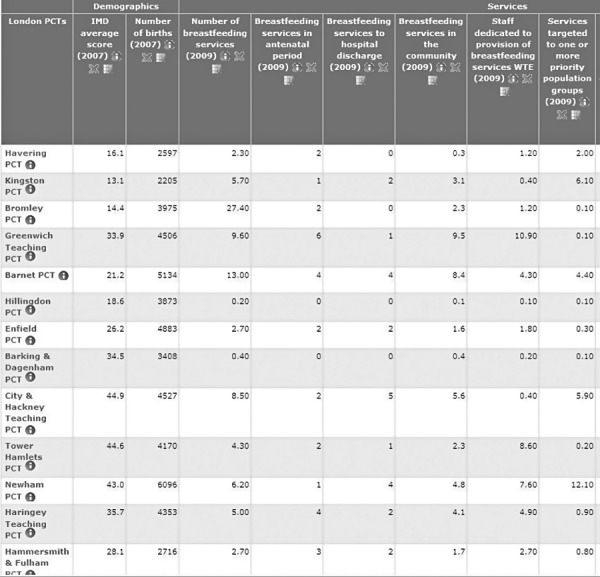
Table output by variable and Primary Care Trust (PCT).
Note:
Count. Services at provider trusts are apportioned to PCTs on the basis of number of deliveries in each PCT that it provides services for. This was calculated using HES data for 2007/08, HTG nodes N06, N07, N08, N09, N10 and N11. Further information: http://www.childrensmapping.org.uk/breastfeedinglondon/results/live.php
The breastfeeding profiles are a useful mapping output to provide a descriptive backdrop of core variables of interest by geographical unit. In the breastfeeding profiles, data for core demographic, breastfeeding outcome and health outcome variables are presented by PCT and compared with the England average for each variable (see Fig. 5). No comparisons are available for breastfeeding services data by PCT as these data are not available for the comparator, England. A guide to interpretation of mapping profiles is provided at http://atlas.chimat.org.uk/IAS/dataviews/infantmortalityprofile.
Figure 5.
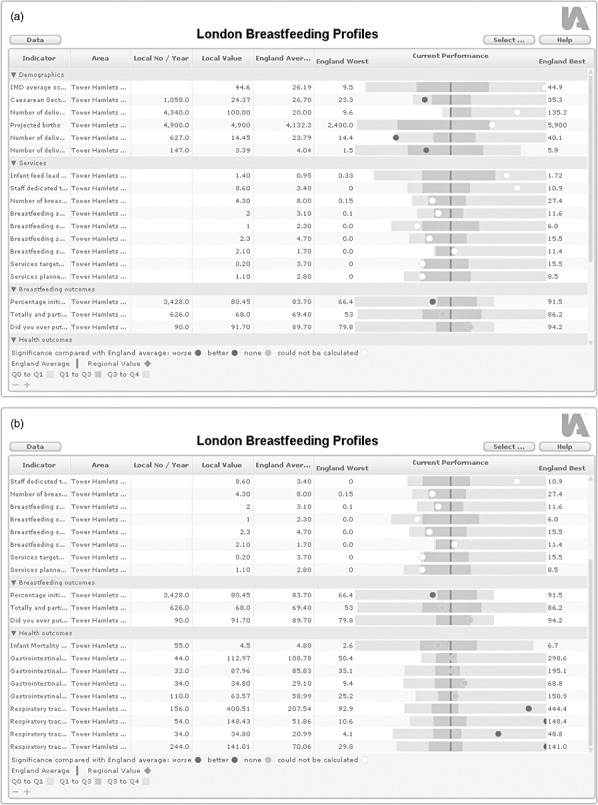
Breastfeeding profile by Primary Care Trust (PCT).
Breastfeeding services data have also been incorporated to generate single and double atlas analytical outputs. The single atlas tool maps services data by an appropriate geographical or organisational unit (in this case, the PCT) as per Objective 1.3. The double atlas tool maps services data by PCT with a second variable of interest, namely, demographic, breastfeeding behaviour or health outcome data (as per Objective 1.4). The strength of the association between the two variables is measured by the Pearson correlation coefficient test, and linear regression provides an estimate of the relationship between the two variables.
An illustration of a single atlas is provided in Fig. 6 including a table of raw count data for the selected variable by PCT together with a colour‐coded atlas and histogram to illustrate the distribution for that variable across all PCTs. The atlas presented in Fig. 6 provides a snapshot of total provision of breastfeeding services by PCT across London as of June 2009 (n = 266). As this mapping exercise was the first collection of breastfeeding services data across London, the atlas currently provides baseline data as of June 2009. Time series data would become available in the event of repeated data collections.
Figure 6.
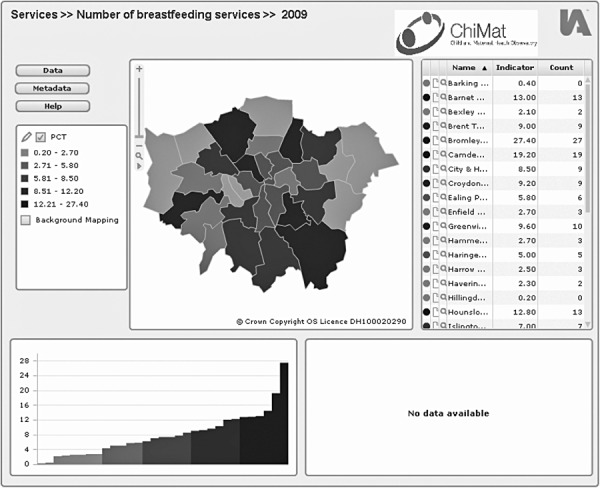
Number of reported breastfeeding services by Primary Care Trust (PCT), 30 June 2009.
Note:
Map 1: Number of breastfeeding services, 2009. Count: Total number of breastfeeding services as reported by Infant Feeding Lead. Indicator: Services at provider trusts are apportioned to PCTs on the basis of number of deliveries in each PCT that it provides services for. This was calculated using HES data for 2007/08, HRG codes N06, N07, N08, N09, N10 and N11. Further information: http://www.childrensmapping.org.uk/breastfeedinglondon/results/live.php
An illustration of a double atlas mapping breastfeeding services by PCT with level of deprivation (based on the Index of Multiple Deprivation average score for 2007) is provided in Fig. 7. While these preliminary data need to be treated with some caution, the graph suggests areas with greater deprivation do not appear to benefit from increased service provision. This is demonstrated by the very weak association between deprivation score and service provision with the correlation coefficient equal to −0.08 and the regression estimate of −0.05. Both statistics suggest that there is a negative relationship between deprivation and number of breastfeeding services.
Figure 7.
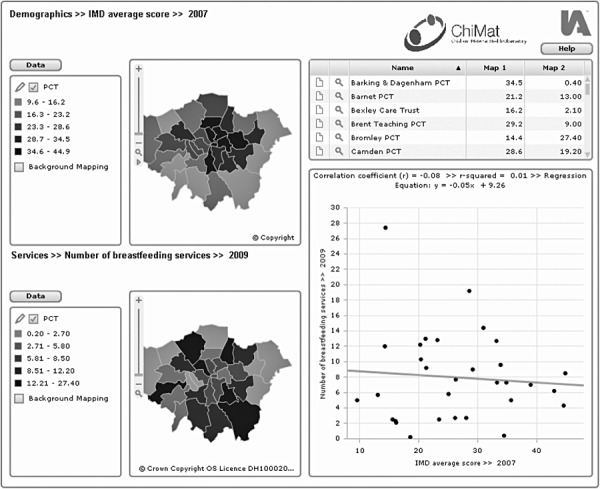
Number of reported breastfeeding services by deprivation (IMD score 2007) by Primary Care Trust (PCT), 30 June 2009.
Note:
Map 1: IMD average score, 2007.
The Index of Multiple Deprivation 2007 combines a number of indicators, chosen to cover a range of economic, social and housing issues into a single deprivation score for each small area in England. Population weighted average of the combined scores for the Lower Layer Super Output Areas (LSOAs) in a district. This measure is calculated by averaging the LSOA scores in each district after they have been population weighted. Further information: http://www.communities.gov.uk/communities/neighbourhoodrenewal/deprivation/deprivation07/
Map 2: Number of breastfeeding services, 2009.
Count: Total number of breastfeeding services as reported by Infant Feeding Lead.
Indicator: Services at provider trusts are apportioned to PCTs on the basis of number of deliveries in each PCT that it provides services for. This was calculated using HES data for 2007/08, HRG codes N06, N07, N08, N09, N10 and N11. Further information: http://www.childrensmapping.org.uk/breastfeedinglondon/results/live.php
The following double atlas (Fig. 8) provides an illustration of mapping breastfeeding services data by PCT with breastfeeding behaviour data, namely, the percentage of women initiating breastfeeding. Caution is required in interpreting these data as service data represent provision as of 30 June 2009, and breastfeeding behaviour data date from 2008 to 2009. However, this atlas illustrates a positive relationship between the number of breastfeeding services provided and the number of women initiating breastfeeding. This is demonstrated by a weak association between the number of breastfeeding services and initiation rates with the correlation coefficient equal to 0.27 and the regression estimate of 0.28. Both statistics suggest there is a weak but positive relationship between the number of breastfeeding services and the number of women initiating breastfeeding.
Figure 8.
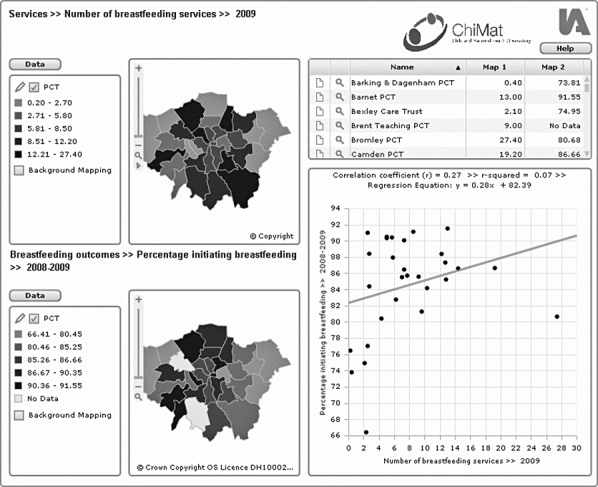
Number of reported breastfeeding services (30 June 2009) by percentage initiating breastfeeding (2008–2009) by Primary Care Trust (PCT).
Note:
Map 1: Number of breastfeeding services, 2009.
Count: Total number of breastfeeding services as reported by Infant Feeding Lead. Indicator: Services at provider trusts are apportioned to PCTs on the basis of number of deliveries in each PCT that it provides services for. This was calculated using HES data for 2007/08, HRG codes N06, N07, N08, N09, N10 and N11. Further information: http://www.childrensmapping.org.uk/breastfeedinglondon/results/live.php
Map 2: Percentage initiating breastfeeding 2008–2009.
Count: Number of mothers initiating breastfeeding as a percentage of maternities, collected quarterly by PCTs for Department of Health. Further information: http://www.dh.gov.uk/en/Publicationsandstatistics/Statistics/StatisticalWorkAreas/Statisticalpublichealth/index.htm
Data quality
The quality of breastfeeding service data was not independently validated. Measures to minimise quality concerns included signing off the summary mapping report by the appropriate senior manager of each unit, and independent data cleaning. Data cleaning was conducted by the research team who contacted the mapping lead for clarification where necessary. Specific areas for clarification included identifying the correct hospital within an NHS trust providing a service if more than one was listed, the amount of whole‐time equivalent (wte) staff per breastfeeding service or the total headcount of midwives per trust. The transparency of the breastfeeding services data, available on a public web site to users and colleagues, is also an integral measure to increase validity of the services data over time.
Areas where data appeared to be incomplete were the under‐reporting of services delivered as standard care, a designated postcode for each service and some services provided by third or private sectors.
Related demographic, breastfeeding behaviour and health outcome data have been collected through routine national data collections (e.g. Hospital Episode Statistics). Demographic data have undergone standard data cleansing and quality checking by the Office of National Statistics and Hospital Episode Statistics by The Information Centre for the Health and Social Care. The quality of data coverage of breastfeeding prevalence at 6–8 weeks is still variable and incomplete across PCTs in London. Twenty out of 31 PCTs met the minimum standard (85% data coverage in Quarter 4) for 2008–2009 (http://www.dh.gov.uk/en/Publicationsandstatistics/Statistic/StatisticalWorkAreas/Statisticalpublichealth/DH-124185#_1).
A number of assumptions underpin these data and should be taken into account when interpreting analyses (see Fig. 9). In particular, the potential to evaluate the impact of breastfeeding services by mapping service or breastfeeding behaviour data with health outcome data warrant caution because of the time lags between datasets and the variable relationship between infant feeding and different health outcomes measured at different ages.
Figure 9.
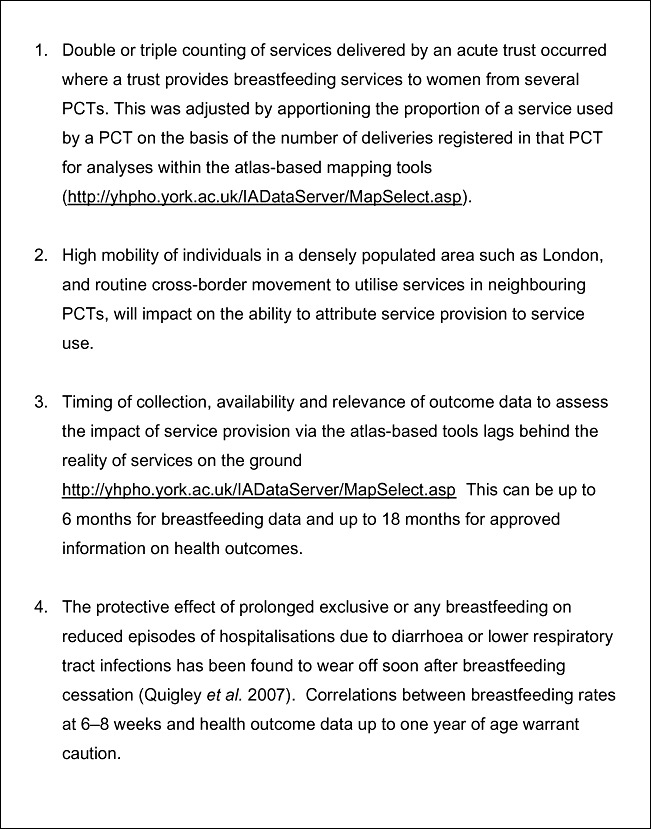
Data assumptions.
Discussion
This project has demonstrated the feasibility of this method firstly, to collect routine service provision data at local level, and secondly, to generate tools to map these data with local demographic data and potentially with outcome data. The mapping profiles and the facility to drill down into more detailed service data can be used to inform planning of local services on the basis of need, and they provide a baseline for monitoring changes over time. This functionality is comparable with the country profiles of the WHO global atlas on mental health resources (p7, WHO 2005). In the context of the WHO policy framework, mapping tools such as these are examples of a monitoring tool to aid effective implementation of evidence‐based policy and care in local practice (see Fig. 1 above).
Our experience suggests that these mapping tools may have the potential to be used as evaluation tools to undertake pragmatic assessments of ‘what works’ on the ground in different settings and/or among different population groups. Use of mapping tools to generate practice‐based evidence in this way may have the novel potential to provide routine and complementary streams of intelligence gathering for public health and/or health promotion services (WHO 2007). Future development of such tools could also engage families and/or service providers to include their feedback and local knowledge in routine surveillance systems.
These utilities could potentially result in more efficient use of limited resources through more effective planning, monitoring and evaluation of relevant evidence‐based services and better targeting of services to those with the greatest need.
The Public Health Outcomes Framework has identified breastfeeding as a priority, which is likely to have an impact on health service commissioning. Mapping of services, and relating service mapping to health outcomes, could become an important tool for commissioners and providers of breastfeeding services. Such mapping could extend beyond this topic area and inform the planning and monitoring of services related to other public health priority behaviours such as, smoking status at time of birth and outcomes such as infant mortality (Department of Health 2012). Future service mapping will have to consider any changes to NHS structures including an appropriate unit of analysis.
In summary, this approach has the potential to inform the effective implementation and evaluation of evidence‐based policy in practice. We recognise the assumptions underpinning the quality of data collected and therefore recommend that formal evaluation of the utilities of this mapping model should be conducted. This should include in‐depth analyses of the strengths and weaknesses of the model to perform both relatively simple and more complex mapping functions (Glasgow et al. 2003; Grol & Wensing 2004), including independent triangulation of the validity of existing data and an assessment of views of core stakeholders and users.
Source of funding
The research on which this paper is based was funded by the Regional Public Health Group, London, Department of Health.
Conflicts of interest
The authors declare that they have no conflicts of interest.
Contributions
LD, FE and FM implemented the London Mapping Project with support from SC, HD and MR. LD and FM wrote the first draft. All authors contributed to subsequent drafts and approved the final version.
Acknowledgements
The authors would like to thank all members of the project team (Di Barnes, Steven Bradley, Ethna Parker, Jenny Brown and Deborah Williams) and the advisory group (Obi Amadi, Sue Ashmore, Susan Bewley, Phyll Buchanan, Anna Burbidge, Arwen Folkes, Jane Hawdon, Elizabeth Garrett and Victoria Head). Particular thanks to the Infant Feeding Leads across London.
References
- Aro A.R. ( 2008. ) Contextual evidence in clinical medicine and health promotion . European Journal of Public Health 18 , 548 – 549 . [DOI] [PubMed] [Google Scholar]
- Aro A.R. , Smith J. & Joost D. ( 2008. ) Evidence‐based public health interventions: the challenge of context . European Journal of Public Health 18 ( Suppl. 1 ), 118 . [Google Scholar]
- Bartington S.E. , Foster L.J. & Dezateaux C. ( 2005. ) Evaluation of the UNICEF UK baby friendly initiative for the promotion of breastfeeding: findings from the Millennium Cohort Study . Archives of Disease in Childhood 90 ( Suppl. II ), A73 – A76 . [Google Scholar]
- Bolling K. , Grant C. , Hamlyn B. & Thornton A. ( 2007. ) Infant Feeding Survey 2005. A survey conducted on behalf of the Information Centre for Health and Social Care and the UK Health Departments by BMRB Social Research. London: The Information Centre .
- ChiMat Child and Maternal Health Observatory Available at: http://www.chimat.org.uk/
- Department of Health ( 2010. ) Healthy Lives, Healthy People: Our Strategy for Public Health in England 30 November 2010. Available at: http://www.dh.gov.uk/prod_consum_dh/groups/dh_digitalassets/@dh/@en/@ps/documents/digitalasset/dh_122347.pdf ISBN: 9780101798525 .
- Department of Health ( 2012. ) Improving Outcomes and Supporting Transparency A Public Health Outcomes Framework for England 2013–2016. 23rd January 2012. Available at: http://www.dh.gov.uk/en/Publicationsandstatistics/Publications/PublicationsPolicyAndGuidance/DH_132358
- Flay B.R. ( 1986. ) Efficacy and effectiveness trials (and other phases of research) in the development of health promotion programs . Preventive Medicine 15 , 451 – 474 . [DOI] [PubMed] [Google Scholar]
- Gillies P. ( 1998. ) The effectiveness of alliances and partnerships for health promotion . Health Promotion International 13 , 99 – 120 . [Google Scholar]
- Glasgow R.E. , Lichenstein E. & Marcus A.C. ( 2003. ) Why don't we see more translation of health promotion research to practice? Rethinking the efficacy‐to‐effectiveness transition . American Journal of Public Health 93 , 1261 – 1267 . [DOI] [PMC free article] [PubMed] [Google Scholar]
- Grol R. & Wensing M. ( 2004. ) Adopting best evidence in practice. What drives change? Barriers to and incentives for achieving evidence‐based practice . The Medical Journal of Australia 180 , S57 – S60 . [DOI] [PubMed] [Google Scholar]
- Health Development Agency ( 2004. ) Social capital. Working with and for communities . HDA Briefing No 21, June 2004 .
- Ip S. , Chung M. , Raman G. , Chew P. , Magula N. , DeVine D. et al . ( 2007. ) Breastfeeding and maternal and infant health outcomes in developed countries . Evidence Report/Technology Assessment, No.153. Rockville, MD: Agency for Healthcare Research and Quality . [PMC free article] [PubMed]
- Kramer M.S. , Chalmers B. , Hodnett E.D. , Sevkovskaya Z. , Dzikovich I. , Shapiro S. et al . ( 2001. ) Promotion of breastfeeding intervention trial (PROBIT): a randomized trial in the Republic of Belarus . Journal of the American Medical Association 285 , 413 – 420 . [DOI] [PubMed] [Google Scholar]
- London Health Observatory/NHS London ( 2009. ) Health and healthcare in London: key facts – January 2009 .
- Muir Gray J.A. ( 2004. ) Evidence based policy making (editorial) . BMJ (Clinical Research Ed.) 329 , 988 – 989 . [DOI] [PMC free article] [PubMed] [Google Scholar]
- NICE ( 2011. ) Improving the nutrition of pregnant and breastfeeding mothers and children in low‐income households; public health guidance 11 . National Institute for Health and Clinical Excellence. London .
- Quigley M.A. , Kelly Y.J. & Sacker A. ( 2007. ) Breastfeeding and hospitalization for diarrheal and respiratory infection in the United Kingdom Millennium Cohort Study . Jornal de Pediatria 119 , e837 – e842 . DOI:10.1542/peds.2006‐2256 . [DOI] [PubMed] [Google Scholar]
- Renfrew M.J. ( 2011. ) Infant Feeding Survey 2010, Early Results. The Information Centre for health and social care .
- Tilford S. ( 2000. ) Evidence‐based health promotion (editorial) . Journal of Health Education Research 15 , 659 – 663 . [DOI] [PubMed] [Google Scholar]
- World Health Organization (WHO) ( 2003. ) Global Strategy for Infant and Young Child Feeding . WHO; : Geneva . [Google Scholar]
- World Health Organization (WHO) ( 2005. ) Mental Health Atlas, Mental Health: Evidence and Research, Department of Mental Health and Substance Abuse . World Health Organization; : Geneva . ISBN 92 4 156296 X . [Google Scholar]
- World Health Organization (WHO) ( 2007. ) The social determinants of health: developing an evidence base for political action . Kelly MP, Morgan A, Bonnefoy J, Butt J, Bergman V., Measurement and Evidence Knowledge Network, Universidad del Desarrollo, Chile & National Institute for Health and Clinical Excellence, UK .


