

Abstract
Age‐appropriate infant and young child feeding (IYCF) practices are critical to child nutrition. The objective of this paper was to examine the associations between age‐appropriate IYCF practices and child nutrition outcomes in India using data from ∼18 463 children of 0–23.9 months old from India's National Family Health Survey, 2005–06‐3. The outcome measures were child height‐for‐age z‐score (HAZ), weight‐for‐age z‐score (WAZ), weight‐for‐height z‐score, stunting, underweight and wasting. Linear and logistic regression analyses were used, accounting for the clustered survey data. Regression models were adjusted for child, maternal, and household characteristics, and state and urban/rural residence. The analyses indicate that in India suboptimal IYCF practices are associated with poor nutrition outcomes in children. Early initiation of breastfeeding and exclusive breastfeeding were not associated with any of the nutrition outcomes considered. Not consuming any solid or semi‐solid foods at 6–8.9 months was associated with being underweight (P < 0.05). The diet diversity score and achieving minimum diet diversity (≥4 food groups) for children 6–23 months of age were most strongly and significantly associated with HAZ, WAZ, stunting and underweight (P < 0.05). Maternal characteristics were also strongly associated with child undernutrition. In summary, poor IYCF practices, particularly poor complementary foods and feeding practices, are associated with poor child nutrition outcomes in India, particularly linear growth.
Keywords: nutrition, India, child, infant and young child feeding, survey
Introduction
India carries almost 31% of the burden of child stunting in the world (UNICEF 2009). Poor child nutrition is known to be associated with poor survival outcomes (Black et al. 2008) and poor long‐term outcomes such as school performance and wages in adulthood (Hoddinott et al. 2008). Therefore, there is an urgent need to accelerate efforts to improve child nutrition in India. The patterns of undernutrition both globally (Victora et al. 2010) and in India (Arnold et al. 2009) indicate that the time between conception and age 2 years is the definitive period during which interventions to improve nutrition must be delivered. The evidence on the effectiveness of interventions indicates that poor infant and young child feeding (IYCF) practices are a significant contributor to poor nutrition in many countries, and that improving IYCF practices can yield substantial benefits (Bhutta et al. 2008).
The role of IYCF practices in relation to nutrition outcomes has been studied for some years now. Numerous studies have documented the role of diet diversity in relation to anthropometric outcomes (Ruel & Menon 2002; Arimond & Ruel 2004; Sawadogo et al. 2006; Moursi et al. 2009; Marriott et al. 2010). With the emergence of updated indicators to capture the quality of IYCF practices (Daelmans et al. 2009), and the availability of data at the national level on IYCF, it is now possible to examine more comprehensively the role of IYCF in improving nutrition outcomes in young children. Research on the role of IYCF practices in relation to nutrition outcomes in India is limited. The majority of the literature in India has focused on documenting the state of IYCF practices, rather than assessing the contribution of poor IYCF practices to the high levels of undernutrition. For example, analyses based on the IYCF indicators by World Health Organization (WHO) and India's National Family Health Survey 2005–06‐3 (NFHS‐3) data show that breastfeeding in India is almost universal, but that the rates of early initiation of breastfeeding, exclusive breastfeeding up to 6 months, and timely complementary feeding are very poor (Patel et al. 2010). A pooled analysis of data from 14 countries, including India, indicates that diet diversity is an important predictor of stunting (Marriott et al. 2010); however, this analysis does not allow an understanding of how the indicators relate in the context of India. Small‐scale studies support these findings, documenting suboptimal breastfeeding and/or complementary feeding practices from across the country (Khan 1990; Aggarwal et al. 1998; Gupta et al. 2010; Ramachandran 2010). Only one small‐sample study has examined the role of a few IYCF practices in relation to undernutrition, and showed that initiating breastfeeding after 6 h of birth, avoiding colostrum in the first days of life, and poor complementary feeding practices were risk factors for underweight but not wasting (Kumar et al. 2006). In summary, comparability across the many small‐scale cross‐sectional studies is weak; many have examined patterns of child feeding and their socio‐economic determinants, but have rarely included the spectrum of IYCF practices. Nationally, earlier NFHS survey rounds in 1992 and 1999 included data on some IYCF practices; however, only NFHS‐3 2005–06 included the full complement of IYCF indicators, thus making it possible to conduct analyses similar to those conducted for other countries in Latin America and Africa on the association of IYCF practices with child nutrition outcomes (Ruel & Menon 2002; Arimond & Ruel 2004; Sawadogo et al. 2006).
The primary objective of this paper is to examine the association between IYCF practices and different dimensions of child nutrition using nationally representative data from India. The primary hypothesis is that better IYCF practices are associated with better child nutrition outcomes.
Key messages
Infant and young child feeding practices in India are very poor.
Complementary feeding practices, especially diet diversity, are strongly associated with child undernutrition.
Maternal factors such as education, maternal nutrition and age at first birth are also strong determinants of children's nutritional status.
Interventions to improve nutrition must span the period from pre‐pregnancy to the first 2 years of life, addressing post‐natal care and feeding, as well as maternal factors.
Data and methods
Ethics statement
The data were analysed anonymously using publicly available survey data.
Data
We analysed publicly available data from NFHS‐3 2005–06, the Indian version of the Demographic and Health Surveys (DHS). With a multistage cluster sampling design, the survey collected data on fertility, mortality, family planning, and important aspects of nutrition, health, and health care using the DHS standard model questionnaires designed for, and widely used in, developing countries. Data from the children's recoded data set – containing one record for every child born in the last 5 years (0–59.99 months of age) to the women included in the survey – were used in this analysis. For the purpose of this analysis, the data on infants and young children 0–23.99 months old (N∼18 463) were used. The individual response rate for women was 94.5% in 2005. Regression analysis includes only the youngest child in each family as dietary diversity data are only available for this child. Where data were missing for any variable, the observation was not included in the analysis.
Figure 1 shows the original sample size for NFHS‐3 and provides details of inclusion and exclusion criteria, and the final sample for this analysis. In the 0–23.99‐month age group, the number of children for whom all independent variables were available was 14 257. In the sub‐age groups for the analysis, i.e. 0–5.99, 6–8.99, 6–23.99, 12–15.99 and 20–23.99 months, the final analytic sample sizes were 3740, 2064, 10 517, 3151 and 2104, respectively. The control variable that caused the largest reduction in the final analytic sample was caste; however, as the descriptive results in the NFHS‐3 report and the literature from India suggests that caste is closely associated with poorer health and nutrition outcomes in children, we chose to use this reduced sample size rather than exclude the variable from the regression model. We also compared the sample characteristics for the sample included in the regression model with the full sample, and found no differences, thus enhancing the overall confidence in the data available for this analysis.
Figure 1.
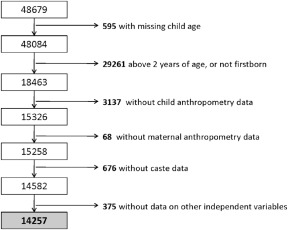
Final analytic sample and sample size, NFHS‐3 (2005–06). The figure shows how the final analytic sample used in this study was derived from the NFHS‐3 children's recoded data set. It depicts the application of exclusion criteria based on child age and birth order, and also availability of critical variables for the regression models. NFHS, National Family Health Survey, 2005–06‐3.
The NFHS‐3 survey, as with other DHS surveys, provides child age only in months, rather than in days. The WHO IYCF indicators, however, require the use of age in days. Hence, age in days was derived from age in months by multiplying with 365 and dividing by 12, and then using the resultant age in days to construct the age groups as recommended by the operational guidance for construction of the IYCF indicators (WHO 2010). Regression analyses that included the age groups constructed on the basis of age in months were also run to check the validity of the results; no substantial difference was found between the two approaches.
Children's height and weight were measured using the WHO international growth reference standards (de Onis et al. 2009) to compute z‐scores for height‐for‐age (HAZ), weight‐for‐age (WAZ) and weight‐for‐height (WHZ). Children who were 2 z‐scores below the median of the reference standards for these indicators were classified as stunted, underweight or wasted, respectively.
Predictor variables: core IYCF indicators
The key exposure variables were eight core indicators and four optional indicators of IYCF practices, based on the WHO Indicators for Assessing Infant and Young Child Feeding Practices (Daelmans et al. 2009). Indicators were age specific for children in the following age groups: 0–23.99, 0–5.99, 12–15.99, 6–8.99, 6–23.99 and 20–23.99 months. These predictor variables, the main IYCF indicator variables, are described in Box 1. All indicators were calculated using WHO‐ recommended guidelines (WHO 2010).
Box 1. WHO‐recommended core and optional indicators for measuring IYCF practices (WHO 2010).
| Core indicators | |
| 1. Early initiation of breastfeeding | Children 0–23.99 months who were breastfed within 1 h of birth |
| 2. Exclusive breastfeeding under 6 months | Children 0–5.99 months of age who had consumed nothing other than breast milk |
| 3. Continued breastfeeding at 1 year | Children 12–14.99 months who were being still breastfed |
| 4. Introduction of solid, semi‐solid or soft foods | Children 6–8.99 months who received solid, semi‐solid or soft foods at least once on the day preceding the survey date |
| 5. Minimum dietary diversitya | Children 6–23.99 months who received four or more food groups out of seven food groups [grains, roots and tubers, legumes and nuts, dairy products (milk, yogurt, cheese), flesh foods (meat, fish, poultry and liver/organ meats), eggs, vitamin‐A‐rich fruits and vegetables, and other fruits and vegetables] |
| 6. Minimum meal frequency | Breastfed children 6–23.99 months who were fed a minimum recommended number of times each day (age‐group specific) |
| 7. Minimum acceptable diet | Children 6–23.99 months old who met age‐specific minimum recommended diet diversity and minimum recommended meal frequency and consumed a source of dairy (or were breastfed) |
| 8. Consumption of iron‐rich or iron‐fortified foods indicator | Children 6–23.99 months who received iron‐rich/iron‐fortified foods |
| Optional indicators | |
| 1. Continued breastfeeding at 2 years | Children 21–23.99 months who were still breastfed |
| 2. Age‐appropriate breastfeeding | Age‐appropriate patterns of breastfeeding for children 0–23.99 months (i.e. exclusively breastfed for children 0–5.99 months old; still breastfed for children 6–23.99 months) |
| 3. Predominant breastfeeding under 6 months | Children 0–5.99 months old, receiving breast milk and other non‐nutritive liquids (e.g. water) |
| 4. Bottle feeding | Children 0–23.99 months old, who were fed with a bottle in the last 24 h |
In the analyses in this paper, we also use a continuous diet diversity measure, which is created by summing up the number of food groups consumed by the child 6–23.99 months old in the previous 24 h, and ranges from 0 to 7. This score is created based on the WHO‐recommended classification of foods into food groups and is a prerequisite to developing the minimum dietary diversity indicator.
Other variables
The regression analyses included variables that were chosen based on knowledge about factors that can influence nutritional status globally and in India, as well as IYCF practices, and thus could be potential confounders. Previous analyses that have assessed the association between IYCF practices and nutrition outcomes have also included these predictors (Arimond & Ruel 2004; Zongrone et al. 2012). These include child age (in months), child age (squared), size of child at birth, child sex, age of mother at first birth, maternal employment status in the 12 months preceding the survey date, maternal height, maternal body mass index (BMI), maternal education, prenatal care visit, wealth index factors, current breastfeeding status of the child, number of children, frequency of reading newspaper or magazine, frequency of listening to radio, frequency of watching television, household head's social identity (caste/tribe) and religion, maternal diet diversity (all as reported by the mother) and location (dummies for states in India).
Household wealth was measured using an index based on ownership of household assets (e.g. television, mattress, cattle), types of water access, and sanitation facilities, and was included in the NFHS‐3 data set. We constructed a maternal diet diversity variable based on reported frequency of maternal consumption of different food groups. Daily or weekly consumption of each item was coded as 1, never or occasionally as 0, and data on all food groups were combined to summarise maternal dietary diversity.
Regression model
We used the svy technique in Stata 11 (StataCorp, College Station, TX, USA) to account for the complex survey structure of the NFHS‐3, including survey strata and sampling weights. Linear regression models were used for continuous outcome variables and logit regression models for binary outcome variables, adjusting for all variables above. Each regression model followed the approach noted below:
Separate models were run for the combination of each anthropometric outcome variable and each IYCF indicator using the age‐appropriate analytic sample for the indicator. Thus, for HAZ as a dependent variable, a total of 13 separate linear regression models were run to test associations with each core and optional IYCF indicator. This was repeated for all anthropometric outcome variables, 6 outcomes in total – 3 continuous (HAZ, WAZ, WHZ) and 3 binary (stunting, underweight, wasting).
Results
Sample characteristics
Table 1 describes the characteristics of the sample included in the regression analysis. In the sample, the mean HAZ, WAZ and WHZ were −1.46, −1.62 and −1.11, respectively. The patterns of HAZ, WAZ and WHZ by child age (Fig. 2) are similar to those seen in other developing countries and emphasise the importance of the first 2 years of life for growth faltering. The proportions of children stunted, underweight and wasted were 38.77%, 38.33% and 26.36%, respectively.
Table 1.
Sample characteristics (children 0–23.99 months of age)
| Sample characteristics | Mean (SD) |
|---|---|
| Child characteristics | |
| Male (%) | 52.13 |
| Anthropometry; mean (SD) | |
| HAZ | −1.46 (0.02) |
| WAZ | −1.62 (0.02) |
| WHZ | −1.11 (0.02) |
| Prevalence of stunting (%) | 38.77 |
| Prevalence of underweight (%) | 38.33 |
| Prevalence of wasting (%) | 26.36 |
| Prevalence of small size at birth (%) (mothers' observations) | 22.93 |
| Maternal characteristics; mean (SD) | |
| Age of mother at first birth | 19.46 (0.04) |
| Maternal height (cm) | 151.62 (0.06) |
| Maternal BMI | 19.72 (0.04) |
| Maternal education (% uneducated) | 47.11 |
| Maternal employment (% employed in the last 12 months) | 32.51 |
| Number of children (aged 5 years and under) | 1.81 (0.01) |
| Prenatal care visits (% of less than 4) | 63.73 |
| Mothers who never read newspaper or magazine (%) | 72.78 |
| Mothers who never listened to radio (%) | 59.29 |
| Mothers who never watched television (%) | 44.75 |
| Household characteristics | |
| Place of residence (% rural) | 74.72 |
| Wealth quintiles (% of households) | |
| Poorest | 24.92 |
| Poorer | 22.34 |
| Middle | 19.62 |
| Richer | 18.12 |
| Richest | 15.00 |
| Caste composition (% of households) | |
| SC | 21.53 |
| ST | 10.02 |
| OBC | 41.65 |
| Others (%) | 26.80 |
| Religious composition (% households) | |
| Hindu | 78.04 |
| Muslim | 17.17 |
| Christian | 2.01 |
| Sikh | 1.30 |
| Others (%) | 1.47 |
HAZ, height‐for‐age z‐scores; WAZ, weight‐for‐height z‐scores; WHZ, weight‐for‐height z‐scores; SC, scheduled caste; ST, scheduled tribe, OBC, other backward caste; SD, standard deviation; BMI, body mass index.
Figure 2.
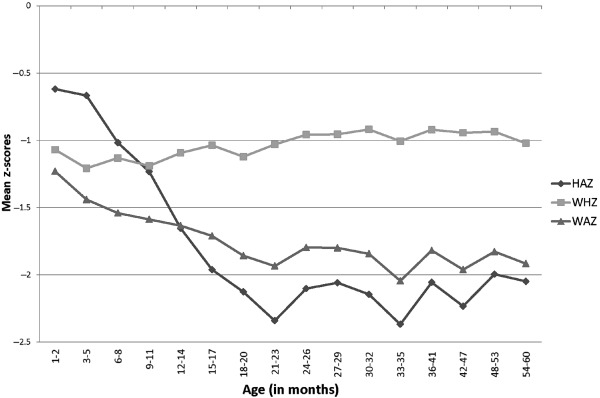
Height‐for‐age, weight‐for‐age and weight‐for‐height z‐scores by child age (months), National Family Health Survey, 2005–06. The figure shows the mean z‐scores by child age (months). It depicts how anthropometric outcomes for children worsen with increasing child age. NFHS, National Family Health Survey, 2005–06‐3.
The status of IYCF practices in India is poor, overall, as seen in Fig. 3. Only continued breastfeeding at age 12–15 months is high (85%) while all other IYCF practices, especially complementary feeding practices, are particularly poor.
Figure 3.
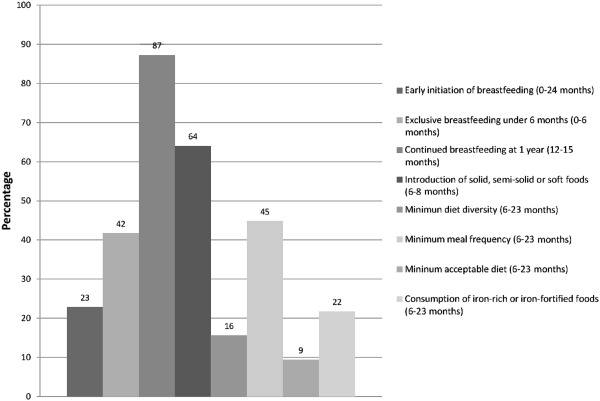
Status of WHO‐recommended IYCF indicators, National Family Health Survey, 2005–06. The figure shows the prevalence of the WHO‐recommended infant and young child feeding (IYCF) practices using the globally recommended indicators for these practices. IYCF, infant and young child feeding; WHO, World Health Organization.
Regression results
The full set of regression results for the IYCF indicators is summarised in Table 2. Each cell in Table 2 presents the regression coefficient and confidence interval (CI) for the IYCF indicator, obtained from the regression model that tested the association of that indicator with the dependent variable in question. Thus, for each IYCF indicator, the regression coefficients are presented for a total of six dependent variables, each coefficient obtained from a different regression model for that IYCF indicator‐dependent variable combination. Table 3 presents the detailed regression results for the association between dietary diversity and mean anthropometric outcomes to illustrate the results obtained from each single regression model.
Table 2.
Summary of associations between WHO‐recommended IYCF indicators and anthropometric outcomes †
| IYCF indicator | Age group for regression analysis (N) | Mean anthropometric outcomes | Prevalence of undernutrition | ||||
|---|---|---|---|---|---|---|---|
| HAZ | WAZ | WHZ | Stunting | Underweight | Wasting | ||
| Core indicators | |||||||
| 1. Early initiation of BF | 0–23.99 months (14 257) | −0.01 (−0.10; 0.07) | 0.01 (−0.05; 0.07) | 0.04 (−0.03; 0.11) | 1.10 (0.98; 1.25) | 0.95 (0.84; 1.07) | 0.93 (0.82; 1.06) |
| 2. EBF | 0–5.99 months (3740) | −0.12 (−0.28; 0.04) | −0.05 (−0.17; 0.07) | 0.05 (−0.11; 0.20) | 1.08 (0.84; 1.40) | 1.04 (0.83; 1.29) | 0.96 (0.76; 1.20) |
| 3. Continued BF at 1 year | 12–15 months (3151) | −0.14 (−0.37; 0.08) | −0.003 (−0.17; 0.17) | 0.09 (−0.09; 0.27) | 1.05 (0.77;1.45) | 0.81 (0.59; 1.13) | 0.89 (0.61; 1.29) |
| 4. Introduction of solids/semi‐solids for 6–8‐month‐olds | 6–8.99 months (2064) | 0.13 (−0.07; 0.33) | 0.10 (−0.06; 0.25) | 0.03 (−0.15; 0.21) | 0.78 (0.58; 1.06) | 0.75* (0.56; 0.99) | 1.11 (0.82; 1.49) |
| 5. Diet diversity (continuous) | 6–23.99 months (10 517) | 0.09*** (0.06; 0.12) | 0.06*** (0.04; 0.09) | 0.02 + (−0.004; 0.05) | 0.90*** (0.85; 0.94) | 0.88*** (0.84; 0.93) | 0.96 (0.91; 1.02) |
| 6. Minimum diet diversity (dichotomous) | 6–23.99 months (10 517) | 0.19*** (0.09; 0.29) | 0.14*** (0.06;0.21) | 0.05 (−0.03; 0.14) | 0.76*** (0.65; 0.89) | 0.77** (0.65; 0.92) | 0.91 (0.75; 1.10) |
| 7. Minimum meal frequency | 6–23.99 months (8802) | 0.08 + (−0.004; 0.16) | 0.06 + (−0.001; 0.12) | 0.02 (−0.05; 0.09) | 0.94 (0.83; 1.07) | 0.90 + (0.79; 1.01) | 0.96 (0.84; 1.10) |
| 8. Minimum acceptable diet | 6–23.99 months (8802) | 0.15* (0.02; 0.28) | 0.13** (0.04; 0.22) | 0.07 (−0.03; 0.18) | 0.88 (0.71; 1.08) | 0.90 (0.73;1.11) | 0.86 (0.68; 1.10) |
| 9. Iron‐rich foods | 6–23.99 months (10 517) | 0.03 (−0.06; 0.11) | 0.02 (−0.04; 0.09) | 0.02 (−0.06; 0.10) | 0.95 (0.83; 1.10) | 0.93 (0.81; 1.08) | 1.07 (0.92; 1.26) |
| Optional indicators | |||||||
| 1. Continued BF | 20–23.99 months (2104) | −0.18 + (−0.37; 0.01) | −0.21** (−0.36; −0.06) | −0.15 + (−0.31; 0.01) | 1.21 (0.90; 1.63) | 1.48* (1.08; 2.03) | 1.44 + (0.99; 2.08) |
| 2. Age‐appropriate BF | 0–23.99 months (14 257) | −0.01 (−0.09; 0.08) | 0.08* (0.01; 0.15) | 0.06 (−0.02; 0.14) | 0.98 (0.85;1.12) | 0.84** (0.74; 0.96) | 0.96 (0.84; 1.10) |
| 3. Predominant BF | 0–5.99 months (3740) | −0.01 (−0.18; 0.16) | 0.07 (−0.05; 0.19) | 0.08 (−0.06; 0.24) | 0.98 (0.74; 1.28) | 0.95 (0.75; 1.21) | 0.95 (0.76; 1.19) |
| 4. Bottle feeding | 0–23.99 months (14 257) | −0.04 (−0.14; 0.06) | −0.10** (−0.18; −0.02) | −0.09* (−0.18; −0.0001) | 0.97 (0.84; 1.12) | 1.15 + (0.98; 1.34) | 1.20* (1.02; 1.41) |
IYCF, infant and young child feeding; WHO, World Health Organization; HAZ, height‐for‐age z‐scores; WAZ, weight‐for‐height z‐scores; WHZ, weight‐for‐height z‐scores; EBF, exclusive breast feeding; BF, breast feeding. + P < 0.1; *P < 0.05; **P < 0.01; ***P < 0.001. Confidence intervals in parenthesis. †Each cell in the table presents the regression coefficient and confidence interval for the association between the IYCF indicator in the specific row and the anthropometric outcome in the specific column. The figures in first three columns of the table are beta coefficients for the IYCF indicators from linear regression models, and the next three columns are odds ratios from logit models. All regression models adjusted for the variables were specified in the Methods section.
Table 3.
Associations between diet diversity scores and child anthropometry, children 6–23.99 months (linear regression results)
| Dependent variables→ | HAZ | WAZ | WHZ |
|---|---|---|---|
| Independent variables↓ | Coefficient | Coefficient | Coefficient |
| Diet diversity (continuous) | 0.09*** | 0.06*** | 0.02 + |
| Child age (months) | −0.21*** | −0.03 | −0.003 |
| Child age (squared) | 0.004*** | −0.0003 | 0.0001 |
| Size of child at birth (reported) | |||
| Larger than average vs. very large | −0.15 | −0.18* | −0.14 |
| Average vs. very large | −0.17 | −0.21** | −0.17* |
| Smaller than average vs. very large | −0.36*** | −0.51*** | −0.44*** |
| Very small vs. very large | −0.51*** | −0.71*** | −0.62*** |
| Child sex (reference: male) | −0.14*** | −0.04 | −0.01 |
| Age of mother at first birth | 0.01 + | 0.005 | −0.001 |
| Whether mother worked in the last 12 months | |||
| In the past year vs. not working | −0.02 | −0.07 | −0.08 |
| Currently working vs. not working | −0.11* | −0.14*** | −0.11** |
| Has a job, but on leave last 7 days vs. not working | 0.08 | 0.06 | 0.01 |
| State dummies | Yes | Yes | Yes |
| Maternal height (cm) | 0.06*** | 0.04*** | 0.01*** |
| Maternal BMI | 0.01* | 0.03*** | 0.03*** |
| Maternal education | |||
| Primary vs. none | 0.04 | 0.06 | 0.06 |
| Secondary vs. none | 0.03 | 0.09* | 0.12* |
| Prenatal care visit | |||
| 1–3 vs. none | 0.11 + | 0.11* | 0.07 |
| 4+ vs. none | 0.22** | 0.21*** | 0.12* |
| Wealth index factors | |||
| Poorer vs. Poorest | 0.20** | 0.13** | 0.03 |
| Middle vs. Poorest | 0.17* | 0.21*** | 0.16** |
| Richer vs. Poorest | 0.25** | 0.30*** | 0.22*** |
| Richest vs. Poorest | 0.58*** | 0.50*** | 0.27*** |
| Still breastfed | −0.13* | −0.09* | −0.05 |
| Number of children | −0.04* | −0.03 + | −0.01 |
| Frequency of reading newspaper or magazine | |||
| Less than once a week vs. not at all | 0.05 | 0.07 | 0.03 |
| At least once a week vs. not at all | 0.15* | 0.11 + | 0.02 |
| Almost every day vs. not at all | 0.14 | 0.14* | 0.08 |
| Frequency of listening to radio | |||
| Less than once a week vs. not at all | 0.002 | −0.002 | −0.01 |
| At least once a week vs. not at all | 0.02 | −0.04 | −0.07 |
| Almost every day vs. not at all | −0.02 | −0.04 | −0.05 |
| Frequency of watching television | |||
| Less than once a week vs. not at all | 0.10 | 0.07 | 0.02 |
| At least once a week vs. not at all | −0.02 | 0.01 | 0.001 |
| Almost every day vs. not at all | 0.03 | 0.03 | 0.02 |
| Type of caste or tribe of household head | |||
| ST vs. SC | 0.16 + | −0.07 | −0.21** |
| OBC vs. SC | 0.16** | 0.13*** | 0.06 |
| None of the above vs. SC | 0.28*** | 0.23*** | 0.10 + |
| Household head's religion | |||
| Muslim vs. Hindu | −0.02 | −0.02 | −0.02 |
| Christian vs. Hindu | 0.004 | 0.17 | 0.22* |
| Sikh vs. Hindu | −0.06 | −0.01 | 0.02 |
| Other vs. Hindu | −0.008 | −0.035 | −0.05 |
| Maternal diet diversity | 0.02 | 0.01 | 0.005 |
| Constant | −9.10*** | −8.37*** | −3.85*** |
| N | 10 517 | 10 517 | 10 517 |
HAZ, height‐for‐age z‐scores; WAZ, weight‐for‐height z‐scores; WHZ, weight‐for‐height z‐scores; BMI, body mass index; ST, scheduled tribe; SC, scheduled caste; OBC, other backward caste. + P < 0.1; *P < 0.05; **P < 0.01; ***P < 0.001.
Among the core IYCF indicators, improved dietary diversity and minimum acceptable diet are associated with higher HAZ and WAZ (P < 0.05) as well as with lower odds of being stunted or underweight, after controlling for the variables described earlier. The timely introduction of solid, semi‐solid or soft foods is associated with a significantly decreased likelihood of being underweight (OR: 0.75, 95% CI: 0.56–0.99). The association between the dietary diversity indicator, and mean HAZ and WAZ individually is significant (P < 0.001). The models predict that as the dietary diversity score (continuous) rises by 1 point, HAZ rises by 0.09 and WAZ rises by 0.06. This translates to a difference of 0.54 HAZ between a child with diet diversity (DD) of 7 and a child with DD of 1, and a difference of 0.42 WAZ for the same comparison. Additionally, as diet diversity increases, the odds of stunting and underweight decrease (P < 0.05). For children who achieve a minimum diet diversity score, HAZ is higher by 0.19 and WAZ is higher by 0.14 (see Fig. 4 for adjusted mean HAZ, WAZ and WHZ by minimum dietary diversity); such children also have a lower odds of being stunted or underweight (OR: 0.76, 95% CI: 0.65–0.89; OR: 0.77, 95% CI: 0.65–0.92). The summary IYCF indicator of minimum acceptable diet predicts an increase of HAZ of 0.15 (P < 0.05) and that of WAZ of 0.13 (P < 0.01).
Figure 4.
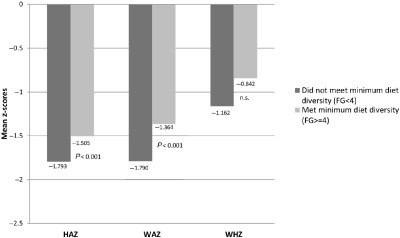
Adjusted mean height‐for‐age, weight‐for‐age and weight‐for‐height z‐scores among children 6–23.9 months old, by minimum dietary diversity, National Family Health Survey, 2005–06. Adjusted means are generated from multivariate regression models that adjust for child, maternal and household characteristics, state dummies, and survey sample clustering. Means are generated for children who achieved minimum diet diversity vs. those who did not, and depict the significant difference in anthropometric outcomes based on feeding status.
Based on WHO recommendations that the diet diversity indicator be further disaggregated and reported for children 6–11, 12–17 and 18–23 months of age, we examined the regression analyses separately by these age groups. Table 4 presents these results and shows that the associations between diet diversity and the minimum acceptable diet are stronger for children in the 18–23‐month age group than for children in the younger age groups.
Table 4.
Summary of age‐specific regression coefficients for associations between anthropometric outcomes and diet diversity and minimum acceptable diet †
| IYCF indicator | Sample size for regression analysis (N) | Mean anthropometric outcomes | Prevalence of undernutrition | ||||
|---|---|---|---|---|---|---|---|
| HAZ | WAZ | WHZ | Stunting | Underweight | Wasting | ||
|
Diet diversity (continuous) 6–23 months | |||||||
| 6–11 months | (3256) | 0.06 + (−0.003; 0.12) | 0.02 (−0.03; 0.07) | −0.02 (−0.08; 0.04) | 0.95 (0.85; 1.06) | 0.94 (0.84; 1.04) | 1.08 (0.97; 1.19) |
| 12–17 months | (4530) | 0.08*** (0.03; 0.13) | 0.05** (0.02; 0.09) | 0.01 (−0.02; 0.05) | 0.90** (0.84; 0.96) | 0.90** (0.83; 0.96) | 0.95 (0.88; 1.04) |
| 18–23 months | (2731) | 0.13*** (0.07; 0.18) | 0.12*** (0.08; 0.16) | 0.08** (0.03; 0.12) | 0.85*** (0.77; 0.93) | 0.79*** (0.71; 0.88) | 0.84** (0.75; 0.94) |
|
Minimum acceptable diet 6–23 months | |||||||
| 6–11 months | (3043) | 0.07 (−0.24; 0.37) | 0.09 (−0.13; 0.32) | 0.09 (−0.17; 0.34) | 1.21 (0.68; 2.15) | 0.97 (0.52; 1.79) | 0.93 (0.51; 1.70) |
| 12–17 months | (3797) | 0.17 + (−0.02; 0.36) | 0.05 (−0.08; 0.18) | −0.05 (−0.21; 0.10) | 0.84 (0.62; 1.13) | 0.95 (0.71; 1.27) | 1.09 (0.78; 1.53) |
| 18–23 months | (1962) | 0.15 (−0.05; 0.35) | 0.26*** (0.11; 0.42) | 0.25** (0.07; 0.42) | 0.80 (0.57; 1.14) | 0.71 + (0.48; 1.04) | 0.54* (0.33; 0.87) |
IYCF; infant and young child feeding; HAZ, height‐for‐age z‐scores; WAZ, weight‐for‐height z‐scores; WHZ, weight‐for‐height z‐scores; + P < 0.1; *P < 0.05; **P < 0.01; ***P < 0.001. †Each cell in the table presents the regression coefficient and confidence interval for the association between the IYCF indicator in the specific row and the anthropometric outcome in the specific column. The figures in first three columns of the table are beta coefficients from linear regression models, and the next three columns are odds ratios from logit models. All regression models adjusted for the variables were specified in the Methods section.
When the food groups were entered as individual food groups (results in Supporting Information Table S1), grains and legumes were more significantly associated with anthropometric outcomes (e.g. for HAZ: β = 0.15 for grains, 95% CI 0.02–0.27; β = 0.12 for legumes, 95% CI 0.02–0.23) than higher nutrient value foods such as eggs, meat or fish (for HAZ: β = 0.01 for milk, 95% CI: −0.07 to –0.09; β = 0.08 for flesh food, 95% CI −0.06 to –0.24, β = −0.01 for eggs, 95% CI −0.16 to –0.14). Similar patterns were seen for WAZ.
Table 5 summarises the associations between maternal characteristics (height, education, BMI and age at marriage) and child anthropometric outcomes for the different regression models. Maternal nutritional status, especially maternal height, is strongly associated with child anthropometric outcomes. Maternal age at first birth is associated with some, but not all, anthropometric outcomes, as is maternal education.
Table 5.
Summary of age‐specific regression coefficients for associations between anthropometric outcomes and maternal characteristics (age groups 0–5.99 months; 6–23.99 months) †
| Maternal characteristic | Age group for regression analysis (N) | Mean anthropometric outcomes | Prevalence of undernutrition | ||||
|---|---|---|---|---|---|---|---|
| HAZ | WAZ | WHZ | Stunting | Underweight | Wasting | ||
| Age of mother at first birth | |||||||
| 0–5.99 months (3740) | −0.01 (−0.03; 0.01) | −0.01+ (−0.03; 0.002) | −0.01 (−0.03; 0.01) | 1.01 (0.97; 1.05) | 1.03* (1.00; 1.07) | 1.01 (0.98; 1.04) | |
| 6–23.99 months (10 517) | 0.01+ (0.0004; 0.02) | 0.005 (−0.004; 0.01 ) | −0.001 (−0.01; 0.01) | 0.98* (0.96; 0.99) | 1.00 (0.98; 1.02) | 1.00 (0.97; 1.02) | |
| Maternal height (cm) | |||||||
| 0–5.99 months (3740) | 0.04*** (0.03; 0.06) | 0.03*** (0.02; 0.04) | 0.003 (−0.01; 0.01) | 0.96*** (0.94; 0.98) | 0.95*** (0.93; 0.97) | 1.00 (0.98; 1.01) | |
| 6–23.99 months2 (10 517) | 0.06*** (0.05; 0.06) | 0.04*** (15.99) | 0.01*** (0.01; 0.02) | 0.92*** (0.91; 0.93) | 0.94*** (0.93; 0.95) | 0.98*** (0.97; 0.99) | |
| Maternal BMI | |||||||
| 0–5.99 months (3740) | 0.03* (0.01; 0.06) | 0.06*** (0.04; 0.08) | 0.05*** (0.03; 0.08) | 0.95* (0.91; 0.99) | 0.88*** (0.85; 0.92) | 0.94*** (0.91; 0.97) | |
| 6–23.99 months2 (10 517) | 0.01* (0.0004; 0.02) | 0.03*** (0.01; 0.04) | 0.03*** (0.01; 0.05 ) | 0.98* (0.97; 1.00) | 0.94** (0.90; 0.98) | 0.93** (0.89; 0.98) | |
| Maternal education | |||||||
| Primary vs. none | |||||||
| 0–5.99 months (3740) | 0.001 (−0.23; 0.23) | 0.07 (−0.09; 0.24) | 0.12 (−0.09;0.33) | 1.19 (0.87; 1.63) | 0.83 (0.61; 1.13) | 0.93 (0.68; 1.25) | |
| 6–23.99 months2 (10 517) | 0.04 (−0.07; 0.16) | 0.06 (−0.03; 0.15) | 0.06 (−0.04; 0.16) | 0.89 (0.75; 1.06) | 0.99 (0.83; 1.18) | 0.97 (0.80; 1.17) | |
| Secondary vs. none | |||||||
| 0–5.99 months (3740) | 0.12 (−0.94; 0.33) | 0.08 (−0.07; 0.23) | −0.04 (−0.24; 0.17) | 0.80 (0.56; 1.13) | 0.79 (0.57; 1.08) | 1.12 (0.83; 1.51) | |
| 6–23.99 months2 (10 517) | 0.03 (−0.09; 0.14) | 0.09* (0.004; 0.18) | 0.12* (0.01; 0.22) | 0.89 (0.74; 1.06) | 0.96 (0.79; 1.16) | 0.79* (0.64; 0.97) | |
HAZ, height‐for‐age z‐scores; WAZ, weight‐for‐height z‐scores; WHZ, weight‐for‐height z‐scores; BMI, body mass index. +P < 0.10; *P < 0.05; **P < 0.01; ***P < 0.001. †Each cell in the table presents the regression coefficient and confidence interval for the association between the maternal characteristics in the specific row and the anthropometric outcome in the specific column. The figures in first three columns of the table are beta coefficients from linear regression models, and the next three columns are odds ratios from logit models. All regression models adjusted for the variables were specified in the Methods section. Regression coefficients from maternal characteristics for the 0–5.99‐month age group are from models that include the EBF variable; regression coefficients for maternal characteristics for the 6–23.99‐month age group are from models that include diet diversity scores.
Discussion
In India, IYCF practices are particularly poor and have been previously highlighted as a critical area for intervention to improve child nutrition outcomes (Ramachandran 2010). Our results suggest that poor complementary feeding practices, in particular, are strongly associated with poor nutritional outcomes, especially outcomes such as low HAZ and a higher prevalence of stunting. Among the complementary feeding indicators we examined, diet diversity emerges as particularly important. Other complementary feeding practices that are associated with better nutrition outcomes are minimum meal frequency and timely introduction of complementary foods.
The findings on the lack of association between exclusive breast feeding (EBF) and nutrition outcomes should not be interpreted to mean that EBF does not matter for child survival, growth and development. Associations between EBF and nutrition outcomes are often not apparent until later in childhood because nutrition outcomes such as stunting usually do not fully set in until the second year of life (Victora et al. 2010). However, the evidence on the role of EBF in relation to child survival is unquestionable and the protection, promotion and support of EBF must be a strong component of nutrition‐related interventions in early infancy (Jones et al. 2003; Bhutta et al. 2008).
The significant association between diet diversity and anthropometric outcomes mirrors findings in other data sets (Arimond & Ruel 2004; Zongrone et al. 2012). The finding is also of significant biological importance, with effect sizes in the range of those seen in direct supplementation trials (0.15–0.2 z‐scores for HAZ and WAZ) (Dewey & Adu‐Afarwuah 2008), suggesting that improving diet diversity could be an important strategy to address undernutrition in this setting as well. However, in this data set, the finding that the basic foods such as rice and pulses are more significantly associated with anthropometric outcomes than high‐nutrient value foods such as eggs, meat or fish is somewhat surprising. In light of these findings, it is likely that the diet diversity indicator reflects energy adequacy of the complementary foods rather than overall mean nutrient adequacy, which was the original intent of this IYCF indicator (Daelmans et al. 2009). In a context where late introduction of any complementary foods is common, it is plausible that children are energy deficient in addition to being deficient in other nutrients, and that the diet diversity indicator is capturing, in the first instance, the energy deficiency. Indeed, studies have highlighted that the absolute amounts of cereal‐based complementary foods fed to infants were much lower than the recommended amounts even after an intensive programmatic intervention (Bhanot et al. 2008). Data from India's National Nutrition Monitoring Bureau surveys (National Institute of Nutrition 2006) also indicate significant energy gaps in the diets of children 1–3 years old. A clear challenge for complementary feeding in India then is not just to increase the diversity of the diets to enhance overall nutrient quality, but also to ensure that children are fed adequate quantities of cereals and pulses to meet their energy needs.
Analyses of the NFHS‐3 data set to understand determinants of appropriate IYCF practices indicate that maternal education, and access and exposure to media and to health workers are significant contributors to positive practices (Patel et al. 2010, 2012; Malhotra 2012). Indeed, in India and in other contexts, intervention research (mostly through small‐scale studies) shows that behaviour change interventions can be effective in improving IYCF practices, especially if interventions are based on a solid understanding of the local context, and tailored to address multiple barriers to IYCF practices (Bhandari et al. 2004, 2005; Bhutta et al. 2008). However, where food security is a major constraint, interventions that combine behaviour change with food supplements are likely to be more effective than behavioural interventions alone. In the Indian context, it is especially important to ensure that that supplementary foods provided through India's Integrated Child Development Services (ICDS) programme are locally appropriate and nutritionally adequate, and that timely and quality behaviour change counselling and support through ICDS and the National Rural Health Mission are locally contextualised and effectively implemented.
Although maternal education did not emerge as a significant variable in several regression models, we found this was due to including variables on media exposure and reading of newspapers that significantly reduced the magnitude and statistical significance of the maternal education variable. Maternal education was otherwise robust to all other controls, including state dummies. This suggests that maternal literacy and exposure to media could be strong mediators of the link between maternal education and child nutrition outcomes. Another recent study has also documented the role of maternal literacy and information access in relation to IYCF practices (Malhotra 2012).
Overall, the association between maternal characteristics such as height, BMI, education, and age at marriage, and child nutrition outcomes is of crucial importance for India. The role of maternal nutrition in influencing child nutrition outcomes is well documented, and recent analyses have also highlighted the importance of social investments in girls and women, such as education and delaying age at marriage, for maternal and child health and well‐being (Raj et al. 2010a, 2010b). Furthermore, the role of poverty, wealth, social identity and maternal autonomy is also well recognised in India (Shroff et al. 2009, 2011; Thorat & Sadana 2009). Policy instruments to address these social determinants of nutrition are essential to ensure sustained progress in addressing nutrition, in addition to addressing direct determinants such as IYCF practices.
Interpretations of causality in this paper are limited by the use of cross‐sectional data. However, the plausibility of our findings is strengthened through statistical adjustment for multiple covariates at different levels and through the use of state dummies to capture state‐to‐state variation. The findings are also largely consistent with theoretical expectations and the previous literature on this topic. We excluded cases with missing data. This may have some implications on our findings because of a loss of information that may affect the precision of our estimates. However, in this case, the potential of bias was decidedly low because the main sample characteristics for the full sample of children under 2 were almost identical to the characteristics of the sample of children that was available for the regression models. A significant strength of the analysis is the use of a randomly selected national sample from India to, for the first time, explore the associations between IYCF practices and child nutrition using globally accepted IYCF indicators (Daelmans et al. 2009), highlighting the importance of the critical window of opportunity for improving child nutrition in India (Swaminathan 2009).
We conclude that improving IYCF practices, and particularly complementary feeding, is critical to improve nutrition outcomes and reduce the prevalence of child undernutrition in India, particularly stunting. However, given the inextricable link between successful exclusive breastfeeding and age‐appropriate complementary feeding, it is important to aim to improve the entire continuum of IYCF practices in the first 2 years of life. This has to be an urgent advocacy, policy and programme priority if India is to accelerate progress in reducing the high burden of child undernutrition.
Source of funding
The research was funded by VA and MAA through UNICEF‐India.
Conflicts of interest
The authors declare that they have no conflicts of interest.
Contributions
PM and VA conceptualised and designed the analysis for this study. PM, AB and AS conducted the statistical analysis. PM and AB wrote the manuscript. VA and MAA reviewed manuscript drafts.
Supporting information
Table S1. Associations between individual food groups and child anthropometry, children 6–23.99 months (linear regression results).
Acknowledgement
We gratefully acknowledge support towards manuscript preparation and revision from Shruthi Cyriac, IFPRI‐New Delhi.
References
- Aggarwal A., Arora S. & Patwari A.K. (1998) Breastfeeding among urban women of low‐socioeconomic status: factors influencing introduction of supplemental feeds before four months of age. Indian Pediatrics 35, 269–273. [PubMed] [Google Scholar]
- Arimond M. & Ruel M.T. (2004) Dietary diversity is associated with child nutritional status: evidence from 11 demographic and health surveys. The Journal of Nutrition 134, 2579–2585. [DOI] [PubMed] [Google Scholar]
- Arnold F., Parasuraman S., Arokiasamy P. & Kothari M. (2009) Nutrition in India. National Family Health Survey (NFHS 3), India, 2005–2006 , International Institute for Population Sciences, ICF Macro, Mumbai, India; Calverton, USA.
- Bhandari N., Mazumder S., Bahl R., Martines J., Black R.E. & Bhan M.K. (2004) An educational intervention to promote appropriate complementary feeding practices and physical growth in infants and young children in rural Haryana, India. The Journal of Nutrition 134, 2342–2348. [DOI] [PubMed] [Google Scholar]
- Bhandari N., Mazumder S., Bahl R., Martines J., Black R.E. & Bhan M.K. (2005) Use of multiple opportunities for improving feeding practices in under‐twos within child health programmes. Health Policy and Planning 20, 328–336. [DOI] [PubMed] [Google Scholar]
- Bhanot A., Chaudhery D., Srikantiah S. & Saha B.S. (2008) Changing infant and child feeding behaviors. Paper 4. New Delhi, India, CARE‐India. RACHNA Program (2001–2006). Women and child health at scale. Working Paper Series.
- Bhutta Z.A., Ahmed T., Black R.E., Cousens S., Dewey K., Giugliani E. et al (2008) What works? Interventions for maternal and child undernutrition and survival. Lancet 371, 417–440. [DOI] [PubMed] [Google Scholar]
- Black R.E., Allen L.H., Bhutta Z.A., de Caulfield L.E., Onis M., Ezzati M. et al (2008) Maternal and child undernutrition: global and regional exposures and health consequences. Lancet 371, 243–260. [DOI] [PubMed] [Google Scholar]
- Daelmans B., Dewey K. & Arimond M. (2009) New and updated indicators for assessing infant and young child feeding. Food and Nutrition Bulletin 30 (Suppl. 2), S256–S262. [DOI] [PubMed] [Google Scholar]
- Dewey K.G. & Adu‐Afarwuah S. (2008) Systematic review of the efficacy and effectiveness of complementary feeding interventions in developing countries. Maternal and Child Nutrition 4 (Suppl. 1), 24–85. [DOI] [PMC free article] [PubMed] [Google Scholar]
- Gupta A., Dadhich J.P. & Faridi M.M. (2010) Breastfeeding and complementary feeding as a public health intervention for child survival in India. Indian Journal of Pediatrics 77, 413–418. [DOI] [PubMed] [Google Scholar]
- Hoddinott J., Maluccio J.A., Behrman J.R., Flores R. & Martorell R. (2008) Effect of a nutrition intervention during early childhood on economic productivity in Guatemalan adults. Lancet 371, 411–416. [DOI] [PubMed] [Google Scholar]
- Jones G., Steketee R.W., Black R.E., Bhutta Z.A. & Morris S.S. (2003) How many child deaths can we prevent this year? Lancet 362, 65–71. [DOI] [PubMed] [Google Scholar]
- Khan M.E. (1990) Breast‐feeding and weaning practices in India. Asia‐Pacific Population Journal 5, 71–88. [PubMed] [Google Scholar]
- Kumar D., Goel N.K., Mittal P.C. & Misra P. (2006) Influence of infant‐feeding practices on nutritional status of under‐five children. Indian Journal of Pediatrics 73, 417–421. [DOI] [PubMed] [Google Scholar]
- Malhotra N. (2012) Inadequate feeding of infant and young children in India: lack of nutritional information or food affordability? Public Health Nutrition. doi:10.1017/S1368980012004065 [DOI] [PMC free article] [PubMed] [Google Scholar]
- Marriott B.P., White A.J., Hadden L., Davies J.C. & Wallingford J.C. (2010) How well are infant and young child World Health Organization (WHO) feeding indicators associated with growth outcomes? An example from Cambodia. Maternal and Child Nutrition 6, 358–373. [DOI] [PMC free article] [PubMed] [Google Scholar]
- Moursi M.M., Treche S., Martin‐Prevel Y., Maire B. & Delpeuch F. (2009) Association of a summary index of child feeding with diet quality and growth of 6–23 months children in urban Madagascar. European Journal of Clinical Nutrition 63, 718–724. [DOI] [PubMed] [Google Scholar]
- National Institute of Nutrition (2006) Diet and nutritional status of population and prevalence of hypertension among adults in rural areas. Hyderabad, India, National Institute of Nutrition.
- de Onis, M. , Garza C., Onyango A.W. & Rolland‐Cachera M.F. (2009) [WHO growth standards for infants and young children]. Archives de Pediatrie 16, 47–53. [DOI] [PubMed] [Google Scholar]
- Patel A., Badhoniya N., Khadse S., Senarath U., Agho K.E. & Dibley M.J. (2010) Infant and young child feeding indicators and determinants of poor feeding practices in India: secondary data analysis of National Family Health Survey 2005–06. Food and Nutrition Bulletin 31, 314–333. [DOI] [PubMed] [Google Scholar]
- Patel A., Pusdekar Y., Badhoniya N., Borkar J., Agho K.E. & Dibley M.J. (2012) Determinants of inappropriate complementary feeding practices in young children in India: secondary analysis of National Family Health Survey 2005–2006. Maternal and Child Nutrition 8 (Suppl. 1), 28–44. [DOI] [PMC free article] [PubMed] [Google Scholar]
- Raj A., Saggurti N., Lawrence D., Balaiah D. & Silverman J.G. (2010a) Association between adolescent marriage and marital violence among young adult women in India. International Journal of Gynaecology and Obstetrics 110, 35–39. [DOI] [PMC free article] [PubMed] [Google Scholar]
- Raj A., Saggurti N., Winter M., Labonte A., Decker M.R., Balaiah D. et al (2010b) The effect of maternal child marriage on morbidity and mortality of children under 5 in India: cross sectional study of a nationally representative sample. BMJ (Clinical Research Ed.) 340, b4258. [DOI] [PMC free article] [PubMed] [Google Scholar]
- Ramachandran P. (2010) Nutrition and child survival in India. Indian Journal of Pediatrics 77, 301–305. [DOI] [PubMed] [Google Scholar]
- Ruel M.T. & Menon P. (2002) Child feeding practices are associated with child nutritional status in Latin America: innovative uses of the demographic and health surveys. The Journal of Nutrition 132, 1180–1187. [DOI] [PubMed] [Google Scholar]
- Sawadogo P.S., Martin‐Prevel Y., Savy M., Kameli Y., Traissac P., Traore A.S. et al (2006) An infant and child feeding index is associated with the nutritional status of 6‐ to 23‐month‐old children in rural Burkina Faso. The Journal of Nutrition 136, 656–663. [DOI] [PubMed] [Google Scholar]
- Shroff M., Griffiths P., Adair L., Suchindran C. & Bentley M. (2009) Maternal autonomy is inversely related to child stunting in Andhra Pradesh, India. Maternal and Child Nutrition 5, 64–74. [DOI] [PMC free article] [PubMed] [Google Scholar]
- Shroff M.R., Griffiths P.L., Suchindran C., Nagalla B., Vazir S. & Bentley M.E. (2011) Does maternal autonomy influence feeding practices and infant growth in rural India? Social Science and Medicine 73, 447–455. [DOI] [PMC free article] [PubMed] [Google Scholar]
- Swaminathan M.S. (2009) Undernutrition in infants and young children in India: a leadership agenda for action. IDS Bulletin 40, 103–110. [Google Scholar]
- Thorat S. & Sadana N. (2009) Discrimination and children's nutritional status in India. IDS Bulletin 40, 25–29. [Google Scholar]
- UNICEF (2009) Tracking Progress on Child and Maternal Nutrition: A Survival and Development Priority . UNICEF: New York: Available at: http://www.unicef.org/publications/files/Tracking_Progress_on_Child_and_Maternal_Nutrition_EN_110309.pdf (Accessed 19 February 2013). [Google Scholar]
- Victora C.G., de Onis M., Hallal P.C., Blossner M. & Shrimpton R. (2010) Worldwide timing of growth faltering: revisiting implications for interventions. Pediatrics 125, e473–e480. [DOI] [PubMed] [Google Scholar]
- WHO (2010) Indicators for Assessing Infant and Young Child Feeding Practices. Part II: Measurement. World Health Organization: Geneva. [Google Scholar]
- Zongrone A., Winskell K. & Menon P. (2012) Infant and young child feeding practices and child undernutrition in Bangladesh: insights from nationally representative data. Public Health Nutrition 15, 1697–1704. [DOI] [PubMed] [Google Scholar]
Associated Data
This section collects any data citations, data availability statements, or supplementary materials included in this article.
Supplementary Materials
Table S1. Associations between individual food groups and child anthropometry, children 6–23.99 months (linear regression results).