

Abstract
A comprehensive set of infant and young child feeding (IYCF) indicators for international use was published in 2008. We describe the process followed to incorporate these indicators into Vietnam's National Nutrition Surveillance System (NNSS).
Following its establishment in 1980, the National Institute of Nutrition introduced the Vietnam NNSS to provide an evidence base for nutrition interventions. While anthropometric indicators based on international standards were regularly used for programme purposes, data on IYCF could not be collected with similar rigor until 2010.
In 2009, with support from Alive & Thrive and UNICEF, the NNSS questionnaire was reviewed and additional content incorporated to measure IYCF practices. The tool was pilot‐tested in 10 provinces and revised before nationwide roll‐out in 2010.The tool comprises four pages, the first three of which focus on collecting data relating to maternal nutrition and IYCF. The last page is flexibly designed to incorporate planners’ data requests for other relevant activities (e.g. mass media interventions, food security). Once analysed, the data are presented in a report comprising provincial profiles and maps illustrating IYCF practices. Importantly, the IYCF data have been used for policy advocacy (e.g. maternity leave legislation, advertisement law), programme planning, trend monitoring and capacity building.
Adoption of the IYCF indicators was successful due to strategic timing, a phased approach, buy‐in from stakeholders and capacity building at all levels to ensure the quality and use of data. Further revisions to the NNSS (e.g. sampling methodology, quality assurance systems) will be important to ensure the reliability of indicators.
Keywords: infant feeding, nutrition, surveillance, IYCF indicators, Vietnam
Introduction
Overview of the WHO‐IYCF indicators
Poor infant and young child feeding (IYCF) practices, especially low prevalence of exclusive breastfeeding (EBF) and the early and inappropriate introduction of complementary foods, are recognised as significant contributors to undernutrition (Dewey & Brown 2003). Interventions to improve breastfeeding and complementary feeding (CF) practices are among the internationally recommended core package of direct nutrition interventions (Bhutta et al. 2008). However, progress in improving child feeding practices in the developing world has been slow for several reasons, including lack of clear international recommendations for some aspects of IYCF that has prevented development of universal indicators to define optimal feeding (Ruel et al. 2003). Although a set of global breastfeeding indicators was adopted more than two decades ago (WHO 1991), a comprehensive set of validated IYCF indicators –including appropriate CF–was only recently published (WHO et al. 2008). This set includes a measurement guide (WHO et al. 2010) to facilitate data collection and harmonisation of approaches to assessing IYCF practices. The IYCF indicators are intended for use in large surveys and programmes to (1) assess IYCF practices in countries; (2) screen children and target interventions; (3) monitor and evaluate progress; (4) advocate with governments and donors; and (5) facilitate global reporting, international comparisons and trend monitoring overtime.
The global implementation of the WHO Child Growth Standards has reinforced the importance of employing standardised data collection systems that enable comparison between countries and over time (de Onis et al. 2012). Despite the essential role optimal breastfeeding and timely and appropriate CF play in the healthy growth and development of young children, the 2008 IYCF indicators have yet to achieve widespread application.
UNICEF recently conducted a review of the scope, scale and status of key IYCF actions in 65 countries (UNICEF 2012). Results showed that a little over half of the countries (n = 39) engaged in national IYCF monitoring and evaluation. Roughly half (n = 31) routinely monitor IYCF activities and a similar number (n = 34) have undertaken an overall evaluation or review of IYCF (UNICEF 2012).Most countries were rated poor (n = 31) or fair (n = 24) in terms of overall monitoring and evaluation systems for IYCF. The review concluded that although on average, countries were rated ‘fair’ in terms of IYCF monitoring and evaluation systems, substantial strengthening of national monitoring systems was needed (UNICEF 2012).
Vietnam is one of the few countries to have incorporated the WHO‐IYCF indicators into its National Nutrition Surveillance System (NNSS) since 2010. This paper describes the processes that enabled phased integration of these indicators into the existing surveillance system and lessons learned from the experience. It then offers some recommendations to enable countries to fully integrate these indicators while ensuring data reliability.
Key messages
Strategic timing, a phased approach, buy‐in from key stakeholders and capacity building were critical to incorporation of the WHO‐IYCF indicators in the National Nutrition Surveillance System (NNSS) in Vietnam.
The surveillance system will continue to be strengthened through improving sampling methodology, instituting quality assurance systems and streamlining data collection, analysis and approval processes.
The availability of good‐quality IYCF data has been instrumental in enabling policy change, trend monitoring and strengthening programme planning.
IYCF indicators exist, but because they are not widely used, collection of comparable data and development of a global evidence base are hampered.
Nutritional status in Vietnam
Over the past decade (2001–2010), Vietnam has achieved remarkable success in improving the nutritional status of the general population, particularly of mothers and children under five. Many of the targets set out in the National Nutrition Strategy for 2001–2010 were achieved or surpassed. For example, the prevalence of underweight in children under five was reduced from 31.9% to 17.5% (NIN 2012). However, during the same period, prevalence of stunting was only marginally reduced from 34.8% to 29.3% (NIN 2012). Moreover, the reduction in stunting has significantly slowed since 2007 (NIN 2012).One of the underlying causes of child undernutrition in Vietnam is poor IYCF practices – especially low prevalence of EBF and the early and inappropriate introduction of complementary foods (Hop et al. 2000; Nguyen et al. 2011). IYCF indicators from major nutrition surveys in Vietnam during 1998–2011 are presented in Table 1.
Table 1.
Infant and young child feeding indicators from major nutrition surveys in Vietnam (1988–2011)
| Demographic and Health Surveys (DHS) | Multiple Indicator Cluster Surveys (MICS) | NIN Surveillance | Alive &Thrive | |||||||||||
|---|---|---|---|---|---|---|---|---|---|---|---|---|---|---|
| 1988 (GSO 1989) | 1994 (GSO 1995) | 1997 (GSO 1998) | 2002 (GSO 2003) | 2000 (GSO 2000) | 2006 (GSO 2006) | 2010–2011 (GSO 2011) | 2000 (NIN & UNICEF 2003) | 2002 (NIN & GSO 2003) | 2004 (NIN & GSO 2005) | 2005 (NIN& GSO 2006) | 2010 (NIN et al 2011) | 2010 (4 Provinces) (Nguyen et al. 2010) | 2011 (11 Provinces) (A&T, 2012a) | |
| % | % | % | % | % | % | % | % | % | % | % | % | % | % | |
| Early initiation of breastfeeding | – | 18.0 | 27.9 | 57.0 | – | 57.8 | 39.7 | – | – | 75.2 | – | 61.7 | 58.5 | 50.5 |
| Exclusive breastfeeding under 6 months | – | – | 1.0 | 7.7 | 9.0 | 16.9 | 17.0 | – | – | 12.4 | 12.2 | 19.6 | 18.4 | 20.2 |
| Continued breastfeeding at 1 year | – | – | – | 87.8 | 77.7 | 73.9 | 82.0 | 71.3 | 81.1 | 82.9 | 77.0 | 80.7 | 79.5 | |
| Introduction of solid, semi‐solid or soft foods | – | – | 93.7 | 85.1 | – | 70.4 | 50.4 | – | 82.0 | – | 87.7 | 92.0 | 91.5 | 96.1 |
| Minimum dietary diversity | – | – | – | – | – | – | – | – | – | – | – | 71.6 | 74.8 | 82.6 |
| Minimum meal frequency | – | – | – | – | – | 58.5 | – | – | – | – | 85.6 | 80.9 | 94.4 | |
| Minimum acceptable diet | – | – | – | – | – | 41.8 | – | – | – | – | – | 51.7 | 57.0 | 70.9 |
| Consumption of iron‐rich or iron‐fortified foods | – | – | – | – | – | – | – | – | – | – | – | 82.4 | 85.6 | 87.2 |
GSO, General Statistics Office; NIN, National Institute of Nutrition.
According to the 2010 Multiple Indicator Cluster Survey (MICS), despite the fact that 98% of children under 2 are breastfed (GSO 2011), only 39.7% of newborns are breastfed within an hour of birth. This is a marked drop from the national rate of 57.8% in 2006 (GSO 2006), and from two studies by the Alive & Thrive (A&T) Project1 where early initiation rates were 58.5% in the four‐province survey (Nguyen et al. 2010) and 50.5% in the 11‐province survey (A&T 2012a). All three studies show that less than 20% of children under 6 months old are exclusively breastfed, and only18–22% continue to be breastfed at 2 years of age (Nguyen et al. 2010, A&T 2012a). In the first 3 months of life, EBF is displaced primarily by plain water, breast milk substitutes and solid to semi‐solid foods (Nguyen et al. 2011). It is important to note that 62% of infants are given complementary foods before 6 months of age (Nguyen et al. 2010). In addition, aggressive marketing of breast milk substitutes combined with weak implementation of Decree 21 (Vietnam's iteration of the International Code of Marketing of Breast‐milk Substitutes) has contributed to increasing use of infant formula and bottle‐feeding– from 12% in 2002 (NIN & GSO 2003) to 25% in 2005 (NIN & GSO 2006) and 30% in 2010 (Nguyen et al. 2010). The 2010 MICS showed that the rate of bottle‐feeding (38.7%) continues to rise (GSO 2011).
In terms of CF, although nearly 60% of children 6–23 months receive the minimum meal frequency (GSO 2011), only around half consume a minimum acceptable diet (GSO 2006; Nguyen et al. 2010). Consumption of iron‐rich foods and minimum dietary diversity frequency are high >70% (Nguyen et al. 2010, A&T 2012a).
In addition to poor IYCF practices, it is likely that less‐than‐optimal household hygiene practices may be associated with the slow decline in stunting. In a survey of approximately 11 000 mothers, relatively low proportions of mothers reported washing their hands with soap at critical times such as before cooking (25%), after using the toilet (42%) and after handling children's faeces (19%; A&T 2012a).
The National Nutrition Program and NNSS in Vietnam
The National Institute of Nutrition (NIN), established in 1980, gives priority to conducting periodic nutrition surveys to provide an evidence base for nutrition interventions. NIN designed the current NNSS under the Protein Energy and Malnutrition Control Program, which was launched in 1994 as one of Vietnam's National Target Programs to improve the nutritional status of children under five. Over the years, the NNSS has been refined and strengthened to incorporate best practice. For example, following a request from NIN, the Ministry of Health in Vietnam agreed to apply from May 2009 the new World Health Organization (WHO) child growth standards for assessing child nutritional status for the surveillance system.
The NNSS uses a cross‐sectional survey based on two‐stage cluster sampling methods designed primarily to track a reduction in the prevalence of underweight in children aged 0–5 years at provincial, regional and national levels. During the first stage, 30 clusters are sampled using the probability ‘proportionate to size’ method. In the second stage, three villages are randomly selected. Using the door‐to‐door or list method, 17 children are selected from each village contributing to a total of 51 children in each commune and an average of 1530 children under five in each of Vietnam's 63 provinces resulting in a total sample size of approximately 90 000 for the country. Each year, during the period June–August, data are collected by local health staff under supervision of the provincial Preventive Medicine Centers. Data collection forms are sent to the surveillance unit at NIN for processing and analysis. While anthropometric data are shared in a timely and systematic manner, data on other indicators (e.g. IYCF) are not always publicly available.
Besides the periodic nutrition surveys and the NNSS managed by NIN, data on nutrition and related issues are collected through other channels, e.g. data on food security are available from the Vietnam Living Standards Survey. While a wealth of data is available, it is rarely triangulated in a manner that can inform nutrition‐specific and ‐sensitive policies and programmes. In addition, it is noteworthy that few surveys, besides the NNSS, collect data on IYCF and even fewer use the WHO‐IYCF indicators. For example, the 2010 MICS did not report all the recommended CF indicators, notably minimum dietary diversity and minimum acceptable diet.
Introducing the WHO‐IYCF indicators into the Vietnam NNSS
Following development of the new WHO‐IYCF indicators in 2008, NIN proceeded to incorporate them in a phased manner into the NNSS with a view to strengthening the NNSS. Funding for the NNSS in 63 provinces is provided by the Government of Vietnam through NIN under the National Target Program for Nutrition. Consequently, NIN is responsible for the design, implementation and quality assurance of the NNSS. In 2009, additional funding to pilot the WHO‐IYCF indicators in 10 provinces was provided by the A&T project. In 2010, both A&T and UNICEF supplemented NIN's resources to scale up the new surveillance tool with the new WHO‐IYCF indicators in all 63 provinces. The progress of introducing the WHO‐IYCF indicators into the NNSS is summarised in Table 2.
Table 2.
Progress of introducing infant and young child feeding indicators into the National Nutrition Surveillance System in Vietnam
| WHO recommended indicators | Before 2009 | 2009 | 2010–2012 |
|---|---|---|---|
| Early initiation of breastfeeding | X | X | |
| Exclusive breastfeeding under 6 months | X | X | X |
| Continued breastfeeding at 1 year | X | X | X |
| Introduction of solid, semi‐solid or soft foods | X | X | |
| Minimum dietary diversity | X | ||
| Minimum meal frequency | X | ||
| Minimum acceptable diet | X | ||
| Consumption of iron‐rich or iron‐fortified foods | X | X | |
| Children ever breastfed | X | X | X |
| Continued breastfeeding at 2 years | X | X | X |
| Age‐appropriate breastfeeding | X | X | |
| Predominant breastfeeding under 6 months | X | X | |
| Duration of breastfeeding – 24 months | X | X | X |
| Bottle‐feeding | X | X | |
| Provinces applied | 10 provinces | 63 provinces |
WHO, World Health Organization.
Initially, NIN in partnership with A&T reviewed the existing NNSS tool to identify which of the WHO‐IYCF indicators were currently being captured. As CF indicators were largely absent from the tool and collection of breastfeeding indicators did not conform to international recommendations, a two‐page questionnaire focused on capturing the WHO‐IYCF indicators was added to the existing NNSS tool in 2009 and piloted in 10 of Vietnam's 63 provinces. The 10 provinces were representative of Vietnam's different ecological zones and purposefully selected to ensure that the pilot results would be applicable to the national level. It is important to note that the pilot questionnaire was limited to two pages to prevent respondent and enumerator fatigue and ensure that data collection remained focused on IYCF indicators. Pre‐testing the pilot questionnaire ensured that the standard IYCF questions had been appropriately adapted to the Vietnam context. Following the pre‐test, NNSS enumerators in 10 provinces were trained to apply the two‐page IYCF focused questionnaire along with the standard NNSS questionnaire. Based on the demographic profile for children under five in 2009, it was assumed that 45% of children under five would be less than 2 years old. To provide adequate statistical power to test the WHO‐IYCF indicators in 10 provinces, sampling was completed to ensure that 45% of respondents selected comprised mothers of children 0–2 years. Data from the pilot was analysed using SAS 9.1 (SAS Institute Inc., Cary, NC, USA) within a period of 3 months from completion of data collection. Two‐page nutrition profiles based on IYCF and anthropometric indicators were created for use by national and provincial partners in the 10 provinces. Data in the profiles was presented using graphs and figures that made the data easy to understand and interpret. A carefully designed and pre‐tested surveillance tool, combined with training for supervisors and data collectors, clear guidelines and technical support for data collection, entry and analysis helped ensure that data was of high quality. For each step, the surveillance unit at NIN was responsible and worked closely with technical experts at A&T and UNICEF.
On the basis of this positive pilot experience, the 2010 NNSS tool was revised to include the WHO‐IYCF‐related questions and rolled out in all 63 provinces of Vietnam. The 2010 surveillance tool comprised three pages only as follows: page 1: general information, maternal/child anthropometry, use of vitamin A and iron/folate supplements; page 2: breastfeeding information and frequency of feeding; and page 3: CF information. At this stage, the NIN surveillance unit was supported by A&T and UNICEF to develop manuals, train staff and enter data to ensure quality and timely availability of results. Four‐page nutrition profiles were created for each of Vietnam's 63 provinces consisting of (1) provincial administrative/health statistics and prenatal health indicators; (2) child anthropometric data; (3) breastfeeding and CF indicators (Fig. 1); and (4) a summary of essential nutrition interventions during the life cycle. In addition, an overall national profile with maps was developed to show trends and present comparisons over time and across provinces (Fig. 2). The 2010 national and provincial profiles were compiled into a report, which was made available to all 63 provinces and key stakeholders (a pdf version is available at http://www.aliveandthrive.org/resource/nin-surveillance-report-feeding-practices-63-provinces-2010).
Figure 1.
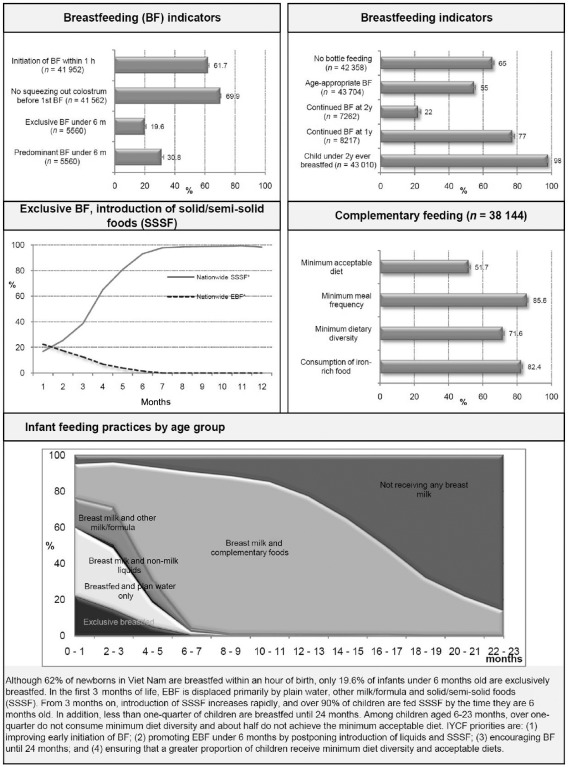
IYCF information in National Nutrition Surveillance Profile, Vietnam.
Figure 2.
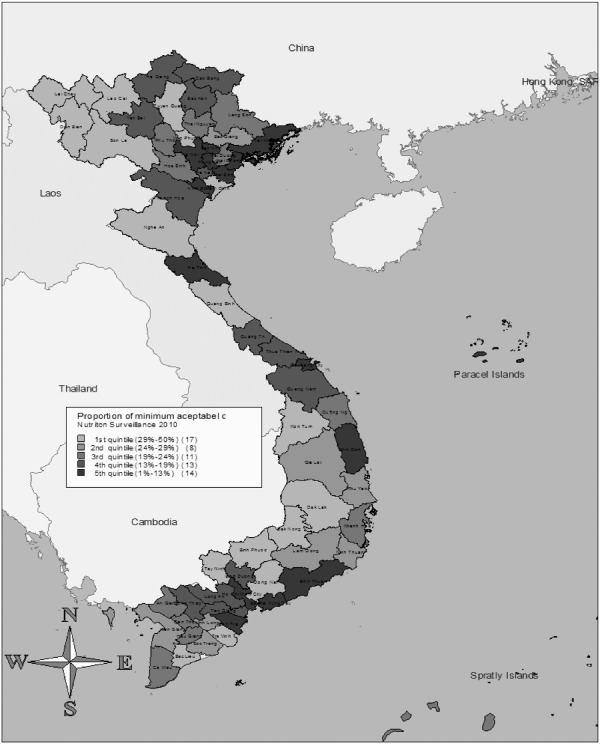
Map of minimum acceptable diet in National Nutrition Surveillance Profile, Vietnam.
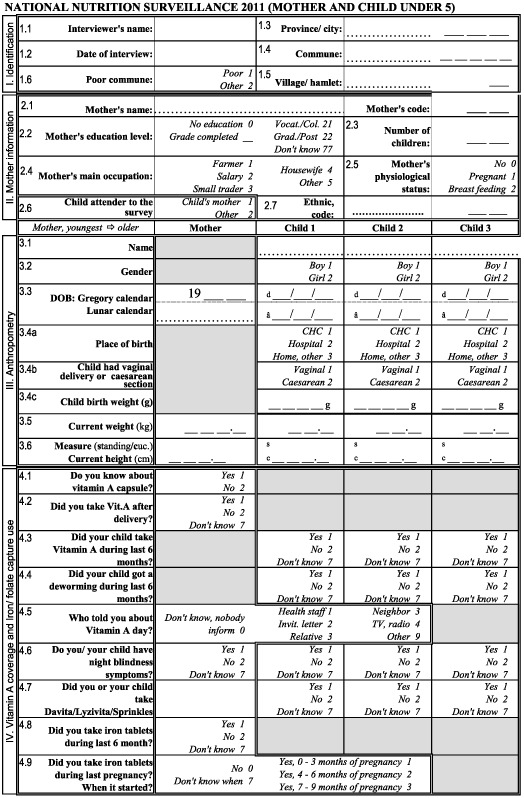
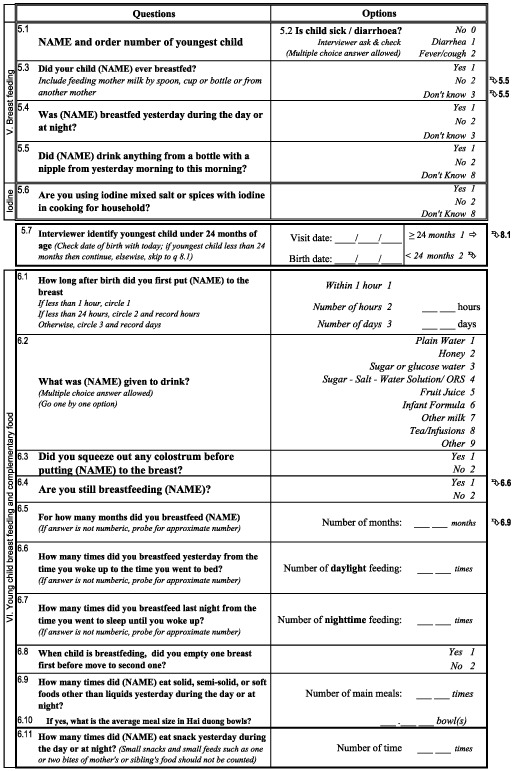
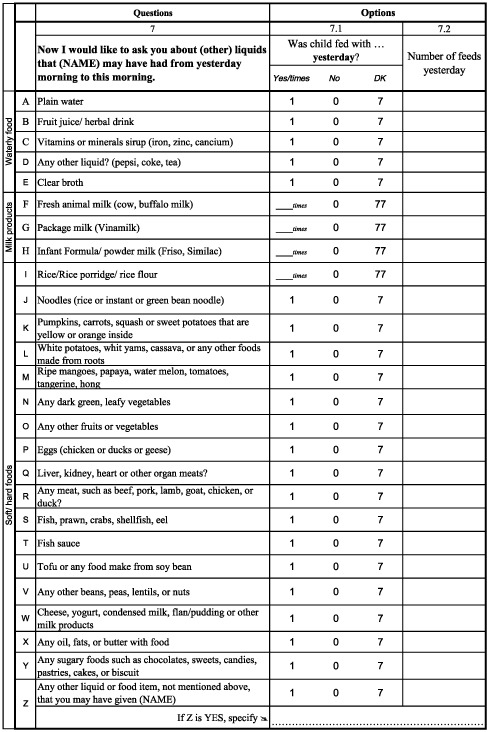
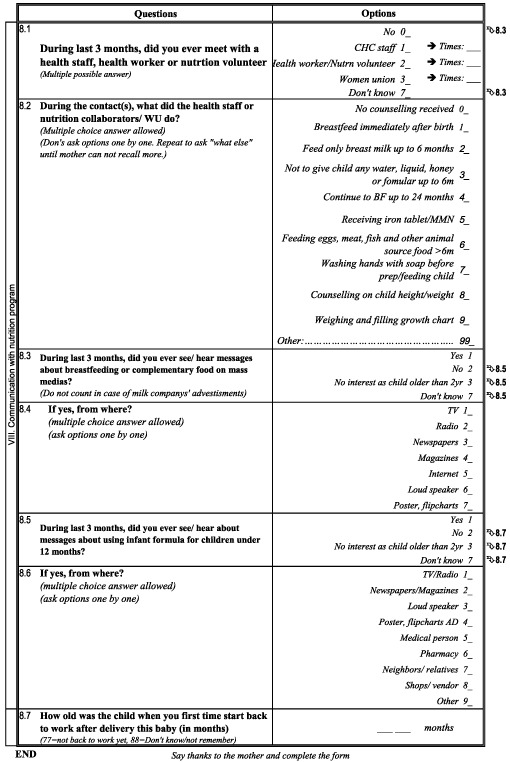
Experience from the 2010 NNSS led to minor changes and revisions to the tool for 2011 (Appendix 1. National Nutrition Surveillance 2011 Questionnaire). For example, questions were added concerning consumption of iodised salt, childhood illness and patterns of breastfeeding. In 2011, under the joint partnership of the Ministry of Health, UNICEF, A&T and WHO, a national mass media campaign to promote breastfeeding was launched in Vietnam. Consequently, a fourth page was added to the surveillance tool to capture exposure to the campaign and other behaviour‐change communication efforts.
With an extensive coastline, Vietnam is prone to frequent natural disasters. Given recent concerns of the impact of climate change and natural disasters on food security, the 2012 tool was further refined and revised to include a few questions on food security.
The current surveillance tool, which is a succinct four‐page questionnaire applied across all 63 provinces, enables collection and generation of the data necessary to construct state‐of‐the‐art nutrition and IYCF indicators. In addition, the tool has the flexibility to generate data of interest for other nutrition activities (e.g. mass media interventions, food security) by adapting the last page each year based on requests from planners and implementers. Data from the pilot in 2009 and the scale‐up in 2010 have been presented in visually attractive and easy‐to‐interpret national and provincial profiles, which illustrate how anthropometric measurements and IYCF practices vary across Vietnam. These profiles are available in print and electronic versions.
Application and utilisation of WHO‐IYCF indicators in Vietnam
This section presents data corresponding to the 2010 NNSS, the last year for which data are publicly available, and describes how the data have been used for (1) monitoring anthropometry and IYCF trends over place and time, (2) policy advocacy, (3) planning at national and provincial levels and (4) capacity building.
Undernutrition trends by age
Figure 3 shows that child growth patterns in Vietnam follow those described internationally (Shrimpton et al. 2001; Victora et al. 2010). Among children less than 24 months old, rates of underweight and stunting increase gradually from 3 to 11 months, then rapidly from 12 to 17 months, and level off thereafter. Mean height for age z‐scores and weight for age z‐scores follow a similar pattern, declining rapidly between 3 and 18 months. Generation of this Vietnam‐specific pattern was critical in highlighting; the need to shift focus from underweight to stunting as a priority indicator and in drawing attention of policy and programme planners to the narrow window of opportunity for addressing undernutrition during the first 24 months of life.
Figure 3.
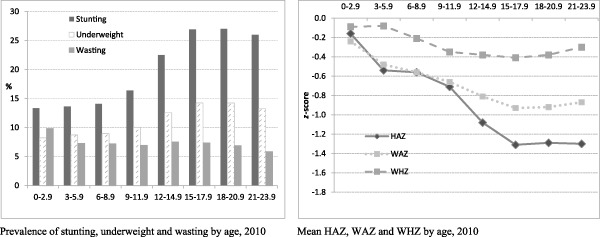
Anthropometric data by child age.
IYCF practices
The 2010 NNSS data on IYCF practices are presented in Fig. 4. The 2010 NNSS data reveal that 62% of newborns in Vietnam are breastfed within an hour of birth. This rate is consistent with data from the two A&T surveys (Table 1), but is in sharp contrast to the 2010 MICS data (39.7%), probably due to differences in sample size (GSO 2011). Consistent with MICS and other surveys in Vietnam, the 2010 NNSS data show that only a fifth of infants under 6 months of age are exclusively breastfed. In the first 3 months of life, EBF is displaced primarily by plain water, other milk/formula, and solid and semi‐solid foods (SSSF). From 3 months on, introduction of SSSF increases rapidly, and over 90% of children are fed SSSF before they reach age 6 months. While close to 80% of infants are breastfed up to 12 months, less than one‐quarter of children are breastfed until 24 months. Among children aged 6–23 months, 86% receive the minimum meal frequency and 82% consume iron‐rich foods. However, over one‐quarter does not consume a diet with a minimum level diversity and about half do not achieve the minimum acceptable diet. The data thus provided useful guidance to programme planners and managers on what to focus efforts on improving early initiation of breastfeeding; promoting EBF under 6 months by postponing introduction of liquids and SSSF; encouraging continuation of breastfeeding until 24 months; and ensuring that a greater proportion of children consume acceptable diets, which achieve the minimum required diversity.
Figure 4.
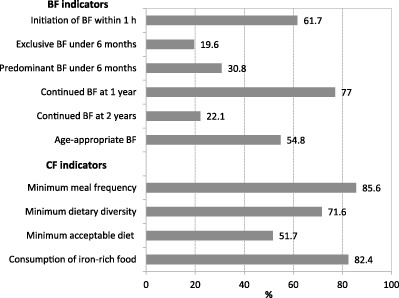
Infant and young child feeding indicators based on NIN Surveillance in Vietnam 2010.
Data utilisation for comparison of trends over place and time
As mentioned earlier, data from the 2010 NNSS have been summarised into national and provincial profiles. The national profile compares anthropometric measures (e.g. prevalence of underweight, stunting and wasting) and key IYCF indicators across all 63 provinces. In addition, each provincial profile includes comparison of province‐specific indicators to national aggregates. Future profiles will enable provinces to compare changes in indicators over time and provide evidence to programme developers on variations across regions, poor practices to target through nutrition interventions and assumed programme impact.
Data utilisation for policy advocacy at national and provincial levels
Given the slowing rate of stunting reduction reported through annual NNSS data, UNICEF and A&T partnered with relevant government departments in 2009–2010 to initiate discussions on protecting IYCF by extending paid maternity leave from 4 to 6 months, strengthening and revising Decree 21 (Vietnam's iteration of the International Code) and amending the advertisement law. Critical steps in this regard included developing an evidence base and presenting the data effectively to provide stakeholders and decision makers with an understanding of the IYCF situation in Vietnam, focusing on the importance of investing in the first 2 years of life, and consequently demonstrating the need to amend the above‐mentioned policies and laws. To this connection, data from the 2009 pilot and 2010 NNSS were used strategically in various materials from policy briefs, to presentations to newspaper articles and in various forums to sensitise policy makers about the low rates of exclusive and continued breastfeeding and the increasing trend of bottle feeding. Consequently, on 18 June 2012, Vietnam's National Assembly made a landmark decision to extend paid maternity leave from 4 to 6 months. Three days later, the Assembly voted to expand the ban on advertising breast milk substitutes for infants from 6 to 24 months, including feeding bottles and teats, as well as other complementary foods for children under 6 months of age. More than 90% of members of parliament voted for both policy changes, which reflect the government's commitment to protecting and promoting exclusive and continued breastfeeding.
As Vietnam progresses economically, external resources from development partners decline, resulting in ever more competing demands on limited national budgets, particularly in the social sector. This scenario, coupled with a decentralisation process and relatively high rates of stunting (>30%) in several provinces, calls for provincial authorities to prioritise investing in stunting reduction. Data from the 2010 NNSS have been used, particularly those in Fig. 3, which highlights the nexus between IYCF and stunting, to advocate for greater investment in IYCF in provinces where A&T activities are implemented. In addition, NNSS data have been used at the province level to sensitise other sectors, such as education and agriculture to integrate stunting reduction in the development of their annual objectives and plans. These efforts have, however, met with limited success.
Data utilisation for planning at national and provincial levels
Each year, provinces in Vietnam are required to develop nutrition plans. A review of these provincial nutrition plans in 2009–2010 revealed the need to establish plans consistent with province‐specific IYCF evidence. However, data on IYCF were not available to provinces; available but not appropriate, e.g. based on incorrect indicators, improperly analysed, etc.; or available but not easy to understand or use. The user‐friendly provincial profiles generated from the 2009 and 2010 NNSS have enabled authorities to use province‐specific IYCF data in the development of their provincial nutrition plans and prioritise stunting as an indicator at province and sub‐province levels.
Nationally, quantitative data from the NNSS coupled with qualitative data from A&T's formative research rounds in 2009 and 2010 were used to inform development of a behaviour‐change communication strategy on IYCF for Vietnam and set benchmarks and targets for programme effectiveness. In particular, the 2010 NNSS data revealed that EBF is displaced primarily by water. This result, supported by the finding that many mothers give water to their infants to quench thirst and/or to prevent thrush (A&T 2012b), led to development of a ‘No water in the first six months (180 days) of life’ message that has been broadcast on television since November 2011. Subsequent rounds of the NNSS coupled with other surveys will help to monitor the mass media campaign's reach and effectiveness.
Data utilisation for capacity building
A&T, in collaboration with NIN and provincial departments of health, is implementing an innovative model that incorporates elements of social franchising to deliver standardised good‐quality nutrition counselling to pregnant women, mothers and caregivers of children 0–23 months in 15 provinces. In addition, in remote hard‐to‐reach areas, A&T is supporting implementation of an IYCF support group model. To implement both these models, approximately 27 000 health workers at different levels have been trained using a set of four training manuals developed jointly by A&T and NIN. Data from the 2009 pilot and the 2010 NNSS were included in these manuals to sensitise health workers on IYCF practices in Vietnam and the need to focus on the first 2 years of life.
As illustrated above, incorporation of the WHO‐IYCF indicators into the NNSS has generated state‐of‐the‐art data, which have been applied extensively in various ways – enabling policy change, sensitising decision makers to increase investment in IYCF, providing an evidence base for planning and giving health workers a good understanding of national IYCF priorities.
Lessons learned and recommendations
The WHO‐IYCF indicators will be of value to the extent that managers at national and/or sub‐national levels regularly use them to monitor outcomes, inform strategies and track progress in IYCF programmes. The value of these indicators is further enhanced when IYCF data are triangulated with other indicators and databases, e.g. hygiene, food security etc. to enable programme planners and managers to prioritise nutrition‐specific and nutrition‐sensitive interventions. The experience in Vietnam demonstrates that successful countrywide adoption of the new indicators requires not only that they are strategically timed and systematically phased in but success is equally contingent on the capacity of the data collection system, and how and when the data are used and by whom.
The adoption of the new indicators coincided with development of the new National Nutrition Strategy (2011–2020, with a vision towards 2030) and the new National Nutrition Program (2011–2015) where they will be used systematically to monitor progress in improving IYCF. The timing was critical and driven by a need for more accurate data particularly on breastfeeding practices to support strategy development, programme and advocacy activities at national and sub‐national levels.
Where surveillance systems have been in place for a long time, adoption of new indicators has to be phased appropriately. In Vietnam, phasing took place in two steps – an initial pilot of 10 provinces followed by nationwide adoption of the tool. The pilot helped planners to refine questions and develop training manuals, gain confidence in the accuracy and robustness of the new indicators and build capacity for data analysis. The pilot was particularly helpful for adapting the CF questions to the local diet, which required a thorough understanding of representative infant food types and categories across 63 provinces. Agreement on classification of foods and pre‐testing of the food frequency tables were critical to finalising the NNSS tool's CF section.
Revision of a surveillance tool is only the first step in adopting the new WHO‐IYCF indicators. Capacity to use the tool appropriately is equally vital to ensuring the integrity of data collected. The surveillance unit at NIN is well equipped to train staff, and to supervise collection, processing and analysis of data. However, review of the 2010 and 2011 rounds indicates that provincial data collection capacity is neither optimal nor uniform. NIN thus needs to ensure that sub‐national data collection capacity is strengthened and quality assurance systems are put in place.
There is about an 18‐month time lag in Vietnam between IYCF data collection and release. For example, when this report was being written (January 2013), data from the 2011 and 2012 surveillance rounds were still not available on the public domain. Key causes for the delay are the availability of skilled human resources to analyse data and generate reports in a timely manner coupled with lengthy processes for review and approval of data for publication. Because a long time lag diminishes data relevance and usefulness, it is recommended that data collection and processing and analysis capacities be reinforced sub‐nationally and nationally to reduce delays. Where feasible, modern technologies should be used for data collection to minimise errors and reduce time for data entry. Additionally, review and approval processes should be streamlined to ensure data relevance and utility.
While IYCF data are available in Vietnam, their use for and impact on decision making at national and provincial levels appears to be sporadic and inconsistent. This is partly the result of limited capacity and incentives to use indicators effectively and partly the result of delays in data being communicated and disseminated, especially to provincial stakeholders. Because the WHO‐IYCF indicators are relatively new, capacity especially at sub‐national level needs to be built to interpret and use these data as indicators are incorporated into surveillance systems. In addition, incentives to use the data effectively (e.g. more resources allocated if sub‐national plans are evidence based, tracking plans to ensure that data are used, etc.) would enhance the impact of these indicators on decision making.
Planners and managers of surveillance systems may have a solid understanding of the new WHO‐IYCF indicators. However, it is essential to ensure that both nutrition programme decision makers and stakeholders (e.g. ministries of health, education and agriculture) have an equally good understanding and appreciation of the indicators’ robustness and usefulness. Consensus at all levels and acceptance of the new indicators as accurate performance measures are critical to ensuring data utilisation by nutrition‐specific and ‐sensitive sectors.
Breastfeeding indicators are by and large well understood and utilised effectively for planning and advocacy. Unfortunately, the four core CF indicators do not enjoy the same degree of understanding and visibility. It is therefore important to increase awareness of CF issues, the association between CF and growth and potential solutions to problems. In the case of a lower middle‐income and relatively food‐secure country like Vietnam, it was noted that ‘minimum acceptable diet’, which is a composite of minimum dietary diversity and minimum meal frequency, can be used as the critical CF indicator.
Application of the CF indicators in Vietnam also revealed that the major food category oil/fat is not included in the WHO‐IYCF indicators. It is recommended that WHO review the suitability of including this food category. In addition, current CF indicators capture only frequency but not amount of food. In terms of breastfeeding indicators, because stress is placed on the importance of breastfeeding up to 24 months and beyond, it is recommended that breastfeeding until 2 years of age be made a core indicator, and breastfeeding at 1 year be made an optional indicator.
If the WHO‐IYCF indicators are to be integrated into existing nationwide systems, it is important to ensure that the existing system's sample size and methodology are appropriate for these indicators. The NNSS in Vietnam is designed to capture anthropometric indicators for children under five, but the WHO‐IYCF indicators focus on children under two. A closer look at the trends and confidence intervals for some key WHO‐IYCF indicators highlights the need to review sampling methodology for the NNSS. It is particularly important to factor in appropriate representation of the 0–23‐month age group in the sample to ensure that IYCF data are reliable for monitoring national and sub‐national trends overtime.
Currently, there is no clear guidance on the frequency of collecting national anthropometric and IYCF data. Based on our experience, we would recommend national surveillance systems to collect data on child growth and IYCF practices frequently, e.g. annually or at shorter intervals depending on the age group and expected growth velocity pattern of the index sample (de Onis et al. 2011) to track progress and monitor trends. Where possible, it is recommended that IYCF and anthropometric data collection be linked closely to implementation cycles of specific nutrition strategies, plans and programmes. This will help increase the usefulness and visibility of the data being collected.
During policy advocacy efforts in Vietnam, it was noted that global evidence on IYCF practices, particularly from middle‐income and developed countries, was largely lacking. Given the importance of IYCF practices in the prevention of undernutrition and overweight, and our experience of the influence that high‐quality IYCF data can have in mobilising change, we suggest that countries, developed and developing, integrate the core WHO‐IYCF indicators into national surveillance or management information systems and large‐scale surveys, e.g. MICs. As has been the experience with the worldwide adoption of the WHO Child Growth Standards (de Onis et al. 2012), the widespread adoption of the WHO‐IYCF indicators will enable development of a global evidence base for IYCF practices across countries and time.
In sum, Vietnam recognised in 1980 the importance of nutrition indicators to provide an evidence base for nutrition interventions; however, good‐quality IYCF data only became available in 2010 following adoption of the 2008 WHO‐IYCF indicators. This paper describes the process taken to pilot and incorporate the WHO‐IYCF indicators into Vietnam's NNSS. It also describes how these data have been analysed and used to inform national policy, as well as the lessons learnt along the way. Strategic timing, buy‐in from stakeholders and capacity building at all levels were critical factors for ensuring the successful adoption of the WHO‐IYCF indicators in Vietnam. Further revisions to the existing NNSS (e.g. sampling methodology, quality assurance systems) will be important to ensure data accuracy and reliability.
Source of funding
Funding for the NNSS in Vietnam is provided by the Government of Vietnam through the National Institute of Nutrition under the National Target Program for Nutrition. Additional funding to pilot and scale up the WHO‐IYCF Indicators as part of the NNSS was provided by the Bill & Melinda Gates Foundation (through the Alive & Thrive Project) and UNICEF Vietnam.
Conflicts of interest
The authors declare that they have no conflicts of interest.
Contributions
All co‐authors participated in preparation of the manuscript and important intellectual content.
Disclaimer
MdO is staff member of the World Health Organization. The author alone is responsible for the views expressed in this publication and they do not necessarily represent the decisions, policy or views of the World Health Organization.
Ethical approvals
In Vietnam, execution of the NNSS has been approved as an integral part of the National Nutrition Strategy (2001–2010), which was approved by the Prime Minister of Vietnam on 22 February 2001 (Document no. 21/2011/QD TTG). In addition, the National Institute of Nutrition's Scientific and Ethical Committee and the Ministry of Health's Scientific and Ethical Committee approved tools and methodology in 2009.
Acknowledgements
The authors would like to acknowledge the contribution of the following individuals who played a substantial role in enabling the pilot and scale‐up of the WHO‐IYCF indicators into the NNSS in Vietnam – Dr. Nguyen Thanh Tuan, Ms. Tran Thi Ngan, Ms. Tran Mai Lan (FHI360); Ms. Sarah Kiethly (Institute of Social and Medical Sciences); Dr. Purnima Menon (International Food Policy Research Institute); Dr. Le Thi Hop, Dr.Nguyen Lan, Dr. Nguyen Viet Luan (National Institute of Nutrition); Mr. Roger Mathisen, Dr. Nguyen Dinh Quang (UNICEF/Vietnam).
Appendix 1. National Nutrition Surveillance 2011 Questionnaire
The World Health Organization retains copyright and all other rights in the manuscript of this article as submitted for publication.
Footnotes
Alive & Thrive (A&T) is a 6‐year (2009–2014) initiative to improve IYCF practices by increasing rates of EBF and improving CF practices. A&T aims to reach more than 16 million children under two in Bangladesh, Ethiopia and Vietnam. The A&T approach features three main strategies: (1) policy dialogue; (2) service delivery and behavior change communication; and (3) fortified complementary foods and related products. A&T is funded by the Bill & Melinda Gates Foundation.
References
- A&T (2012a) Baseline Survey Report: 11‐Province Master Report . Alive & Thrive: Hanoi, Vietnam.
- A&T (2012b) Formative Research on Infant and Young Child Feeding in Vietnam: Phase 1 Summary Report . Alive & Thrive: Hanoi, Vietnam.
- Bhutta Z.A., Ahmed T., Black R.E., Cousens S., Dewey K., Giugliani E. et al (2008) What works? Interventions for maternal and child undernutrition and survival. Lancet 371, 417–440. [DOI] [PubMed] [Google Scholar]
- Dewey K.G. & Brown K.H. (2003) Update on technical issues concerning CF of young children in developing countries and implications for intervention programs. Food and Nutrition Bulletin 24, 5–28. [DOI] [PubMed] [Google Scholar]
- General Statistics Office (GSO) (1989) Vietnam Demographic and Health Survey 1988. Statistical Publishing House: Hanoi, Vietnam. [Google Scholar]
- General Statistics Office (GSO) (1995) Vietnam Demographic and Health Survey 1994. Statistical Publishing House: Hanoi, Vietnam. [Google Scholar]
- General Statistics Office (GSO) (1998) Vietnam Demographic and Health Survey 1997. Statistical Publishing House: Hanoi, Vietnam. [Google Scholar]
- General Statistics Office (GSO) (2000) Analysis of Results of the Multiple Indicator Cluster Survey II (MICS II) . Statistical Washington, DC.
- General Statistics Office (GSO) (2003) Vietnam Demographic and Health Survey 2002. Statistical Publishing House: Hanoi, Vietnam. [Google Scholar]
- General Statistics Office (GSO) (2006) Vietnam Multiple Indicator Cluster Survey 2006, final report . Statistical Publishing House: Hanoi, Vietnam.
- General Statistics Office (GSO) (2011) Vietnam Multiple Indicator Cluster Survey 2011, final report . Statistical Publishing House: Hanoi, Vietnam.
- Hop L.T., Gross R., Giay T., Sastroamidjojo S., Schultink W. & Lang N.T. (2000) Premature complementary feeding is associated with poorer growth of Vietnamese children. Journal of Nutrition 130, 2683–2690. [DOI] [PubMed] [Google Scholar]
- Nguyen P.H., Manohar S., Mai L.T., Subandoro A., Rawat R., Menon P. et al (2010) Vietnam Baseline Survey Report. Alive and Thrive Project . International Food Policy Research Institute: Washington DC.
- Nguyen P.H., Menon P., Ruel M. & Hajeebhoy N. (2011) A situational review of infant and young child feeding practices and interventions in Viet Nam. Asia Pacific Journal of Clinical Nutrition 20, 359–374. [PubMed] [Google Scholar]
- NIN (2012) Child Nutrition Situation in Vietnam . Data bank of Child nutrition situation in Viet Nam: Viet Nam. Available at: http://viendinhduong.vn/news/vi/106/61/a/so-lieu-thong-ke-ve-tinh-trang-dinh-duong-tre-em-qua-cac-nam.aspx (Accessed 22 April 2013).
- NIN, A&T & UNICEF (2011) Nutrition Surveillance 2010. Vietnam Nutrition Profile . National Institute of Nutrition: Hanoi, Viet Nam.
- National Institute of Nutrition, General Statistics Office (NIN & GSO) (2003) Results of Nutrition Surveillance of Children and Mothers in 2002 . Medical Publishing House: Hanoi, Vietnam.
- National Institute of Nutrition, General Statistics Office (NIN & GSO) (2005) The Situation of Maternal and Child Nutrition 1994–2004 . Statistical Publishing House: Hanoi.
- National Institute of Nutrition, General Statistics Office (NIN & GSO) (2006) Nutritional Status of Children and their Mothers in 2005 . Annual Report. Medical Publishing House: Hanoi, Vietnam.
- NIN & UNICEF (2003) Vietnam 2000–2002: A Review of the Nutrition Situation . National Institute of Nutrition: Hanoi, Vietnam.
- de Onis M., Siyam A., Borghi E., Onyango A., Piwoz E. & Garza C. (2011) Comparison of the World Health Organization growth velocity standards with existing US reference data. Pediatrics 128, e18–e26. [DOI] [PubMed] [Google Scholar]
- de Onis M., Onyango A., Borghi E., Siyam A., Blossner M. & Lutter C. (2012) Worldwide implementation of the WHO Child Growth Standards. Public Health Nutrition 15, 1603–1610. [DOI] [PubMed] [Google Scholar]
- Ruel M., Brown K.H. & Caulfield L.E. (2003) Moving Forward with Complementary Feeding: Indicators and Research Priorities . IFPRI/Discussion Paper146.International Food Policy Research Institute: Washington DC. [DOI] [PubMed]
- Shrimpton R., Victora C.G., de Onis M., Lima R.C., Blossner M. & Clugston G. (2001) Worldwide timing of growth faltering: implications for nutritional interventions. Pediatrics 107, e75. [DOI] [PubMed] [Google Scholar]
- UNICEF (2012) Infant and Young Child Feeding Programming Status: Results of 2010–2011 Assessment of Key Actions for Comprehensive Infant and Young Child Feeding Programs in 65 Countries . Nutrition Section, UNICEF: New York.
- Victora C.G., de Onis M., Hallal P.C., Blossner M. & Shrimpton R. (2010) Worldwide timing of growth faltering: revisiting implications for interventions. Pediatrics 125, e473–e480. [DOI] [PubMed] [Google Scholar]
- WHO (1991) Indicators for Assessing Breastfeeding Practices. World Health Organization: Geneva. [Google Scholar]
- WHO, UNICEF, USAID, AED, UCDAVIS & IFPRI (2008) Indicators for Assessing Infant and Young Child Feeding Practices. Part I: Definition. World Health Organization: Geneva. [Google Scholar]
- WHO, UNICEF, USAID, AED, UCDAVIS & IFPRI (2010) Indicators For assessing Infant and Young Child Feeding Practices. Part II: Measurement. World Health Organization: Geneva. [Google Scholar]