

Abstract
Linear growth from birth to 2 years of children enrolled in the World Health Organization Multicentre Growth Reference Study was similar despite substantial parental height differences among the six study sites. Within‐site variability in child length attributable to parental height was estimated by repeated measures analysis of variance using generalized linear models. This approach was also used to examine relationships among selected traits (e.g. breastfeeding duration and child morbidity) and linear growth between 6 and 24 months of age. Differences in intergenerational adult heights were evaluated within sites by comparing mid‐parental heights (average of the mother's and father's heights) to the children's predicted adult height. Mid‐parental height consistently accounted for greater proportions of observed variability in attained child length than did either paternal or maternal height alone. The proportion of variability explained by mid‐parental height ranged from 11% in Ghana to 21% in India. The average proportion of between‐child variability accounted for by mid‐parental height was 16% and the analogous within‐child estimate was 6%. In the Norwegian and US samples, no significant differences were observed between mid‐parental and children's predicted adult heights. For the other sites, predicted adult heights exceeded mid‐parental heights by 6.2–7.8 cm. To the extent that adult height is predicted by height at age 2 years, these results support the expectation that significant community‐wide advances in stature are attainable within one generation when care and nutrition approximate international recommendations, notwithstanding adverse conditions likely experienced by the previous generation.
Keywords: infant and child growth, secular trends, mid‐parental height
Introduction
The World Health Organization (WHO) Child Growth Standards for children 0–5 years of age are based on a prescriptive approach designed to depict how all children should grow when their health care needs are met (Garza & de Onis 2004). The children whose growth was documented to derive the WHO standards were internationally diverse (Brazil, Ghana, India, Norway, Oman and the United States), but all experienced environmental and socio‐economic conditions unlikely to constrain growth (de Onis et al. 2004a). Nonetheless parental heights expected to influence their progeny's growth differed significantly among study sites (WHO Multicentre Growth Reference Study Group 2006a), yet their children's growth from birth to 2 years was similar. A variance components analysis of length between birth and 24 months of age (adjusting for sex and age) estimated the proportions of total variability attributable to sites and individuals within sites as 3% and 70%, respectively (WHO Multicentre Growth Reference Study Group 2006c). It was thus possible to pool multisite data and develop the standards (WHO Multicentre Growth Reference Study Group 2006d).
Child growth up to 24 months is a strong predictor of cognitive performance and physiological achievement in adulthood (Victora et al. 2008). Schmidt and colleagues reviewed determinants of adult height and suggested that although socio‐economic factors (e.g. social class, birth order, number of younger siblings and mother's education) cannot determine growth directly, they likely act through biological mediators such as nutrition and infection, that in turn, interact significantly with complex individual genetic endowments to determine adult height (Schmidt et al. 1995). The authors summarized analyses of longitudinal growth data (birth to 22 years) from a secular trend study initiated by the Fels Research Institute in the 1920s. The Fels group noted that increases in adult height observed over two generations were evident by 2 years of age in the younger cohort and that the magnitude of observed gains in growth remained almost unchanged during the remaining growth period (Bock & Sykes 1989). Other studies suggest that adult height can be predicted by doubling height at 2 years (Tanner et al. 1970; Roche et al. 1975; Prader et al. 1989, and Victora et al. 2008). For example, the Zurich Longitudinal Growth Study followed children from birth to 20 years between 1954 and 1976 (Prader et al. 1989). The average combined‐sexes height at 2 years in that study was 86.4 cm. The cohort's stature at 20 years was 171.3, or 1.5 cm less than twice the cohort's length/height at 2 years. Schmidt et al. (1995) also summarized findings from other longitudinal growth studies (birth to adulthood). They reported correlations between childhood lengths/heights and adult heights that were low at birth and increased steeply until age 2 years, with slower increments through the remainder of childhood. The consistency of such longitudinal data from these various studies supports the exploration of length/height at 2 years to assess timeframes for achievable intergenerational community gains in stature.
The definition of mid‐parental height as the average height between parents dates back to 1886, when Galton argued that this variable best represented the transmission of stature from parents to children (Galton 1886). To date, mid‐parental height is still considered the strongest predictor of adult height, followed by birthweight and several socio‐economic factors (Cole 2000). In the present analyses, within‐site variability in child length attributable to parental height and several other factors is estimated. The prescriptive criteria applied in selecting the Multicentre Growth Study (MGRS) sample and the support provided to study mothers to ensure adequate feeding and care implicitly minimized variability in the environmental influencers of growth.
Key messages
Significant increases in child stature are achievable at a community level within one generation when care and nutrition approximate international recommendations.
Mid‐parental height consistently explained a greater proportion of observed variability in attained child length than either paternal or maternal height alone in settings with widely disparate parental heights.
Doubling a child's height at 2 years matches mid‐parental heights when parental stature reflects genetic potentials and their children's care approximates international health and nutrition recommendations.
Meeting international health and nutrition recommendations results in predicted adult stature that approximates international norms in children of parents who likely experienced adverse health and nutrition conditions sufficient to result in significant reductions in adult height.
Methods
The WHO MGRS (1997–2003) was a population‐based study undertaken in the cities of Davis, California; Muscat, Oman; Oslo, Norway; and Pelotas, Brazil, and selected affluent neighbourhoods of Accra, Ghana and South Delhi, India. The MGRS protocol and its implementation in the six sites are described in detail elsewhere (de Onis et al. 2004a). Briefly, the study combined a longitudinal component from birth to 24 months with a cross‐sectional one of children aged 18–71 months. Analyses included here are limited to the study's longitudinal component, where mothers and newborns were screened and enrolled at birth and visited at home 21 times on weeks 1, 2, 4 and 6; monthly from 2 to 12 months; and bimonthly in the second year. Data were collected on anthropometry, feeding practices, morbidity, perinatal factors, and socio‐economic, demographic and environmental characteristics.
The study populations benefited from socio‐economic conditions favourable to growth, experienced low mobility, and had access to breastfeeding support. Individual inclusion criteria consisted of no health or environmental constraints to growth, mothers willing to follow MGRS feeding recommendations (exclusive or predominant breastfeeding for at least 4 months; introduction of complementary foods by the age of 6 months; partial breastfeeding continued for at least 12 months), no maternal smoking before and after delivery, single‐term birth, and absence of significant morbidity (de Onis et al. 2004a). Descriptions of foods consumed and dietary diversity were derived from the 24‐h recalls (WHO Multicentre Growth Reference Study Group 2006b).
During site selection, surveys were conducted in Ghana, India and Oman to identify site‐specific socio‐economic characteristics that identified groups whose growth was not environmentally constrained (Bhandari et al. 2004; Mohamed et al. 2004; Owusu et al. 2004). Local criteria for screening newborns, based on parental education and/or income levels, were developed from those surveys. Pre‐existing survey data for this purpose were available from Brazil, Norway and the United States. The total MGRS sample size for the longitudinal component in all six sites was 1743 children; 88% (1542) of those enrolled were followed for 24 months. The per cent follow‐up varied from 82% to 93% among sites. Term low‐birthweight infants (2.3%) were not excluded.
At the beginning of the study, mothers reported their age, completed years of education and parity (number of live births), and the mothers' pregnancy status was ascertained at each follow‐up visit. For the child, data were collected on morbidity, use of nutritional supplements, continuation of breastfeeding and dates when breastfeeding was discontinued. Food and fluid intakes were estimated using 24‐h dietary recalls from each follow‐up visit.
Identical anthropometry equipment was used in all study sites, and measurements were taken following standardized procedures (Onyango et al. 2004; de Onis et al. 2004b). Electronic scales (UNICEF Electronic Scale 890) (Seca) with 0.1‐kg precision were used to measure weight. Length was measured using the Harpenden Infantometer (CMS Weighing Equipment Ltd, London, UK) (range 30–110 cm) and height with the Harpenden Stadiometer (range 65–206 cm), both with digit counters precise to 1 mm. Parents' heights were measured once, at the beginning of the follow‐up (only biological fathers were measured).
Statistical analyses
Country‐specific analyses were conducted to estimate within‐site variability in child length attributable to parental height and assess the influence of other factors with the potential to affect linear growth between 6 and 24 months. Within‐site variability in child length at 6, 9, 12, 18 and 24 months attributable to parental height, the child's sex and birthweight was estimated by repeated measures analysis of variance using generalized linear models (Littell et al. 1998). The models also included household income, mother's age, education and parity, maternal pregnancy status between 14 days and 24 months post‐partum, duration of breastfeeding, child morbidity, dietary diversity, and nutrient supplementation. The orthogonal polynomial transformation was chosen for the repeated measures. Repeated measure analysis of variance splits the total explained variability of all length measurements considered in the analysis into two parts (between‐ and within‐child) to reflect the association between attained length and each of the independent variables. Between‐child variability refers to differences in levels (average attained length) and within‐child variability to differences in shapes of individual growth functions. Proportions of between‐ and within‐child variability explained by a specific variable were calculated considering the corresponding total type III sums of squares as denominators. To assess significance of the independent variables, F‐tests for the within‐child univariate analysis were corrected based upon the estimates of sphericity by Greenhouse and Geisser (1959) whenever there was a violation of the assumption of equality of differences between pairs of measurements (sphericity hypothesis). It should be noted that assessment of proportions of variability was the primary objective of this analysis; therefore, investigation of magnitudes and directions of the various effect estimates was considered as beyond its scope. Analyses were carried out using the software SAS (SAS Institute Inc., Cary, NC, USA, version 9). Statistical significance was assessed at the 5% level for all analyses.
To examine the influence of parental characteristics on attained child length, mother's age and education were re‐coded as categorical variables and analytical groups were collapsed when specific cells had fewer than 15 observations (country‐specific categories for both variables are presented in Table 1). Parity was coded in two categories (mothers with fewer than three children vs. three or more). Household income was estimated in national currencies and categorized by country‐specific quartiles. Duration of breastfeeding was calculated in months as the difference between the termination date reported by the mother and the index child's birth date divided by 30.4 days. Dietary diversity was included in the model in relation to the four indicated age intervals to which different feeding recommendations apply (6 to <9 months, 9 to <12 months, 12 to <18 months, 18 to <24 months). The dietary diversity index was calculated as the average number of food groups included in the child's diet reported at the visits occurring during the corresponding period. The food groups were the following eight: (i) grain products and tubers; (ii) legumes/nuts; (iii) milk products; (iv) flesh foods; (v) eggs; (vi) vitamin‐A rich fruits and vegetables; (vii) other fruits and vegetables and juices; and (viii) fats/oils. This categorization of foods was chosen so that a higher total score would likely reflect greater consumption of foods of higher nutrient density, such as animal source foods (three categories) and fruits and vegetables (two categories). The number of food groups represented in the child's diet (range 0–8, except in Brazil where it was 0–7), regardless of the amount consumed from each food group, was calculated as a measure of dietary diversity (WHO Multicentre Growth Reference Study Group 2006b). Child morbidity (fever or diarrhoea) was calculated as the number of times fever or diarrhoea were reported between 6 and 24 months (visits at 6, 7, 8, 9, 10, 11, 12, 14, 16, 18, 20, 22 and 24 months). The variable corresponding to the utilization of nutrient supplements refers to the total number of times that supplementation intake of iron or vitamin A was reported during the same time period.
Table 1.
Baseline child and parental characteristics in the sample followed from birth to 24 months, by site
| Brazil (n = 287) | Ghana (n = 292) | India (n = 269) | Norway (n = 262) | Oman (n = 260) | United States (n = 172) | |
|---|---|---|---|---|---|---|
| Child sex (% boys) | 50.9 | 48.3 | 52.8 | 53.1 | 51.9 | 49.4 |
| Child birthweight (kg) (mean ± SD) | 3.3 ± 0.4 | 3.3 ± 0.4 | 3.1 ± 0.4 | 3.6 ± 0.5 | 3.2 ± 0.4 | 3.6 ± 0.5 |
| Child birth length (cm) (mean ± SD) | 49.6 ± 1.9 | 49.4 ± 1.9 | 49.0 ± 1.8 | 50.5 ± 1.8 | 49.2 ± 1.7 | 49.8 ± 2.0 |
| Mother education (complete years) (%) | ||||||
| <10 | 33.8 | 39.7 | 0 | 32.1 | 26.1 | 0 |
| 10–14 | 40.8 | –* | 0.7 | –* | 50.8 | 8.1 |
| 15–19 | 25.4 | 60.3 | 90.0 | 67.9 | 23.1 | 77.9 |
| ≥20 | 0 | –* | 9.3 | –* | –* | 14.0 |
| Maternal age (years) (%) | ||||||
| <20 | 11.2 | 0 | 0 | 0 | 27.3 | 0 |
| 20–24 | 15.3 | 38.7 | 11.5 | 7.6 | –* | 32.0 |
| 25–29 | 28.2 | –* | 42.8 | 30.2 | 42.3 | –* |
| 30–34 | 28.2 | 41.4 | 39.4 | 42.4 | 19.2 | 41.8 |
| >35 | 17.1 | 19.9 | 6.3 | 19.8 | 11.2 | 26.2 |
| Parity (% with ≤three children) | 82.9 | 67.5 | 96.7 | 87.0 | 48.6 | 83.7 |
| Pregnant (% yes during follow‐up) | 8.0 | 27.1 | 7.4 | 22.9 | 36.5 | 33.7 |
| Duration of breastfeeding (months) [median (min,max)] | 8.3 (0.5,24) | 15.5 (2,24) | 14.9 (2,24) | 13.1 (1,24) | 22.0 (1.5,24) | 15.6 (1.4,24) |
| Iron or Vitamin A supplementation † [median (min,max)] | 1 (0,14) | 6 (0,20) | 7 (0,20) | 14 (0,19) | 1 (0,9) | 0 (0,10) |
| Number of morbidity episodes ‡ [median (min,max)] | 4 (0,17) | 3 (0,12) | 3 (0,9) | 4 (0,12) | 5 (0,16) | 3 (0,13) |
| Mother's height (cm) [mean ± SD (N)] | 161.2 ± 6.0 (287) | 161.9 ± 5.2 (289) | 157.6 ± 5.4 (269) | 168.9 ± 6.6 (261) | 156.6 ± 5.5 (260) | 164.9 ± 6.5 (172) |
| Father's height (cm) [mean ± SD (N)] | 173.8 ± 6.9 (245) | 173.0 ± 6.6 (251) | 172.8 ± 6.3 (268) | 182.3 ± 6.8 (256) | 170.5 ± 6.4 (233) | 179.0 ± 7.2 (169) |
| Mid‐parental height (cm) (mean ± SD) § | 167.5 ± 5.4 | 167.3 ± 4.6 | 165.1 ± 4.8 | 175.7 ± 5.3 | 163.6 ± 4.3 | 172.0 ± 5.1 |
SD, standard deviation. *Collapsed with the immediate lower category. †Total number of times that supplementation intake was reported between ages 6 and 24 months. ‡Total number of times that morbidity (fever or diarrhoea) was reported between ages 6 and 24 months. §Same sample size (N) as for father's height.
Proportions of the variability in attained length attributable to maternal height, paternal height and mid‐parental height were estimated by testing each of these variables in separate models adjusted for all the factors listed earlier. Correlations between mid‐parental height and child length were also estimated using Pearson coefficients (Campbell & Machin 1999).
Children's predicted adult heights were estimated by subtracting 0.7 cm from their length at 24 months (to derive height) and multiplying the result by 2. [The average difference between recumbent length and standing height on the same child in the MGRS was 0.7 cm (WHO Multicentre Growth Reference Study Group 2006d)].
Results
Table 1 summarizes, by study site, key child and parental characteristics that were used in the analytical models describing relationships between child length and selected parental characteristics, child sex and birthweight. Numbers of children followed from birth to 24 months are also presented in Table 1, but sample sizes at follow‐up fluctuated because of missing visits or missing measurements. In Brazil, 287 children were followed, but available length measurements at birth, at 6, 9, 12, 18 and 24 months varied, that is, n = 287 (range: 280–286); Ghana, n = 292 (290–292); India, n = 269 (265–269); Norway, n = 262 (249–262); Oman, n = 260 (257–260); United States, n = 172 (169–172).
Overall mean child measurements at birth were 3.3 kg weight and 49.6 cm length. Mothers and fathers were tallest in Norway and the United States and shortest in Oman. The majority of mothers in Ghana, India, Norway and the United States had at least 15 years of education. Parity was highest in Oman, where only 48.6% had three or fewer children compared with majorities in all other countries, from 67.5% in Ghana to 96.7% in India. All mothers except three in Ghana and one in Norway had a recorded height. Numbers of available mid‐parental heights matched the number of available fathers' heights (ranging from 85.4% in Brazil to 99.6% in India).
Table 2 presents Pearson correlation coefficients relating mid‐parental height to attained child length by age and study site. At birth, at 6, 9 and 12 months the highest coefficients were observed in sites with the highest mid‐parental height and the lowest were in sites with the shortest mid‐parental height. This general pattern persisted at 18 and 24 months, but not as consistently as in the first year.
Table 2.
Correlation coefficients (Pearson's r) between mid‐parental height and child length at selected ages, by site
| Age (months) | Brazil (n) | Ghana (n) | India (n) | Norway (n) | Oman (n) | United States (n) |
|---|---|---|---|---|---|---|
| Birth | 0.23 (244) | 0.24 (250) | 0.30 (268) | 0.43 (255) | 0.19 (233) | 0.39 (169) |
| 6 | 0.35 (244) | 0.35 (245) | 0.39 (264) | 0.48 (252) | 0.33 (233) | 0.47 (168) |
| 9 | 0.42 (244) | 0.34 (244) | 0.43 (264) | 0.51 (245) | 0.33 (231) | 0.50 (169) |
| 12 | 0.41 (241) | 0.37 (250) | 0.44 (268) | 0.50 (250) | 0.38 (232) | 0.52 (167) |
| 18 | 0.45 (242) | 0.41 (248) | 0.46 (264) | 0.45 (242) | 0.38 (230) | 0.55 (166) |
| 24 | 0.42 (239) | 0.44 (247) | 0.49 (268) | 0.51 (250) | 0.39 (233) | 0.59 (166) |
n = sample sizes.
Table 3 summarizes, for each site, the proportion of total between‐child variability in attained length explained by maternal, paternal or mid‐parental height, alternated within the full generalized linear model with repeated measures (at 6, 9, 12, 18 and 24 months). Mid‐parental height consistently explained a greater proportion of the observed variability in attained child length than either paternal or maternal height alone. For all sites, the proportion of between‐child variability explained by mid‐parental height ranged from a low of approximately 11% in Ghana to a high of 21% in India. The average proportion of variability explained by mid‐parental height across all sites was approximately 16%. It was striking that in Oman paternal height compared with maternal height accounted for thrice the between‐child and about twice the within‐child variability. The inverse relation was observed in the United States and Norway, but differences were smaller. The proportions of within‐child variability explained by any of the three variables always were highest in the United States.
Table 3.
Comparative proportions of the total variability in length explained by mother's height, father's height or mid‐parental height, from separate models that include selected factors*
| Country | Between | Within | ||||
|---|---|---|---|---|---|---|
| Mid‐parental | Mother | Father | Mid‐parental | Mother | Father | |
| Brazil | 13.1 | 8.3 | 8.6 | 3.8 | 2.2 | 2.7 |
| Ghana | 10.8 | 6.4 | 6.6 | 6.5 | 4.2 | 3.8 |
| India | 20.7 | 14.5 | 13.2 | 5.3 | 3.5 | 3.7 |
| Norway | 18.1 | 12.4 | 9.2 | 4.8 | 3.9 | 2.2 |
| Oman | 12.2 | 3.4 | 9.2 | 2.9 | 0.9 | 2.2 |
| United States | 18.4 | 11.3 | 8.0 | 10.4 | 6.4 | 5.2 |
*Results from separate fitted generalized linear models with repeated measures (6, 9, 12, 18 and 24 months) including the following variables: household income, sex, birthweight, mother's age mother's education, pregnancy diagnosed any time between 14 days and 24 months post‐partum, parity, duration of breastfeeding, child morbidity, diet diversity (between 6 and 9 months, 9 and 12 months, 12 and 18 months, and 18 and 24 months), and number of times the child received nutrient supplementation between 6 and 24 months.
Figure 1 compares mid‐parental stature with twice their child's attained length at 2 years. No significant differences between those values were observed in Norway and the United States. For the other sites, predictions of adult height from the child's stature at 2 years exceeded mid‐parental heights by 6.2–7.8 cm.
Figure 1.
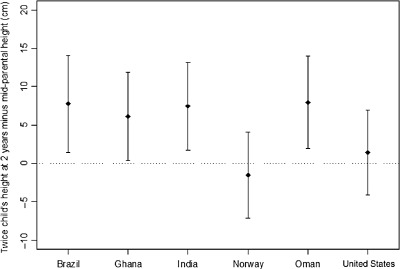
Means (points) and standard deviations (bars) of the difference between two times the height of the child at 2 years and the mid‐parental height by site.
Table 4 presents the proportion of between‐child variability in attained length explained by the child's sex, birthweight and mid‐parental height. Also listed are all factors that were significant at the 5% level considering both between‐ and within‐child analyses of variance. Of all the variables in the model, mid‐parental height consistently explained the greatest proportion of between‐child variability. It also regularly appeared as significant in the within‐child analyses of variance results. The proportions of variability accounted for by mid‐parental height ranged from 2.9% in Norway to 10.4% in the United States. No other factor examined was as consistent in explaining significant proportions of observed variability.
Table 4.
Proportion of the total between children variability in length accounted for by sex, birthweight and mid‐parental height, and various factors selected on the bases of results obtained of analyses of variance* (between and within children), by site
| Country | N (months) | Sex † | Birthweight † | Mid‐parental height † | Significant factors | |
|---|---|---|---|---|---|---|
| Brazil | 229 | 5.4 | 10.9 | 13.1 | Between | Sex, birthweight, mid‐parental height, pregnant ‡ ; diet diversity 6–9 months |
| Within § | Sex, mid‐parental height | |||||
| Ghana | 231 | 5.4 | 7.2 | 10.8 | Between | Sex, birthweight, mid‐parental height, pregnant ‡ |
| Within § | Sex, mid‐parental height, duration of breastfeeding | |||||
| India | 257 | 9.8 | 10.7 | 20.7 | Between | Sex, birthweight, mid‐parental height |
| Within § | Sex, mid‐parental height, mother's age, duration of breastfeeding | |||||
| Norway | 224 | 4.8 | 5.8 | 18.1 | Between | Sex, birthweight, mid‐parental height |
| Within § | Mid‐parental height, duration of breastfeeding | |||||
| Oman | 224 | 6.0 | 5.5 | 12.2 | Between | Sex, birthweight, mid‐parental height |
| Within § | Sex, mid‐parental height, mother's education, duration of breastfeeding, diet diversity 18–24 months, nutrient supplementation | |||||
| United States | 161 | 11.5 | 13.1 | 18.4 | Between | Sex, birthweight, mid‐parental height, parity |
| Within § | Mid‐parental height, parity, duration of breastfeeding |
*Results from separate fitted generalized linear models with repeated measures (6, 9, 12, 18 and 24 months) including the following variables: household income, sex, birthweight, mother's age mother's education, whether mother got pregnant any time between 14 days and 24 months, parity, duration of breastfeeding, child morbidity, diet diversity (between 6 and 9 months, 9 and 12 months, 12 and 18 months, and 18 and 24 months), and number of times the child received nutrient supplementation between 6 and 24 months. †Sums of squares (type III) based on the between‐children analysis of variance. ‡Pregnant = the mother got pregnant with the next child during the follow up (any time between 14 days and 24 months). §Greenhouse–Geisser correction was used for the F‐tests.
Discussion
The value of the WHO Growth Standards resides in the demonstrated remarkable similarity in the linear growth potential of diverse populations (WHO Multicentre Growth Reference Study Group 2006c). When that potential is achieved, the complex, quantitative nature of linear growth's genetic regulation suggests that the bulk of observed variation in attained stature will be found among individuals rather than among populations (King & Motulsky 2002; Cooper et al. 2003; Jorde & Wooding 2004). In fact, analysis of the MGRS data estimated the proportions of total variability attributable to sites and individuals within sites as 3% and 70%, respectively, justifying the pooling of inter‐site data to construct the WHO Child Growth Standards (WHO Multicentre Growth Reference Study Group 2006c). Furthermore, the significant genetic influence on linear growth was evident in the consistency and strength of relationships between mid‐parental height and their progeny's growth, even in populations with significant gaps between mid‐parental heights and adult heights predicted by the children's length at 2 years.
The present analyses were carried out using site‐specific models considering that some of the factors are not comparable in absolute terms between sites, for example, household income, mother's education and dietary diversity (food group composition). Thus, the summary of findings across countries is purely descriptive as comparisons are not supported by formal statistical tests of interactions.
The analyses included in this report support the ability of populations with histories of poor growth to respond rapidly and positively to conditions that favour normal growth. Correlations between mid‐parental height and child length are expected to be highest among individuals whose stature likely reflects their genetic potential, and lowest among those whose adult height largely reflects the experience of poor nutrition and/or environments during gestation and/or childhood yet whose progeny experience conditions supportive of healthy growth. The present results are consistent with these expectations, that is, the highest correlations between mid‐parental and child stature were observed in sites with the highest parental stature; the lowest were observed in sites with the shortest parental stature, but whose children experienced healthy growth patterns through 2 years of age. Differences in mid‐parental heights between sites were greatest between Norway and each of the four less economically developed study sites, namely Brazil, Ghana, India and Oman. The greatest difference, which was 12.4 cm between Norway and Oman, was equivalent to approximately three standard deviations (SDs) of the distribution of Omani mid‐parental heights. Predicted adult stature on the basis of children's height at 2 years of age (Tanner et al. 1970; Roche et al. 1975) matched mid‐parental heights in the Norwegian and United States study sites. This comparison supports the expectation that in Norway and the United States, both child and parents likely attained age‐specific genetic potential in stature. Notwithstanding likely adverse conditions experienced by parents in the other study sites, the differences of 6.2–7.8 cm in the children's favour underscore the attainability of significant advances in child stature within one generation when care and nutrition approximate international recommendations.
An alternative explanation for these observations is that observed inter‐site, mid‐parental height disparities reflect genetic and/or epigenetic differences that are not expressed fully until after two years of age. A Working Group convened by WHO and the United Nations University's Food and Nutrition Program examined in detail the possibility that genetic differences were the principal basis for global disparities in adult stature (Butte & Garza 2006). The working group concluded that environmental rather than genetic causes were the likelier explanation for global population differences in adult stature, but that a study specifically designed to test that hypothesis was necessary. The best evidence in support of environmental rather than genetic causes is the documented steady increase in mean adult stature that accompanies relatively rapid advances in nutritional and environmental health (Schmidt et al. 1995; Cole 2003; Larnkaer et al. 2006; Kagawa et al. 2011). It is likely that the tempo of normalization of a population's adult stature reflects the rate at which nutritional and environmental improvements spread within populations and the possible impact of epigenetic influences.
As for epigenetic influences on growth, reviews (Waterland & Garza 1999; Hochberg et al. 2011) of intermediate and long‐term consequences of pre‐ and post‐natal environmental and/or nutritional experiences identify epigenetic and other mechanisms as being responsible for the phenotypic plasticity of genetic endowments and putative trans‐generational impacts of those experiences. If epigenetic influences play a role in secular growth trends, trans‐generational impacts on length at 2 years of age appear limited to the equivalent of less than 0.5 SD of the multi‐site distribution of child length observed in studies that contributed to the development of the WHO Child Growth Standards (WHO Multicentre Growth Reference Study Group 2006c). However, this observation may not be universally applicable; e.g. deviations may well exceed 0.5 SD in populations with larger mid‐parental height differences than those found in the MGRS.
Considerations that focus on disparities between parental growth experiences and those of their progeny's first two or three post‐natal years may raise concerns related to potential risks of rapid growth induced by efforts to normalize the stature of children whose parents likely experienced growth stunting. Such concerns are prompted most often by evidence that rapid weight gain in early life is associated with higher risks of childhood obesity and some chronic diseases of adult onset (Barker et al. 2005; Owen et al. 2005; Ekelund et al. 2007). Although limited, published data support the view that simultaneous proportional ‘catch‐up’ gains in weight and stature do not entail similar risks (Jaquet et al. 2005). Furthermore, we are not aware of any data suggesting that substantial catch‐up growth characterized by proportional gains in weight and stature presents acute or longer‐term health risks.
In sum, children enrolled in the MGRS showed remarkably similar growth patterns from birth to 2 years of age despite large differences in parental stature among the six MGRS sites. This observation and favourable comparisons between mid‐parental heights and the children's projected adult height (based on children's height at 2 years of age) support the view that the prescribed care that characterized the MGRS populations (e.g. exclusive or predominant breastfeeding, implementation of recommended complementary feeding practices, and adoption of recommended paediatric care) eliminated or minimized significant environmental causes that account for substantial population level differences in child growth. The favourable socio‐economic status of families included in the study is also likely to have resulted in an improved nutritional status of mothers before and during pregnancy. These results show that, notwithstanding adverse conditions likely experienced by their parents, within one generation, communities can attain significant advances in children's linear growth, at least up to the age of 2 years, when care and nutrition approximate international recommendation.
Source of funding
None.
Conflicts of interest
The authors declare that they have no conflicts of interest.
Contributions
AWO, CG and MdO contributed to the conceptualization of the analyses, EB conducted the statistical analysis, and all authors contributed to the preparation and final editing of the manuscript.
Disclaimer
EB, AWO and MdO are staff members of the World Health Organization. The authors alone are responsible for the views expressed in this publication and they do not necessarily represent the decisions, policy or views of the World Health Organization.
Members of the WHO Multicentre Growth Reference Study Group
Coordinating Team: Mercedes de Onis (Study Coordinator), Adelheid Onyango, Elaine Borghi, Amani Siyam, Alain Pinol (Department of Nutrition, World Health Organization).
Executive Committee: Cutberto Garza (Chair), Mercedes de Onis, Jose Martines, Reynaldo Martorell, Cesar G. Victora (up to October 2002), Maharaj K. Bhan (from November 2002).
Steering Committee:
Coordinating Centre (WHO, Geneva): Mercedes de Onis, Jose Martines, Adelheid Onyango, Alain Pinol.
Investigators (by country): Cesar G. Victora and Cora Luiza Araújo (Brazil), Anna Lartey and William B. Owusu (Ghana), Maharaj K. Bhan and Nita Bhandari (India), Kaare R. Norum and Gunn‐Elin Aa. Bjoerneboe (Norway), Ali Jaffer Mohamed (Oman), Kathryn G. Dewey (USA).
Representatives United Nations Agencies: Cutberto Garza (UNU), Krishna Belbase (UNICEF).
Advisory Group: Maureen Black, Wm. Cameron Chumlea, Tim Cole, Edward Frongillo, Laurence Grummer‐Strawn, Reynaldo Martorell, Roger Shrimpton, Jan Van den Broeck.
Acknowledgements
The authors would like to thank Kim F. Michaelsen and Kathryn G. Dewey for their comments on the preliminary analyses and KFM's thoughtful reading and suggestions on this manuscript.
The World Health Organization retains copyright and all other rights in the manuscript of this article as submitted for publication.
References
- Barker D.J., Osmond C., Forsen T.J., Kajantie E. & Eriksson J.G. (2005) Trajectories of growth among children who have coronary events as adults. New England Journal of Medicine 353, 1802–1809. [DOI] [PubMed] [Google Scholar]
- Bhandari N., Bahl R., Taneja S., de Onis M. & Bhan M.K. (2004) Growth performance of affluent Indian children is similar to that in developed countries. Bulletin of the World Health Organization 80, 189–195. [PMC free article] [PubMed] [Google Scholar]
- Bock R.D. & Sykes R.C. (1989) Evidence for continuing secular increase in height within families in the United States. American Journal of Human Biology 1, 143–148. [DOI] [PubMed] [Google Scholar]
- Butte N.F. & Garza C. (eds) (2006) Development of an international growth standard for preadolescent and adolescent children. Food and Nutrition Bulletin 27 (Suppl.), S167–S326. [DOI] [PubMed] [Google Scholar]
- Campbell M.J. & Machin D. (1999) Medical Statistics: A Commonsense Approach, 3rd edn, John Wiley & Sons Ltd: Chichester. [Google Scholar]
- Cole T.J. (2000) Secular trends in growth. Proceedings of the Nutrition Society 59, 317–324. [DOI] [PubMed] [Google Scholar]
- Cole T.J. (2003) The secular trend in human physical growth: a biological view. Economics & Human Biology 1, 161–168. [DOI] [PubMed] [Google Scholar]
- Cooper R.S., Kaufman J.S. & Ward R. (2003) Race and genomics. New England Journal of Medicine 348, 1166–1170. [DOI] [PubMed] [Google Scholar]
- Ekelund U., Ong K.K., Linne Y., Neiovius M., Brage S., Dunber D.B. et al (2007) Association of weight gain in infancy and early childhood with metabolic risk in young adults. The Journal of Clinical Endocrinology and Metabolism 92, 98–103. [DOI] [PubMed] [Google Scholar]
- Galton F. (1886) Regression towards mediocrity in hereditary stature. Journal of the Anthropological Institute 15, 246–263. [Google Scholar]
- Garza C. & de Onis M., for the WHO Multicentre Growth Reference Study Group (2004) Rationale for developing a new international growth reference. Food and Nutrition Bulletin 25, S5–S14. [DOI] [PubMed] [Google Scholar]
- Greenhouse S.W. & Geisser S. (1959) On methods in the analysis of profile data. Psychometrika 24, 95–112. [Google Scholar]
- Hochberg Z., Feil R., Constancia M., Graga M., Junien C., Carel J.C. et al (2011) Child health, developmental plasticity, and epigenetic programming. Endocrine Reviews 32, 159–224. [DOI] [PMC free article] [PubMed] [Google Scholar]
- Jaquet D., Deghmoun S., Chevenne D., Collin D., Dzernichow P. & Levy‐Marchal C. (2005) Dynamic change in adiposity from fetal to postnatal life is involved in the metabolic syndrome associated with reduced fetal growth. Diabetologia 48, 849–855. [DOI] [PubMed] [Google Scholar]
- Jorde L.B. & Wooding S.P. (2004) Genetic variation, classification and ‘race. Nature Genetics 36 (Suppl. 11), S28–S33. [DOI] [PubMed] [Google Scholar]
- Kagawa M., Tahara Y., Moji K., Nakao R., Aoyagi K. & Hills A.P. (2011) Secular changes in growth among Japanese children over 100 years (1900–2000). Asia Pacific Journal of Clinical Nutrition 20, 180–189. [PubMed] [Google Scholar]
- King M.C. & Motulsky A.G. (2002) Mapping human history. Science 298, 2342–2343. [DOI] [PubMed] [Google Scholar]
- Larnkaer A., Attrup Schrøder S., Schmidt I.M., Hørby Jørgensen M. & Fleischer Michaelsen K. (2006) Secular change in adult stature has come to a halt in northern Europe and Italy. Acta Paediatrica 95, 754–755. [DOI] [PubMed] [Google Scholar]
- Littell R.C., Henry P.R. & Ammerman C.B. (1998) Statistical analysis of repeated measures data using SAS procedures. Journal of Animal Science 76, 1216–1231. [DOI] [PubMed] [Google Scholar]
- Mohamed A.J., Onyango A.W., de Onis M., Prakash N., Mabry R.M. & Alasfoor D.H. (2004) Socioeconomic predictors of unconstrained child growth in Muscat, Oman. Eastern Mediterranean Health Journal 10, 295–302. [PubMed] [Google Scholar]
- de Onis M., Garza C., Victora C.G., Onyango A.W., Frongillo E.A. & Martines J., for the WHO Multicentre Growth Reference Study Group (2004a) The WHO multicentre growth reference study: planning, study design, and methodology. Food and Nutrition Bulletin 25, S15–S26. [DOI] [PubMed] [Google Scholar]
- de Onis M., Onyango A.W., Van Den Broeck J., Chumlea W.C. & Martorell R., for the WHO Multcentre Growth Reference Study Group (2004b) Measurement and standardization protocols for anthropometry used in the construction of a new international growth reference. Food and Nutrition Bulletin 25, S27–S36. [DOI] [PubMed] [Google Scholar]
- Onyango A.W., Pinol A.J. & de Onis M., for the WHO Multicentre Growth Reference Study Group (2004) Managing data for a multicountry longitudinal study: experience from the WHO Multicentre Growth Reference Study. Food and Nutrition Bulletin 25, S46–S52. [DOI] [PubMed] [Google Scholar]
- Owen C.G., Martin R.M., Whincup P.H., Smith G.D. & Cook D.G. (2005) Effect of infant feeding on the risk of obesity across the life course: a quantitative review of published evidence. Pediatrics 115, 1367–1377. [DOI] [PubMed] [Google Scholar]
- Owusu W.B., Lartey A., de Onis M., Onyango A.W. & Frongillo E.A. (2004) Factors associated with unconstrained growth among affluent Ghanaian children. Acta Paediatrica 93, 1115–1119. [DOI] [PubMed] [Google Scholar]
- Prader A., Largo R.H., Molinari L. & Issler C. (1989) Physical growth of Swiss children from birth to 20 years of age. First Zurich longitudinal study of growth and development. Helvetica Paediatrica Acta. Supplementum 52, 1–125. [PubMed] [Google Scholar]
- Roche A.F., Wainer H. & Thissen D. (1975) Predicting Adult Stature for Individuals. Monographs in paediatrics. 3rd edn, Karger: Basel. [PubMed] [Google Scholar]
- Schmidt I.M., Jorgensen M.H. & Michaelsen K.F. (1995) Height of conscripts in Europe: is postneonatal mortality a predictor? Annals of Human Biology 22, 57–67. [DOI] [PubMed] [Google Scholar]
- Tanner J.M., Goldstein H. & Whitehouse R.H. (1970) Standards for children's height at ages 2–9 years allowing for height of parents. Archives of Disease in Childhood 45, 755–762. [DOI] [PMC free article] [PubMed] [Google Scholar]
- Victora C.G., Adair L., Fall C., Hallal P.C., Martorell R., Richter L. et al, for the Maternal and Child Undernutrition Study Group (2008) Maternal and child undernutrition: consequences for adult health and human capital. Lancet 371, 340–357. [DOI] [PMC free article] [PubMed] [Google Scholar]
- Waterland R.A. & Garza C. (1999) Potential mechanisms of metabolic imprinting that lead to chronic disease. The American Journal of Clinical Nutrition 69, 179–197. [DOI] [PubMed] [Google Scholar]
- WHO Multicentre Growth Reference Study Group (2006a) Enrolment and baseline characteristics in the WHO Multicentre Growth Reference Study. Acta Paediatrica 95 (Suppl. 450), 7–15. [DOI] [PubMed] [Google Scholar]
- WHO Multicentre Growth Reference Study Group (2006b) Complementary feeding in the WHO Multicentre Growth Reference Study. Acta Paediatrica 95 (Suppl. 450), 27–37. [DOI] [PubMed] [Google Scholar]
- WHO Multicentre Growth Reference Group (2006c) Assessment of differences in linear growth among populations in the WHO Multicentre Growth Reference Study. Acta Paediatrica 95 (Suppl. 450), 56–65. [DOI] [PubMed] [Google Scholar]
- WHO Multicentre Growth Reference Study Group (2006d) WHO Child Growth Standards based on length/height, weight and age. Acta Paediatrica 95 (Suppl. 450), 76–85. [DOI] [PubMed] [Google Scholar]