

Abstract
Fortified beverages and supplementary foods, when given during pregnancy, have been shown to have positive effects on preventing maternal anaemia and iron deficiency. Studies show that use of micronutrient fortified supplementary foods, especially those containing milk and/or essential fatty acids during pregnancy, increase mean birthweight by around 60–73 g. A few studies have also shown that fortified supplementary foods have impacts on increasing birth length and reducing preterm delivery. Fortification levels have ranged generally from 50% to 100% of the recommended nutrient intake (RNI). Iron, zinc, copper, iodine, selenium, vitamins A, D, E, C, B1, B2, B6, and B12, folic acid, niacin and pantothenic acid are important nutrients that have been included in fortified beverages and supplemental foods for pregnant and lactating women. While calcium has been shown to reduce the risk of pre‐eclampsia and maternal mortality, calcium, phosphorus, potassium, magnesium and manganese can have negative impacts on organoleptic properties, so many products tested have not included these nutrients or have done so in a limited way. Fortified food supplements containing milk and essential fatty acids offer benefits to improving maternal status and pregnancy outcome. Fortified beverages containing only multiple micronutrients have been shown to reduce micronutrient deficiencies such as anaemia and iron deficiency.
Keywords: fortified food and beverage, pregnant and lactating women, nutritional status
Introduction
The period of greatest risk and greatest opportunity for making a difference in children's survival, growth and development is from conception through the first 2 years of life. These first 1000 days are when interventions can have long‐term positive impacts on children's survival, growth and intelligence quotient, resulting in improved school performance and higher incomes and enhanced productivity in adulthood.
Inadequate nutrition in pregnancy includes poor dietary quality and associated inadequate intakes of micronutrients, essential fatty acids, energy and protein resulting in low body mass and inadequate weight gain in pregnancy. This can lead to increased maternal mortality from severe anaemia and increased risk of pre‐eclampsia, premature delivery and having a low‐birthweight (LBW) baby.
Inadequate micronutrient intake is common in both non‐pregnant non‐lactating women (NPNL) and lactating women in developing countries. Figure 1 presents this data for Burkina Faso, Mali, Mozambique, Bangladesh and the Philippines. There is a high prevalence of inadequate intakes of riboflavin, niacin, folate, vitamin B12, calcium and iron among NPNL and low intake of almost all micronutrients for lactating women across these five countries (Arimond et al. 2010). In Latin American countries and in other parts of the world, more than 40% of the population is at risk for inadequate zinc intake (Brown et al. 2004). Deficiencies in micronutrients such as vitamin B12 in India and vitamin A in many parts of the world are common, and low intakes of other micronutrients (e.g. vitamins E and D and calcium) are also prevalent, compromising women's health and that of their newborns. In developing countries where dietary iron and zinc come primarily from plant‐based sources, the bioavailability is low because anti‐nutrients that are naturally present in plant‐based foods can decrease the bioavailability of iron and zinc in these foods (Bhargava et al. 2001).
Figure 1.
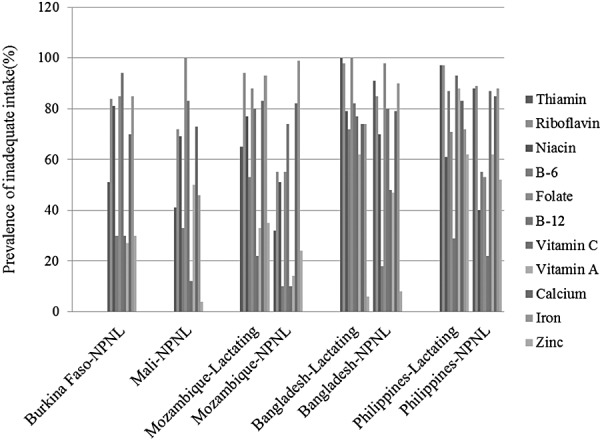
Prevalence of inadequate micronutrient intake of women in developing countries.The data were extracted from Table 6 (Arimond et al. 2010). NPNL, non‐pregnant non‐lactating women.
In developing countries, micronutrient deficiencies are common during pregnancy, and around 50% of pregnant women are anaemic. Severely anaemic women are at increased risk of death in pregnancy: 13% of maternal deaths in Asia and 4% in Africa are directly caused by anaemia (UNICEF, 2009). Anaemia contributes to the over 30% of deaths that are due to haemorrhage.
An assessment of micronutrient status among pregnant women in Nepal found that only 4% had no micronutrient deficiency and almost 18% had five or more deficiencies (Jiang et al. 2005). Nearly one‐third (32%) of the women were deficient in riboflavin, 40% had vitamin B6 deficiency and 28% had vitamin B12 deficiency (Fig. 2).
Figure 2.
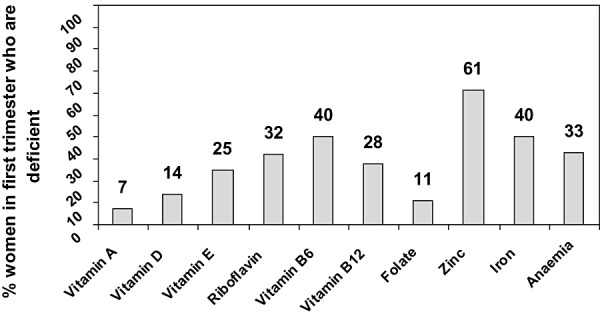
Multiple micronutrient deficiencies occur in women in first trimester, Sarlahi Nepal. The data were extracted from Table 3 (Jiang et al. 2005).
Additionally, low intakes of essential fatty acids, especially omega‐3 fatty acids, are problematic. While daily mean intakes of omega‐3 fatty acids in pregnant women in the United States are 1470 mg (Nesheim & Yaktine 2007); in Chile (Mardones et al. 2008) and India (Muthayya et al. 2009), daily intakes in pregnant women are only one‐third of that (500–600 mg). Such low intakes are related to low intake of fat and types of fats consumed (in developing countries, only soybean oil and rapeseed oil are commonly consumed oils that contains omega‐3 fatty acids) and the fact that other foods containing omega‐3 fatty acids (including fatty fish, meat and eggs) are not commonly eaten in sufficient amounts. In Burkina Faso, mean percent of energy as fat in the diet was only 13% in pregnant women (Huybregts et al. 2009b), and in Sudan and Bangladesh, fat intakes during lactation were only 19% (Nyuar et al. 2010) and 8% (Yakes 2010) compared with the minimum World Healh Organization and US recommendation for pregnant and lactating women (20%).
Poor essential fatty acid status in pregnancy results in higher rates of LBW, pre‐eclampsia and poor child development outcomes such as reduced visual acuity. Poor maternal fatty acid status in lactation results in low amounts of fatty acids in breast milk, which is associated with detriments to the infant's mental development and longer‐term cognition (Eilander et al. 2007). Poor maternal fatty acid status is also associated with post‐partum depression (Eilander et al. 2007).
Numerous studies have shown the relationship between low energy intake, low body mass index (BMI) in pregnancy and inadequate weight gain with increased risk for LBW. Inadequate energy intake or poor quality diet are key risk factors for intrauterine growth restriction (IUGR) (Kramer & Kakuma 2003; Haider & Bhutta 2006) and other pregnancy complications (e.g. pre‐eclampsia, Caesarean delivery) (Hofmeyr et al. 2011). LBW is also associated with increased risk of obesity and metabolic syndrome (i.e. insulin resistance) later in life, even after adjusting for adult BMI (Oken & Gillman 2003). In the developing world, the prevalence of LBW is about 16% and more than 10% of LBW babies exhibit IUGR (Black et al. 2008). Premature birth is another consequence of inadequate maternal nutrition, and 85% of the 10 million 1 premature births are IUGR. LBW is an underlying factor in 60–80% of neonatal deaths (Lawn et al. 2010).
Maternal underweight (low BMI) is still prevalent in certain regions such as south‐central Asia and sub‐Saharan Africa (Black et al. 2008). Using Demographic and Health Survey data, rates of low BMI in women in developing countries range from less than 1% in Egypt to almost 40% in India. In Africa, the prevalence of maternal underweight is above 20% in Chad (22.6%), Ethiopia (23.8%) and Madagascar, (28.2%) and the highest rates are found in South Asia (India 39.9%, Bangladesh 32.8%, Nepal 26.1%).
Nutritional interventions have shown significant beneficial effects in reducing iron deficiency anaemia, neural tube defects, IUGR and pre‐eclampsia during pregnancy and lactation (Kramer & Kakuma 2003; Haider & Bhutta 2006; Hofmeyr et al. 2011). Iron‐folic acid supplements or multiple micronutrient supplements (MMS) during pregnancy have been recommended to improve micronutrient status and prevent neural tube defects (when given prior to pregnancy and in the first few weeks gestation). However, the coverage of these supplementation programmes has been low due to weak or ineffective policies, poor distribution, or lack of supplies, and the timing is usually too late to catch early pregnancy. For these and other reasons, anaemia during pregnancy is still highly prevalent (Kardjati et al. 1988; Black et al. 2008).
Improving dietary intakes of nutrients and essential fatty acids during pregnancy by counselling mothers on increasing intake of animal‐source foods, fruits and vegetables, legumes and nuts, milk products, and fats/oils is an optimal approach, but might be difficult where such food availability is limited or costly. It is especially difficult to meet the additional iron needs during pregnancy through a dietary approach, unless foods such as meat, liver or blood are available and affordable. Foods specially formulated to meet the nutrient needs of pregnant and lactating women can help women meet their iron and other nutrient needs. However, in developing countries, there are few products specifically for pregnant or lactating women that are affordable or available in the market.
UNICEF's Tracking Progress on Maternal and Child Nutrition (UNICEF 2009) emphasizes supplementation with iron–folic acid (Fe FA) or multiple MMS to reduce anaemia and other deficiencies prior to and during pregnancy. They suggest reducing anaemia to decrease pregnancy complications, maternal mortality and LBW and improving pregnant women's micronutrient status through use of supplements and fortified foods in order to reduce micronutrient deficiencies. Additionally, they support the use of fortified food supplements [such as lipid‐based nutrient supplements (LNS)] for undernourished women.
A recent meta‐analysis summarized the results of 12 randomized clinical trials which provided approximately one recommended dietary allowance (RDA) of multiple micronutrients (MMNs) [nine of them used the United Nations International Multiple Micronutrient Preparation (UNIMMAP)] to pregnant women in developing countries. The results showed that overall, MMN supplementation increased mean birthweight by 22 g, compared with the control (mainly iron + folic acid supplements), reduced the prevalence of LBW and small‐for‐gestational age by 11% and 10%, respectively (Fall et al. 2009). Cochrane reviews also support these findings for MMNs (Haider & Bhutta 2006).
A Cochrane review also illustrated the benefits of calcium supplementation in pregnancy on reducing pre‐eclampsia, death and serious morbidity (Hofmeyr et al. 2011). The Lancet series on maternal and child nutrition calculated that universal calcium supplementation (at least 1000 mg calcium per day) could prevent some 21 500 maternal deaths and reduce disability adjusted life‐years by 620 000.
Randomized controlled trials assessed intakes of supplements of fish oil, eicosapentaenoic acid and docosahexaenoic acid (DHA), or DHA alone (in supplements or eggs) in pregnancy in relation to pregnancy outcomes. Supplementation increased maternal DHA levels, placental transfer to the fetus (Helland et al. 2001; Dunstan et al. 2004; Krauss‐Etschmann et al. 2007) and DHA concentration in breast milk (Imhoff‐Kunsch et al. 2009). The dosage of DHA in these studies ranged from 0.4 g to 2.2 g. Duration of gestation in the DHA supplementation group increased by1.6–6.0 days in industrialized countries (Smuts et al. 2003; Makrides et al. 2009; Szajewska et al. 2006). DHA was associated with reduced risk of very early preterm birth (<34 weeks) in a meta‐analysis of women at high risk for this (Horvath et al. 2007). The concentration of DHA has been shown to vary widely in breast milk, and thus consuming supplements that contain DHA could improve DHA breast milk concentration and the infant's DHA status. Observational studies in both developed and developing countries indicate a likely relationship between DHA levels (as measured in breast milk) and post‐partum depression, with lower levels of DHA associated with higher rates of post‐partum depression (Hibbeln 2002).
In Mexico, Ramakrishnan et al. (2010) assessed the impact of DHA supplementation (400 mg/day) during pregnancy on infant growth and development through a randomized controlled intervention trial. Overall, no effect was found on growth outcomes (although cord and plasma DHA improved); however, among a subgroup of primigravidae, birthweight significantly increased by 99.4 g and head circumference by 0.5 cm among the supplemented women.
The aim of this review is to identify vitamin‐ and mineral‐fortified products developed specifically for pregnant and lactating women and examine their impacts on maternal nutritional status and growth, birth outcomes, and development of the offspring. We identified and assessed micronutrient fortified beverages (Latham et al. 2003; Hyder et al. 2007), products containing cow's milk (Lechtig et al. 1975; Mora et al. 1979; Viegas et al. 1982a; Compbell‐Brown 1983; Ross et al. 1985; Mardones‐Santander et al. 1988; Atton & Watney 1990; Mardones et al. 2008; Fernald et al. 2009), high‐fat products (Girija et al. 1984; Prentice et al. 1987; Ceesay et al. 1997) including LNS (Huybregts et al. 2009a) and protein‐energy drinks (Rush et al. 1980; Adair & Pollitt 1985; Kardjati et al. 1988). This document can serve as a resource for developing nutrition products for pregnant or lactating women and provides concrete examples of fortified products that have shown impact on mothers or their offspring.
Key messages
-
•
Both micronutrient‐fortified beverages and fortified supplementary foods, when given during pregnancy, have shown positive effects on maternal anaemia and iron deficiency prevention.
-
•
Some studies have found that supplementary foods during pregnancy increased mean birthweight by around 60–73 g, which is about three times that seen with multiple micronutrient supplements.
-
•
When both maternal nutritional status improvements and birth outcome improvements are the primary outcomes of a programme, fortified food supplements are preferable to fortified beverages containing only multiple micronutrients.
-
•
Increasing intake of energy was related to improvements in birthweight but primarily in women who were more malnourished. High amounts of protein had no impact on birthweight. It is possible that ingredients such as milk, micronutrients or essential fatty acids had greater benefits on increasing mean birthweights. The interaction between milk ingredients, essential fatty acids and micronutrients warrants further investigation.
Micronutrient fortified beverages (not containing milk or other protein/fat sources)
In this review, a micronutrient fortified beverage is defined as a MMN‐fortified drink with some added sugar, but without added protein or fat. Proctor and Gamble produced a fortified juice powder (25 g added to water and drunk twice daily), which was used in a trial in Tanzania. The nutrient composition is listed in Table 1 (Latham et al. 2003). The Tanzanian trial was a placebo‐controlled, randomized clinical trial that started in 1999. Four hundred thirty‐nine (439) pregnant women between 12 and 34 weeks of pregnancy were randomly assigned to either the experimental group (n = 227) or control group (n = 212) for 8 weeks. At follow‐up, 127 pregnant women remained in the experimental group (44% dropout) and 132 pregnant women in the control group (38% dropout). Of those who completed the study, 93.4% consumed at least 70% of the supplements. At the end of the supplementation period, the prevalence of anaemia was significantly lower in the fortified beverage group (37%) than in the non‐fortified group (48.5%) (P = 0.018), and serum ferritin concentrations were also significantly higher in the experimental group (21.5 µg L−1) than in the control group (16.9 µg L−1) (P = 0.009). There were no significant differences in retinol or C‐reactive protein concentrations between the two groups (Makola et al. 2003).
Table 1.
Nutrient composition of fortified beverages (containing no milk or fat) compared with MMN supplement (UNIMMAP)
| Nutrients | Fortified beverages in Tanzania (per day) (Latham et al. 2003) | Fortified beverages in Bangladesh (one serving) (Hyder et al. 2007) | UNIMMAP (daily dose) (Kaestel et al. 2005) | RNI WHO/FAO (2004) for pregnant women | |||
|---|---|---|---|---|---|---|---|
| Amount | % of RNIs | Amount | % of RNIs | Amount | % of RNIs | ||
| Energy (kcal) | 176 | ||||||
| Vitamin A (IU) | 1750 | 66 | 1296 | 65 | 2664 | 100 | 2664 |
| Vitamin D3 (µg) | 5 | 100 | 5 | ||||
| Vitamin E (mg) | 10.5 | 70 | 10 | 133 | 10 | 67 | 15* |
| Thiamine (mg) | 1.4 | 100 | 1.4 | ||||
| Riboflavin (mg) | 0.6 | 43 | 0.91 | 91 | 1.4 | 100 | 1.4 |
| Niacin (mg) | 5 | 28 | 5.0 | 31 | 18 | 100 | 18 |
| Vitamin B6 (mg) | 0.7 | 37 | 1.0 | 83 | 1.9 | 100 | 1.9 |
| Folic acid (µg) | 140 | 23 | 120 | 30 | 400 | 67 | 600 |
| Vitamin B12 (µg) | 3 | 115 | 1.0 | 42 | 2.6 | 100 | 2.6 |
| Ascorbic acid (mg) | 72 | 131 | 120 | 300 | 70 | 127 | 55 |
| Biotin (µg) | 30 | ||||||
| Calcium (mg) | 1200 | ||||||
| Phosphorus (mg) | 700* | ||||||
| Magnesium (mg) | 220 | ||||||
| Iron (mg) | 5.4 | 20 | 7 | 47 | 30 | 111 | 27* |
| Zinc (mg) | 5.25 | 53 | 7.5 | 83 | 15 | 150 | 10 ‡ |
| Copper (mg) | 2.0 | 174 | 1.15 † | ||||
| Selenium (µg) | 65 | 217 | 30 | ||||
| Iodine (µg) | 45 | 23 | 75 | 50 | 150 | 75 | 200 |
IU, International Units; UNIMMAP, United Nations international multiple micronutrient preparation; RNI, recommended nutrient intake. IOM *(Food and Nutrition Board, 2002/2005), from dietary recommended intakes females 19–50 years.†From Food and Agriculture Organization/IAEA/World Health Organization, trace elements in human nutrition and health (1996).‡Assume moderate bioavailability of zinc during the third trimester.
A similar product was evaluated in a randomized controlled trial in Bangladeshi adolescent girls (Hyder et al. 2007). The product was also produced by Proctor and Gamble with modifications to fit this younger age group. The nutrient composition is shown in Table 1. In the study, the fortified beverage had significant impacts on haemoglobin concentration, serum ferritin and retinol concentrations. However, the impact on serum zinc was not significant (13.3 vs. 12.9 µmol L−1, P = 0.3). Interestingly, the girls in the experimental group gained more weight and increased their mid‐upper arm circumference compared with the girls in the control group.
In summary, these randomized controlled trials showed that MMN‐fortified beverages significantly increased haemoglobin concentration (∼4 g L−1, P < 0.05) and ferritin concentrations (5–10 µg L−1, P < 0.01), and reduced anaemia by approximately one‐third (P < 0.05) in pregnant women and adolescent girls. The MMN‐fortified beverage significantly reduced vitamin A deficiency in adolescent girls (P < 0.01, Table 2).
Table 2.
Impacts of fortified beverages
| Author | Site | Study design | Subjects | Study group | Control group | Intake | Outcome |
|---|---|---|---|---|---|---|---|
| Latham (Latham et al. 2003) | Tanzania | Placebo‐controlled, double‐blinded RCT | Pregnant women between 12–34 weeks | Fortified juice powder | Equal energy powder drink | 50 g daily | Significantly lower anaemia prevalence (37% vs. 48.5%) |
| 4.2 g L−1 increase in Hb and 3 µg L−1 increase in ferritin | |||||||
| Latham (Latham et al. 2003) | Tanzania | Placebo‐controlled, double‐blinded RCT | 6–11 years school children | Fortified juice powder | Equal energy powder drink | 25 g daily | Significantly lower anaemia prevalence (26.3% vs. 35.6%) |
| Ferritin increase by 14 µg L−1 | |||||||
| Vitamin A deficiency reduction (11.3% vs. 19.7%) | |||||||
| Hyder (Hyder et al. 2007) | Bangladesh | Placebo‐controlled, double‐blinded RCT | Mean age 12 years adolescent girl | Fortified juice powder | Equal energy drink powder | 18 g daily | Significant increase in Hb (∼4 g L−1), ferritin (∼10 µg L−1), retinol (∼0.2 µmol L−1). |
| Significant increase in weight, MUAC and BMI. |
BMI, body mass index; MUAC, mid‐upper arm circumference; RCT, randomized controlled trial.
The daily dose of the MMN‐fortified beverage for pregnant women contained 176 kcal with about 50% of the recommended nutrient intake (RNI) for iron, niacin, folic acid, iodine, and 100% of the RNI for vitamins A, E, B1, B6 and zinc, and 200% of the RNI for vitamins C and B12.
Products containing cow's milk
A long‐term prospective study, which lasted from 1969 to 1977 investigated the effect of energy‐protein supplementation during pregnancy on birthweight in Guatemala (Lechtig et al. 1975). The study was a cluster randomized trial. Four villages were selected from qualified villages based on socio‐economic status. Two villages (one small and one large) were given Atole (an energy‐protein supplement). The matched two villages were given Fresco (a control product). Atole contained a vegetable protein mix (Incaparina‐maize flour 65%, cottonseed flour 25% and soya bean flour 10%) (31% by weight) (Tartanac 2000), dry skimmed milk (49%) and sugar (20%); Fresco was similar to Atole but contained no protein or fat and only 59 compared with 163 calories per 100 mL. Prior to October 1971, there were no micronutrients added to Fresco. The fortification level for Atole was low, meeting only 4% of the RDA for iron for pregnant women (Table 3).
Table 3.
Nutrient composition of products containing cow's milk
| Nutrients | Guatemala Atole (Martorell et al. 1995) | Chile powdered milk (per 100 g) (Mardones et al. 2008) | Chile powdered milk (per 100 g)‐1988 (Mardones‐Santander et al. 1988) | UK milk contained drink (per serving) (Viegas et al. 1982b) | UK flavoured milk per 100 mL (Atton & Watney 1990) | South Africa Bean‐corn blended food (Ross et al. 1985) | South Africa Milk‐based product (Ross et al. 1985) | Mexico Oportunidades per serving (Rosado et al. 2000) | RNI WHO/FAO (2004) for pregnant women | ||||||||
|---|---|---|---|---|---|---|---|---|---|---|---|---|---|---|---|---|---|
| Amount | % of RNIs | Amount | % of RNIs | Amount | % of RNIs | Amount | % of RNIs | Amount | % of RNIs | Amount | % of RNIs | Amount | % of RNIs | Amount | % of RNIs | ||
| Energy (kcal) | 163 | 15 | 521 | 24 | 470 | 21 | 273 | 12 | 158 | 7 | 775 | 35 | 699 | 32 | 250 | 11.4 | 2200* |
| Protein (g) | 11 | 31 | 25 | 35 | 14.5 | 20 | 7.5 | 10 | 5.7 | 8 | 36 | 51 | 44 | 62 | 12 | 16.9 | 71* |
| Fats (g) | 0.7 | 21 | 21 | 5.85 | |||||||||||||
| Milk fat | 10.5 | 10.5 | |||||||||||||||
| Vegetable fat | 10.5 | 10.5 | |||||||||||||||
| n‐3 PUFA | 0.9 | 64 | 1.4* | ||||||||||||||
| n‐6 PUFA | 4.4 | 34 | 5.25 | 40 | 13* | ||||||||||||
| Carbohydrates (g) | 27 | 31 | 58 | 33 | 56 | 32 | 20.75 | 12 | 175* | ||||||||
| Fiber (g) | 28* | ||||||||||||||||
| Lactose (g) | 3 | 4 | |||||||||||||||
| Vitamin A (IU) | 3996 | 150 | 3663 | 138 | 125 | 5 | 4000 | 150 | 2664 | ||||||||
| Vitamin D3 (µg) | 15 | 300 | 10.8 | 216 | 0.25 | 5 | 5 | ||||||||||
| Vitamin E (mg) | 45 | 300 | 2.1 | 14 | 10 | 67 | 15* | ||||||||||
| Thiamin (mg) | 0.4 | 29 | 1.0 | 71 | 0.3 | 21 | 0.06 | 4 | 0.3 | 21 | 0.7 | 50 | 1.4 | ||||
| Riboflavin (mg) | 0.5 | 36 | 1.0 | 71 | 0.77 | 55 | 0.15 | 11 | 0.3 | 21 | 1.9 | 136 | 1.5 | 107 | 1.4 | ||
| Niacin (mg) | 1.3 | 7 | 10 | 56 | 3.3 | 18 | 1.5 | 8 | 4 | 22 | 2.2 | 12 | 18 | ||||
| Vitamin B6 (mg) | 2.0 | 105 | 0.72 | 38 | 1.9 | ||||||||||||
| Folic acid (µg) | 600 | 100 | 400 | 67 | 20 | 3 | 100 | 16.7 | 600 | ||||||||
| Vitamin B12 (µg) | 1.5 | 58 | 2.6 | 100 | 2.6 | ||||||||||||
| Pantothenic acid (mg) | 6.0 | ||||||||||||||||
| Ascorbic acid (mg) | 110 | 200 | 340 | 618 | 30 | 54 | 3.75 | 7 | 40 | 73 | 40 | 73 | 55 | ||||
| Biotin (µg) | 45 | 150 | 30 | ||||||||||||||
| Sodium (mg) | 92 | 6 | 1500* | ||||||||||||||
| Potassium (mg) | 175.5 | 4 | 4700* | ||||||||||||||
| Calcium (mg) | 400 | 67 | 960 | 80 | 860 | 72 | 141 | 12 | 1300 | 108 | 1200 | ||||||
| Phosphorus (mg) | 300 | 86 | 720 | 103 | 660 | 94 | 109 | 16 | 700* | ||||||||
| Magnesium (mg) | 90 | 41 | 130 | 59 | 220 | ||||||||||||
| Iron (mg) | 1.2 | 4 | 27 | 100 | 43 | 159 | 3 | 11 | 0.75 | 3 | 9.3 | 34 | 2.8 | 10 | 15 | 55.6 | 27* |
| Zinc (mg) | 12 | 120 | 6.5 | 65 | 1.0 | 10 | 15 | 150 | 10 ‡ | ||||||||
| Copper (mg) | 0.52 | 45 | 0.1 | 9 | 1.15 † | ||||||||||||
| Manganese (mg) | 0.01 | 1 | 2.0* | ||||||||||||||
| Iodine (µg) | 60 | 30 | 100 | 50 | 200 | ||||||||||||
| Selenium (µg) | 15 | 50 | 30 | ||||||||||||||
IU, International Units; PUFA, polyunsaturated fatty acid; RNI, recommended nutrient intake. *Food and Nutrition Board, (2002/2005); energy is calculated for a low active pregnant woman aged 30 years in the second trimester with a body mass index of 18.5 kg/m2 and height 1.55 m (Food and Nutrition Board, 2002), from dietary recommended intakes females 19–50 years. †From Food and Agriculture Organization/IAEA/World Health Organization, trace elements in human nutrition and health (1996). ‡Assume moderate bioavailability of zinc during the third trimester.
From 1971, both Fresco and Atole were fortified with same level of micronutrients (i.e. 7% of RDA for vitamin C and 18% of RDA for iron, 62.5% of vitamin A and close to one RDA for vitamins B1, B2 and niacin), except for 400 mg calcium and 300 mg phosphorus in Atole (because of inclusion of milk), but not in Fresco. The supplements were provided twice daily (mid‐morning and mid‐afternoon) (Martorell et al. 1995). Subjects voluntarily went to a health centre to receive the products. Thus, self‐selection bias could have existed. The mean birthweight was significantly higher in the Atole group (3107 g, n = 219) than in the Fresco group (2992 g, n = 186) (P < 0.025) and was significantly higher in the high intake group (defined as total supplemental energy >20 000 kcal, 3105 g, n = 170) than in the low intake group (2994 g, n = 235) in Atole and Fresco combined groups (P < 0.025) (Lechtig et al. 1975). The results showed an estimated 30 g increase in birthweight/10 000 kcal ingested from supplement (Rasmussen & Habicht 2010). A major finding was that women with lower fat stores had larger infants instead of increasing their own weight during the pregnancy. In contrast, those with better current nutritional status had only modestly larger babies and gained weight themselves during this same period. Women who gained more weight in pregnancy breastfed for a longer duration than those with lower weight gains (Table 4).
Table 4.
Impacts of milk‐containing products
| Author | Site | Study design | Subjects | Study group | Control group | Intake | Outcome |
|---|---|---|---|---|---|---|---|
| Lechtig (Lechtig et al. 1975) | Guatemala | Cluster RCT and the village was matched in socioeconomic status and population size | All pregnant women living in the villages, voluntarily participating in the supplementation trial | Atole | Fresco with 59 kcal energy and no protein with same level fortificants except Ca and P | Median intake was 163 kcal daily for about 4 months | Significant effects of Atole on birthweight (3107 g vs. 2992 g); |
| High intake also significant improved birthweight (3105 g vs. 2994). | |||||||
| Mardones (Mardones et al. 2008) | Chile | RCT without blinding | Pregnant women before 20 weeks | Milk powder fortified with ALA and more micronutrients | Milk powder fortified with small amount of micronutrients | 32 g milk powder with about 170 kcal energy | Significant increase in birthweight (3265 g vs. 3200 g), birth length (49.36 cm vs. 48.98 cm), and decrease in very early preterm delivery (0.4% vs. 2.1%). |
| Mardones‐Santander (Mardones‐Santander et al. 1988) | Chile | RCT without blinding | Underweight pregnant women before 20 weeks of pregnancy | Fortified milk powder | Milk powder without fortification | 37 g milk powder with 174 kcal. | Significant improvements in birthweight (3178 g vs. 3105 g), IUGR (32.5% vs. 43.7%), haemoglobin (126 g L−1 vs. 119 g L−1), iron deficiency (45% vs. 73%) |
| Barber (Barber & Gertler 2008) | Mexico | Quasi‐experimental design | Eligible pregnant women (condition on economical status for cash transfer) | Fortified milk‐based supplements | Delayed receiving supplements | 52 g per daily ration contained 250 kcal | Significant improvement in birthweight (127 g), reducing in LBW by 4%. |
| Viegas (Viegas et al. 1982b) | UK | RCT | Pregnant women starting at18–20 weeks of gestation | Fortified skimmed milk | Vitamin or energy‐vitamin supplements | Chocolate flavoured milk drink with 273 kcal energy daily from 18–38 weeks | No significant difference in birthweight; significantly improved maternal skin fold thickness |
| Viegas (Viegas et al. 1982a) | UK | RCT | Selected pregnant women with skinfold thickness increment <20 µm week−1 from 18–28 and the treatment lasted from 28–38 weeks | Skimmed milk with multivitamin supplements | Multivitamin or energy‐vitamin supplements | Chocolate flavoured milk drink with 450 kcal energy daily from 28–38 weeks | Significant improvement in birthweight (3350 g vs. 3020 g in vitamin control) |
| Atton (Atton & Watney 1990) | UK | RCT | Selected pregnant women with skinfold thickness increment <20 µm week−1 from 18–28 and the treatment lasted from 28–38 weeks | Fortified skimmed flavoured milk | No supplement | Milk drink with 407 kcal energy and 14.6 g protein. | No significant difference in birthweight |
IUGR, intrauterine growth restriction; LBW, low‐birthweight; RCT, randomized controlled trial.
Data were analysed from women who participated in the supplementation trial during two consecutive pregnancies and interim lactation period. Results showed that birthweight for the second child whose mothers consumed a high intake of the supplements (either Atole or Fresco), during lactation (>40 000 kcal), during the previous pregnancy and this pregnancy (>20 000 kcal) was 246 g significantly more than birthweights for those whose mothers consumed lesser amounts of the supplements during the course of the previous pregnancy (<20 000 kcal), lactation (<40 000 kcal) and the most‐recent pregnancy (<20 000 kcal) (P < 0.025) (Villar & Rivera 1988).
A product studied in Chile among pregnant women was a milk powder fortified with amino‐chelated iron, omega‐3 fatty acids (0.9 g alpha‐linolenic acid and 4.4 g linoleic acid/100 g product) and additional micronutrients (Mardones et al. 2008). The nutrient composition of the product is listed in Table 3. This was a randomized controlled trial without blinding of subjects but the investigators were blinded.
The study started in 2002 and an iron‐folic acid supplementation programme during pregnancy was already in place with high coverage. Women received 2 kg of powdered milk each month (about 67 g per day). Powdered milk fortified with smaller amounts of iron (ferrous sulfate), zinc, vitamin C and other nutrients was used as a control. The main difference between these two products was that the more highly fortified milk powder contained higher amounts of energy (521 kcal vs. 498 kcal per 100 g), vitamins, trace minerals and essential fatty acids. Vitamins A, C, E, B6, niacin, biotin, folic acid, magnesium and selenium were much lower in the control group.
In this study in Chile, underweight pregnant women (BMI < 21.2 kg m−2, at the 10th week of pregnancy) were randomly allocated to the treatment group (n = 589) or control group (n = 552) before 20 weeks of gestation. The mean gestational age at enrolment was 11.36 weeks for the intervention group and 10.66 weeks for the control group (P < 0.05), and the treatment lasted until delivery (about 30 weeks for the intervention). The reason participants in the experimental group had, on average, a higher mean gestational age at enrolment was due to unintended late distribution of the fortified milk used for the intervention.
The mean daily consumption of the two supplements was slightly higher in the control group (36.9 ± 26.2 g day−1–185 kcal day−1) than in the experimental group (31.2 ± 31.0 g day−1–163 kcal day−1). The primary outcomes were birthweight and gestational age. Based on intention‐to‐treat analysis, mean birthweight was significantly higher (65 g) in the treatment group (3265 g) than in the control group (3200 g) (P = 0.034). Mean birth length was also significantly greater (0.38 cm) in the treatment group (49.36 cm) than in the control group (48.98 cm) (P = 0.019). Maternal weight gain during pregnancy was 500 g higher in the treatment group than in the control group (14.5 kg vs. 14.0 kg), but the difference was not significant. Gestational duration was slightly longer in the treatment group (∼1.4 days). They also found decreases in very early preterm births (0.4% vs. 2.1%, P = 0.02) and marginal decreases in pre‐eclampsia (1.6% vs. 3.4%, P = 0.083).
Additionally, on‐treatment analysis was conducted because the experimental food arrived after the study began and women who did not receive the treatment as allocated during the 3 months were excluded. The on‐treatment analyses showed statistically significantly larger increases in birthweight (118 g), birth length (0.57 cm) and head circumference (0.20 cm). They also found decreases in pre‐eclampsia (15% vs. 6%). The national food distribution programme for low‐income pregnant women in Chile now includes milk fortified with essential fatty acids.
An earlier trial in Chile conducted in 1983 used fortified milk powder as well (Mardones‐Santander et al. 1988). This product contained higher amounts of iron (43 mg vs. 27 mg) and vitamin C (340 mg vs. 110 mg), and less protein (14.5 g vs. 25 g) than the one described earlier, and no alpha‐linolenic acid was included in the product (Table 3). This study was also a randomized controlled trial. Underweight pregnant women before 20 weeks of gestation (mean gestational age ∼14.5 weeks) were randomly assigned to the treatment group (n = 570) or the control group (n = 565). The intervention lasted ∼25 weeks until delivery and the mean intake of the fortified product was 37 g day−1. The subjects in the control group received unfortified milk powder. At the end of the study, mean birthweight was significantly higher (72 g) in the treatment group (3178 g, n = 391) than in the control group (3105 g, n = 391), and the percentage of IUGR infants was significantly lower in the treatment group (32.5%) than in the control group (43.7%) (P < 0.05). In a sub‐study, mean haemoglobin concentration was significantly higher in the fortified group (126 g L−1, n = 68) than in the control group (119 g L−1, n = 71), and the prevalence of low ferritin concentrations was significantly lower in the fortified group (45%) than in the control group (73%). Pregnancy weight gain was significantly higher (1 kg) in the experimental group (12.3 kg) than in the control group (11.3 kg) (P < 0.05), as was early post‐partum weight loss (P < 0.05).
The Mexican government started a poverty alleviation programme in 1997, which is now called Oportunidades (formerly Progresa) (Rivera et al. 2000). This programme is a conditional cash transfer (CCT) programme with strong nutritional components. In addition to a CCT, children 6–48 months with weight‐for‐age Z‐scores <−1 and pregnant and lactating women all received milk‐based fortified foods (Rivera et al. 2000). The formulation of the supplements for pregnant women is listed in Table 3 (Rosado et al. 2000). The pudding‐like product contained 250 kcal per serving and was fortified with several nutrients, including iron and zinc. A quasi‐experimental study design was used to evaluate the programme. Communities were randomly assigned into either early start of the programme (320 communities) or delayed (18 months later) initiation of the programme (186 communities). Several studies found that growth outcomes, development and behaviour outcomes were positively associated with the CCT programme (Barber & Gertler 2008; Fernald et al. 2008; Leroy et al. 2008; Fernald et al. 2009). One study showed that birthweight was 127 g higher among the women who received the benefits of the CCT programme than those who did not. Additionally, the prevalence of LBW was reduced by 4% for the women who received benefits, compared with those who did not (Barber & Gertler 2008).
Another study on the Oportunidades programme reported that on average after 2 years, children younger than 6 months at baseline grew 1.5 cm and 0.76 kg more in the beneficiary families than those in the control families, which may be due to those mothers accepting benefits through the whole pregnancy and early lactation period (Leroy et al. 2008). Another possibility could be that younger children were more sensitive to infant and young child nutrition intervention. Doubling cash transfers was also associated with greater height‐for‐age Z‐score (HAZ), low prevalence of stunting, and better motor development and cognitive development (Fernald et al. 2008). Even though it is not possible to attribute the higher birthweight among women who received the fortified nutrient supplements during pregnancy solely to these supplements, fortified supplements during pregnancy appear to have played an important role.
A study in the United Kingdom in 1979 assessed the impacts of flavoured milks on birthweight (Viegas et al. 1982b). Pregnant women at 18 weeks of gestation were randomly assigned into one of three groups: (1) vitamin and mineral; (2) energy, vitamin and minernal; and (3) protein, energy, vitamin and mineral for about 38 weeks. The nutrient composition is listed in Table 3. There were no significant mean differences in birthweight (all roughly 3.0 kg) among the groups.
In a subsequent study (Viegas et al. 1982a), the same products with multiple vitamin supplements were selectively given to pregnant women with a low mean increase in triceps skinfold thickness <0.2 mm month−1 (average of the increase between 18 and 28 weeks).The results showed that protein energy and multi‐vitamin supplementation significantly increased birthweight by 330 g (3350 g vs. 3020 g) and increased skinfold thickness in those whose measurements were <0.2 mm month−1. However, for those women whose mean triceps skinfold thickness increased >0.2 mm month−1 between 18–28 weeks, there was no effect.
In the 1980s, a different flavoured milk drink was selectively provided to UK pregnant women with small changes (≤0.2 mm) in triceps skinfold thickness between 18–28 weeks of pregnancy (Atton & Watney 1990). The nutrient composition is listed in Table 3. Briefly, the product contained 158 kcal and 5.7 g protein per 100 mL with a low level of micronutrients (about 10% of the RDA, except for phosphorus, which was 16%). This was a randomized controlled trial with a non‐intervention normal control group, which was defined as changes in mean triceps skinfold thickness between 18–28 weeks >0.2 mm. Those pregnant women with small increments in triceps skinfold thickness (<0.2 mm) were randomly assigned into either a supplement group or control group. The normal control group continued not receiving supplements. There were no significant benefits detected among any of the groups.
A milk‐based porridge (100 g dry milk, ∼72 g maize flour, containing 699 kcal per day) or a bean‐corn blended food [bean and maize (1.2:1) mush containing 775 kcal] was offered to pregnant women in South Africa in 1977 in a randomized controlled trial (Ross et al. 1985). Pregnant women before 20 weeks of gestation were recruited and randomly assigned into one of the four groups (placebo supplement, 30–90 mg zinc gluconate supplements, bean‐corn blended food and milk‐based food). The supplements were provided until delivery. These products contained calcium, iron, vitamin A, niacin, riboflavin and thiamine. The nutrient composition is listed in Table 3. Mean birthweight was significantly higher in the milk‐based product group (3376 g) than in the other three groups (placebo: 3171 g, zinc: 3088 g, bean‐corn blended food: 3082 g) (P < 0.05).
In a Vietnamese study among 84 pregnant women, consumption of fortified milk (400 ml, 120 calories, 6.8 g protein, 15 mg elemental iron, 200 µg folic acid and 17.5 mg vitamin C) was compared with unfortified milk, and a supplement containing 60 mg Fe/250 µg of folic acid and a placebo supplement. The risk of developing anaemia after 16 weeks intervention was lowest in the groups who received iron (fortified milk and iron supplement groups), and the prevalence of achieving adequate weight gain was greatest in the milk groups. The highest weight increases were found in the fortified and non‐ fortified milk groups (5.8 ± 2.1 and 5.0 ± 2.0 kg, respectively), followed by the supplemented group (4.6 ± 3.1 kg) and the placebo group (3.8 ± 2.5 kg). The authors state:
The distribution of fortified milk to pregnant women is far more expensive than the distribution of iron (sic) supplements alone. However, in the Vietnamese situation, in which mothers have a high prevalence of acute undernutrition, supplementation alone was insufficient to address weight gains during pregnancy. Rather, the increased availability of fortified food commodities such as milk at the household level should be considered. (Hoa et al. 2005)
In a randomized controlled trial in the 1970s in Colombia, pregnant women in the first or second trimester were randomly assigned to supplementation or control groups (Mora et al. 1979). The supplements included dry skim milk, enriched bread, vegetable oil and vitamin/mineral supplements, which contained 856 kcal, 38.4 g protein, 6024 IU vitamin A and 18 mg iron. The results showed that subjects in the supplementation group increased their mean daily energy intake by 155 kcal and mean protein intake by 20 g. Mean birthweight was significantly higher for full‐term male newborns in the supplementation group (3061 g) than in the control group (2966 g), but this was not observed for their female counterparts (2935 g vs. 2942 g). Male offspring may be more sensitive to nutrition supplements as shown in other studies (Adair & Pollitt 1985).
In addition to studies or programmes that have tested products that contain cow's milk, several studies have assessed programmes which provided milk as part of the food package for pregnant women. In another UK study in the 1970s, pregnant women at risk for undernutrition (defined as weight‐for‐height at 20 weeks of gestation or weight gain below the 25th percentile of the Aberdeen reference for women) were randomly assigned into a food supplementation group or a control group (Compbell‐Brown 1983). The food supplements included a flavoured milk drink, fresh milk or cheddar cheese, which provided 299 kcal and 15.9 g protein on average. There were no significant differences in birthweight (3032 g vs. 2995 g), gestational age (39.7 weeks vs. 39.6 weeks), or maternal weight gain during the 30 weeks of intervention (0.4 kg week−1 vs. 0.36 kg week−1) between treatment group and control group.
In the United States, the Special Supplemental Food Program for Women, Infants and Children (WIC) provides food supplements for pregnant and lactating women. The foods provided include milk, cheese, eggs, iron‐fortified cereal and fruit juice, which are intended to improve iron, vitamin A and vitamin C intake. An early evaluation by Kennedy et al. found that the birthweight of WIC participants' offspring was about 60 g higher than those who did not participate in WIC, after controlling for total weight gain during pregnancy, gestational age, pregravid weight and prior history of LBW (Kennedy et al. 1982). Haemoglobin concentration and haematocrit were also significantly improved by 4 g L−1 and 1.3%, respectively, in the WIC participants compared with non‐participants (Kennedy & Gershoff 1982).
An evaluation that used a sibling model to estimate the effectiveness of the WIC programme on birthweight showed that mean birthweight was about 185 g higher for children whose mothers participated in the WIC programme than their siblings whose mothers did not participate (Kowaleski‐Jones & Duncan 2002). Another study evaluated the effects of post‐partum supplementation (5–7 months vs. 0–2 months) on the subsequent pregnancy outcome in a WIC population in California. The study showed that mean birthweight (131 g) and mean birth length (0.3 cm) were significantly greater and LBW rate was significantly lower in the treatment group (5–7 months) than in the control group (0–2 months) (Caan et al. 1987). The current contents of the WIC food package are shown in Fig. 3[United States Department of Agriculture (USDA 2007)]. State agencies determine which specific foods are allowed in the package. However, the federal government has specifications that must be met for fortification levels. These foods and their fortification levels may help in determining appropriate foods for pregnant women in developing countries, where normal food intake is often less and the quality worse than among poor women in the United States. According to US federal requirements, milk must be fortified and contain at least 400 IU of vitamin D per quart (100 IU per cup) and 2000 IU of vitamin A per quart (500 IU per cup). Soy‐based beverages must be fortified to meet the following nutrient levels per cup: 276 mg calcium, 8 g protein, 500 IU vitamin A, 100 IU vitamin D, 24 mg magnesium, 222 mg phosphorus, 349 mg potassium, 0.44 mg riboflavin, and 1.1 mcg vitamin B12, in accordance with fortification guidelines issued by the Food and Drug Administration; juice must be pasteurized, 100% unsweetened fruit juice and must contain at least 30 mg of vitamin C per 100 mL of juice; breakfast cereals must contain a minimum of 28 mg iron per 100 g dry cereal and contain ≤21.2 g sucrose and other sugars per 100 g dry cereal (≤6 g per dry oz). Canned fish can include light tuna, salmon, sardines and mackerel (USDA 2007).
Figure 3.

Contents of the 2007 revised Women, Infants and Children Food package.
In summary, eight out of a total of 11 studies that measured birthweight showed that fortified products containing cow's milk significantly improved birthweight (Table 4). The magnitude of the improvement in birthweight ranged from 60 to 330 g. The beneficial effects were seen in three out of five studies where malnourished subjects (defined as underweight or maternal skinfold thickness increment during 18–28 weeks <0.2 mm week−1) were investigated.
Two studies reported significant increases in haemoglobin ranging from 4 to 7 g L−1. In addition, there were significant improvements in birth length, very early pre‐term delivery or iron deficiency reported in the Chile studies (Mardones‐Santander et al. 1988; Mardones et al. 2008).
Because various control groups were used in different studies, the causal effects could be attributed to MMN, dairy components, essential fatty acids or all of these components. The interaction between MMN and dairy components was not evaluated in these studies, thus an interaction effect cannot be ruled out.
Fortified high‐fat products
High‐fat products are defined in this review as products in which more than 35% of energy is provided by fat. A study by Prentice et al. provided groundnut‐based biscuits and vitamin‐fortified tea to pregnant women in the Gambia (Prentice et al. 1987). The nutrient compositions of the fortified supplements are listed in Table 5. The fortification level for calcium, riboflavin, and vitamins A and C was between 18% and 42% of the RNI for 100 g of biscuits (each biscuit contained 546 kcal) and 100 g of tea. 47 mg iron as ferrous sulfate and 500 µg folic acid were provided to every pregnant woman. A maximum of three biscuits and 380 g tea in the dry season and a maximum of four biscuits and 380 g tea in the hungry season were provided daily, containing 1209 kcal and 1513 kcal, respectively. This study used a historical control.
Table 5.
Nutrient composition of high‐fat products
| Nutrients | Gambia Biscuits with tea per 100 g (Prentice et al. 1987) | Gambia Biscuits per serving (Prentice et al. 1980) | UNILITO (fortified corn‐soy blend) (daily dose) (Shrimpton et al. 2009) | LNS‐soy (Burkina Faso) per daily serving (72 g) (Kasestel et al. 2005) | RNI WHO/FAO (2004) for pregnant women | ||||
|---|---|---|---|---|---|---|---|---|---|
| Amount | % of RNIs | Amount | % of RNIs | Amount | % of RNIs | Amount | % of RNIs | ||
| Energy (kcal) | 546 | 25 | 1015 | 46 | 455 | 21 | 372 | 17 | 2200* |
| Protein (g) | 20.3 | 29 | 22 | 31 | 13.4 | 19 | 14.7 | 21 | 71* |
| Fats (g) | 27.1 | 56 | 24.9 | 27.6 | |||||
| Saturated fat | 8.1 | ||||||||
| MUFA | 12.1 | ||||||||
| n‐3 PUFA | 0.4 | 29 | 1.4* | ||||||
| n‐6 PUFA | 7.0 | 54 | 13* | ||||||
| Carbohydrates (g) | 15.9 | 9 | 175* | ||||||
| Fiber (g) | 9.1 | 33 | 28* | ||||||
| Lactose (g) | |||||||||
| Vitamin A (IU) | 1132 | 42 | 1665 | 63 | 2936 | 110 | 2664 | ||
| Vitamin D3 (µg) | 5 | 100 | 5 | ||||||
| Vitamin E (mg) | 13 | 87 | 15* | ||||||
| Thiamin (mg) | 0.4 | 29 | 1.6 | 114 | 1.4 | ||||
| Riboflavin (mg) | 0.47 | 34 | 0.2 | 14 | 1.6 | 114 | 1.4 | ||
| Niacin (mg) | 5.6 | 31 | 21 | 117 | 18 | ||||
| Vitamin B6 (mg) | 2 | 105 | 1.9 | ||||||
| Folic acid (µg) | 461 | 77 | 600 | ||||||
| Vitamin B12 (µg) | 2.6 | 100 | 2.6 | ||||||
| Pantothenic acid (mg) | 6.0 | ||||||||
| Ascorbic acid (mg) | 10 | 18 | 40 | 73 | 71 | 129 | 55 | ||
| Biotin (µg) | 30 | ||||||||
| Sodium (mg) | 1500* | ||||||||
| Potassium (mg) | 4700* | ||||||||
| Calcium (mg) | 275 | 23 | 47 | 4 | 130.7 | 11 | 90 | 8 | 1200 |
| Phosphorus (mg) | 700* | ||||||||
| Magnesium (mg) | 220 | ||||||||
| Iron (mg) | 1.8 | 7 | 7.2 | 27 | 35 | 130 | 27* | ||
| Zinc (mg) | 4 | 40 | 17 | 170 | 10 ‡ | ||||
| Copper (mg) | 2.7 | 235 | 1.15 † | ||||||
| Manganese (mg) | 2.0* | ||||||||
| Iodine (µg) | 150 | 75 | 200 | ||||||
| Selenium (µg) | 65 | 217 | 30 | ||||||
IU, International Unit; MUFA, monounsaturated fatty acid; PUFA, polyunsaturated fatty acid; RNI, recommended nutrient intake. *Food and Nutrition Board, (2002/2005); energy is calculated for a low active pregnant woman aged 30 years in the second trimester with a body mass index of 18.5 kg/m2 and height 1.55 m (Food and Nutrition Board, 2002) females 19–50 years. †From Food and Agriculture Organization/IAEA/WHO, Trace elements in human nutrition and health (1996). ‡Assume moderate bioavailability of zinc during the third trimester.
The mean birthweight of babies born during the 4‐year supplementation (1980–1984 post‐supplementation) was compared with that of babies born 4 years immediately before the study (1976–1980 pre‐supplementation). The mean duration of supplementation was 24 weeks and the mean intake of supplements was about 671 kcal day−1, which was about 44–55% of those provided. After adjusting for sex, parity, month and gestational age, mean birthweight was significantly higher (200 g) in post‐supplementation (3010 g) than in pre‐supplementation (2810 g) during the wet (hungry) season. However, the difference was not significant during the dry season (2959 g vs. 2972 g; pre‐supplementation vs. post‐supplementation, respectively). LBW was also less common in post‐supplementation than in pre‐supplementation during the wet season. Supplementation had no significant effect on maternal weight gain during pregnancy. No significant difference was detected for gestational age between pre‐ and post‐supplementation groups.
A similar biscuit with some modifications (e.g. calcium density was decreased to 46 mg 1000 kcal−1 from 384 mg 1000 kcal−1 in the previous product) was tested again in the Gambia in 1989 by using a cluster randomization trial (Ceesay et al. 1997). Two biscuits contained 4250 kJ (1015 kcal, 507.5 kcal per biscuit) energy, 22 g protein, 56 g fat, 47 mg calcium and 1.8 mg iron. They contained roasted groundnuts, rice flour, sugar and groundnut oil and therefore, though high in fat, contained no good source of omega‐3 fatty acids. The study found that the food supplements increased birthweight by 201 g in the hungry season and by 94 g in the dry season (harvest season). The supplementation also increased head circumference by 3.1 mm. The odds of LBW, stillbirths and all deaths during the first week of life were reduced by 39%, 53% and 46%, respectively (Table 6).
Table 6.
Impacts of high‐fat products on nutritional status
| Author | Site | Study design | Subjects | Study group | Control group | Intake | Outcome |
|---|---|---|---|---|---|---|---|
| Prentice (Prentice et al. 1987) | Gambia | Historical control | All pregnant women in catchments area | Fortified biscuits and tea | Un‐supplemented | Daily intake about 671 kcal | Significant improvement in birthweight (3010 g vs. 2810 g) in hungry season; no effect in dry season (2972 g vs. 2959 g). |
| Ceesay (Ceesay et al. 1997) | Gambia | Cluster‐randomization | Pregnant women from 20 weeks of gestation | Biscuits containing 1015 kcal energy, 22 g protein and 56 g fat. | Un‐supplemented | The maximum intake was two biscuits | Significant increase in birthweight by 201 g in hungry season, but not in harvest season; head circumference in 3.1 mm; reducing odds of stillbirth and all death by 53% and 46%, respectively. |
| Huybregts (Huybregts et al. 2009a) | Burkina Faso | RCT | Pregnant women starting from first trimester and some second trimester | LNS fortified with 1 RNI MMN as UNIMMAP | UNIMMAP | 72 g LNS (372 kcal, 14.7 g protein, 27.6 g fat, | No significant difference in birthweight; |
| Significantly greater birth length (4.6 mm longer in LNS group) and placental weight (15.6 g heavier) in LNS group. |
LNS, Lipid‐based nutrient supplement; MMN, multiple micronutrient; RCT, randomized controlled trial; RNI, recommended nutrient intake; UNIMMAP, United Nations International Multiple Micronutrient Preparation.
A similar groundnut‐based biscuit (containing wheat‐soy flour, dried skimmed milk, groundnut oil and sugar) and tea as mentioned previously in the Gambian studies was also offered to lactating women in the Gambia (Prentice et al. 1980). The historical controls were used in the study. The supplements were given for 12 months and the mean energy intake from the supplements was 830 kcal day−1. The breast milk volume was similar between pre‐ and post‐supplementation groups. The fat content of breast milk also did not differ between women who were supplemented and those who were not supplemented during the pre‐supplementation period (3.94 g dl−1 vs. 3.86 g dl−1; pre‐ vs. post‐supplementation, respectively). Women in the supplement group were heavier than those in the pre‐supplementation group at the same calendar month at the same duration post‐partum.
A small‐scale randomized controlled trial (n = 10 for each group) was conducted in the early 1980s in India (Girija et al. 1984). Normal dietary intake met 60% of pregnant women's RNI for energy. The trial provided 50 g of sesame cake, 40 g of jaggery (molasses) and 10 g of oil (30 g protein and 417 kcal) to the treatment group in the third trimester of pregnancy. The results showed that haemoglobin levels increased significantly in the treatment group compared with the control group (19.7 g L−1 vs. 1.7 g L−1). Mean daily breast milk production was significantly higher in the treatment group (465 g) than in the control group (158 g) but mean birthweight and birth length in the two groups were not statistically significant (but sample sizes were quite small).
In refugee camps housing Bhutanese in Nepal, an 11% decrease in the prevalence of LBW and an increase in mean birthweight from 2.84 kg to 3.0 kg were associated with micronutrient‐dense foods (Shrimpton et al. 2009). A fortified corn‐soy blended food and added oil, containing 455 kcal per day, called UNILITO, was provided to pregnant women throughout. The nutrient composition is listed in Table 5.
LNS have been suggested for use during pregnancy (Briend 2001). They contain high amounts of fat, including a good source of omega‐3 fatty acids, in a small amount of food (such as a fortified peanut paste containing canola or soy oil, sugar, micronutrients and sometimes milk). A recently completed trial in Burkina Faso assessed the impact of LNS on birth outcomes (Huybregts et al. 2009a). Pregnant women (n = 1300) were randomly assigned into either an LNS group (370 kcal, 72 g) daily with UNIMMAP micronutrient formulation (Table 6) or a control group (UNIMMAP tablet). The results showed that birth length was 0.5 cm significantly greater (P = 0.001) and placental weight (15 g) was significantly heavier in the LNS group (579 g) than in the control group (564 g) (P = 0.04), but there was no effect on birthweight. Maternal nutritional status, haemoglobin concentration, and gravidity modified the effects of the LNS. Effects on birth length were significant for mothers who were multigravida, had low BMI or anaemia compared with their counterparts not receiving LNS. Among women who had BMI <18.5, the mean increase in height of newborns was 1.2 cm (P = 0.005), and the placental weight increased by 56 g (P = 0.017). The increase in birthweight was 111 g (P = 0.13), though non‐significant perhaps because of low numbers of very malnourished women. The treatment did not affect preterm delivery.
In summary, high‐fat products had significant impacts on birth outcomes (i.e. birthweight in the Gambia and Nepal studies, and birth length in the Burkina Faso study) (Table 6). The increase in birthweight was greater in the hungry season (∼200 g) than in the harvest season (13–94 g) in the Gambia studies. Micronutrient status is expected to be comparable in both the Gambia and Burkina Faso study due to similar micronutrient consumption between treatment and control.
The energy intake from these products was more than 350 kcal per day. Fat provided >40% of the energy in these products. Although the omega‐3 fatty acid content of the foods used in the Gambia was low due to the use of groundnuts and groundnut oil, the LNS in Burkina Faso was developed to have significant amounts of omega‐3 fatty acids, through the inclusion of full fat soy flour.
Formulated protein‐energy drinks
In this review, a formulated protein‐energy drink is defined as a protein‐containing beverage with or without micronutrient fortification that does not use milk as a key ingredient. These were tested out over 20 years ago, before an understanding of the need for essential fatty acids was wide‐spread. At that time, protein was considered to be a limiting element in developing country diets. However as will be shown, protein was found not to be a major concern and in fact high intakes appear to be detrimental to pregnancy outcomes.
A chocolate‐flavored energy and nutrient‐rich liquid supplement containing 400 kcal per serving was used during pregnancy and lactation in a study in Taiwan, China (Adair & Pollitt 1985). The nutrient composition is listed in Table 7. The fortification level for most micronutrients was close to one RNI. A few micronutrients were fortified at <50% of the RNI, including vitamin E and iron. The study was a double‐blinded randomized controlled trial. Pregnant women were randomly assigned to a treatment group (n = 114) or placebo group (n = 111). The intervention started 3 weeks after the birth of the first born child and continued until 15 months of lactation for the second born child. The liquid supplements provided two servings per day (12.5 oz per serving). In addition to receiving either the intervention product or placebo, multi‐vitamin and mineral supplements were provided to both groups. The main outcomes were birthweight and birth length. There were no significant treatment effects on birthweight or birth length. Birthweight was slightly higher (56 g, 31.7 g) for both sexes in the treatment group (M: 3216.0 g, F: 3012.5 g) than in the control group (M: 3160.6 g, F: 2980.8 g), respectively. Due to the low power of the study, these differences were not statistically significant. Within the treatment group, birthweight was significantly higher in the male babies born after the second pregnancy with treatment (3216.0 g) than in the male babies born after the first pregnancy without treatment (3053.6 g) (P = 0.013). The mean Bayley motor development score was not significantly different between the treatment group (3.8, n = 99) and the control group (3.31, n = 99) (P = 0.058) but sample sizes were small. Maternal haematocrits were significantly higher in the treatment group (35.3%) than in the control group (33.0%) and than in the pre‐treatment (33.7%) at 2 months before delivery (P < 0.05).
Table 7.
Nutrient composition of formulated protein‐energy drink
| Nutrients | Taiwan chocolate‐ liquid supplement (Adair & Pollitt 1985) | Indonesia high‐energy drink (Kardjati et al. 1988) | US – high protein drink (per 16 oz) (Rush et al. 1980) | US – balanced protein drink (per 16 oz) (Rush et al. 1980) | RNI WHO/FAO (2004) for pregnant women | ||||
|---|---|---|---|---|---|---|---|---|---|
| Amount | % of RNIs | Amount | % of RNIs | Amount | % of RNIs | Amount | % of RNIs | ||
| Energy (kcal) | 400 | 18 | 465 | 21 | 470 | 21 | 322 | 15 | 2200 † |
| Protein (g) | 20 | 28 | 7.1 | 10 | 40 | 56 | 6 | 8 | 71 † |
| Fats (g) | 13.3 | 25.8 | 8.6 | 7.6 | |||||
| Milk fat | |||||||||
| Vegetable fat | |||||||||
| n‐3 PUFA | 1.4 † | ||||||||
| n‐6 PUFA | 13 † | ||||||||
| Carbohydrates (g) | 50 | 29 | 46.5 | 27 | 55 | 31 | 57.4 | 33 | 175 † |
| Fiber (g) | 0.5 | 2 | 28 † | ||||||
| Lactose (g) | |||||||||
| Vitamin A (IU) | 2500 | 94 | 6000 | 225 | 4000 | 150 | 2664 | ||
| Vitamin D3 (µg) | 5 | 100 | 10 | 200 | 10 | 200 | 5 | ||
| Vitamin E (mg) | 3.3 | 22 | 30 | 200 | 15 † | ||||
| Thiamin (mg) | 0.8 | 57 | 3 | 214 | 3 | 214 | 1.4 | ||
| Riboflavin (mg) | 0.9 | 64 | 15 | 1071 | 15 | 1071 | 1.4 | ||
| Niacin (mg) | 10 | 56 | 15 | 83 | 15 | 83 | 18 | ||
| Vitamin B6 (mg) | 0.8 | 42 | 2.5 | 132 | 2.5 | 132 | 1.9 | ||
| Folic acid (µg) | 350 | 58 | 350 | 58 | 600 | ||||
| Vitamin B12 (µg) | 1.0 | 38 | 8 | 308 | 3 | 115 | 2.6 | ||
| Pantothenic acid (mg) | 3.68 | 61 | 1.0 | 17 | 1.0 | 17 | 6.0 | ||
| Ascorbic acid (mg) | 37.5 | 68 | 60 | 109 | 60 | 109 | 55 | ||
| Biotin (µg) | 200 | 667 | 30 | ||||||
| Sodium (mg) | 200 | 13 | 1500 † | ||||||
| Potassium (mg) | 900 | 19 | 4700 † | ||||||
| Calcium (mg) | 500 | 42 | 1000 | 83 | 250 | 21 | 1200 | ||
| Phosphorus (mg) | 400 | 57 | 700 † | ||||||
| Magnesium (mg) | 100 | 45 | 12 | 5 | 220 | ||||
| Iron (mg) | 6.0 | 22 | 138 † | 118 | 437 | 27 † | |||
| Zinc (mg) | 4 | 40 | 0.084 | 1 | 10 § | ||||
| Copper (mg) | 0.5 | 43 | 2 | 174 | 0.15 | 13 | 1.15 ‡ | ||
| Manganese (mg) | 1.0 | 50 | 2.0 † | ||||||
| Iodine (µg) | 150 | 75 | 100 | 50 | 200 | ||||
| Selenium (µg) | 30 | ||||||||
IU, International Unit; RNI, recommended nutrient intake. † Food and Nutrition Board, (2002/2005); energy is calculated for a low active pregnant woman aged 30 years in the second trimester with a body mass index of 18.5 kg/m2 and height 1.55 m (Food and Nutrition Board, 2002) females 19–50 years. ‡From Food and Agriculture Organization/IAEA/WHO, Trace elements in human nutrition and health (1996). §Assume moderate bioavailability of zinc during the third trimester.
A randomized controlled trial in Indonesia in 1982 measured the impacts of a protein‐energy beverage containing palm oil and sunflower oil (both low in omega‐3 fatty acids), high or low amounts of casein and glucose without micronutrient fortification during pregnancy on birthweight and breast milk output (Kardjati et al. 1988; van Steenbergen et al. 1989). The nutrient composition is listed in Table 7. Pregnant women in the third trimester were randomly assigned to either a high energy or low energy group. The high‐energy beverage contained 465 kcal and 7.1 g protein per 200 ml; the low energy beverage contained 52 kcal and 6.2 g protein per 200 ml. There was no significant difference in birthweight (2908 g vs. 2948 g, high energy vs. low energy groups, respectively), or breast milk production between these two supplement groups. However the children born to the high energy group were taller and stunting rates were lower throughout the first 5 years (Kusin et al. 1992). Maternal weight gain was not statistically different between the two groups (7.1 kg vs. 6.4 kg; treatment (n = 272) vs. control (n = 265), respectively).
A fortified protein‐energy drink was tested in the 1970s 1970in New York (Rush et al. 1980). Pregnant women (n = 1051) were randomly assigned to one of three groups (supplement, complement and control groups). The supplement group received 40 g casein and 470 kcal and the complement group received 6 g casein and 322 kcal. The control group received multivitamin‐mineral supplements, which were at the same dosage as in the complement group. The detailed nutrient content is listed in Table 7. The supplements continued until delivery. At delivery, 770 pregnant women remained in the study and delivered singleton births. There were no significant effects of treatment on birthweight. The complement group had a slightly higher birthweight (41 g) than the control group (which may reflect the impact of the casein, a milk product); however, this was not statistically significant. Early premature delivery and neonatal death were associated with high protein supplementation. The supplement group with high protein content had a significantly lower birthweight than complement group or control group for premature delivered infants (<37 weeks). Children in the supplement group showed better visual habituation (a type of non‐associative learning), visual dishabituation (recovery of attention), and mean length of free play episode at 1 year of age.
In summary, these randomized controlled trials showed that protein and energy administered without other nutrients had no significant beneficial effects on birthweight (Table 8), no matter when [pre‐pregnancy (Adair & Pollitt 1985) or mid‐pregnancy (Rush et al. 1980)] the protein‐energy drinks were given. Learning capabilities were improved in one study when receiving the high protein‐energy supplement (Rush et al. 1980; Haider & Bhutta 2006). The high protein supplements were associated with some adverse effects (premature delivery, premature‐related neonatal death and LBW) (Rush et al. 1980). Maternal haematocrit was improved in one study (Adair & Pollitt 1985).
Table 8.
Impacts of formulated protein‐energy drink
| Author | Site | Study design | Subjects | Study group | Control group | Intake | Outcome |
|---|---|---|---|---|---|---|---|
| Adair (Adair & Pollitt 1985) | Taiwan, China | Placebo‐controlled, double‐blinded RCT (multivitamin mineral supplements provided to both groups) | Women 3 weeks after first birth through first lactation, second pregnancy and second lactation (15 months) | Chocolate flavoured nutrient dense drink (400 kcal per serving) | Placebo drink (3 kcal before 06/1971 and 43 kcal after, per serving) | 17 oz | Significantly heavier in post‐treatment than in pre‐treatment for male babies (3216 g vs. 3054 g); maternal haematocrits significantly greater (35.3% vs. 33%). |
| Kardjati (Kardjati et al. 1988) | Indonesia | RCT | Women at 26–28 weeks of gestation | High‐energy drink (465 kcal per serving) ‘jamu’ | Low‐energy drink (52 kcal per serving, 6.2 g protein) | 200 mL (465 kcal, 7.1 g protein) | No significant effects |
| Rush (Rush et al. 1980) | New York, USA | RCT with stratification | Women <30 weeks of gestation | Fortified protein‐energy drink (473 kcal with 40 g casein) | Low protein‐energy drink (322 kcal and 6 g casein) or MMN supplements | 473 mL (326/470 kcal from the treatment, 233/322 kcal from the complement drink | No significant effects on birthweight; for heavy smokers, supplements had effects to prevent birthweight deficit; high protein supplement significantly increased very early premature delivery and neonatal death (3.2% vs. 1.1%); and improved visual habituation, visual dishabituation, and the mean length of free play episodes |
MMN, multiple micronutrient; RCT, randomized controlled trial.
These protein‐energy products contained 233–552 kcal energy with 7–30 g protein daily. The control groups received multi‐vitamin and mineral supplements with a similar formulation as the treatment group received through the supplement (Adair & Pollitt 1985; Kardjati et al. 1988) or the fortified product (Rush et al. 1980; Ross et al. 1985). The potential benefits of micronutrients could not be detected because of lack of a placebo control.
Discussion
Both micronutrient‐fortified beverages and fortified supplementary foods, when given during pregnancy, have shown positive effects on maternal anaemia and iron deficiency prevention. For example, anaemia prevalence was reduced by approximately one‐third in fortified beverage studies in Tanzania, and haemoglobin concentration increased by 4–7 g L−1 in the Tanzania study and in the earlier fortified milk powder study in Chile.
Some studies have found that supplementary foods during pregnancy increased mean birthweight by around 60–73 g, which is about three times that seen with MMS. Under certain circumstances (e.g. during the hungry season in the Gambia, in women from 18–28 weeks of gestation with smaller increases in skinfold thickness), the supplement led to an increase in mean birthweight of 115–330 g. Both macronutrients and micronutrients contributed to the positive changes, but the level of maternal nutritional status, birthweight and sex of offspring modified the effects of treatments.
High fat supplements consumed during pregnancy were associated with desirable outcomes assessing birth length, placental weight, very‐early preterm delivery, pre‐eclampsia and IUGR, stillbirth and neonatal mortality. For example, in two studies where essential fatty acids were provided, birth length was 0.4–0.5 cm greater in the treatment group than in the control group (Mardones et al. 2008; Huybregts et al. 2009a).
Maternal food supplementation during pregnancy was not related to maternal weight gain during pregnancy in the majority of studies, but was when maternal weights were low at start.
Increasing intake of energy was related to improvements in birthweight but primarily in women who were more malnourished. High amounts of protein had no impact on birthweight. It is possible that ingredients such as milk, micronutrients or essential fatty acids had greater benefits on increasing mean birthweights. The interaction between milk ingredients, essential fatty acids and micronutrients warrants further investigation.
A fortified beverage can improve the status of other important micronutrients such as vitamin A in addition to improving iron status. Fortified food supplementation during pregnancy positively affected the offspring's learning capability during childhood.
Given the experiences mentioned and summarized up to this point, products to be consumed during pregnancy and lactation could be formulated to improve either maternal micronutrient status or birth outcomes. A question, however, is whether women are more likely to consume a beverage instead of a tablet or capsule, especially if the cost is higher. Because many women's diets in developing countries are low in omega‐3 fatty acids, and also because milk consumption is often minimal, it may be more appropriate to develop products containing these ingredients to benefit the mother and subsequently her offspring.
Iron, zinc, copper, iodine, selenium, vitamins A, D, E, C, B1, B2, B6, B12, folic acid, niacin and pantothenic acid are important nutrients for both fortified beverages and supplemental foods. Calcium, phosphorus, potassium, magnesium and manganese may have negative impacts on organoleptic properties, but these nutrients are important and may be needed if missing in local diets. Calcium has been shown to reduce the risk of pre‐eclampsia and maternal mortality (Hofmeyr et al. 2011). The fortification levels used previously were generally between 50–100% of the RNI. Decisions on nutrients to include and their levels should be based on the dietary intake of the target population and the characteristics of the product.
When both maternal nutritional status improvements and birth outcome improvements are the primary outcomes of a programme, fortified food supplements are preferable to beverages containing only MMN.
Products containing milk and oils higher in omega‐3 fatty acids such as soy or canola oil showed more beneficial impacts, but further studies are needed to test these specific ingredients. When food insecurity is not an issue to be addressed, the daily energy intake from the product could be at the level of 100–300 kcal to avoid energy over‐consumption. If food insecurity is a problem, additional energy could be added, a high percentage (>35%) of which can come from fat. This type of product should include micronutrients such as calcium, potassium, phosphorus, magnesium and manganese (either from the food itself or from fortificants) because they are more easily added to a food supplement. The level of essential fatty acids (e.g. ALA Alpha – linolenic acid) needs to be tested in food‐based products (for example, the level consumed in Chile was about 0.4 g daily) to achieve better effects. No DHA was used in the fortified food supplements reported here. Based on the impacts of DHA supplementation studies, if DHA is used, 0.4 g DHA daily could be a starting point for fortification; however, costs of DHA might be prohibitive.
Conflicts of interest
No conflicts of interest exist.
Acknowledgements
The author would like to thank Marie Chantal Messier (Senior Nutrition Specialist, World Bank), and Jonathan Siekmann, Senior Associate, Infant and Young Child Nutrition (GAIN), and Elizabeth Zehner, for their valuable review, technical input and contributions. Support from GAIN enabled the author to produce the paper and make it available for the benefit of all those working to improve maternal and infant and young child nutrition. Chinese National High‐tech R&D Program (863 programme no. 2010AA023004) partially supported the work.
Footnotes
Percentages taken from Lawn et al. 2010 sample size based on 122 million births in developing countries.
References
- Adair L.S. & Pollitt E. (1985) Outcome of maternal nutritional supplementation: a comprehensive review of the Bacon Chow study. The American Journal of Clinical Nutrition 41, 948–978. [DOI] [PubMed] [Google Scholar]
- Arimond M., Wiesmann D., Becquey E., Carriquiry A., Daniels M.C., Deitchler M. et al (2010) Simple food group diversity indicators predict micronutrient adequacy of women's diets in 5 diverse, resource‐poor settings. The Journal of Nutrition 140, 2059S–2069S. [DOI] [PMC free article] [PubMed] [Google Scholar]
- Atton C. & Watney P.J.M. (1990) Selective supplementation in pregnancy: effect on birth weight. Journal of Human Nutrition and Dietetics 3, 381–392. [Google Scholar]
- Barber S.L. & Gertler P.J. (2008) The impact of Mexico's conditional cash transfer programme, Oportunidades, on birthweight. Tropical Medicine & International Health 13, 1405–1414. [DOI] [PMC free article] [PubMed] [Google Scholar]
- Bhargava A., Bouis H.E. & Scrimshaw N.S. (2001) Dietary intakes and socioeconomic factors are associated with the hemoglobin concentration of Bangladeshi women. The Journal of Nutrition 131, 758–764. [DOI] [PubMed] [Google Scholar]
- Black R.E., Allen L.H., Bhutta Z.A., Caulfield L.E., de Onis M., Ezzati M. et al (2008) Maternal and child undernutrition: global and regional exposures and health consequences. Lancet 371, 243–260. [DOI] [PubMed] [Google Scholar]
- Briend A. (2001) Highly nutrient‐dense spreads: a new approach to delivering multiple micronutrients to high‐risk groups. The British Journal of Nutrition 85 (Suppl. 2), S175–S179. [PubMed] [Google Scholar]
- Brown K.H., Rivera J.A., Bhutta Z., Gibson R.S., King J.C., Lonnerdal B. et al (2004) International Zinc Nutrition Consultative Group (IZiNCG) technical document #1. Assessment of the risk of zinc deficiency in populations and options for its control. Food and Nutrition Bulletin 25, S99–203. [PubMed] [Google Scholar]
- Caan B., Horgen D.M., Margen S., King J.C. & Jewell N.P. (1987) Benefits associated with WIC supplemental feeding during the interpregnancy interval. The American Journal of Clinical Nutrition 45, 29–41. [DOI] [PubMed] [Google Scholar]
- Ceesay S.M., Prentice A.M., Cole T.J., Foord F., Weaver L.T., Poskitt E.M. et al (1997) Effects on birth weight and perinatal mortality of maternal dietary supplements in rural Gambia: 5 year randomised controlled trial. BMJ 315, 786–790. [DOI] [PMC free article] [PubMed] [Google Scholar]
- Compbell‐Brown M. (1983) Protein energy supplements in primigravid women at risk of low birth weight. Nutrition in pregnancy: Proceedings of the Tenth Study Group in the Royal College of Obstetricians and Gynaecologists. eds Campbell, DM & Grillmer, MDG). The Royal College of Obstetricians and Gynaecologists, London.
- Dunstan J.A., Mori T.A., Barden A. et al (2004) Effects of n‐3 polyunsaturated fatty acid supplementation in pregnancy on maternal and fetal erythrocyte fatty acid composition. European Journal of Clinical Nutrition 58 (3), 429–437. [DOI] [PubMed] [Google Scholar]
- Eilander A., Hundscheid D.C., Osendarp S.J., Transler C. & Zock P.L. (2007) Effects of n‐3 long chain polyunsaturated fatty acid supplementation on visual and cognitive development throughout childhood: a review of human studies. Prostaglandins, Leukotrienes, and Essential Fatty Acids 76, 189–203. [DOI] [PubMed] [Google Scholar]
- Fall C., Fisher D., Osmond C. & Margetts B. (2009) Multiple Micronutrient Supplementation during pregnancy in low‐income countries: a meta‐analysis of effects on birth size and gestation length. Food and Nutrition Bulletin 30 (4s), S533–S546. [DOI] [PMC free article] [PubMed] [Google Scholar]
- Fernald L.C., Gertler P.J. & Neufeld L.M. (2008) Role of cash in conditional cash transfer programmes for child health, growth, and development: an analysis of Mexico's Oportunidades. Lancet 371, 828–837. [DOI] [PMC free article] [PubMed] [Google Scholar]
- Fernald L.C., Gertler P.J. & Neufeld L.M. (2009) 10‐year effect of Oportunidades, Mexico's conditional cash transfer programme, on child growth, cognition, language, and behaviour: a longitudinal follow‐up study. Lancet 374, 1997–2005. [DOI] [PubMed] [Google Scholar]
- Food and Nutrition Board Institute of Medicine . (2002) Dietary Reference Intakes for Energy, Carbohydrate, Fiber, Fat, Fatty Acids, Cholesterol, Protein and Amino Acids (Macronutrients). National Academy Press: Washington, DC. [DOI] [PubMed] [Google Scholar]
- Food and Nutrition Board Institute of Medicine . (2002, 2005) Dietary Reference intakes of vitamin A, vitamin K, arsenic, borun, chromium, copper, iodine, manganese, molybdenum, nickel, silicon, vanadium and zinc. National Academy Press: Washington, DC. [Google Scholar]
- Girija A., Geervani P. & Rao G.N. (1984) Influence of dietary supplementation during pregnancy on lactation performance. Journal of Tropical Pediatrics 30, 79–83. [DOI] [PubMed] [Google Scholar]
- Haider B.A. & Bhutta Z.A. (2006) Multiple‐micronutrient supplementation for women during pregnancy. Cochrane Database of Systematic Reviews (4), CD004905. [DOI] [PMC free article] [PubMed] [Google Scholar]
- Helland I.B., Saugstad O.D., Smith L., et al (2001) Similar effects on infants of n‐3 and n‐6 fatty acids supplementation to pregnant and lactating women. Pediatrics 108 (5), e82, 1–10. [DOI] [PubMed] [Google Scholar]
- Hibbeln J.R. (2002) Seafood consumption, the DHA content of mothers' milk and prevalence rates of postpartum depression: a cross‐national, ecological analysis Journal of Affective Disorders 69 (1–3), 15–29. [DOI] [PubMed] [Google Scholar]
- Hoa P.T., Khan N.C., van Beusekom C., Gross R., Conde W.L. & Khoi H.D. (2005) Milk fortified with iron or iron supplementation to improve nutritional status of pregnant women: an intervention trial from rural Vietnam. Food and Nutrition Bulletin 26, 32–38. [DOI] [PubMed] [Google Scholar]
- Hofmeyr G.J., Lawrie T.A., Atallah A.N. & Duley L. (2011) Calcium supplementation during pregnancy for preventing hypertensive disorders and related problems. Cochrane Database of Systematic Reviews (2), 1–62, CD001059. [DOI] [PubMed] [Google Scholar]
- Horvath A., Koletzko B. & Szajewska H. (2007) Effect of supplementation of women in high‐risk pregnancies with long‐chain polyunsaturated fatty acids on pregnancy outcomes and growth measures at birth: a meta‐analysis of randomized controlled trials. The British Journal of Nutrition 98 (2), 253–259. [DOI] [PubMed] [Google Scholar]
- Huybregts L., Roberfroid D., Lanou H., Menten J., Meda N., Van Camp J. et al (2009a) Prenatal food supplementation fortified with multiple micronutrients increases birth length: a randomized controlled trial in rural Burkina Faso. The American Journal of Clinical Nutrition 90, 1593–1600. [DOI] [PubMed] [Google Scholar]
- Huybregts L.F., Roberfroid D.A., Kolsteren P.W. & Van Camp J.H. (2009b) Dietary behaviour, food and nutrient intake of pregnant women in a rural community in Burkina Faso. Maternal & Child Nutrition 5, 211–222. [DOI] [PMC free article] [PubMed] [Google Scholar]
- Hyder S.M., Haseen F., Khan M., Schaetzel T., Jalal C.S., Rahman M. et al (2007) A multiple‐micronutrient‐fortified beverage affects hemoglobin, iron, and vitamin A status and growth in adolescent girls in rural Bangladesh. The Journal of Nutrition 137, 2147–2153. [DOI] [PubMed] [Google Scholar]
- Imhoff‐Kunsch B., Stein A., Villalpando S., Martorell R. & Ramakrishnan U. (2009) Docosahexaenoic acid supplementation from mid‐pregnancy through parturition influenced breast milk fatty acid composition at 1 month post‐partum in a double‐blind randomized controlled trial in Mexico. FASEB J 23, 344–345. [Google Scholar]
- Jiang T., Christian P., Khatry S.K., Wu L. & West K.P., Jr (2005) Micronutrient deficiencies in early pregnancy are common, concurrent, and vary by season among rural Nepali pregnant women. The Journal of Nutrition 135, 1106–1112. [DOI] [PubMed] [Google Scholar]
- Kaestel P., Michaelsen K.F., Aaby P. & Friis H. (2005) Effects of prenatal multimicronutrient supplements on birth weight and perinatal mortality: a randomised, controlled trial in Guinea‐Bissau. European Journal of Clinical Nutrition 59, 1081–1089. [DOI] [PubMed] [Google Scholar]
- Kardjati S., Kusin J.A. & De With C. (1988) Energy supplementation in the last trimester of pregnancy in East Java: I. Effect on birthweight. British Journal of Obstetrics and Gynaecology 95, 783–794. [DOI] [PubMed] [Google Scholar]
- Kennedy E.T. & Gershoff S. (1982) Effect of WIC supplemental feeding on hemoglobin and hematocrit of prenatal patients. Journal of the American Dietetic Association 80, 227–230. [PubMed] [Google Scholar]
- Kennedy E.T., Gershoff S., Reed R. & Austin J.E. (1982) Evaluation of the effect of WIC supplemental feeding on birth weight. Journal of the American Dietetic Association 80, 220–227. [PubMed] [Google Scholar]
- Kowaleski‐Jones L. & Duncan G.J. (2002) Effects of participation in the WIC program on birthweight: evidence from the National Longitudinal Survey of Youth. Special Supplemental Nutrition Program for Women, Infants, and Children. American Journal of Public Health 92, 799–804. [DOI] [PMC free article] [PubMed] [Google Scholar]
- Kramer M.S. & Kakuma R. (2003) Energy and protein intake in pregnancy. Cochrane Database of Systematic Reviews (4), CD000032. [DOI] [PubMed] [Google Scholar]
- Krauss‐Etschmann S., Shadid R., Campoy C. et al (2007) Effects of fish‐oil and folate supplementation of pregnant women on maternal and fetal plasma concentrations of docosahexaenoic acid and eicosapentaenoic acid: a European randomized multicenter trial. American Journal of Clinical Nutrition 85 (5), 1392–1400. [DOI] [PubMed] [Google Scholar]
- Kusin J.A., Kardjati S., Houtkooper J.M. & Renqvist U.H. (1992) Energy supplementation during pregnancy and postnatal growth. Lancet 340, 623–626. [DOI] [PubMed] [Google Scholar]
- Latham M.C., Ash D.M., Makola D., Tatala S.R., Ndossi G.D. & Mehansho H. (2003) Efficacy trials of a micronutrient dietary supplement in schoolchildren and pregnant women in Tanzania. Food and Nutrition Bulletin 24, S120–S128. [DOI] [PubMed] [Google Scholar]
- Lawn J.E., Kerber K., Enweronu‐Laryea C. & Cousens S. (2010) 3.6 million neonatal deaths‐what is progressing and what is not? Seminars in Perinatology 34, 371–386. [DOI] [PubMed] [Google Scholar]
- Lechtig A., Habicht J.P., Delgado H., Klein R.E., Yarbrough C. & Martorell R. (1975) Effect of food supplementation during pregnancy on birthweight. Pediatrics 56, 508–520. [PubMed] [Google Scholar]
- Leroy J.L., Garcia‐Guerra A., Garcia R., Dominguez C., Rivera J. & Neufeld L.M. (2008) The Oportunidades program increases the linear growth of children enrolled at young ages in urban Mexico. The Journal of Nutrition 138, 793–798. [DOI] [PubMed] [Google Scholar]
- Makola D., Ash D.M., Tatala S.R., Latham M.C., Ndossi G. & Mehansho H. (2003) A micronutrient‐fortified beverage prevents iron deficiency, reduces anemia and improves the hemoglobin concentration of pregnant Tanzanian women. The Journal of Nutrition 133, 1339–1346. [DOI] [PubMed] [Google Scholar]
- Makrides M., Duley L. & Olsen S.F. (2009) Marine oil, and other prostaglandin precursor, supplementation for pregnancy uncomplicated by pre‐eclampsia or intrauterine growth restriction. Cochrane Database of Systematic Reviews (Online) (4), 1–35. [DOI] [PubMed] [Google Scholar]
- Mardones F., Urrutia M.T., Villarroel L., Rioseco A., Castillo O., Rozowski J. et al (2008) Effects of a dairy product fortified with multiple micronutrients and omega‐3 fatty acids on birth weight and gestation duration in pregnant Chilean women. Public Health Nutrition 11, 30–40. [DOI] [PubMed] [Google Scholar]
- Mardones‐Santander F., Rosso P., Stekel A., Ahumada E., Llaguno S., Pizarro F. et al (1988) Effect of a milk‐based food supplement on maternal nutritional status and fetal growth in underweight Chilean women. The American Journal of Clinical Nutrition 47, 413–419. [DOI] [PubMed] [Google Scholar]
- Martorell R., Habicht J.P. & Rivera J.A. (1995) History and design of the INCAP longitudinal study (1969–1977) and its follow‐up (1988–1989). The Journal of Nutrition 125, 1027S–1041S. [DOI] [PubMed] [Google Scholar]
- Mora J.O., de Paredes B., Wagner M., de Navarro L., Suescun J., Christiansen N. et al (1979) Nutritional supplementation and the outcome of pregnancy. I. Birth weight. The American Journal of Clinical Nutrition 32, 455–462. [DOI] [PubMed] [Google Scholar]
- Muthayya S., Dwarkanath P., Thomas T., Ramprakash S., Mehra R., Mhaskar A. et al (2009) The effect of fish and omega‐3 LCPUFA intake on low birth weight in Indian pregnant women. European Journal of Clinical Nutrition 63, 340–346. [DOI] [PubMed] [Google Scholar]
- Nesheim M.C. & Yaktine A. (2007) Seafood Choices: Balancing Benefits and Risk. Food and Nutrition Board, Institute of Medicine. National Academy Press: Washington DC. [Google Scholar]
- Nyuar K.B., Min Y., Ghebremeskel K., Khalil A.K., Elbashir M.I. & Cawford M.A. (2010) Milk of northern Sudanese mothers whose traditional diet is high in carbohydrate contains low docosahexaenoic acid. Acta Paediatrica 99, 1824–1827. [DOI] [PubMed] [Google Scholar]
- Oken E. & Gillman M.W. (2003) Fetal origins of obesity. Obesity Research 11, 496–506. [DOI] [PubMed] [Google Scholar]
- Prentice A.M., Whitehead R.G., Roberts S.B., Paul A.A., Watkinson M., Prentice A. et al (1980) Dietary supplementation of Gambian nursing mothers and lactational performance. Lancet 2, 886–888. [DOI] [PubMed] [Google Scholar]
- Prentice A.M., Cole T.J., Foord F.A., Lamb W.H. & Whitehead R.G. (1987) Increased birthweight after prenatal dietary supplementation of rural African women. The American Journal of Clinical Nutrition 46, 912–925. [DOI] [PubMed] [Google Scholar]
- Ramakrishnan U., Stein A.D., Parra‐Cabrera S., Wang M., Imhoff‐Kunsch B., Juarez‐Marquez S. et al (2010). Effects of docosahexaenoic acid supplementation during pregnancy on gestational age and size at birth: randomized, double‐blind, placebo‐controlled trial in Mexico. Food Nutrition Bulletin 31, S108‐S116. [DOI] [PubMed] [Google Scholar]
- Rasmussen K.M. & Habicht J.P. (2010) Maternal supplementation differentially affects the mother and newborn. The Journal of Nutrition 140, 402–406. [DOI] [PubMed] [Google Scholar]
- Rivera J., Rodriguez G., shamah T., Rosado J., Casanueva E., Maulen I. et al (2000) Implementation, monitoring, and evaluation of the nutrition component of the Mexican Social Programme (PROGRESA). Food and Nutrition Bulletin 21, 35–42. [Google Scholar]
- Rosado J., Rivera J., Lopez G. & Solano L. (2000) Development, production, and quality control of nutritional supplements for a national supplementation programme in Mexico. Food and Nutrition Bulletin 20, 30–34. [Google Scholar]
- Ross S.M., Nel E. & Naeye R.L. (1985) Differing effects of low and high bulk maternal dietary supplements during pregnancy. Early Human Development 10, 295–302. [DOI] [PubMed] [Google Scholar]
- Rush D., Stein Z. & Susser M. (1980) A randomized controlled trial of prenatal nutritional supplementation in New York City. Pediatrics 65, 683–697. [PubMed] [Google Scholar]
- Shrimpton R., Thorne‐Lyman A., Tripp A. & Tomkins A. (2009) Trends in low birthweight among the Bhutanese refugee population in Nepal. Food and Nutrition Bulletin 30, S197–S206. [DOI] [PubMed] [Google Scholar]
- Smuts C.M., Huang M., Mundy D., Plasse T., Major S. & Carlson S.E. (2003) A randomized trial of docosahexaenoic acid supplementation during the third trimester of pregnancy. Obstetrics and Gynecology 101 (3), 469–479. [DOI] [PubMed] [Google Scholar]
- Szajewska H., Horvath A. & Koletzko B. (2006) Effect of n‐3 long‐chain polyunsaturated fatty acid supplementation of women with low‐risk pregnancies on pregnancy outcomes and growth measures at birth: a meta‐analysis of randomized controlled trials. American Journal of Clinical Nutrition 83 (6), 1337–1344. [DOI] [PubMed] [Google Scholar]
- Tartanac F. (2000) Incaparina and other Incaparina‐based foods: experience of INCAP in Central America. Food and Nutrition Bulletin 21, 49–54. [Google Scholar]
- United Nations Children's Fund (UNICEF) (2009) The State of the World's Children.
- United States Department of Agriculture (USDA) (2007) Special Supplemental Nutrition Program for Women, Infants and Children (WIC): revisions in the WIC Food Packages; Interim Rule. Washington, DC. Http://www.fns.usda.gov/wic/regspublished/foodpackages-interimrule.htm .
- van Steenbergen W.M., Kusin J.A., Kardjati S. & de With C. (1989) Energy supplementation in the last trimester of pregnancy in East Java, Indonesia: effect on breast‐milk output. The American Journal of Clinical Nutrition 50, 274–279. [DOI] [PubMed] [Google Scholar]
- Viegas O.A., Scott P.H., Cole T.J., Eaton P., Needham P.G. & Wharton B.A. (1982a) Dietary protein energy supplementation of pregnant Asian mothers at Sorrento, Birmingham. II: selective during third trimester only. British Medical Journal (Clinical Research Ed.) 285, 592–595. [DOI] [PMC free article] [PubMed] [Google Scholar]
- Viegas O.A., Scott P.H., Cole T.J., Mansfield H.N., Wharton P. & Wharton B.A. (1982b) Dietary protein energy supplementation of pregnant Asian mothers at Sorrento, Birmingham. I: unselective during second and third trimesters. British Medical Journal (Clinical Research Ed.) 285, 589–592. [DOI] [PMC free article] [PubMed] [Google Scholar]
- Villar J. & Rivera J. (1988) Nutritional supplementation during two consecutive pregnancies and the interim lactation period: effect on birth weight. Pediatrics 81, 51–57. [PubMed] [Google Scholar]
- World Health Organisation and Food and Agriculture Organisation . (2004)Vitamin and mineral requirements in human nutrition, Second edition. Geneva.
- Yakes E.A. (2010) Polyunsaturated fatty acid intake and status of breast fed and non‐breast fed Bangladeshi children 24–47 months of age. In: Epidemiology. University of California, Davis: Davis, CA.