

Abstract
This study investigated whether perceptions of parenting behaviours predict young adolescents' nutritional intake and body fatness. The randomly selected study sample consisted of 106 13–15 years olds from Houston Metropolitan Statistical Area. Parenting style variables were created by cluster analysis and factor analysis. A two‐cluster solution for both maternal and paternal parenting style represented authoritative vs. non‐authoritative parenting. Two parenting dimension factors derived were maternal/paternal nurturing and control. For adolescents' energy and nutrient intake, greater maternal nurturing appeared to be most beneficial given its association with lower consumption of total kilocalorie and lower saturated fat intake. Paternal nurturing was associated with lower sodium intake, whereas paternal control predicted lower percentage of kilocalories from carbohydrate and percentage Dietary Reference Intake for dietary fibre, and greater percentage of kilocalories from total fat. Maternal authoritative parenting and lower maternal control over their adolescents may have protective effects against having heavier and fatter adolescents given their associations with adolescents' body weight, sub‐scapular skinfold, waist circumference, body mass index, and the tendencies of being at risk of overweight and being overweight. None of paternal parenting styles or dimensions appeared to be significantly related to adolescents' body fatness.
Keywords: parenting style, parenting dimensions, young adolescents, factor analysis, cluster analysis
Introduction
The proportion of youth who are overweight has increased dramatically: about 15.8% of children (ages 6–11) and 16.1% of adolescents (ages 12–19) fell in the category of extremely overweight or obese [95th percentile of body mass index (BMI)‐for‐age] in 1999–2002, whereas only 7% of children and 5% of adolescents were obese in 1976–1980, suggesting childhood and adolescence obesity has doubled and tripled in two decades respectively (Hedley et al. 2004). Evidence is compelling that being overweight has a connection with a variety of health problems; many adult‐associated diseases, including type II diabetes, dyslipidemia, hypertension, cardiovascular disease, sleep apnoea, and orthopaedic complications are now diagnosed frequently among overweight children and adolescents (Black et al. 2006). In addition to the connections to chronic diseases, overweight children and adolescents are facing challenges of social stigmatization that can lead to negative body image and eating disorders and abnormal psychological developments (Swallen et al. 2005).
Numerous studies have addressed current unhealthful dietary patterns in US adolescents such as low fruit and vegetable intake, increased snacking, fast food and soft drink consumption, super‐sized servings, skipping meals, and increased incidence of eating away from home (St‐Onge et al. 2003). Such undesirable dietary habits may result in inappropriate energy and nutrient intake including over/under energy consumption, lack of essential nutrients such as calcium, iron, vitamin C, and excessive intake of fat, sugar and sodium (Briefel & Johnson 2004).
Researchers have suggested that environmental factors, as well as certain dietary behaviours, affect a child's development and contribute to an increase in weight and risk of becoming overweight (Malecka‐Tendera & Mazur 2006). Environmental factors currently being researched include family, school, community and mass media. Of these, researchers have considered the family, especially parents, to be the most influential component affecting a child's eating behaviours and other related food practices. However, parents vary in terms of the ways in which they socialize their children (referred to as parenting style), resulting in great differences in their children's development (Baumrind 1967, 1968; Kremers et al. 2003).
Numerous studies have dealt with the associations between parenting styles and children's/adolescents' developmental outcomes, such as psychosocial adjustment (Jackson et al. 2005), academic performance (Garg et al. 2005), behavioural problems (Weaver & Prelow 2005) and multiple aspects of development (Baumrind 1991). According to the literature on parenting style theories, authoritative parents are both demanding and responsive (Baumrind 1989). When children enter adolescence, authoritative parents respond by allowing more autonomy which is associated with a healthy transition from adolescence to adulthood. Authoritative parents seldom use physical punishment or harsh criticism towards their children, but instead they rely on the withdrawal of privileges as punishment for improper conduct, and also they use frequent praise and rewards for a child's good behaviour and achievement. There seems to be universal agreement that authoritative parenting style may have the most beneficial impacts on children's developmental outcomes (Baumrind 1967, pp. 68, 89, 91).
Despite the wealth of research in this field, however, the potential link between perceived parenting behaviours and the nutritional status and other health outcomes of adolescents has largely been neglected. In recent years, researchers have reported associations between adolescents' perceived parental parenting styles and health outcomes, such as dietary behaviours (Kremers et al. 2003) and physical activities (Schmitz et al. 2002). Findings from these studies were in agreement with the parenting style theories which claim that authoritative parenting style is considered to be the most balanced, optimal style. Golan & Crow (2004) have suggested that parents play key roles in fostering healthy eating and activity habits and in maintaining children's health. In addition, a potential link between parenting style and treatment of adolescents with obesity has been suggested (Regber & Marild 2005). However, no single study has investigated the relationship between young adolescents' perceived parenting behaviours and the youth's nutritional outcomes such as dietary intake and body fatness status. This study investigated the relationship between young adolescents' (ages 13–15 years) perception of the parenting behaviours each of their parents utilize, both in terms of parenting styles and dimensions, and adolescents' energy and nutrient intake. In addition, the study attempted to determine if perceived parenting behaviours directly predict adolescents' body fatness status on a cross‐sectional study design. Finally, the study deals with adolescents' perception of how they are being parented using two differing but complementary data reduction techniques, cluster analysis (which is based on cases) and second‐order factor analysis (which is based on variables). Each approach provides a unique means of summarizing results (Thurstone 1947; Gorsuch 1965). Others have taken this approach in studies that ranged from dietary intake to determining difference among stigmatized groups (see Alexy et al. 2005; Towler & Schneider 2005; Crozier et al. 2006). Second‐order factor analysis is used in order to create a greater level of generality when identifying factors underlying data (Thurstone 1947; D'Agostino & Russell 2005).
Methods
Sample
The data were collected from the Houston Metropolitan Statistical Area (MSA), Texas. The Houston MSA has the largest concentration of minority groups in the state, and it is largely urban but includes several rural communities (U.S. Census 2002). The first phase of sampling was conducted using the Random Digit Dialing method. If a family expressed interest in participating during the initial contact call, a consent form for the mother and father (if present), and an assent form for the adolescent were mailed to their residence along with a self‐addressed, stamped envelope. After the consent and assent forms were obtained, trained interviewers obtained data from parents by telephone and from the adolescents in their homes. In addition, parents filled out a self‐administered questionnaire regarding their income and other information. In order to assess the impact of maternal vs. paternal parenting style on adolescents' nutritional status, only those adolescents in dual‐headed households were included in the present analysis (resulting in a sample of 106 adolescents, ages 13–15). This study was approved by the Institutional Review Board at Texas A&M University (see McIntosh et al. 2006 for more details).
Adolescent profile
The adolescent profile consisted of several measures: (1) a survey on perceived parenting behaviours; (2) 1 day of multi‐pass 24 h diet recall; (3) 2 days of diet records; (4) anthropometric measures; and (5) Tanner stage measurement.
Measures of perceived parenting behaviours
In order to capture as much complexity of parenting behaviour as possible, the parenting variables were subjected to two types of ‘data reduction’ techniques: cluster analysis and common factor analysis. Results from the application of each technique will then be used to predict nutrient intake and body fatness.
Parenting style is usually measured via children's perceptions of how their mothers and fathers parent them (Maccoby & Martin 1983). Parenting style variables were based on the parenting style instrument used in this study which is a slightly modified version (wording modernization) of the instrument developed by Devereux and colleagues that intended to index nine general parenting behaviours perceived by older children (Devereux et al. 1962). Four items were added to measure authoritarian punishment and authoritative reward style, creating two additional parenting behaviour dimensions. In addition, the parenting style construct developed for the present study was pre‐tested in two pilot studies using adolescents from two urban and two rural communities in Texas (Lazarou 1998; Tramm 2000). Following standard practice, each of the 35 items was grouped according to which 11 parenting style components they represented (see Darling & Toyokawa 1997; Adalbjarnardoyyir & Hafsteinsson 2001; Slicker et al. 2005; Butler et al. 2007). The averaged values for the pertinent questions were used as final scores for each parenting dimension. These parenting style dimensions were used for both cluster and factor analyses and include care, clear behavioural regulation, help, maturity expectations, lack of punishment, high achievement expectations, immaturity expectations, psychological punishment, punishment by withholding privileges, harsh punishment and praise. The original questions that were combined to create each of the maternal/paternal parenting style dimension variables are shown elsewhere (Kim 2006). Finally, the study subjects were classified based on their perceptions of parenting style using cluster analysis technique. Cluster analysis was used in order to look for patterns among children's perceptions of their parents in terms of their scores on the parenting style dimensions. In addition, second‐order common factor analysis was also employed in order to look for patterns among the parenting variables.
Measures of nutritional outcomes
Energy and nutrient intake
Subjects' energy and nutrient intake were assessed using the average dietary intake of 1‐day multi‐pass 24‐h recall and two days of diet record for two weekdays and one weekend day. The multi‐pass 24‐h recall method was conducted based on the most recent methodology (Chambers et al. 2000). For the 2 days of diet record, the subjects were provided detailed instructions and visual aids including measuring cups and spoons, a ruler, and two‐dimensional portion‐size booklets. The same interviewer who conducted the multi‐pass 24‐h recall obtained the food records over the phone by adopting the probing and final review techniques of the multi‐pass 24‐h recall method in order to increase the accuracy of food record data. The dietary data collected were averaged for energy and nutrients using the Food Processor SQL Nutrition Analysis and Fitness Software (ESHA Research, 2002–2003). Selected variables with respect to energy intake included total kilocalories, percentage of kilocalories from carbohydrate, percentage of kilocalories from protein, percentage of kilocalories from total fat, and percentage of kilocalories from saturated fat. The percentage of the Dietary Reference Intake (DRI) for calcium, iron, vitamin A, vitamin C, folate and dietary fibre was calculated by comparing the amount of a nutrient that a subject consumed with the recommended amount based on the most recent DRI references (Institute of Medicine 2004). Despite the need for adolescents' daily consumption of these nutrients, adolescents tend to consume insufficient quantities of them, as have often been cited in the literature. Five additional variables, total sugar, sodium, cholesterol, saturated fat and trans fat, were included because of the tendency of over consumption and their detrimental health impacts (Briefel & Johnson 2004).
Body measurements and BMI
Height, weight, waist circumference and triceps skinfold and sub‐scapular skinfold thickness were obtained by trained interviewers following standardized procedures. In addition, as another measure of body fatness status, BMI was calculated as body weight in kg divided by height in meters squared (Lee & Nieman 1996). Each subject's BMI percentile was calculated using the sas program developed by the Centers for Disease Control and Prevention (CDC 2005). The resulting sex‐ and age‐specific BMI percentiles were used to develop four‐dichotomous variables on the basis of CDC guidelines: Underweight (less than the 5th percentile), Healthy weight (5th percentile to less than the 85th percentile), At risk of overweight (85th to less than the 95th percentile) and Overweight (equal to or greater than the 95th percentile) (Kuczmarski et al. 2002).
Control variables
Parents' age, education level, weight and height and household income variables were constructed from the Parents' Telephone Survey and Parents' Self‐administered Questionnaire. A BMI score was calculated for each parent from these self‐reports, recognizing the potential bias in such self reports (Nawaz et al. 2001). Variables for adolescents' age, gender, activity level, maturity level and ethnic background were constructed from the child interview data. The Tanner stage assessment was used to determine sexual maturity of adolescents. The Tanner scale was composed of a series of drawings of children at various stages of puberty. In order to reduce embarrassment for the participants, they were given an envelope containing the sex‐appropriate Tanner drawings and were asked to go to another room in order to circle the appropriate level of development represented by the various choices offered. The average of the scores for developmental stage (1–5 scales) and secondary sex characteristics (1–5 scales) was used in analysis (Adam et al. 2002). Among these control variables, adolescents' gender, activity level, maturity level, ethnic background and Tanner development stage were dummy variables and coded as follows: ‘1’ if an adolescents is girl and ‘0’ otherwise; ‘1’ if an adolescent participated in active exercise in at least 3–5 days in the last 14 days and ‘0’ if not; ‘1’ if an adolescent is Anglo/Caucasian/ White/Irish and ‘0’ otherwise; ‘1’ if the reported Tanner development stage score was greater than one and ‘0’ otherwise (pubescent vs. pre‐pubescent).
Statistical analyses
All statistical analyses were performed using the sas (Version 9.0; sas Institute Inc, Cary, NC, USA). The Shapiro–Wilk test and normal probability plots were used to determine the distribution of continuous variables and appropriate transformations were made where needed (Hamilton 1992). Associations between adolescents' perceived parenting behaviours, energy and nutrient intake and body measurements were determined using correlation analysis, multiple regression analysis, and logistic regression analysis (Cohen Cohen et al. 2003). First, Pearson's product moment correlation coefficient was calculated to identify relationships between study variables. Correlations with sufficient statistical significance (P < 0.05) were then further tested using regression techniques. Control variables, when significant in zero‐order correlations with the dependent variables, were incorporated in the regression models. Any parenting behaviours results that indicated lack of statistical significance (P ≥ 0.05) are not presented in this paper.
Ward's method of cluster analysis was used to classify the adolescents and two methods were adopted to determine the number of clusters in the data: visual evaluation of hierarchical tree diagram (also called dendrogram) and analysis of amalgamation coefficients (Nesselroade & Cattell 1988), which involves looking for ‘jumps’ in the diagram. A separate cluster analysis was done on each parents set of parenting dimension scores; a third cluster analysis was conducted using both parents' sets of parenting dimension scores. Second‐order common factor analysis is a technique designed to improve upon the data reduction achieved by a first‐order common factor analysis. Common factor analysis avoids problems of overestimating shared variance by separating out unique variance, a problem associated with principal components analysis (Pett et al. 2003). This analysis began with a separate common factor analysis (first‐order analysis) of both the 11 maternal and paternal parenting style dimensions to determine the interrelationship among these items (using factor loadings) as well as internal consistency of each dimension using Cronbach's alpha coefficient (Pett et al. 2003). Scores developed for each dimension variable in this analysis were used as inputs into a second (second‐order) common factor analysis. Final factors again were determined based on eigenvalues, factor loadings and Cronbach's alpha.
Factors were accepted if their eigenvalues met the minimum criterion of 1.0; variables were retained in the analysis if their ‘measure of sampling adequacy’ were 0.60 or greater (Pett et al. 2003). Among those variables retained, in order to judge that a particular variable loaded on a given factor, that variable's factor loading had to reach 0.40 or greater on the factors that resulted from an orthogonal rotation. Cronbach's alpha was used to test internal consistency among the variables making up the various parenting style dimensions; items making up a given parenting style dimension had to achieve an alpha of 0.70 or greater.
Regression models were run to determine the relationship between various parenting variables and nutritional outcomes. Control variables were included in models when zero‐order correlation coefficients between controls and nutritional outcomes were significant. In cases in which high collinearity (tolerance of >0.40) among parenting variables was detected in models involving variables that resulted from the cluster analysis, two equations are presented, one with one set of parenting variables and a second with a second set of parenting variables.
Results
Demographic characteristics of adolescents and their parents
A summary of demographic characteristics for the subjects and their parents is as follows: 52% of the subjects were boys; 78% were Non‐Hispanic white; only 2% of adolescents were at prepubescent; fathers were on average 2.3 years older than mothers; fathers and mothers had a similar education level (median education for mothers = 6 and for fathers = 6, categories 6 is ‘college graduate’); the average BMI's for fathers and mothers were 27.51 and 25.81 respectively; mean family income was $100 000. Because of collinearity problems, mothers' education was subtract from fathers'; mothers' age subtracted from fathers'; and mothers' and fathers' BMI was averaged.
Adolescents' perceived parenting behaviours
The results from the cluster analysis of each parent's parenting style dimensions suggested two clusters are the most reasonable solution for both maternal and paternal parenting styles in adolescents (1, 2). With respect to maternal parenting style, the first cluster indicated higher group means for care, clear behavioural regulation, help, maturity expectations, lack of punishment and praise, compared with the mean values for the second cluster. Accordingly, the second cluster had higher group means for high achievement expectations, immaturity expectations, psychological punishment, punishment by withholding privileges and harsh punishment. The first cluster was named as maternal authoritative style (MA), and the second cluster was named as maternal non‐authoritative style (MNA) based on general parenting style theories and other studies (Table 1). For paternal parenting styles in adolescents, the first cluster was named as paternal authoritative style (PA) that exhibited higher scores in terms of care, clear behavioural regulation, help, maturity expectations, lack of punishment, high achievement expectations, immaturity expectations and praise. The second cluster was named as paternal non‐authoritative style (PNA) based on the higher group mean scores for psychological punishment, punishment by withholding privileges and harsh punishment. Unlike the findings with respect to the MA, the PA involved higher group means for high achievement expectations and immaturity expectations (Table 1). The third cluster analysis which included both parents parenting style dimensions produced a cluster of adolescents who perceived both mother and father as authoritative parents was named as ‘both parents' authoritative style (BA)’, and the other cluster was named as ‘at least one parent's non‐authoritative style (OPNA)’. These non‐standard abbreviations, including MA, MNA, PA, PNA, BA and OPNA, will be used for the remainder of the paper.
Figure 1.
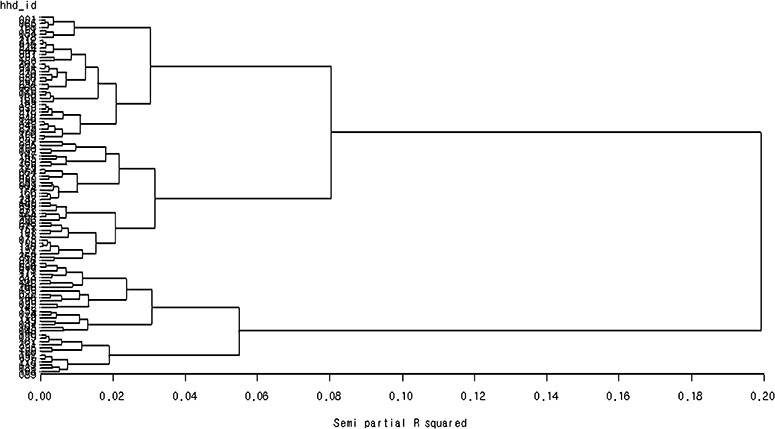
SAS output of cluster analysis for adolescents' of mother's parenting style (dendogram).
Figure 2.
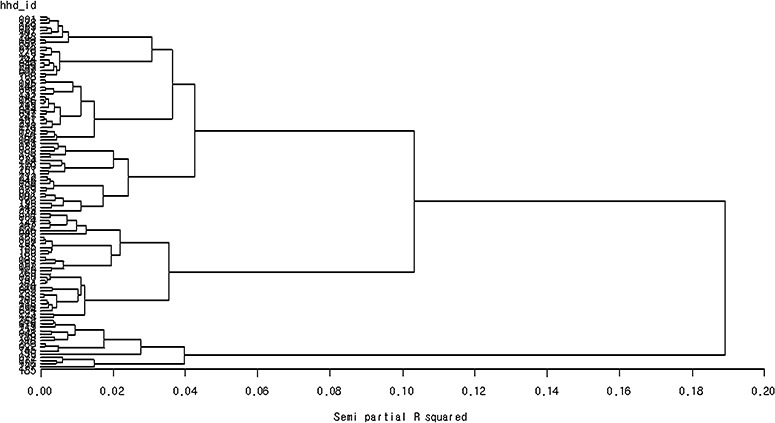
SAS output of cluster analysis for adole scents' of father's parenting style (dendogram).
Table 1.
Group means for perceived maternal/paternal parenting style dimensions between MA and MNA as well as PA and PNA in 13–15‐year‐old adolescents
| Maternal | Paternal | |||
|---|---|---|---|---|
| MA (n = 73) | MNA (n = 33) | PA (n = 91) | PNA (n = 15) | |
| Care | 5.07 (0.84)* | 4.20 (1.14) | 4.67 (1.00) | 1.96 (0.76) |
| Clear behavioural regulation | 4.92 (0.67) | 4.22 (0.82) | 4.81 (0.79) | 3.33 (1.01) |
| Help | 4.68 (1.20) | 3.80 (1.48) | 4.88 (1.15) | 2.80 (1.05) |
| Maturity expectations | 4.77 (0.89) | 3.79 (1.04) | 4.50 (0.98) | 2.90 (0.71) |
| Lack of punishment | 2.88 (0.83) | 2.00 (0.60) | 2.58 (1.09) | 1.67 (0.65) |
| High achievement expectations | 4.62 (0.85) | 4.94 (0.88) | 4.55 (0.92) | 4.25 (1.44) |
| Immaturity expectations | 3.37 (0.88) | 3.90 (1.05) | 3.22 (0.99) | 2.93 (1.12) |
| Psychological punishment | 2.00 (0.65) | 2.84 (0.89) | 1.88 (0.76) | 2.67 (1.23) |
| Punishment by withholding privileges | 2.50 (1.05) | 4.47 (0.96) | 3.01 (1.35) | 3.23 (1.33) |
| Harsh punishment | 1.79 (0.42) | 2.73 (0.49) | 1.94 (0.55) | 2.57 (0.94) |
| Praise | 4.16 (0.65) | 3.73 (0.67) | 3.96 (0.61) | 2.33 (0.90) |
Questions regarding the first 10 dimensions were asked using a 6‐point Likert scale (1 = never to 6 = always), and a 5‐point Likert scale (1 = never to 5 = very frequently) was used for the question of Praise dimension; the summed and averaged values for the pertaining questions were used as final scores for each parenting dimension. *mean (standard deviation). MA, maternal authoritative style; MNA, maternal non‐authoritative style; PA, paternal authoritative style; PNA, paternal non‐authoritative style.
Based on the cluster analysis, only a relatively small number of adolescents (14%) perceived their fathers to be non‐authoritative. In addition, authoritative fathers appeared to exert a higher level of immaturity expectations and high achievement expectations towards their adolescents, compared with authoritative mothers. Both authoritative mothers and authoritative fathers tended to punish their adolescents less frequently than non‐authoritative mothers/fathers did, regardless of the type of punishment.
Examination of the BA suggests that both authoritative mothers and fathers used higher levels of care, clear behavioural regulation, help, maturity expectations and praise, but exhibited a lower likelihood of punishments in dealing with their adolescents. However, authoritative fathers had a higher level of high achievement expectations and immaturity expectations, whereas authoritative mothers adopted lower levels of those two sub‐dimensions in dealing with their adolescents (Table 2). This implies that authoritative fathers tend to be harder on their adolescent children than authoritative mothers are.
Table 2.
Group means for perceived maternal/paternal parenting style dimensions between BA and OPNA in 13–15‐year‐old adolescents
| Maternal | Paternal | |||
|---|---|---|---|---|
| BA (n = 65) | OPNA (n = 41) | BA (n = 65) | OPNA (n = 41) | |
| Care | 5.17 (0.79)* | 4.21 (1.07) | 4.73 (1.01) | 3.59 (1.54) |
| Clear behavioural regulation | 4.93 (0.65) | 4.33 (0.84) | 4.77 (0.79) | 4.32 (1.15) |
| Help | 4.74 (1.15) | 3.88 (1.49) | 5.08 (1.00) | 3.80 (1.46) |
| Maturity expectations | 4.82 (0.90) | 3.89 (0.98) | 4.61 (0.90) | 3.74 (1.19) |
| Lack of punishment | 2.88 (0.83) | 2.16 (0.73) | 2.55 (0.93) | 2.28 (1.29) |
| High achievement expectations | 4.68 (0.86) | 4.79 (0.88) | 4.48 (0.92) | 4.55 (1.14) |
| Immaturity expectations | 3.39 (0.86) | 3.77 (1.07) | 3.24 (1.01) | 3.09 (1.02) |
| Psychological punishment | 1.99 (0.64) | 2.69 (0.91) | 1.81 (0.72) | 2.27 (1.04) |
| Punishment by withholding privileges | 2.48 (1.03) | 4.12 (1.23) | 2.68 (1.13) | 3.60 (1.48) |
| Harsh punishment | 1.81 (0.43) | 2.52 (0.61) | 1.88 (0.51) | 2.26 (0.79) |
| Praise | 4.22 (0.62) | 3.73 (0.67) | 3.97 (0.56) | 3.34 (1.11) |
Questions regarding the first 10 dimensions were asked using a 6‐point Likert scale (1 = never to 6 = always), and a 5‐point Likert scale (1 = never to 5 = very frequently) was used for the question of Praise dimension; the summed and averaged values for the pertaining questions were used as final scores for each parenting dimension. *mean (standard deviation). BA, both parents' authoritative style; OPNA, at least one parent's non‐authoritative style.
The initial or first‐order common factor analyses of the 11 dimension variables (mothers and fathers' variables analysed separately) found that these variables achieved factor loadings of 0.40 or greater, with a few exceptional cases having factor loadings slightly lower than 0.40, and Cronbach's alpha coefficient value of greater than or equal to 0.60. One unanticipated outcome from this analysis was a factor that included both fathers' punishment by withholding privileges and harsh punishment (criticism). This result suggests that some fathers combine both authoritative and authoritarian punishment practices. Next, the first‐order factors for maternal parenting dimensions and for paternal parenting dimensions were subjected to a second or second‐order factor analyses (see Table 3). The resulting two factors identified by each second‐order analysis were named ‘nurturing’ and ‘control’ for both maternal and paternal parenting dimensions. All of the four parenting dimension factors obtained a minimum factor loading of 0.50 or greater and Cronbach's alpha coefficient cut‐off greater than 0.70. Variables created via factor analysis are standardized.
Table 3.
Common factor analysis of maternal/paternal parenting style dimensions perceived by 13–15‐year‐old adolescents
| Parenting items | Factors (Range of factor scores) | |||
|---|---|---|---|---|
| Maternal nurturing (m) (−2.93–2.10) | Paternal nurturing (p) (−3.64–1.95) | Maternal control (m) (−2.42–2.65) | Paternal control (p) (−3.21–2.82) | |
| Care (m) | 0.78* | |||
| Clear behavioral regulation (m) | 0.78 | |||
| Help (m) | 0.65 | |||
| Maturity expectations (m) | 0.70 | |||
| Praise (m) | 0.69 | |||
| Care (p) | 0.86 | |||
| Clear behavioral regulation (p) | 0.78 | |||
| Help (p) | 0.72 | |||
| Maturity expectations (p) | 0.75 | |||
| Praise (p) | 0.80 | |||
| Immaturity expectations (m) | 0.63 | |||
| Psychological punishment (m) | 0.59 | |||
| Punishment by withholding privileges (m) | 0.74 | |||
| Harsh punishment (m) | 0.74 | |||
| High achievement expectation (m) | 0.50 | |||
| Immaturity expectations (p) | 0.77 | |||
| Psychological punishment (p) | 0.53 | |||
| Punishment by withholding privileges and harsh punishment (p) | 0.75 | |||
| High achievement expectation (p) | 0.74 | |||
| Coefficient alpha | 0.77 | 0.84 | 0.74 | 0.78 |
Factors, common factor analysis technique was used to derive four underlying factors that are responsible for the covariation among the observed variables (shown in the first column, each of them were firstly derived factors using a series of raw questions). *factor loading value.
For adolescents' perception of maternal/paternal nurturing and control, the nurturing dimension comprised care, clear behavioural regulation, help, maturity expectations and praise for both mothers and fathers (ranges of the factors: maternal nurturing: −2.93–2.10; paternal nurturing: −3.64–1.95). The control dimensions contained five sub‐dimensions including immaturity expectations, high achievement expectations, psychological punishment, punishment by withholding privileges and harsh punishment (maternal control: −2.42 – 2.65; paternal control: −3.21–2.82) (Table 3).
Energy and nutrient intake
The mean energy intake was calculated at 2363 kilocalorie and 1770 kilocalorie for boys and girls respectively (see Table 4). Total kilocalorie and percentage of kilocalorie consumption from carbohydrate (54.6% for boys, 55.2% for girls), protein (14.7% for both boys and girls) and fat (32.1% for boys, 31.5% for girls) were comparable with those obtained from a nationally representative sample [Continuing Survey of Food Intakes by Individuals (CSFII)] (Enns et al. 2003). For four essential micronutrients, boys and girls consumed only about 77% and 54% of the DRI for calcium respectively; boys consumed sufficient vitamin A, vitamin C, and iron, while girls' consumption of vitamin C and iron appeared to be lower than the DRIs for these nutrients.
Table 4.
Comparison of mean values of selected anthropometric data for adolescents by sex and age across studies
| Sex/Age (n) | BMI (kg/m) | Waist (cm) | Triceps SF (mm) | Subscap SF (mm) | ||||
|---|---|---|---|---|---|---|---|---|
| Na | Hb | N | H | N | H | N | H | |
| Male | ||||||||
| 13 (13) | 20.7 | 22.1 | 73.8 | 76.6 | 13.4 | 16.6 | 10.4 | 12.1 |
| 14 (20) | 22.3 | 20.8 | 19.3 | 69.7 | 13.7 | 10.6 | 10.3 | 9.4 |
| 15 (22) | 22.5 | 23.4 | 80.1 | 73.9 | 12.0 | 12.6 | 10.4 | 10.7 |
| Female | ||||||||
| 13 (14) | 22.7 | 21.6 | 78.8 | 70.6 | 18.0 | 17.9 | 14.1 | 12.2 |
| 14 (18) | 22.9 | 21.7 | 78.8 | 70.7 | 18.7 | 16.0 | 14.3 | 11.5 |
| 15 (19) | 23.2 | 24.1 | 78.8 | 75.5 | 18.3 | 19.2 | 14.4 | 15.5 |
Na, National Health and Nutrition Examination Survey 1999–2002 data; Hb, the present study 2001–2002, data was collected from Houston, USA. Height, standing height; Waist, waist circumference; SF, skinfold thickness; The sample size for N was between 244 and 324.
Body measurements
It appeared that a considerable portion of subjects (38.17% boys vs. 31.37% girls) fell into the categories of either ‘at risk of overweight’ or ‘overweight’ based on the 2000 CDC guidelines (see Table 4). The heavier body weight was more apparent in boys than girls, except for 15‐year‐old girls (42.11% of 15‐year‐old girls were in either ‘at risk of overweight’ or ‘overweight’ category). When the subjects' BMI distribution was compared with the 1999–2002 data, 12.74% boys and 13.77% girls of the subjects were at or above the 85th percentile of the national data (NCHS, 2005). Table 4 also presents a comparison of mean values for waist circumference, triceps skinfold, and sub‐scapular skinfold between subjects and the National Health and Nutrition Examination Survey 1999–2002 data. Mean waist circumference of the subjects appeared to be slightly smaller than the 1999–2002 national data, except for 13‐year‐old boys. Mean triceps skinfolds of the subjects appeared to be comparable with the values indicated in the 1999–2002 data, except for 13‐ and 14‐year‐old boys and 14 year girls. Mean sub‐scapular skinfold of 13‐year‐old boys was a little higher but 13‐ and 14‐year‐old girls' sub‐scapular skinfolds were a little lower than the values in the 1999–2002 data. Overall, less difference was observed in girls' body measurements between the two data sets than in boys.
Association between perceived parenting and energy and nutrient intake
Regression analysis found that maternal and paternal parenting dimensions had differential impacts on adolescents' energy and nutrient intake: maternal nurturing was associated with lower consumption of total kilocalorie and lower saturated fat intake; maternal control predicted lower percentage of DRI for dietary fibre (a 1.46% decline for every additional unit of maternal control); paternal nurturing was associated with lower sodium intake (−0.31 mg of sodium for every one unit increase in paternal nurturing); paternal control was related to lower % energy from carbohydrate and % DRI for dietary fibre, but greater percentage of energy from total fat (Table 5). Being female was associated with a lower intake of total calories and total sodium, but greater percentage of DRI for dietary fibre. The greater the mothers' BMI, the less total saturated fat adolescents consumed. White‐Anglo adolescents consumed a greater % DRI for dietary fibre than other those of other ethnic background.
Table 5.
OLS regression of energy and nutrient intake on perception of parenting style dimensions and control variables for 13–15‐year‐old adolescents
| Variables of concern | Predictors | B | β | P‐value | F‐value (P‐value) | Adj. R2 |
|---|---|---|---|---|---|---|
| Total kilocalorie | Maternal nurturing | −1.53 | −0.21 | 0.02 | 16.10 (<0.0001) | 0.23 (n = 105) |
| Child's gender | −6.11 | −0.42 | <0.01 | |||
| Kilocalorie from carbohydrate (%) | Paternal control | −1.69 | −0.23 | 0.02 | 4.42 (0.0059) | 0.09 (n = 101) |
| Father's age – mother's age | −0.35 | −0.21 | 0.03 | |||
| Child's age | 1.28 | 0.14 | 0.04 | |||
| Kilocalorie from total fat (%) | Paternal control | 1.25 | 0.23 | 0.02 | 5.76 (0.0182) | 0.04 (n = 106) |
| DRI for dietary fibre (%) | Maternal control | −1.39 | −0.30 | <0.01 | 7.84 (<0.0001) | 0.16 (n = 105) |
| Child's gender | 0.52 | 0.19 | 0.03 | |||
| White race | 0.71 | 0.22 | 0.02 | |||
| Paternal control | −0.33 | −0.25 | 0.01 | 6.69 (0.0004) | 0.14 (n = 106) | |
| Child's gender | 0.50 | 0.19 | 0.04 | |||
| White race | 0.75 | 0.23 | 0.01 | |||
| Total saturated fat | Maternal nurturing | −0.22 | −0.19 | 0.05 | 4.06 (<0.0201) | 0.06 (n = 104) |
| Mother's BMI | −31.45 | −0.21 | 0.03 | |||
| Total sodium | Paternal nurturing | −0.31 | −0.20 | 0.03 | 6.27 (0.0027) | 0.09 (n = 106) |
| Child's gender | −5.06 | −0.26 | 0.01 |
Control variables included parental age, education and BMI, household income, as well as adolescent's age, gender, ethnicity, activity level and maturity level measured by Tanner development assessment. B, regression coefficient; β, standardized regression coefficient; P‐value, statistical significance for t statistic of each regression estimate; F‐value, overall model fit; Adj. R2, adjusted coefficient of determination; Child's gender, coded as 1 if an adolescent is girl and 0 otherwise; White race, coded as 1 if an adolescent is non‐Hispanic white and 0 otherwise; OLS, ordinary least squares; BMI, body mass index.
Association between perceived parenting and body fatness
Maternal parenting behaviours, rather than paternal parenting behaviours, were significant predictors of adolescents' body measurements and BMI scores. The MA was associated with having adolescents who are less fat, given the negative association between MA and body measurement variables including body weight, BMI, sub‐scapular skinfold, waist circumference and at risk of overweight. Furthermore, there was a positive association between MA and healthy weight; those experiencing MA parenting were 3.86 times more likely to fall in the healthy weight category (Table 6). By comparison, those adolescents who experienced authoritative parenting from one or both parents were 1.26 times more likely to be in the healthy weigh category. BA was associated with having adolescent whose BMI being in the healthy weight category (Table 6). By contrast, maternal control was positively associated with adolescents' body weight, BMI, sub‐scapular skinfold, waist circumference, and the tendencies of being at risk of overweight and overweight. Adolescents whose mothers tended to practice authoritative parenting were 0.70 times likely to be classified as overweight. Maternal nurturing predicted an increased tendency of having BMI in the ‘healthy weight’ category, but maternal control predicted a decreased tendency of having BMI in the same weight category (Table 7). The average of parents' BMI was a positive predictor of adolescents' body weight and BMI.
Table 6.
Regression of physical outcomes on perception of parenting styles and control variables for 13–15‐year‐old adolescents (OLS regression use for body weight, BMI, BMI‐score, sub‐scapular skinfold and waist circumference; logistic regression used for healthy weight and at‐risk of overweight)
| Variables of concern | Predictors | B | β | P‐value | F‐value (P‐value)/LR χ2 (P‐value) odds ratio | Adj. R2/Pseudo R2 |
|---|---|---|---|---|---|---|
| Body weight | MA | −0.01 | −0.27 | <0.01 | 10.91 (<0.0001) | 0.23 (n = 101) |
| Child's age | 0.004 | 0.21 | 0.02 | |||
| Parents' average BMI | 0.03 | 0.34 | <0.01 | |||
| BMI | MA | −0.01 | −0.31 | <0.01 | 14.71 (<0.0001) | 0.22 (n = 101) |
| Parents' average BMI | 0.02 | 0.36 | <0.01 | |||
| BA | −0.003 | −0.20 | 0.03 | 10.34 (<0.0001) | 0.16 (n = 101) | |
| Parents' average BMI | 0.02 | 0.35 | <0.01 | |||
| BMI‐z‐score | MA | −0.57 | −0.28 | <0.01 | 12.58 (<0.0001) | 0.19 (n = 101) |
| Parent' average BMI | 2.39 | 0.35 | <0.01 | |||
| Sub‐scapular skinfold | MA | −0.21 | −0.21 | 0.02 | 6.21 (0.0029) | 0.09 (n = 105) |
| Child's gender | 0.23 | 0.25 | 0.01 | |||
| Waist circumference | MA | −5.54 | −0.22 | 0.02 | 5.19 (0.0247) | 0.04 (n = 106) |
| Healthy weight | MA | 1.55 | 0.40 | <0.01 | 12.54 (0.0004) 3.86 | 0.11 (n = 106) |
| BA | 1.09 | 0.29 | 0.01 | 6.82 (0.0090) 1.26 | 0.06 (n = 106) | |
| At risk of overweight | MA | −1.40 | −0.36 | 0.01 | 7.75 (0.0054) 0.70 | 0.07 (n = 106) |
Control variables included parental age, education and BMI, household income, as well as adolescent's age, gender, ethnicity, activity level and maturity level measured by Tanner development assessment; Child's gender: coded as 1 if an adolescent is girl and 0 otherwise. BMI, body mass index (body weight in kg/height in m2); Healthy weight, BMI at or above the fifth percentile, but less than the 85th percentile; At risk of overweight, BMI at or above the 85th percentile, but less than the 95th percentile from the 2000 CDC Growth Charts; MA, maternal authoritative style; FA, paternal authoritative style; BA, both parents' authoritative style; B, regression coefficient; β, standardized regression coefficient; P‐value, statistical significance for t statistic of each regression estimate; F‐value, overall model fit; Adj. R2, adjusted coefficient of determination; for ‘Healthy weight’ and ‘At risk of overweight’, likelihood ratio chi‐square (LR χ2 ) was calculated to assess overall model fit and Pseudo R2 was used as a substitute for R2 in OLS; OLS, ordinary least squares.
Table 7.
Regression of physical outcomes on perception of parenting style dimensions and control variables for 13–15‐year‐old adolescents (OLS regression for body weight, BMI, BMI‐z‐score, sub‐scapular skinfold, and waist circumference; logistic regression used for healthy weight, at‐risk of overweight, and overweight)
| Variables of concern | Predictors | B | β | P‐value | F‐value (P‐value)/LR χ2 (P‐value) odds ratio | Adj. R2/Pseudo R2 |
|---|---|---|---|---|---|---|
| Body weight | Maternal control | 0.01 | 0.22 | 0.02 | 9.61 (<0.0001) | 0.21 (n = 100) |
| Child's age | 0.004 | 0.23 | 0.01 | |||
| Parents' average BMI | 0.03 | 0.35 | <0.01 | |||
| BMI | Maternal control | 0.01 | 0.26 | 0.01 | 12.05 (<0.0001) | 0.18 (n = 100) |
| Parents' average BMI | 0.02 | 0.36 | <0.01 | |||
| BMI‐z‐score | Maternal control | 0.77 | 0.23 | 0.01 | 10.55 (<0.0001) | 0.16 (n = 100) |
| Parents' average BMI | 2.40 | 0.35 | <0.01 | |||
| Sub‐scapular skinfold | Maternal control | 0.32 | 0.20 | 0.04 | 5.53 (0.0052) | 0.08 (n = 104) |
| Child's gendera | 0.23 | 0.25 | 0.01 | |||
| Waist circumference | Maternal control | 10.20 | 0.25 | 0.01 | 6.60 (0.0116) | 0.05 (n = 105) |
| Healthy weight | Maternal nurturing | 0.45 | 0.25 | 0.03 | 4.66 (0.0309) 1.48 | 0.04 (n = 105) |
| Maternal control | −2.99 | −0.47 | <0.01 | 14.54 (0.0001) 0.49 | 0.13 (n = 105) | |
| At risk of overweight | Maternal control | 1.88 | 0.30 | 0.04 | 4.55 (0.0329) 1.70 | 0.04 (n = 105) |
| Overweight | Maternal control | 2.38 | 0.38 | 0.02 | 5.76 (0.0164) 1.39 | 0.05 (n = 105) |
Control variables included parental age, education and BMI, household income, as well as adolescent's age, gender, ethnicity, activity level and maturity level measured by Tanner development assessment; Child's gender, coded as 1 if an adolescent is girl and 0 otherwise. BMI, body mass index (body weight in kg/height in m2); Healthy weight, BMI at or above the fifth percentile, but less than the 85th percentile; At risk of overweight, BMI at or above the 85th percentile, but less than the 95th percentile; Overweight, at or above the 95th percentile from the 2000 CDC Growth Charts; B, regression coefficient; β, standardized regression coefficient; P‐value, statistical significance for t statistic of each regression estimate; F‐value, overall model fit; Adj. R2, adjusted coefficient of determination; for ‘Healthy weight’, ‘At risk of overweight’ and ‘Overweight’, likelihood ratio chi‐square (LR χ2 ) was calculated to assess overall model fit and Pseudo R2 was used as a substitute for R2 in OLS; OLS, ordinary least squares.
Discussion
This study demonstrated that adolescents' perception of how they are being parented, in terms of both styles and dimensions, directly predicts their body fatness. Also, perceived maternal/paternal parenting dimensions have significant associations with adolescents' energy consumption and intake of certain nutrients. Some of these findings support those studies that have focused on feeding styles instead of general parenting styles. Attention paid to parental feeding styles in an attempt to understand the characteristics of youth's eating behaviours has been growing. Birch (1999) suggested that authoritative feeding style which fosters the development of child's self‐control is assumed to be the most optimal parenting practice in the attempt of prevention of childhood obesity. Earlier research has found that the more parents, particularly mothers, attempted to control the food their children ate, the more likely those children were to be obese and the less frequently they consumed fruits and vegetables (Patrick et al. 2005). One important root of parents' feeding style research is classic parenting style theory. It seems that parenting style and its characteristics are reflected in feeding styles and practices. According to a recent study, authoritarian feeding styles were associated with higher levels of general parental control dimensions including inconsistency and physical punishment, whereas authoritative feeding styles were associated with higher parental responsiveness dimensions such as nurturance and reasoning (Hughes et al. 2005). Moreover, these researchers found that BMI‐z‐scores were lowest in families practicing an authoritarian feeding style. In the present study, maternal control was especially detrimental in terms of predicting adolescents' body fatness, given its positive association with body weight, BMI, sub‐ scapular skinfold, waist circumference and increased tendencies of at risk of overweight and overweight. In contrast, the more authoritative the mothers were, the more likely adolescents were to have a healthy weight as well as other desirable body measurements. These results were anticipated because each of the five sub‐dimensions of maternal control obtained a lower mean score in MA, compared with the scores in MNA (1, 3). Different ages of subjects (preschoolers vs. young adolescents) and differential sub‐dimensions comprising the control dimension may partly attributable to the disparity between the present study and that of Hughes et al. (2005). Also, it has always been clear that parents' actual parenting practices do not fit neatly into one parenting style vs. another. Interestingly, paternal parenting behaviour was not significant in the prediction of adolescents' body fatness in this study. Stein et al. (2005) found that the more accepting the father became, the more the child's (8‐ to 12‐year‐old) percentage overweight decreased (r = −0.40), while other paternal parenting dimensions and any of maternal dimensions appeared to be insignificant. These inconsistent findings between studies may suggest that mothers and fathers may have differential effects on their children during differential developmental phases. However, as is suggested below, fathers' control has effects on dietary intake.
Regression analyses suggest that maternal nurturing may be the most beneficial parenting dimension for adolescents' energy and nutrient intake based on its association with lower consumption of total energy and saturated fat. Paternal nurturing also appeared to be beneficial given its association with lower sodium intake. By contrast, paternal control was associated with lower percentage of kilocalorie from carbohydrate, greater percentage of kilocalorie from total fat, and lower percentage of DRI for dietary fibre. While there has been an increasing concern for excessive carbohydrate consumption, especially soda and soft drinks, a negative association between percentage of kilocalorie from carbohydrate and percentage of kilocalorie from total fat was found in this study. This result, however, partly supports Greene‐Finestone et al. (2005) finding that the low carbohydrate‐density diet resulted in intakes lower in vitamin C and fibre and higher in cholesterol and total fat. Therefore, lower energy intake from carbohydrates may contribute to higher energy consumption from total fat. In the present study, the subjects' dietary intake was not assessed at the food group level or types of carbohydrate/fat sources, except the inclusion of dietary fibre, saturated fat and trans fat. Therefore, the effects of paternal control on both lower percentage of kilocalorie from carbohydrate and greater percentage of kilocalorie from total fat themselves may not provide enough evidence for the judgment of whether paternal control is more detrimental than beneficial. However, greater percentage of kilocalorie from total fat, lower percentage of kilocalorie from carbohydrate, and lower percentage of DRI for dietary fibre, if taken together, can imply that the adolescents tended to consume less dietary fibre when they consumed more fat. Further examination including types of carbohydrate/fat, as well as amounts of those nutrients consumed, may help better interpret the findings related to paternal control and adolescents' dietary intake.
It is of interest that maternal control was positively associated with body fatness indicators. In addition, maternal control was negatively associated with the frequency of snacking of adolescents (Kim 2006), data not shown). It is possible that pathways exist to explain the relationship between maternal control and adolescents' increased body fatness. For example, the regression models, taken together, can lead to a possible scenario in which mothers' intention of keeping their adolescents at a healthy weight status may trigger the mothers to use greater control over their adolescents' food intake as a consequence of snacking. However, maternal control eventually may result in fatter adolescents because maternal control, if taken to an extreme, might lead to adolescents' rebellion, especially in the domain of food intake, such as binge eating and a weight gain‐prone life style, which, in turn, can lead to weight gain and body fatness (Birch & Fisher 2000). Or, it is possible that increased maternal control could be seen as simply a reflection of maternal response to perceived inappropriate weight status of their adolescents. In other words, mothers may utilize their parental power to increase control over their adolescents' life in an attempt to reduce their adolescents' body fatness.
According to Baumrind (1966) the need for parental controls lessen as children grow older in households in which authoritative parenting is the norm. This is because effective authoritative parenting produces children capable of taking responsibility for themselves. Furthermore, some research finds that as children age, parental attempts to control them declines (Robinson et al. 2001; Butler et al. 2007). In contrast, some researchers found parents retain high control as their children develop (Roberts et al. 1984). The present study suggests that parents may need to exert control over their adolescents in certain developmental domains such as eating behaviour and weight status. However, this observation does not mean that parental control is more desirable than parental nurturing in adolescents' health. Rather, the importance of parental nurturing needs to be emphasized, given its beneficial health impacts for adolescents (e.g. lower consumption of saturated fat and decreased tendency of having BMI above normal body weight, and lower sodium intake in relation to maternal and paternal nurturing respectively).
Regression analyses revealed that adolescents' physical activity level and maturity level were not significant (P < 0.05) predictors of variables pertaining to energy and nutrient intake and body measurement. This result might be associated with the fact that the two variables were included in the analyses as dummy variables which could limit the magnitude of effects of physical activity and maturity level on adolescents' dietary intake and their fatness indicators.
The regression coefficients associated with the parenting variables tend to be small in magnitude, representing relatively small changes in biological outcomes. We argue that while these potential effects are small when viewed for a given day, these effects may accumulate over many days, potentially leading to consequential biological changes.
Strengths of this research are that it: (1) examines parenting style rather than parental feeding style; (2) takes into account paternal parenting that has been neglected by almost all previous research; and (3) uses a more extensive scale of parenting behaviours than previously used in the nutrition literature. Nonetheless, several limitations of the study need to be mentioned. First, the present study solely focused on the ‘authoritative’ parenting style, partly, because of the grouping method adopted in the study. Methods that result in a classification of study subjects into various groups in terms of perceived parenting style (e.g. authoritative, authoritarian and permissive) would improve our understanding of how differences in parenting style are associated with adolescents' health outcomes. Second, examination of possible changes in parenting behaviours as children mature from older childhood into early adolescence as well as long‐term health consequences of parenting behaviours were not fully investigated because of the cross‐sectional design of the study. Peer influence in relation to adolescents' health outcomes, lack of data from low income families, a relatively small sample size and lack of sufficient ethnic diversity of the sample are also among the limitations of the present study.
In conclusion, findings of the present study provide some insights into the question of whether perceived parenting style and its relevant dimensions are associated with adolescents' nutritional outcomes, especially energy and nutrient intake and body fatness. The study suggests that greater maternal/paternal nurturing may be beneficial for, but greater paternal control may be detrimental to, young adolescents' energy and nutrient intake. MA and lower maternal control over their adolescents may protect adolescents from overweight. If the findings of this study are substantiated by further studies, health professionals may be able to advise parents about optimal parenting strategies in order to promote a healthful transition into adolescence and to ensure the optimal health status of young adolescents. Overall, the findings of this study should encourage other researchers to broaden the study of relationships between perceived parenting behaviours and adolescents' health‐related behaviours and health outcomes. Further work is needed to investigate how general parenting behaviours are linked to parental food‐specific behaviours directed at their adolescents. In addition, efforts to find significant mediators/moderators of perceived parenting behaviours may reinforce our understanding on possible pathways between parenting behaviours and adolescents' nutritional outcomes.
Conflicts of interest
None declared.
Key messages
-
•
Parents should be encouraged to engage in a greater frequency of nurturing their children.
-
•
Fathers should refrain from over‐control when it comes to their children's eating habits.
-
•
Researchers need to further explore the impact of parental behaviour, particularly food‐related behaviours, on children's health outcomes.
Acknowledgements
The first author thanks Tom Slick Fellowship Foundation for their financial support. The data presented in this paper were drawn from a project funded through a grant from USDA‐ERS‐Food Assistance and Nutrition Research Program, ‘Parental Time, Role Strain, Coping, and Children's Diet and Nutrition’ (43‐3AEM‐0‐80075). The views expressed in this paper do not necessarily reflect those of USDA.
Funding
The research was funded by USDA. We have received no funds in exchange for writing this paper.
References
- Adalbjarnardoyyir S. & Hafsteinsson L.G. (2001) Adolescents' perceived parenting styles and their substance use: concurrent and longitudinal analyses. Journal of Research on Adolescence 11, 401–411. [Google Scholar]
- Adam M.K., Carol H.R., Stephanie M.K., Michele M. & Richard P.T. (2002) Stature and pubertal stage assessment in American boys: the 1988–1994 third national health and nutrition examination survey. Journal of Adolescent Health 30, 205–212. [DOI] [PubMed] [Google Scholar]
- Alexy U., Schultze‐Pawlitschko V., Sichert‐Hellert W. & Kersting M. (2005) Cluster analysis of individuals with similar trends of fat intake during childhood and adolescence: a new approach to analyzing dietary data. Nutrition Research 25, 10–16. [Google Scholar]
- Baumrind D. (1966) The effects of authoritative parental control on child behavior. Child Development 37, 887–907. [Google Scholar]
- Baumrind D. (1967) Childcare practices anteceding three patterns of preschool behavior. Genetic Psychology Monographs 75, 43–88. [PubMed] [Google Scholar]
- Baumrind D. (1968) Authoritarian vs. authoritative parental control. Adolescence 3, 255–271. [Google Scholar]
- Baumrind D. (1989) Rearing competent children. In: Child Development Today and Tomorrow (ed. Damon W.), pp. 349–378. Jossey‐Bass: San Francisco, CA. [Google Scholar]
- Baumrind D. (1991) The influence of parenting style on adolescent competence and substance use. Journal of Early Adolescence 11, 56–95. [Google Scholar]
- Birch L.L. (1999) Development of food preferences. Annual Review of Nutrition 19, 41–62. [DOI] [PubMed] [Google Scholar]
- Birch L.L. & Fisher J.O. (2000) Mother's child‐feeding practices influence daughter's eating and weight. American Journal of Clinical Nutrition 71, 1054–1061. [DOI] [PMC free article] [PubMed] [Google Scholar]
- Black M.M., Papas M.A., Bentley M.E., Cureton P., Saunders A., Le K. et al (2006) Overweight adolescent VQ65 African‐American mothers gain weight in spite of intentions to lose weight. Journal of the American Dietetic Association 106, 80–87. [DOI] [PubMed] [Google Scholar]
- Briefel R.R. & Johnson C.L. (2004) Secular trends in dietary intake in the United States. Annual Review of Nutrition 24, 401–431. [DOI] [PubMed] [Google Scholar]
- Butler J.M., Skinner M., Gelfand D., Borg C.A. & Wiebe D.J. (2007) Maternal parenting style and adjustment in adolescents with Type II diabetes. Journal of Pediatric Psychology 32, 1–11. [DOI] [PubMed] [Google Scholar]
- CDC (2005) A SAS program for the CDC growth charts. Available at: http://www.cdc.gov/nccdphp/dnpa/growthcharts/sas.htm
- Chambers E., Godwin S.L. & Vecchio F.A. (2000) Cognitive strategies for reporting portion sizes using dietary recall procedures. Journal of the American Dietetic Association 100, 891–897. [DOI] [PubMed] [Google Scholar]
- Cohen J., Cohen P., West S.G. & Aiken L.S. (2003) Applied Multiple Regression/Correlation Analysis for the Behavioral Sciences, 3rd edn. Lawrence Erlbaum Associates: Mahwah, NJ. [Google Scholar]
- Crozier S.R., Robinson S.M., Borland S.E., Inskip H.M. & the SWS Study Group (2006) Dietary patterns in the Southampton women's survey. European Journal of Clinical Nutrition 60, 1391–1399. [DOI] [PMC free article] [PubMed] [Google Scholar]
- D'Agostino R.B. & Russell H.K. (2005) Factor Analysis, Second‐Order In: Encyclopedia of Biostatistics. Wiley Interscience, New York, NY. [Google Scholar]
- Darling N. & Toyokawa T. (1997) Construction and validation of the parenting style. Inventory II (PSI‐II) Unpublished manuscript. Penn State University: University Park, PA. [Google Scholar]
- Devereux E.C. Jr, Bronfenbrenner U. & Suci G.J. (1962) Patterns of parent behavior in the United States and the Federal Republic of Germany. International Social Science Journal 14, 488–506. [Google Scholar]
- Enns C.W., Mickle S.J. & Goldman J.D. (2003) Trends in food and nutrient intakes by adolescents in the United States. Family Economics and Nutrition Review 15, 15–27. [Google Scholar]
- Garg R., Levin E., Urajnik D. & Kauppi C. (2005) Parenting style and academic achievement for East Indian and Canadian adolescents. Journal of Comparative Family Studies 36, 653–661. [Google Scholar]
- Golan M. & Crow S. (2004) Parents play key players in the prevention and treatment of weight‐related problems. Nutrition Reviews 62, 39–62. [DOI] [PubMed] [Google Scholar]
- Gorsuch R. (1965) Factor Analysis, 2nd edn. Lawrence Earlbaum: Hillsdale, MI. [Google Scholar]
- Greene‐Finestone L.S., Campbell M.K., Evers S.E. & Gutmanis I.A. (2005) Adolescents' low‐carbohydrate‐density diets are related to poorer dietary intakes. Journal of the American Dietetic Association 105, 1783.e1–1783.e6. [DOI] [PubMed] [Google Scholar]
- Hamilton L.C. (1992) Regression with Graphics: A Second Course in Applied Statistics. Brooks/Cole Publishing Company: Belmont, CA. [Google Scholar]
- Hedley A.A., Ogden C.L., Johnson C.L., Carroll M.D., Curtin L.R. & Flegal K.M. (2004) Prevalence of overweight and obesity among US children, adolescents, and adults, 1999–2002. The Journal of the American Medical Association 291, 2847–2850. [DOI] [PubMed] [Google Scholar]
- Hughes S.O., Power T.G., Orlet Fisher J., Mueller S. & Nicklas T.A. (2005) Revisiting a neglected construct: parenting styles in a child‐feeding context. Appetite 44, 83–92. [DOI] [PubMed] [Google Scholar]
- Institute of Medicine (2004) Dietary Reference Intakes. National Academy Press: Washington DC. [Google Scholar]
- Jackson L.M., Pratt M.W., Hunsberger B. & Pancer S.M. (2005) Optimism as a mediator of the relation between perceived parental authoritativeness and adjustment among adolescents: finding the sunny side of the street. Social Development 14, 273–304. [Google Scholar]
- Kim M.J. (2006) Parenting style and older children's and young adolescents' dietary intake and nutritional status. Dissertation. Texas A&M University: College Station, TX. [Google Scholar]
- Kremers S.P.J., Brug J., De Vries H. & Engels R.C.M.E. (2003) Parenting style and adolescent fruit consumption. Appetite 41, 43–50. [DOI] [PubMed] [Google Scholar]
- Kuczmarski R., Ogden C. & Guo S. (2002) 2000 CDC growth charts for the United States: methods and development. Vital Health Statistics 246, 1–190. [PubMed] [Google Scholar]
- Lazarou E.E. (1998) Peer and parental influences on adolescent body composition, nutrient intake, and food preference. Unpublished MS thesis. Texas A&M University: College Station, TX.
- Lee R.D. & Nieman D.C. (1996) Nutritional Assessment, 2nd edn. McGraw‐Hill: Boston, MA. [Google Scholar]
- Maccoby E.E. & Martin J. (1983) Socialization in the context of the family: parent‐child interaction In: Handbook of Child Psychology 4th edn (eds Mussen P.H. & Hetherington E.M.), pp. 1–101. Wiley: New York, NY. [Google Scholar]
- McIntosh W.A., Davis G., Nayga R. Jr, Anding J., Kubena K., Torres C. et al (2006) Parental time, role conflicts, and obesity‐related outcomes. In: Economic Research Service, USDA. Contractor and Cooperator Report No. (CCR-19). Available at: http://www.ers.usda.gov/Publications/ccr19/ [Google Scholar]
- Malecka‐Tendera E. & Mazur A. (2006) Childhood obesity: a pandemic of the twenty‐first century. International Journal of Obesity 30, S1–S3. [DOI] [PubMed] [Google Scholar]
- NCHS (2005) Anthropometric reference data for children and adults: US population, 1999–2002. National Center for Health Statistics, Centers for Disease Control and Prevention: Atlanta, GA. Available at: http://www.cdc.gov/nchs/data/ad/ad361.pdf [Google Scholar]
- Nawaz H., Chan W., Abdulrahman M., Larson D. & Katz D.L. (2001) Self‐reported weight and height: implications for obesity research. American Journal of Preventive Medicine 20, 294–298. [DOI] [PubMed] [Google Scholar]
- Nesselroade J.R. & Cattell R.B. (1988) Handbook of Multivariate Experimental Psychology. Plenum Press: New York, NY. [Google Scholar]
- Patrick H., Nicklas T.A., Hughes S.O. & Morales M. (2005) The benefits of authoritative feeding style: caregiver feeding styles and children's food consumption patterns. Appetite 44, 243–249. [DOI] [PubMed] [Google Scholar]
- Pett M.A., Lackey N.R. & Sullivan J.J. (2003) Making Sense of Factor Analysis: The Use of Factor Analysis for Instrument Development in Health Care Research. Sage Publications: London. [Google Scholar]
- Regber S. & Marild S. (2005) Parenting styles and treatment of adolescents with obesity. Acta Paediatrica 94 (Suppl. 48), 49. [PubMed] [Google Scholar]
- Roberts G.C., Block J.H. & Block J. (1984) Continuity and change in parents' child‐rearing practices. Child Development 55, 586–597. [Google Scholar]
- Robinson T.N., Kiernan M., Matheson D.M. & Haydel K.F. (2001) Is parental control over children's eating associated with childhood obesity? Results from a population‐based sample of third‐graders. Obesity Research 9, 306–312. [DOI] [PubMed] [Google Scholar]
- Schmitz K.H., Lytle L.A., Phullips G.A., Murray D.M., Birnbaum A.S. & Kubik M.Y. (2002) Psychosocial correlates of physical activity and sedentary leisure habits in young adolescents: the teens eating for energy and nutrition at school study. Preventive Medicine 34, 266–278. [DOI] [PubMed] [Google Scholar]
- Slicker E.K., Picklesimer B.K., Guzak A.K. & Fuller D.K. (2005) The relationship of parenting style to older adolescent life‐skills development in the United States. Young: Nordic Journal of Youth Research 13, 227–237. [Google Scholar]
- Stein R.I., Epstein L.H., Raynor H.A., Kilanowski C.K. & Paluch R.A. (2005) The influence of parenting change on pediatric weight control. Obesity Research 13, 1749–1754. [DOI] [PubMed] [Google Scholar]
- St‐Onge M.P., Keller K.L. & Heymsfield S.B. (2003) Changes in childhood food consumption patterns: a cause for concern in light of increasing body weights. American Journal of Clinical Nutrition 78, 1068–1073. [DOI] [PubMed] [Google Scholar]
- Swallen K.C., Reither E.N., Haas S.A. & Meier A.M. (2005) Overweight, obesity, and health‐related quality of life among adolescents: the national longitudinal study of adolescent health. Pediatrics 115, 340–347. [DOI] [PubMed] [Google Scholar]
- Thurstone L.L. (1947) Multiple Factor Analysis. University of Chicago Press: Chicago, IL. [Google Scholar]
- Towler A.J. & Schneider D.J. (2005) Distinctions among stigmatized groups. Journal of Applied Social Psychology 35, 1–14. [Google Scholar]
- Tramm A.B. (2000) Parenting styles, peer influences, and adolescent cardiovascular disease risk factors. Unpublished MS thesis. Texas A&M University: College Station, TX.
- U.S. Census (2002) Census 2000 Summary File 3 Technical Documentation. U.S. Census Bureau: Washington, DC. [Google Scholar]
- Weaver S. & Prelow H. (2005) A mediated‐moderation model of maternal parenting style, association with deviant peers, and problem behaviors in urban African American and European American adolescents. Journal of Child and Family Studies 14, 343–356. [Google Scholar]