

Abstract
Omega‐3 and omega‐6 fatty acids, particularly docosahexaenoic acid (DHA), are known to play an essential role in the development of the brain and retina. Intakes in pregnancy and early life affect growth and cognitive performance later in childhood. However, total fat intake, alpha‐linolenic acid (ALA) and DHA intakes are often low among pregnant and lactating women, infants and young children in developing countries. As breast milk is one of the best sources of ALA and DHA, breastfed infants are less likely to be at risk of insufficient intakes than those not breastfed. Enhancing intake of ALA through plant food products (soy beans and oil, canola oil, and foods containing these products such as lipid‐based nutrient supplements) has been shown to be feasible. However, because of the low conversion rates of ALA to DHA, it may be more efficient to increase DHA status through increasing fish consumption or DHA fortification, but these approaches may be more costly. In addition, breastfeeding up to 2 years and beyond is recommended to ensure an adequate essential fat intake in early life. Data from developing countries have shown that a higher omega‐3 fatty acid intake or supplementation during pregnancy may result in small improvements in birthweight, length and gestational age based on two randomized controlled trials and one cross‐sectional study. More rigorous randomized controlled trials are needed to confirm this effect. Limited data from developing countries suggest that ALA or DHA supplementation during lactation and in infants may be beneficial for growth and development of young children 6–24 months of age in these settings. These benefits are more pronounced in undernourished children. However, there is no evidence for improvements in growth following omega‐3 fatty acid supplementation in children >2 years of age.
Keywords: essential fatty acids, omega‐3 and omega‐6 fatty acids, growth, development, ALA, DHA, developing countries
Introduction
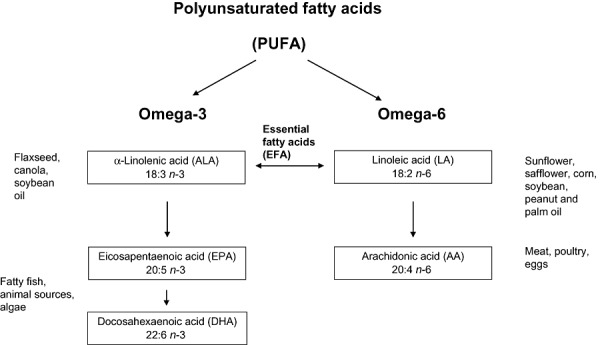
The omega‐3 fatty acid alpha‐linolenic acid (ALA) and the omega‐6 fatty acid linoleic acid (LA) are essential fatty acids (EFAs) as they can not be produced by the human body. Oil/seeds that contain the largest amounts of ALA include flaxseed, walnut, beechnut, butternuts, chia seeds, canola and soy. Oils such as corn, sunflower, palm and peanut oil are high in LA but low in ALA. Meat is also a good source of ALA and LA (Institute of Medicine 2005).
The omega‐6 fatty acid LA can be converted into longer chain metabolites, including arachidonic acid (AA) and the omega‐3 fatty acid ALA can be converted into eicosapentaenoic acid (EPA) and docosahexaenoic acid (DHA) (see Fig. 1 for an overview of this process). However, the conversion rates are low with a range from 1% to 10% (Emken et al. 1994; Salem, Jr. et al. 1999; Vermunt et al. 1999; Pawlosky et al. 2001; Brenna 2002) and may differ depending on common polymorphisms in the fatty acid desaturase (FADS) gene cluster which enables some individuals to form more EPA, DHA and AA from ALA and LA than others (2010a, 2010b). Conversion rates are lower in infants (especially premature infants) than adults and there is accumulating evidence that in early life, precursors are not sufficiently converted to DHA to allow for biochemical and functional normality (Uauy & Castillo 2003; Innis 2007b; Uauy & Dangour 2009).
Figure 1.
Classification of fatty acids.
There is currently no general agreement as to whether EPA + DHA and AA are essential in the diet. Only animal products and algae contain DHA and EPA, and fatty fish (tuna, salmon, fish oils), eggs and algae are good sources. Breast milk contains LA, ALA, DHA and EPA although the amounts depend on the mother's diet and fat stores (Brenna et al. 2007; Peng et al. 2009). Cow's milk contains no DHA or EPA, and is low in ALA and LA. AA can be found in meat, poultry and eggs (Institute of Medicine 2005).
Populations consuming low amounts or no animal foods will depend to a large extent or completely on the synthesis of EPA + DHA and AA by the human body. This situation applies to many people living in developing countries, who cannot afford significant quantities of animal foods. Sufficient intakes of LA and ALA are needed, but when energy (especially fat) intakes are low, LA and ALA would be preferentially used for energy expenditure rather than conversion to AA and EPA + DHA (Food and Nutrition Board 2007). Thus, a combination of low intakes of animal foods, total fat and insufficient energy results in developing country populations being more at risk of inadequate EFA intake.
Furthermore, iron, zinc, vitamin B6 and vitamin E are required for the conversion of ALA and LA to EPA + DHA and AA through their role in elongation enzymes (Smuts et al. 1994). Therefore, it is possible that micronutrient deficient populations may have a lower conversion rate than well‐nourished populations and may therefore have a lower status of EPA + DHA and AA (Smuts et al. 1994).
EFAs (LA and ALA) and their long‐chain derivatives (EPA, DHA and AA) are important for numerous physiological and developmental needs of humans. For example, the brain is composed of large amounts of both DHA and AA. During the third trimester of pregnancy and first year of life, the brain grows rapidly and an adequate supply of both of these fatty acids is thought to be essential for optimal development (Innis 2007a; Hoffman et al. 2009). DHA is also a major component of the retina and thus affects visual acuity (Hoffman et al. 2009). AA and DHA are vital structural elements of cell membranes and, therefore, instrumental in the formation of new tissues. In addition, PUFAs affect growth through their role in synthesis of prostaglandins, growth hormones and biosynthesis of membrane components (Gurr 1992; Root 1992). A clinical deficiency of ALA or LA results in neurological abnormalities and poor growth (Institute of Medicine 2005).
Emerging evidence is suggestive of other possible benefits of omega‐3 fatty acids during pregnancy, including a possible role in prevention of pregnancy complications such as pre‐eclampsia and maternal depression. A prospective study in Pune, India compared pre‐eclamptic women with normotensive women recruited after 35 weeks gestation and found plasma DHA and plasma and RBC total omega‐3 FA levels to be significantly lower in the pre‐eclamptic group, while omega‐6 FA were higher (Mehendale et al. 2008). Observational studies in both developed and developing countries indicate a likely relationship between DHA levels (as measured in breast milk) and postpartum depression, with lower levels of DHA associated with higher rates of postpartum depression (Hibbeln 2002). Maternal depression can impact maternal care‐giving abilities and affect growth through inadequate feeding practices and development through poor interpersonal interactions (Patel et al. 2004).
In addition, there is emerging evidence that omega‐3 fatty acid intakes in pregnancy and early life may play a role in prevention of diseases mediated by eicosanoids (van Eijsden et al. 2008; Hauner et al. 2009). In particular EFA intakes are thought to modify low‐density lipoproteins (LDL) cholesterol concentrations in childhood (Ohlund et al. 2008). Most of the data, however, came from observations in developed countries and in formula fed infants and little is known about the public health relevance of these fatty acids for infants in developing countries, especially those who still receive breast milk.
This paper reviews the literature on omega‐3 and omega‐6 fatty acid intake and status in pregnant and lactating women and infants and young children in developing countries and evaluates the effects of these fatty acids on growth and development of infants and children in these countries. The findings are compared with those of studies in developed countries. A recent supplement to this journal reported on papers presented at a meeting on fatty acids in developing countries (Dewey & Reinhart 2011).
Key messages
-
•
Omega‐3 and omega‐6 fatty acids play an important role in growth and development of infants and young children in developing and emerging countries.
-
•
Overall, intakes of fat and omega‐3 fatty acids appear to be low among many pregnant and lactating women, and non‐breastfed infants. Most complementary foods are low in omega‐3 fatty acids, and thus young children in developing countries are at risk of low intakes.
-
•
Ensuring adequate intakes of fat, essential fatty acids and especially DHA through these life stages is crucial.
-
•
Cost effective dietary sources of these fatty acids and exclusive breastfeeding until 6 months of age, and continued breastfeeding thereafter, in addition to appropriate complementary feeding are needed to ensure adequate essential fatty acid and DHA intakes in these populations.
-
•
Information is severely lacking on essential fatty acid intake and status in developing countries, and data should be collected from large‐scale studies such as the Demographic and Health surveys or other nationally representative samples.
-
•
In addition, more research is required to confirm the beneficial role of these essential fatty acids from diets or from supplements in growth and development of infants and young children in developing countries.
Methods
For identification of studies, we searched the literature databases of Web of Science (Institute for Scientific Information) and PubMed (omega 3 fatty acids OR essential fatty acids OR DHA OR docosahexaenoic acid OR long‐chain polyunsaturated fatty acid OR n‐3 fatty acid OR arachidonic acid OR linolenic acid OR linoleic acid AND child development OR infant development OR child growth OR infant growth). The search was limited to human studies published in English from January 2000 until August 2010. The search first identified meta‐analyses and clinical trials, but was expanded to include other relevant articles (such as observational studies and review articles). Reference lists of the publications found were also searched. From these lists, articles that were conducted in developing countries were selected for inclusion in this review.
We adopted the income definition of developing countries used by The World Bank to include countries in the review. The definition includes all countries having an annual gross national income (GNI) per capita equivalent to US$ 12 195 or less; these countries include low‐income countries (GNI per capita up to US$ 995), lower middle‐income countries (GNI per capita from US$996–$3 945) and upper middle‐income countries (GNI per capita from US$3946 to $12 195) (World Bank 2010).
Recommended fatty acids intake for pregnant, lactating women, infants and children
The minimum intake levels for EFAs to prevent deficiency symptoms are estimated with convincing evidence from human and animal studies at level to be 2.5%E LA plus 0.5%E ALA (FAO 2010). The adequate intake (AI) is a recommended average daily nutrient intake level based on observed or experimentally determined approximations or estimates of nutrient intake by group (or groups) of apparently healthy people who are assumed to be maintaining an adequate nutritional state. Examples of adequate nutritional states include normal growth, maintenance of normal levels of nutrients in plasma and other aspects of nutritional well‐being or general health. When an RDA is not available for a nutrient, the AI can be used as the guide for an individual's intake (Institute of Medicine 2005). An AI for LA of 2–3%E and ALA of >0.5%E is proposed for the general population of adults by Food and Agriculture Organization (FAO), with an acceptable macronutrient distribution range (AMDR) for LA intake of 2.5–9%E and omega‐3 PUFA of 0.5–2%E. For infants 6 to 12 months of and young children 12–24 months of age, an AI for LA range of 3.0–4.5%E is recommended with a (upper) U‐AMDR of <10%E. Similarly for ALA an AI range of 0.4–0.6%E is recommended with (upper) U‐AMDR of <3%E (FAO 2010).
Table 1 gives AI for ALA and LA from FAO (2010) and from the Institute of Medicine (2005). Recommended levels of DHA in pregnancy are shown from FAO (2010) (Brenna & Lapillonne 2009) and the European Consensus Group (Koletzko et al. 2007). For pregnant and lactating women, the minimum intake for fetal and infant development is 300 mg/day EPA + DHA, of which at least 200 mg day−1 should be DHA (FAO 2010). For infants, recommendations for omega‐3 and omega‐6 intakes are based on the composition of human milk, under the provision that after 6 months, human milk meets half of the daily energy needs (FAO 2010).
Table 1.
Recommended dietary intakes for total fat and fatty acids
| Total fat | ALA (AI) | LA (AI) | ALA mg day−1 (AI) | LA g day−1 (AI) | Ratio of LA to ALA | DHA mg day−1 | DHA + EPA (AI) mg day−1 | |
|---|---|---|---|---|---|---|---|---|
| Institute of Medicine 2005 | ||||||||
| 0–6 months | 500 | 4.4 | 5–15:1 | |||||
| 7–12 months | 500 | 4.6 | ||||||
| 1–3 years | 30–40% | 0.6%–1.2%E | 5%–10%E | 700 | 7 | |||
| 4–18 years | 25–35% | 0.6%–1.2%E | 5%–10%E | 900 | 10 | |||
| Pregnancy | 1400 | 13 | ||||||
| Lactation | 1300 | 13 | ||||||
| Adults | 20–35% | 0.6%–1.2%E | 5%–10%E | Varies by age | Varies by age | |||
| FAO (2010) | ||||||||
| 0–6 months | 40–60%E | AI 0.2–0.3%E* | breast milk composition as %E of total fat | AI 0.1–0.18%E* | ||||
| 6–24 months | 35%E | AI 0.4–0.6%E | AI 3.0–4.5%E | AI 10–12 mg kg−1 | ||||
| 2–4 years | 25–35%E | AI ≥ 0.5%E* | AI 2–3 %E** | 100–150 | ||||
| 4–6 years | AI ≥ 0.5%E* | AI 2–3 %E** | 150–200 | |||||
| 6–10 years | AI ≥ 0.5%E* | AI 2–3 %E** | 200–250 | |||||
| Pregnancy/lactation | 20–35%E | ≥0.5%E | 2–3%E | 200 | 300 | |||
| European consensus group (Koletzko et al. 2007) | ||||||||
| Pregnancy | 200 | |||||||
ALA, alpha‐linolenic acid; AI, Adequate intake; DHA, docosahexaenoic acid; LA, linoleic acid; EPA, eicosapentaenoic acid. *Food and Agriculture Organization (FAO 2010) recommendations do not specify ranges for 2–18 years olds, so the adult levels are shown here. *For children 6–24 months of age the estimation of requirements is based on provision of breast milk to meet half of the daily energy needs, the rest of the energy would come from non‐breast milk diet (FAO 2010) †Same as adults, considering pregnant and lactating women's energy intake will increase hence fat and fatty acids in absolute amount will increase as well.
For assessment of the effects of EFAs and omega‐3 fatty acids and child growth and development in developing countries, we divided the literature into four topics:
-
1
Dietary intake and status of total fat, LA, ALA and DHA in pregnancy, lactation, infants and young children in developing countries.
-
2
Fatty acids intake during pregnancy and effects on infant growth and development.
-
3
Fatty acids intake during lactation and effects on infant growth and development.
-
4
Supplementation of infants (0–24 months of age) with fatty acids and effects on growth and development.
-
5
Supplementation of children >2 years of age with fatty acids and effects on growth and development.
Results
Dietary intake and status of total fat, LA, ALA and DHA in pregnancy, lactation, infants and young children in developing countries
Dietary intake of total fat and fatty acids in pregnancy and lactation
A range of 20–35% energy as total fat during pregnancy and lactation has been suggested by FAO (Brenna et al. 2007; FAO). Intake data on total fat in pregnant women were found from six developing countries namely Bangladesh, Burkina Faso, Chile, China, India and Mexico (Table 2). In all these countries, total fat intakes were within the AMDRs in pregnant and lactating women in studies in Chile, China, India and Mexico but not in Bangladesh, Burkina Faso and Sudan. In these countries, pregnant and lactating women consumed diets with only 7.6%E (Yakes 2010), 12.7%E (Huybregts et al. 2009 ) and 18.5 E% (Nyuar et al. 2010) of total fat, respectively.
Table 2.
Mean (standard deviation) Intake of total fat, LA, ALA and DHA intake in pregnant and lactating women
| Countries | Group | Total fat intake (%E) | LA intake (%E) | ALA intake (%E) | DHA intake (mg) |
|---|---|---|---|---|---|
| Recommended FAO (2010) | 20–35%E | 2–3%E | >0.5%E | 200 mg | |
| China (Peng et al. 2009) | Lactating women (inland city) | 38.7 ± 12.2%E | 13 ± 5.1%E | 1.5 ± 0.6%E | 40 ± 60 mg |
| Lactating women (coastal city) | 31.8 ± 12.3%E | 9.4 ± 3.5%E | 1.1 ± 0.5%E | 180 ± 230 mg | |
| Chile (Mardones et al. 2008) | Pregnant women (control group) | 25.6 ± 8.9%E | 6.5 ± 2.7%E | 0.22 ± 0.1%E | |
| Bangladesh* (Yakes 2010) | Lactating women | 7.6 (4.4–11.8)%E | 1.9 (0.9–3.5)%E | 0.3 (0.1–0.5)%E | 30 (10–50) mg |
| Burkina Faso (Huybregts et al. 2009) | Rural pregnant | 12.7%E | NA | NA | NA |
| India† (Muthayya et al. 2009a) | Pregnant women (3rd trimester) | 24.3%E | 6.1 (4.7–8.11)%E | 0.24 (0.2–0.3)%E | 11 (4–19) mg |
| Mexico* (Parra‐Cabrera et al. 2010) | Pregnant women | 25.9%E | 4.9 ± 2.3%E | 0.44 ± 0.2%E | 80 ± 80 mg |
| Sudan (Nyuar et al. 2010) | Lactating women | 18.5 ± 4.4%E | 4.0 ± 1.2%E | 0.5 ± 0.2%E | 33 ± 78 mg |
ALA, alpha‐linolenic acid; DHA, docosahexaenoic acid; FAO, Food and Agriculture Organization; LA, linoleic acid; NA, not available. *Mean (5th−95th percentile); †Median (interquartile range).
In studies in India (Muthayya et al. 2009a), Chile (Mardones et al. 2008), Mexico (Parra‐Cabrera et al. 2010), Sudan (Nyuar et al. 2010), Bangladesh (Yakes 2010), among pregnant or lactating women, mean intakes of ALA just met or were lower than the AI (Table 2). In contrast, LA intakes exceeded the AI in most countries except Bangladesh (Table 2). In Bangladesh, 57% of the women had intakes of LA below the AI and 90% had ALA below the AI (Yakes 2010). The low intake of ALA in certain populations and high intakes of LA compared with the AI may be in part due to consumption of oils in local diets that are high in LA but low in ALA such as corn, safflower, sunflower oil and to some extent peanut, palm kernel and coconut oil (Wolmarans 2009).
The lowest DHA intakes were reported in India in the third trimester of pregnancy at only 11 mg (Muthayya et al. 2009a) and in Bangladesh, DHA intake was only 30 mg per day (Table 2). All reported levels are substantially less than the FAO (Brenna et al. 2007; FAO 2010) recommends and European Consensus (Koletzko et al. 2007) recommended amounts of 200 mg of DHA in pregnancy.
DHA status data in lactation
Breast milk DHA levels are one means of assessing essential fat status in lactating women. Breast milk DHA content has been associated with favourable infant outcomes: Innis (2007c) reports that maternal intakes of DHA ≤ 80 mg day−1 and milk levels <0.2 g DHA/100 g total fatty acids (0.2%) increases the risk of not supporting optimal infant development (Innis 2007c).
The mean concentration of DHA in breast milk is quite variable in developing countries with data. Some developing countries such as Sudan 0.23%E (Nyuar et al. 2010), Nepal 0.23%E (Glew et al. 2001), Bangladesh 0.30%E (Yakes 2010) and Mexico (0.26 ± 0.03) (Yuhas et al. 2006) have reported some of the lower levels of DHA in breast milk whereas Philippines (0.74 ± 0.05), a coastal area of southeastern China (0.61 ± 0.46%E) (Peng et al. 2009), Cuba (0.43 ± 0.26) (Krasevec et al. 2002) and Chile (0.43 ± 0.03) (Yuhas et al. 2006) have reported higher DHA status of breast milk than several developed Western countries (Brenna et al. 2007) other than Japan (Yuhas et al. 2006).
The large range of DHA content in breast milk is thought to reflect mainly the variations in maternal DHA intake, as populations with high fish intakes also have the highest milk DHA content as is seen from a comparison of intakes in a study of women living in an inland (0.38 ± 0.23%E) or coastal area (0.61 ± 0.46%E) of southeastern China (Peng et al. 2009). In Congo where fish intake is high and the usual oil consumed is soy oil, which is rich in ALA (Rocquelin et al. 1998), breast milk contained a higher DHA content (0.15 ± 0.07 vs. 0.08 ± 0.05 g/100 g) than in Burkina Faso, where fish intake is low and the major oil sources are peanut and cotton seed oil, which are both low in ALA (Thiombiano‐Coulibaly et al. 2003).
Overall, more information is needed on fatty acids intake and status in pregnant and lactating women from developing countries. LA intakes were generally higher than the AI in countries where reported except Bangladesh, whereas ALA intake is below the AI in all countries. Mean DHA intakes are less than recommended for optimal fetal development in pregnant women in all studies found. Milk DHA contents in most countries were at the low end, but were greater than 0.2%‐the cutoff associated with suboptimal infant development.
Dietary intake of total fat and fatty acids in infants and children (0–10 years)
Dietary intake data of total fat and individual fatty acids in infants and young children were found in five countries. Total fat intakes in infants and young children in many developing countries, especially in infants who are not breastfed, are lower than the minimum recommended of 35%E at 6–24 months of age (Table 3). In Bangladesh, intakes were extremely low at 19.5%E in breastfed and only 12.7% in non‐breastfed children at 24–35 months of age (Yakes 2010) whereas in children of 1–3 years of age in rural areas from Yunnan Province China, mean fat intake was 24 ± 7%E (Barbarich et al. 2006). In the Gambia, fat intake decreased from 46.2%E at 0–6 months (when most energy came from breast milk) to 34.4%E at 7–11 months, 27.5%E at 12–17 months and only 15%E when breastfeeding had stopped in most children at 24 months (Prentice & Paul 2000). In older children (2–10 years) total fat intake ranged from 24.5% to 29.6%E in Guatemala and South Africa.
Table 3.
Mean (standard deviation) intake of total fat, LA, ALA, DHA in the diet of infants and young children in developing countries
| Countries | Age group | Total fat intake (%E) | LA intake (%E) | ALA intake (%E) | DHA intake (mg) |
|---|---|---|---|---|---|
| IOM (Institute of Medicine) 2005 | 1–3 years | 30–40% | 5–10%E | 0.6–12%E | |
| 4–18 years | 25–35%E | 5–10%E | 0.6–12%E | ||
| FAO 2010 | 6–24 months | At least 35% | 3–4.5%E | 0.4–0.6%E | 100 mg (ages 2–4 years) |
| 2–18 years | 25–35% | 2–3% adults† | ≥0.5% adults† | ||
| Bangladesh* (Yakes 2010) | Breastfed (24–35 months) | 19.5 (10.5–30.1) %E | 3.5 (1.7–6.3) %E | 0.39 (0.19–0.68) %E | 40 (10–80) mg |
| Non‐breastfed (24–35 months) | 12.7 (6.2–21.5)%E | 2.9 (1.3–5.2) %E | 0.42 (0.12–0.74) %E | 10 (0–30) mg | |
| Breastfed (36–48 months | 15.6 (7.8–26.9)%E | 3.1 (1.3–5.8) %E | 0.41 (0.18–0.76) %E | 20 (10–30) mg | |
| Non‐breastfed (36–48 months) | 11.8 (5.8–20.5) %E | 2.8 (1.2–5.4) %E | 0.39 (0.17–0.71) %E | 20 (10–30) mg | |
| China (Yunnan) (Barbarich et al. 2006) | 1–3 years | 24 ± 7%E | 2.9 ± 1.2%E | 0.4 ± 0.3%E | 34 ± 148 mg |
| 4–5 years | 21 ± 7%E | 2.5 ± 1.1%E | 0.4 ± 0.3%E | 23 ± 87 mg | |
| Gambia (Prentice & Paul 2000) | 0–6 months | 46.2%E | 6.0%E | 0.38%E | 108 mg |
| 7–12 months | 34.4%E | 5.4%E | 0.28%E | 87 mg | |
| 12–17 months | 27.5%E | 5.1%E | 0.23%E | 75 mg | |
| 24 months | 15.0%E | 4.6%E | 0.13%E | 10 mg | |
| Guatemala (Bermudez et al. 2010) | 8–10 years (high income) | 29.6 ± 0.42%E | 5.3 ± 0.12%E | 0.5 ± 0.01%E | 32 ± 2 mg |
| 8–10 years (low income) | 28.6 ± 0.53%E | 5.9 ± 0.14%E | 0.5 ± 0.01%E | 32 ± 2 mg | |
| South Africa (Mangaung) (Dannhauser et al. 2000) | 2–3.9 years | 26.2 ± 15.1%E | 6 ± 5.4%E | 0.39 ± 0.5%E | – |
| 4–5.9 years | 24.5 ± 16.4%E | 6.2 ± 5.9%E | 0.27 ± 0.27%E | – |
ALA, alpha‐linolenic acid; DHA, docosahexaenoic acid; FAO, Food and Agriculture Organization; LA, linoleic acid. *Mean (5th−95th percentile). †FAO recommendations do not specify ranges for 2–18‐year‐olds, so the adult levels are shown here.
Mean LA intakes were lower than the AI in Bangladeshi (non‐breast fed) children and Chinese children (1–3 years). In other developing countries with data, children had mean LA intakes in the range of 3.1–6.2%E. Mean ALA intakes were lower than AI in Bangladeshi, Gambian and South African children. In Yunnan, China, ALA intake among children 1–3 years of age for about 50% of children did not meet the AI (Barbarich et al. 2006). In rural Bangladesh, intakes of fatty acids among children 24–35 months of age were only reported in comparison with the Institute of Medicine (IOM) levels, and were approximately half of the IOM AI; 89.8% of these children had intakes of ALA less than the IOM AI of 700 mg day−1 for 1‐ to 3‐year‐old children, and 99.0% had intakes of LA less than the AI of 7 g day−1 for 1–3‐year‐olds. In the Gambia, levels of ALA and DHA intake decreased as the child aged. In Mangaung (South Africa) the mean omega‐6 intake ranged from 5.4% to 6.5%E and omega‐3 ranged from 0.2% to 0.4%E in 2–6‐year‐old children (Dannhauser et al. 2000). Large proportions of 8–10 years old Guatemalan children had normal intakes of LA (5.3 ± 0.12‐ 5.9 ± 0.14%E) in both high and low socioeconomic status whereas ALA intakes (0.5 ± 0.01%E) were low with >97% of all groups consuming less than 1%E from these fats and about 50% consuming less than FAO AI ≥0.5%E. Furthermore, intakes for EPA (8 ± 2−10 ± 2 mg) and DHA (32 ± 2 mg) were very low with no differences between high and low socioeconomic status groups (Bermudez et al. 2010).
In summary, in most developing countries with data available, mean intakes of ALA and DHA are very low and in two out of five countries with data available, mean LA intakes were below the AI.
Fatty acid status data in infants and children
Only two studies reported status data in infants and children from developing countries. Low DHA levels in RBC were reported in Pakistani infants in relation to the low DHA content in maternal milk (Smit et al. 2000). In an intervention study, baseline fatty acids status in 6 month‐old Cambodian and Italian infants were compared. Cambodian infants had lower baseline levels of LA, comparable ALA levels and higher levels of AA + EPA + DHA in blood compared with their Italian counterparts (Agostoni et al. 2007). Subsequent multiple micronutrient supplementation in those Cambodian infants resulted in significantly higher levels of ALA in whole blood samples (0.29 ± 0.31%, 0.22 ± 0.10%, 0.20 ± 0.12% of total fatty acids) and LA (15.36 ± 4.02%, 14.45 ± 2.90%, 13.87 ± 2.45% of total fatty acids) at 18 months of age, compared with infants in the other intervention groups who received only iron–folic acid or placebo, respectively.
Fatty acids intake during pregnancy and effects on infant growth and development
There is a strong positive correlation of EFAs and AA + DHA serum concentrations of newborn babies and their mothers. The relative (per kilogram of body weight) status is higher in newborns than in mothers, suggesting a strong fetal and neonatal preference and need for these fatty acids. In preterm neonates, DHA status is positively related to parameters of fetal growth, such as birthweight, head circumference and birth length.
We found five studies from developing countries on the relationship between intake of fatty acids during pregnancy and growth and development outcomes of the offspring. Two of these studies were cross‐sectional studies (Parra‐Cabrera et al. 2008; Muthayya et al. 2009a) and three were randomized controlled trials (RCTs; Tofail et al. 2006; Mardones et al. 2008; Ramakrishnan et al., 2010) (Table 4). A significant positive correlation between EPA/DHA intake and birthweight was shown in a study in India. The study from India (Muthayya et al. 2009a) (Table 4), reported a significantly increased adjusted odds ratio of risk of low birthweight for women whose fish intake was in the lowest tertile in third trimester compared with those in the highest tertile but no difference in gestational duration. In the intervention study in low‐income women in Chile (Mardones et al. 2008), increases in birthweight (65 g) and birth length (0.37 cm) were observed after ∼30 weeks supplementation. However, compared with the control group, these women also received a higher dose of micronutrients together with omega‐3 fatty acids, which may have contributed to the effect. On‐treatment analysis in the study in Chile, found even higher birthweight (118 g), birth length (0.57 cm) and head circumference (0.20 cm) in women in the intervention group compared with women in the control group. In addition, women in the intervention group also had decreases in very preterm deliveries (2.1% vs. 0.4%, P = 0.02) and marginal decreases in pre‐eclampsia (3.4% vs. 1.6%, P = 0.083) compared with control women. The national food distribution program for low‐income pregnant women in Chile now includes milk fortified with ALA. In Mexico Ramakrishnan et al. (Ramakrishnan et al., 2010) assessed the impact of DHA supplementation (400 mg day−1) during pregnancy on infant growth and development through a randomized controlled intervention trial. Overall, no effect was found on growth outcomes; however, among a subgroup of primiparas, birthweight significantly increased by 99.4 g and length by 0.5 cm among supplemented women.
Table 4.
Overview of studies on effect of omega‐3 and omega‐6 fatty acids in pregnant women on growth and development of infants
| Reference | Location | N | Supplementation to mothers | Functional measurements: age at assessment | Outcomes | Comments | |
|---|---|---|---|---|---|---|---|
| Period | Dose day−1 | ||||||
| Cross‐sectional studies | |||||||
| (Muthayya et al. 2009a) | India | 676 | Birthweight | No significant association between DHA status of mother with birthweight. | Fish consumption above the median was 9 g day−1. | ||
| Women not consuming fish had a higher risk of LBW infant compared to women consuming > median in third trimester | |||||||
| (Parra‐Cabrera et al. 2008) | Mexico | 76 | 15 months | ALA intake = 1.26 to 1.35 mg day–1; DHA intake = 0.11 mg (intake from FFQ) | Brainstem auditory‐evoked potentials (BAEP) | AA and not DHA intake significantly related to BAEP | FFQ based on consumption in last year and converted to g of food |
| Randomized controlled trials | |||||||
| (Mardones et al. 2008) | Chile | 552 | Enrolment to delivery (appr. 8 months) | C = milk powder + with low MMN | Birthweight, length, GA | 65.4 g difference in birthweight, 95% confidence interval 5–126 g; P = 0.03) and the incidence of very preterm birth (34 weeks) was lower (0.4% vs. 2.1%; P = 0.03). | The intervention group also had higher quantity of MMN |
| I = fortified with high MMN & EFAs 0.9 g ALA and 4.4 g of LA per 100 g | |||||||
| (Tofail et al. 2006) | Bangladesh | 249 | Wk 25 to delivery | I: 1200 mg DHA + 1800 mg EPA | BSID: 10 months | No effects on development. No effects on birthweight, birth length, or head circumference* | Effect on DHA status in mother or infant has not been determined |
| C: 2250 mg LA + 270 mg ALA | |||||||
| (Ramakrishnan et al. 2010) | Mexico | 1040 | Wk 18–22 to delivery | I: 400 mg DHA | Birthweight, birth length, head circumference | No effects on growth, but positive effects on birthweight and head circumference in subgroup of supplemented primigravidae | Outcomes on cognition not yet published |
| C: corn soy oil | VEP, BAEP, visual attention, Bayley | ||||||
I, intervention group; C, control group; DHA, docosahexaenoic acid; EPA, eicosapentaenoic acid; LA, linoleic acid; DPA, docosapentaenoic acid; VEP, visual evoked potential; HM, human milk; ERG, electroretinography; EEG, electroencephalogram; FT, Fagan Test of Infant Intelligence, IQ, intelligence quotient; K‐ABC, Kaufman Assessment Battery for Children; BSID, Bayley Scales of Infant Development; MPS, means–end problem solving; MACDI, MacArthur Communicative Development Inventories; TAC, Teller Acuity Card procedure; GGM, Gesell Gross Motor; CLAMS, Clinical Linguistic and Auditory Milestone Scale; CAT, Clinical Adaptive Test; PDI, Psychomotor Development Index; ND, not determined; MMN, multiple micronutrients; GA, gestational age; FFQ, Food frequency questionnaire; ALA, alpha‐linolenic acid; BAEP, brain stem auditory‐evoked potentials. *Birth outcomes were not main outcomes of this follow‐up study. These data were reported in baseline table of Tofail et al. 2006.
However, an intervention trial in Bangladesh did not show an impact of fish‐oil supplementation on birthweight (Tofail et al. 2006) and similarly, in Mexico no impact of DHA supplementation on birthweight was observed in the general population (Ramakrishnan et al. 2010).
Impact of DHA or DHA + EPA intakes or supplementation of pregnant women on developmental outcomes of the offspring were reported by only one observational study from Mexico (Parra‐Cabrera et al. 2008) and one randomized controlled intervention trial in Bangladesh (Tofail et al. 2006). Higher intakes of AA but not DHA were associated with improvements on brainstem auditory‐evoked potentials in infants in Mexico (Parra‐Cabrera et al. 2008), whereas no effects were found on infant development in Bangladesh following supplementation of their mothers during pregnancy (Tofail et al. 2006).
In summary, data from three out of five studies from developing countries suggest that a higher EPA/DHA intake or ALA supplementation during pregnancy may result in small improvements in birthweight and length, and gestational duration. Only two studies evaluated the impact on developmental outcomes with mixed results.
In contrast, a number of observational studies in developed countries show a significant positive association of fish consumption during pregnancy and birthweight (Olsen et al. 1993; van Eijsden et al. 2008) and visual and cognitive development of term infants and children (Daniels et al. 2004; Oken et al. 2005; Hibbeln et al. 2007). Also, RCTs from developed countries have shown that supplementation with DHA/EPA during pregnancy results in a modest increase in head circumference at birth (Szajewska et al. 2006) but not in birthweight and length. Moreover, a recent review of RCTs on omega‐3 fatty acids supplementation in pregnant and lactating women, infants and children concluded that there is limited but suggestive evidence for a beneficial effect on visual development, and mental development and longer‐term cognition in infants (Eilander et al. 2007).
To conclude, data from developing countries suggest that ALA or EPA + DHA intake/supplementation during pregnancy may improve birth length and weight and gestational age, but more rigorous RCTs would be needed to confirm this effect. The data from developing countries for developmental outcomes is currently too limited to draw a firm conclusion.
Fatty acid intake during lactation and effects on infant growth and development
Only three cross‐sectional studies were found on breast milk levels of omega‐3 fatty acids and functional outcomes in infants (Table 5). An observational study from Brazil in preterm infants found that breast milk total omega‐3 fatty acids were positively associated with growth in children (Tinoco et al. 2009). Krasevec et al. found no relationship between breast milk DHA with visual acuity or growth in Cuban infants perhaps because DHA in breast milk was higher than found in many developed countries and the teller acuity cards may not have been sensitive enough to detect differences in visual acuity (Krasevec et al. 2002). Rocquelin et al. (2003) found that breast milk fatty acids were significantly associated with weight of infants in Congo but not in Burkina Faso (Rocquelin et al. 2003). The amounts of both ALA and DHA in breast milk in the Congo were twice that seen in Burkina Faso.
Table 5.
Overview of studies on effect of omega‐3 and omega‐6 fatty acids in lactating women on growth and development of infants
| Reference | Location | N | Supplementation to mothers | Functional measurements: age at assessment | Outcomes | Comments | |
|---|---|---|---|---|---|---|---|
| Period | Dose day−1 | ||||||
| Cross‐sectional studies | |||||||
| (Krasevec et al. 2002) | Cuba | 56 | Amount of EFA in breast milk (ALA = 0.92% and DHA = 0.43%) | Visual acuity: 2 months | No associations between infant or maternal FA status and visual acuity | ||
| (Rocquelin et al. 2003) | Congo + Burkina Faso | 102 + 101 | Amount of EFA in breast milk | Weight: 5 months | Breast milk LA/ALA was significantly associated with weight gain in Congo only | LA/ALA ratio was 12:1 in Congo (340 mg ALA) and 53:1 in Burkina Faso (150 mg ALA) | |
| Congo (ALA = 0.35% and DHA = 0.15%) | |||||||
| Burkina Faso (ALA = 0.15% and DHA = 0.08%) | |||||||
| (Tinoco et al. 2009) | Brazil | 37 (pre‐term infants) | Until 6 months of gestational age | Breast milk | Height (cm), weight (g) and head circumference (cm) | Total n‐3 PUFA was positively associated with weight gain (P = 0.05), height (P = 0.04) and body mass index of children (P = 0.05). | |
ALA, alpha‐linolenic acid; DHA, docosahexaenoic acid; EFA, essential fatty acid; FAO, Food and Agriculture Organization; LA, linoleic acid; ALA, alpha‐linolenic acid; PUFA, polyunsaturate fatty acids.
Studies in developed countries showed impacts of DHA supplementation in breastfeeding mothers on cognitive outcome (Jensen et al. 2005) and visual acuity of their infants (Innis 2007a). Three RCTs have assessed the effect of supplementing lactating mothers with DHA, on cognitive development of their children (Gibson et al. 1997; Jensen et al. 2005; Helland et al. 2008). These three studies found positive outcomes on cognition among children in the supplemented group compared with control. However, in one study, which included supplementation during pregnancy and lactation, these beneficial outcomes did not sustain in a longer‐term follow‐up at 7 years of age (Helland et al. 2008).
In conclusion, limited data from developing and developed countries suggest that DHA concentration in breast milk or DHA supplementation during lactation might be linked to improved infant growth and psychomotor and cognitive development.
Supplementation of infants (0–24 months of age) with fatty acids and effects on growth and development
Five intervention studies were found in infants measuring growth and development outcomes (Table 6). Four studies (Unay et al. 2004; Adu‐Afarwuah et al. 2007; El‐khayat et al. 2007; Chen et al. 2010) showed positive effects of fatty acid interventions on growth and/or development, although in one of these studies (in China) (Chen et al. 2010), this effect could also have been attributed to the additional micronutrients provided. In contrast, another study in China (Ben et al. 2004) did not find a significant difference in growth or development. Adu‐Afarwuah reported improvements in growth and motor development in Ghanaian infants (6–12 months) in the intervention group with a fat‐based spread (Adu‐Afarwuah et al. 2007). This fat‐based spread provided LA (1.29 g/20 g) and ALA (0.29 g/20 g) whereas no effects on growth were observed in the other two intervention groups that only provided micronutrients. The authors speculated that other than energy, the different effects on growth could be explained by a significantly greater plasma ALA concentration in the fat‐based spread group (Adu‐Afarwuah et al. 2007) and perhaps the addition of milk in the spread. For development (motor milestone), all interventions showed improvement with greater improvements in the fat‐based spread compared with control.
Table 6.
Overview of studies on effect of omega‐3 and omega‐6 fatty acids and growth and development of children 0–2 years of age
| Reference | Location | N | Subjects | Supplementation | Functional measurements: age of assessment | Outcomes | Comments | |
|---|---|---|---|---|---|---|---|---|
| Period | Dose (% of total fatty acids) | |||||||
| Cross‐sectional studies | ||||||||
| Randomized controlled trials | ||||||||
| (Ben et al. 2004) | China | 245 | Term infants | Birth until 6 months | F1: 0.18% AA + 0.18% DHA | BSID: 3, 6 months | No significant differences for growth and development between the four feeding groups | Mixed feeding, i.e. breast milk + supplemented formula group showed best growth in the first 3 months |
| F2: no LCPUFA | ||||||||
| F3: Breast milk | ||||||||
| F4: Breast milk + F1 | ||||||||
| (El‐khayat et al. 2007) | Pakistan | 42 + 15 | PEM infants Control healthy children | 8 weeks | PUFA supplemented vs. control group on nutritional rehabilitation according to WHO guidelines | Mental development index (MDI), PDI scores of BSID‐II | Positive correlations between plasma AA and DHA levels and both MDI and PDI scores | |
| (Adu‐Afarwuah et al. 2007) | Ghana | 298 | Infants | 6 months | Nutributter® with 108 kcal and 19 vitamins and mineral and LA 1.29 (g) | Anthropometric measurements | NB group had a significantly greater weight‐for‐age z‐score (WAZ) (−0.49 vs. −0.65) and length‐for‐age z‐score (LAZ) (−0.20 vs. −0.38) than did the NT group and the NT and SP groups combined | Nutri tabs and Sprinkles® did not provide any energy |
| ALA = 0.29 (g) vs. Sprinkles® (6 vit & min) and nutri tab (16 vit & min) | ||||||||
| (Unay et al. 2004) | Turkey | 80 | Healthy infants | Birth to 16 weeks | F1: 0.5% DHA | BAEP: 1, 16 weeks | Positive: more rapidly maturation of auditory brainstem at 16 weeks in F1 than F2 | |
| F2: no DHA | ||||||||
| (Chen et al., 2010; Wang et al., 2007) | China | 1478 | Children 4–24 months. | RCT C = unfortified rice flour, | DQ, Motor dev, WAZ | I group had less of a decrease in than the control group in LAZ (effect size of ∼0.17). Cognitive and motor development at 24 months significantly higher in I group | ||
| I = fortified soy flour | ||||||||
| LA = 1000 mg, | ||||||||
| ALA = 131 mg, | ||||||||
| Both intervention and control group were isocaloric (40 kcal). Intervention group contains 4.1 mg zinc, calcium 385 mg,vitamin B2 0.2 mg, vitamin D 7 µg | ||||||||
F, formula; AA, arachidonic acid; ALA, alpha‐linolenic acid DHA; BSID, Bayley scales of infant development; PEM, Protein energy malnutrition; WHO, World Health Organisation; PUFA, Polyunsaturated fatty acids; LCPUFA, long chain polyunsaturated fatty acids; MDI, Mental Development Index; PDI, Psychomotor Development Index; LA, linoleic acid; NB, Nutributter®; NT, Nutritab; SP, Sprinkles®; BAEP, brainstem auditory‐evoked potentials; RCT, randomised control trial; I, intervention group; C, control group; DHA, docosahexaenoic acid; DQ, Development quotient; WAZ, weight‐for‐age z scores; LAZ, length‐for‐age z scores.
A study from Pakistan in protein energy malnourished infants (11.28+/−4.59 months) showed essential fat supplementation to positively impact both plasma AA and DHA levels as well as mental development index and psychomotor development index scores (El‐khayat et al. 2007). An RCT in Turkey found improvements in brainstem auditory evoked potentials in breastfed new born healthy infants and those receiving infant formula with DHA compared with those receiving infant formula without DHA (Unay et al. 2004).
A study in China found improvements in motor development and growth among children 4–12 months of age in the study group receiving fortified whole fat soybean flour (high in ALA and fortified with five additional micronutrients) compared with unfortified rice flour (Chen et al. 2010).
Another study from China compared infants from four feeding groups: (1) AA + DHA supplemented formula; (2) standard formula; (3) breast milk; and (4) breast milk + supplemented formula. No significant differences were found for growth and development between the four feeding groups (Ben et al. 2004).
Overall, four out of five studies among infants and young children from developing countries showed improved growth and/or visual or motor development after supplementation with EFAs and DHA + AA. However, in two of these studies (Chen et al. 2010; Adu‐Afarwuah et al. 2008), the beneficial effects may have been in part due to the additional micronutrients or protein that were provided together with the ALA.
Studies from developed countries have also reported positive effects of essential fat supplementation on visual acuity (Birch et al. 2002; Hoffman et al. 2003) and cognitive development in infants (Agostoni et al. 1995; Drover et al. 2009). A review from 2005 showed no effect of dietary ALA enrichment on term infant growth except at 12 months of age where infants consuming ALA‐enriched formula were heavier and longer compared with control infants (Udell et al. 2005). On the other hand, no beneficial effects of DHA + AA supplementation of formula‐milk on the physical (weight, length, head circumference), visual and neurodevelopmental outcomes of infants born at term were found in a number of meta‐analyses of well‐conducted RCTS from developed countries (Lapillonne & Carlson 2001; Makrides et al. 2005; Rosenfeld et al. 2009). Moreover, a recent Cochrane review on DHA + AA supplementation in term infants failed to demonstrate effects on vision, various aspects of cognitive development or physical growth (Simmer et al. 2008). It is suggested that high dose (100 mg DHA plus 200 mg AA) and prolonged duration (preferably 12 months) of supplementation to assess the effect of DHA + AA on cognitive development are more likely to yield positive results.
Overall, limited data from developing countries suggest that ALA or DHA supplementation is beneficial for infant's growth and development in these settings. These benefits are more pronounced in undernourished children and apparently healthy children from low socioeconomic status where indications are that intake of fatty acids at this age may be low (Smit et al. 2004).
Supplementation of children >2 years of age with fatty acids and effects on growth and development
Only three studies in older children (6–10 years) have been conducted in developing countries and are listed in Table 7. The 3 studies showed no effects on growth following fish flour spread rich in EPA + DHA in South African children (Dalton et al. 2009) and EPA/DHA supplementation in school‐age children from Indonesia and India (Osendarp et al. 2007; Muthayya et al. 2009b). These three studies also measured cognitive development outcomes. Only one study (Dalton et al. 2005) showed improvement of verbal learning ability and memory of children when supplemented with a fish‐flour spread rich in EPA + DHA whereas the other two studies (Osendarp et al. 2007; Muthayya et al. 2009b) showed no effect on cognition after EPA/DHA supplementation.
Table 7.
Overview of studies on effect of omega‐3 and omega‐6 fatty acids and growth and development of children >2 years of age
| Reference | Location | N | Age | Duration | Intervention | Measurements | Outcomes | Comments |
|---|---|---|---|---|---|---|---|---|
| Randomized controlled trials | ||||||||
| Nemo study group (Osendarp et al. 2007) | Indonesia | 384 | 6‐ to 10‐year‐old children | 6 day week−1 for 12 months | I: 88 mg DHA + 22 mg EPA | Height, weight, WISC‐III, | No effects on growth and cognition | |
| C: none | NEPSY, WAIS, RAVLT, WIAT: baseline, 6 months, 12 months | |||||||
| (Muthayya et al. 2009b) | India | 598 | 6‐ to 10‐year‐old children | 6 day week−1 for 12 months | I: 900 mg ALA + 100 mg DHA | Height, weight, MUAC | No effects on growth and cognition | No control group receiving no omega‐3 FA was included |
| C: 140 mg ALA | K‐ABC, WISC‐III, RAVLT, NEPSY, Number Cancellation Tests: baseline, 6 months, 12 months | |||||||
| (Dalton et al. 2005) | South Africa | 183 | 7‐ to 9‐year‐old children | 7 day week−1 for 6 months | I: Fish flour containing 335 mg ALA + 82 mg EPA + 192 mg DHA + 1567 mg LA + 23 mg AA | Height, weight, HVLT, reading, spelling tests: baseline, 6 months | No effects on growth, positive effect of fish flour on HVLT | Fish flour may also have contained other nutrients (e.g. iodine) that may have contributed to the effect |
| C: Bread flour containing 84 mg ALA + 15 mg EPA + 36 mg DHA + 2511 mg LA + 7 mg AA | ||||||||
I, intervention group; C, control group; DHA, docosahexaenoic acid; EPA, eicosapentaenoic acid; HVLT, Hopkins Verbal Learning Test; MUAC, mid‐upper arm circumference; WISC, Wechsler Intelligence Scales for children; NEPSY, Neuropsychological Assessment tool; WAIS, Wechsler Adult Intelligence Scale; RAVLT, Rey Auditory Verbal Learning Test; ALA, alpha‐linoleic acid; FA, Fatty acid; K‐ABC, Kaufman Assessment Battery for children.
Five RCTs in healthy children from developed countries have assessed the effect of EPA and DHA on cognitive function and one of them has also measured effects on growth. One study was conducted in preschool children aged 4 years (Ryan & Nelson 2008) and the others in children aged 6–10 years (Osendarp et al. 2007; Kennedy et al. 2009; Kirby et al. 2010; McNamara et al. 2010). Based on results of these five trials, there is little evidence for a beneficial effect of EPA + DHA on growth and cognitive function in older children.
In conclusion, three studies in developing countries suggest that there is no evidence for improvements in growth following omega‐3 fatty acid supplementation in children >2 years of age. This is consistent with the findings of studies conducted in developed countries. For cognitive development, supplementation with lower dosages of ∼100 mg EPA/DHA seemed not effective in older children from developing countries.
Discussion
Data summarized in this review suggest that omega‐3 fatty acids, and DHA in particular, during pregnancy, lactation and early life, may have significant benefits for infant growth and development in developing countries. However, limited available dietary intake data suggest low intakes of omega‐3 fatty acids compared with the AI are common among young children, especially those who are no longer breastfed, and among pregnant and breastfeeding women. In part this is due to lower total intakes of fat and additionally, due to low intakes of foods high in omega‐3 fatty acids, including animal products and certain oils (soy, canola).
Limited data from pregnancy trials in developing countries suggest that supplementation or increased intakes of DHA + EPA or DHA only during pregnancy may result in small benefits in birth outcomes such as weight and length, and gestational age. These findings are not in agreement with overall evidence from RCT in developed countries, although, some observational studies from developed countries also observed positive associations between omega‐3 intakes and birth outcomes similar to developing countries.
Positive birth outcomes after omega‐3 fatty acid interventions, although observed in only a limited number of studies, may be related to the role of omega‐3 fatty acids in cell growth and multiplication (Innis 2005), thus exerting a positive effect on weight and length of the fetus and infant. Evidence is further emerging that prenatal EFAs may be involved in programming of later health and development (van Eijsden et al. 2008). Currently, evidence from a limited number of studies suggest an association between maternal omega‐6 and omega‐3 fatty acid status and birthweight, length and body composition (Micallef et al. 2009) of the child during early infancy. It has been hypothesized that high omega‐6 to omega‐3 status raises tissue AA, which increases prostacyclin production and, in turn, stimulates signaling pathways implicated in adipogenesis. However, more research is needed to determine how these fatty acids influence body size and body composition of fetuses and infants.
Omega‐3 fatty acids, in particular, DHA, are also known to play an essential role in the development of the brain and retina. Observational studies from developed countries suggested positive associations or effects of DHA status or omega‐3 fatty acid supplementation during pregnancy on improved infant development outcomes. However, only two studies from developing countries assessed effects of omega‐3 fatty acids on infant development and results were mixed. RCTs are needed to confirm these benefits in developing countries using validated methods to assess development in these settings.
Based on the limited number of studies from developing countries, our review suggests the results about the relationship between enhanced DHA concentration of breast milk during lactation and infant growth, psychomotor and cognitive development were mixed. Unfortunately, information from intervention trials with DHA supplementation during lactation is lacking from developing countries, and therefore the causality of this association cannot yet be confirmed. Given the importance of breast milk in the EFA and DHA intakes of the infant during the period of exclusive breastfeeding and beyond, such studies are urgently needed.
The large variability in breast milk fatty acid content may complicate the interpretation of findings from these studies. Reviews have shown that the omega‐3 content and especially DHA content of breast milk varied significantly among lactating women from developing countries. In some countries such as Pakistan, India and rural South Africa, lactating women had very low DHA intake or breast milk content whereas women in the Philippines, Congo and Cuba had high DHA content of breast milk. There are several factors responsible for this large range of breast milk DHA: firstly, higher intakes from amount consumed from fatty fish are associated with higher maternal DHA status (Otto et al. 2000; Food and Nutrition Board 2007). Secondly, the variability in breast milk DHA may be related to variations in the amount of DHA synthesized in the body, and variability in status of nutrients required for DHA synthesis. Thirdly, the conversion also depends on the polymorphism in the fatty acid desatur (FADS) gene cluster, and therefore some individuals have a higher biosynthesis rate than others (2010a, 2010b). Lastly, for indicators of EFA status, there are many significant measurement issues as there are no established ‘gold standard’ methods for assessment, and each study uses different assessment methods potentially leading to large variation.
A review of studies in infants and children up to 24 months of age, omega‐6 and/or omega‐3 fatty acid supplementation was found to improve growth and/or visual or motor development in developing countries, which is in contrast to findings from meta‐analysis (including well‐conducted RCTS) not showing beneficial effects of supplementation in infants from developed countries (Simmer et al. 2008). These differential effects of supplementation, despite a seemingly similar EFA status, could be due to: (1) overall lower total fat and micronutrient intakes in the diet and complementary foods in the populations studied; (2) an overall disadvantaged nutritional status in the populations studied (Smit et al. 2004; El‐khayat et al. 2007; Tinoco et al. 2009); and (3) higher infection load leading to higher EFA needs and requirements in infants from developing countries. Furthermore, micronutrient deficiencies may contribute to impaired EFA bioavailability and metabolism (Smit et al. 2004), and supplementation with multiple micronutrients (iron, folic acid, zinc and vitamins) was associated with an increase of LA and a‐linolenic acid levels in infants (Agostoni et al. 2007).
Fatty acid supplementation showed improvement in cognition or development in infants from developing countries. These benefits were more pronounced in undernourished children and apparently healthy children from low socioeconomic status. Malnourished infants and children are known to have lower development scores compared with healthy subjects (Grantham‐McGregor 1995) and nutritional interventions, such as supplementation with omega‐3 fatty acids, may therefore more likely result in improved development scores in poorly nourished populations as has been shown in studies from Pakistan (El‐khayat et al. 2007). The importance of providing an appropriate supply of omega‐3 and omega‐6 fatty acids, especially DHA and AA, is likely to be relevant in early childhood in these settings because both fatty acids continue to accumulate most rapidly in brain gray matter during the first 2 years of life (Martinez 1992).
In older children above 2 years of age, no benefits of omega‐3 fatty acids were observed on growth or cognition in studies from developing countries, which is line with findings from developed countries (Osendarp et al. 2007; Kennedy et al. 2009; Kirby et al. 2010; McNamara et al. 2010).
Fatty acid intake and status, and in particular omega‐3 and DHA status, in infants and children from developing countries varied from lower or similar or even higher when children relied on breast milk compared with the fatty acid status of infants from developed countries (Agostoni et al. 2007). However, when children increasingly eat other foods, and correspondingly breast milk intake is reduced, diets of young children in developing countries consequently become too low in fat and omega‐3 fatty acids.
Recommendations
Overall, the findings from this review suggest a critical window of opportunity for adequate EFA intake, and in particular ALA and DHA, intakes during pregnancy, lactation and the period of complementary feeding, stressing the importance of these fatty acids for vulnerable populations in developing countries.
Ensuring AIs of fat and especially omega‐3 fatty acids, through foods high in these nutrients is needed among mothers and children in developing countries to meet current recommendations. Foods made from soy oil, full‐fat soy flour and animal products are good sources of ALA. Promotion of exclusive breastfeeding and continued breastfeeding after 6 months of age and increased intake of fatty fish or algae or supplementation/fortification will increase DHA and EPA intake. This may be more desirable than increasing ALA intake, especially when energy intakes are low, because additional ALA intake would be preferentially used for energy expenditure rather than conversion to EPA and DHA. However, currently costs of DHA‐enriched foods or supplements are much higher than foods naturally high in ALA, which could limit the impact of such interventions.
Exclusive breastfeeding until 6 months of age, and continued breastfeeding should continue thereafter until 2 years and beyond. Improving access to foods high in omega‐3 fatty acids to improve complementary feeding is needed to ensure adequate EFA and omega‐3 intakes in these populations.
Funding
Funding for this paper came from the Global Alliance for Improved Nutrition (GAIN).
Conflicts of interest
RKH, AE, SJMO are employees of Unilever. Unilever markets food products made of vegetable oils, including margarines and dressings.
Acknowledgements
We would like to thank Zhenyu Yang and Elizabeth Zehner for their help with the collection and review of papers used in this paper, and Mary Arimond for extensive comments on earlier drafts.
References
- Adu‐Afarwuah S., Lartey A., Brown K.H., Zlotkin S., Briend A. & Dewey K.G. (2007) Randomized comparison of 3 types of micronutrient supplements for home fortification of complementary foods in Ghana: effects on growth and motor development. The American Journal of Clinical Nutrition 86, 412–420. [DOI] [PubMed] [Google Scholar]
- Adu‐Afarwuah S., Lartey A., Brown K.H., Zlotkin S., Briend A. & Dewey K.G. (2008) Home fortification of complementary foods with micronutrient supplements is well accepted and has positive effects on infant iron status in Ghana. American Journal of Clinical Nutrition 87 (4), 929–938. [DOI] [PubMed] [Google Scholar]
- Agostoni C., Giovannini M., Sala D., Usuelli M., Livio L., Francescato G. et al (2007) Double‐blind, placebo‐controlled trial comparing effects of supplementation of two micronutrient sprinkles on fatty acid status in Cambodian infants. Journal of Pediatric Gastroenterology and Nutrition 44, 136–142. [DOI] [PubMed] [Google Scholar]
- Agostoni C., Trojan S., Bellu R., Riva E. & Giovannini M. (1995) Neurodevelopmental quotient of healthy term infants at 4 months and feeding practice: the role of long‐chain polyunsaturated fatty acids. Pediatric Research 38, 262–266. [DOI] [PubMed] [Google Scholar]
- Barbarich B.N., Willows N.D., Wang L. & Clandinin M.T. (2006) Polyunsaturated fatty acids and anthropometric indices of children in rural China. European Journal of Clinical Nutrition 60, 1100–1107. [DOI] [PubMed] [Google Scholar]
- Ben X.M., Zhou X.Y., Zhao W.H., Yu W.L., Pan W., Zhang W.L. et al (2004) Growth and Development of term infants fed with milk with long chain polyunsaturated fatty acid supplementation. Chinese Medical Journal 117, 1268–1270, 1–15. [PubMed] [Google Scholar]
- Bermudez O.I., Toher C., Montenegro‐Bethancourt G., Vossenaar M., Mathias P., Doak C. et al (2010) Dietary intakes and food sources of fat and fatty acids in Guatemalan schoolchildren: a cross‐sectional study. Nutrition Journal 9, 20. [DOI] [PMC free article] [PubMed] [Google Scholar]
- Birch E.E., Hoffman D.R., Castaneda Y.S., Fawcett S.L., Birch D.G. & Uauy R.D. (2002) A randomized controlled trial of long‐chain polyunsaturated fatty acid supplementation of formula in term infants after weaning at 6 weeks of age. The American Journal of Clinical Nutrition 75, 570–580. [DOI] [PubMed] [Google Scholar]
- Brenna J.T. (2002) Efficiency of conversion of alpha‐linolenic acid to long chain n‐3 fatty acids in man. Current Opinion in Clinical Nutrition and Metabolic Care 5, 127–132. [DOI] [PubMed] [Google Scholar]
- Brenna J.T. & Lapillonne A. (2009) Background paper on fat and fatty acid requirements during pregnancy and lactation. Annals of Nutrition & Metabolism 55, 97–122. [DOI] [PubMed] [Google Scholar]
- Brenna J.T., Varamini B., Jensen R.G., ersen‐Schade D.A., Boettcher J.A. & Arterburn L.M. (2007) Docosahexaenoic and arachidonic acid concentrations in human breast milk worldwide. The American Journal of Clinical Nutrition 85, 1457–1464. [DOI] [PubMed] [Google Scholar]
- Chen C.M., Wang Y.Y. & Chang S.Y. (2010) Effect of in‐home fortification of complementary feeding on intellectual development of Chinese children. Biomed Environ mental Science 23 (2), 83–91. [DOI] [PubMed] [Google Scholar]
- Dalton A., Smuts C.M., Witthuhn R., Wolmarans P. & Benade A. (2005) The effect of an omega 3 fatty acid‐rich spread on the cognitive function of children. S111.
- Dalton A., Wolmarans P., Witthuhn R.C., van Stuijvenberg M.E., Swanevelder S.A. & Smuts C.M. (2009) A randomised control trial in schoolchildren showed improvement in cognitive function after consuming a bread spread, containing fish flour from a marine source. Prostaglandins, Leukotrienes, and Essential Fatty Acids 80, 143–149. [DOI] [PubMed] [Google Scholar]
- Daniels J.L., Longnecker M.P., Rowland A.S. & Golding J. (2004) Fish intake during pregnancy and early cognitive development of offspring. Epidemiol 15, 394–402. [DOI] [PubMed] [Google Scholar]
- Dannhauser A., Bester C., Joubert G., Badenhorst P., Slabber M., Badenhorst A. et al (2000) Nutritional status of preschool children in informal settlement areas near Bloemfontein, South Africa. Public Health Nutrition 3, 303–312. [DOI] [PubMed] [Google Scholar]
- Dewey K.G. & Reinhart G. (2011) Fatty acid status in early life in low income countries, determinants and consequences. Maternal & Child Nutrition 7 (Suppl. 2), 1. [DOI] [PMC free article] [PubMed] [Google Scholar]
- Drover J., Hoffman D.R., Castaneda Y.S., Morale S.E. & Birch E.E. (2009) Three randomized controlled trials of early long‐chain polyunsaturated Fatty Acid supplementation on means‐end problem solving in 9‐month‐olds. Child Development 80, 1376–1384. [DOI] [PMC free article] [PubMed] [Google Scholar]
- Eilander A., Hundscheid D.C., Osendarp S.J., Transler C. & Zock P.L. (2007) Effects of n‐3 long chain polyunsaturated fatty acid supplementation on visual and cognitive development throughout childhood: a review of human studies. Prostaglandins, Leukotrienes, and Essential Fatty Acids 76, 189–203. [DOI] [PubMed] [Google Scholar]
- El‐khayat H., Shaaban S., Emam E.K. & Elwakkad A. (2007) Cognitive functions in protein‐energy malnutrition: in relation to long chain‐polyunsaturated fatty acids. Pakistan Journal of Biological Sciences 10, 1773–1781. [DOI] [PubMed] [Google Scholar]
- Emken E.A., Adlof R.O. & Gulley R.M. (1994) Dietary linoleic acid influences desaturation and acylation of deuterium‐labeled linoleic and linolenic acids in young adult males. Biochimica et Biophysica Acta 1213, 277–288. [DOI] [PubMed] [Google Scholar]
- FAO , Fats and Fatty acids in Human Nutrition, Report on an expert consultation. FAO Food Nutrition Paper 91, Rome, 2010. Available at http://foris.fao.org/preview/25553-0ece4cb94ac52f9a25af77ca5cf6a7a8c.pdf (Accessed August 4 2011). [PubMed]
- Food and Nutrition Board (2007) Analysis of the balancing of benefits and risks of seafood consumption In: Seafood choices: balancing benefits and risks (eds Nesheim M.C. & Yaktine A.L.), pp 195–216. National Academies Press: Washington, DC. [Google Scholar]
- Gibson R.A., Neumann M.A. & Makrides M. (1997) Effect of increasing breast milk docosahexaenoic acid on plasma and erythrocyte phospholipid fatty acids and neural indices of exclusively breast fed infants. European Journal of Clinical Nutrition 51, 578–584. [DOI] [PubMed] [Google Scholar]
- Glew R.H., Huang Y.S., Vander Jagt T.A., Chuang L.T., Bhatt S.K., Magnussen M.A. & Vander Jagt D.J. (2001) Fatty acid composition of the millc lipids of Nepalese women: correlation between fatty acid composition of serum phospholipidsand melting point. Prostaglandins, Leukotrienes and Essential Fatty Acids 65 (3), 147–156. [DOI] [PubMed] [Google Scholar]
- Grantham‐McGregor S. (1995) A review of studies of the effect of severe malnutrition on mental development. The Journal of Nutrition 125, 2233S–2238S. [DOI] [PubMed] [Google Scholar]
- Gurr M.I. (1992) Role of fats in food and nutrition, 2nd edn, Elsevier applied sciences: London, UK. [Google Scholar]
- Hauner H., Vollhardt C., Schneider K.T., Zimmermann A., Schuster T. & mann‐Gassner U. (2009) The impact of nutritional fatty acids during pregnancy and lactation on early human adipose tissue development. Rationale and design of the INFAT study. Annals of Nutrition & Metabolism 54, 97–103. [DOI] [PubMed] [Google Scholar]
- Helland I.B., Smith L., Blomen B., Saarem K., Saugstad O.D. & Drevon C.A. (2008) Effect of supplementing pregnant and lactating mothers with n‐3 very‐long‐chain fatty acids on children's IQ and body mass index at 7 years of age. Pediatrics 122, e472–e479. [DOI] [PubMed] [Google Scholar]
- Hibbeln J.R. (2002) Seafood consumption, the DHA content of mothers' milk and prevalence rates of postpartum depression: a cross‐national, ecological analysis. Journal of Affective Disorders 69, 15–29. [DOI] [PubMed] [Google Scholar]
- Hibbeln J.R., Davis J.M., Steer C., Emmett P., Rogers I., Williams C. et al (2007) Maternal seafood consumption in pregnancy and neurodevelopmental outcomes in childhood (ALSPAC study): an observational cohort study. The Lancet 369, 578–585. [DOI] [PubMed] [Google Scholar]
- Hoffman D.R., Birch E.E., Castaneda Y.S., Fawcett S.L., Wheaton D.H., Birch D.G. et al (2003) Visual function in breast‐fed term infants weaned to formula with or without long‐chain polyunsaturates at 4 to 6 months: A randomized clinical trial. The Journal of Pediatrics 142, 669–677. [DOI] [PubMed] [Google Scholar]
- Hoffman D.R., Boettcher J.A. & ersen‐Schade D.A. (2009) Toward optimizing vision and cognition in term infants by dietary docosahexaenoic and arachidonic acid supplementation: a review of randomized controlled trials. Prostaglandins, Leukotrienes, and Essential Fatty Acids 81, 151–158. [DOI] [PubMed] [Google Scholar]
- Huybregts L.F., Roberfroid D.A., Kolsteren P.W. & Van Camp J.H. (2009) Dietary behaviour, food and nutrient intake of pregnant women in a rural community in Burkina Faso. Maternal & Child Nutrition 5, 211–222. [DOI] [PMC free article] [PubMed] [Google Scholar]
- Innis S.M. (2005) Essential fatty acid transfer and fetal development. Placenta 26 (Suppl. A), S70–S75. [DOI] [PubMed] [Google Scholar]
- Innis S.M. (2007a) Dietary (n‐3) fatty acids and brain development. The Journal of Nutrition 137, 855–859. [DOI] [PubMed] [Google Scholar]
- Innis S.M. (2007b) Fatty acids and early human development. Early Human Development 83, 761–766. [DOI] [PubMed] [Google Scholar]
- Innis S.M. (2007c) Human milk: maternal dietary lipids and infant development. The Proceedings of the Nutrition Society 66, 397–404. [DOI] [PubMed] [Google Scholar]
- Institute of Medicine (2005) Dietary Fat: total fat and fatty acids In: Dietary Reference intakes for energy, carbohydrates, fiber, fat, fatty acids, cholesterol, protein and amino acids (eds Otten J.J., Hellwig J.P. & Meyers L.D.), pp 1324–1325. The National Academies Press: Washington, D.C. [Google Scholar]
- Jensen C.L., Voigt R.G., Prager T.C., Zou Y.L., Fraley J.K., Rozelle J.C. et al (2005) Effects of maternal docosahexaenoic acid intake on visual function and neurodevelopment in breastfed term infants. The American Journal of Clinical Nutrition 82, 125–132. [DOI] [PubMed] [Google Scholar]
- Kennedy D.O., Jackson P.A., Elliott J.M., Scholey A.B., Robertson B.C., Greer J. et al (2009) Cognitive and mood effects of 8 weeks' supplementation with 400 mg or 1000 mg of the omega‐3 essential fatty acid docosahexaenoic acid (DHA) in healthy children aged 10–12 years. Nutritional Neuroscience 12, 48–56. [DOI] [PubMed] [Google Scholar]
- Kirby A., Woodward A., Jackson S., Wang Y. & Crawford M.A. (2010) A double‐blind, placebo‐controlled study investigating the effects of omega‐3 supplementation in children aged 8–10 years from a mainstream school population. Research in Developmental Disabilities 31, 718–730. [DOI] [PubMed] [Google Scholar]
- Koletzko B., Cetin I. & Brenna J.T. (2007) Dietary fat intakes for pregnant and lactating women. The British Journal of Nutrition 98, 873–877. [DOI] [PubMed] [Google Scholar]
- Krasevec J.M., Jones P.J., Cabrera‐Hernandez A., Mayer D.L. & Connor W.E. (2002) Maternal and infant essential fatty acid status in Havana, Cuba. The American Journal of Clinical Nutrition 76, 834–844. [DOI] [PubMed] [Google Scholar]
- Lapillonne A. & Carlson S.E. (2001) Polyunsaturated fatty acids and infant growth. Lipids 36, 901–911. [DOI] [PubMed] [Google Scholar]
- Lattka E., Illig T., Heinrich J. & Koletzko B. (2010a) Do FADS genotypes enhance our knowledge about fatty acid related phenotypes? Clin Nutr 29, 277–287. [DOI] [PubMed] [Google Scholar]
- Lattka E., Illig T., Koletzko B. & Heinrich J. (2010b) Genetic variants of the FADS1 FADS2 gene cluster as related to essential fatty acid metabolism. Current Opinion in Lipidology 21, 64–69. [DOI] [PubMed] [Google Scholar]
- Makrides M., Gibson R.A., Udell T. & Ried K. (2005) Supplementation of infant formula with long‐chain polyunsaturated fatty acids does not influence the growth of term infants. The American Journal of Clinical Nutrition 81, 1094–1101. [DOI] [PubMed] [Google Scholar]
- Mardones F., Urrutia M.T., Villarroel L., Rioseco A., Castillo O., Rozowski J. et al (2008) Effects of a dairy product fortified with multiple micronutrients and omega‐3 fatty acids on birth weight and gestation duration in pregnant Chilean women. Public Health Nutrition 11, 30–40. [DOI] [PubMed] [Google Scholar]
- Martinez M. (1992) Tissue levels of polyunsaturated fatty acids during early human development. The Journal of Pediatrics 120, S129–S138. [DOI] [PubMed] [Google Scholar]
- McNamara R.K., Able J., Jandacek R., Rider T., Tso P., Eliassen J.C. et al (2010) Docosahexaenoic acid supplementation increases prefrontal cortex activation during sustained attention in healthy boys: a placebo‐controlled, dose‐ranging, functional magnetic resonance imaging study. The American Journal of Clinical Nutrition 91, 1060–1067. [DOI] [PMC free article] [PubMed] [Google Scholar]
- Mehendale S., Kilari A., Dangat K., Taralekar V., Mahadik S. & Joshi S. (2008) Fatty acids, antioxidants, and oxidative stress in pre‐eclampsia. International Journal of Gynaecology and Obstetrics 100, 234–238. [DOI] [PubMed] [Google Scholar]
- Micallef M., Munro I., Phang M. & Garg M. (2009) Plasma n‐3 polyunsaturated fatty acids are negatively associated with obesity. The British Journal of Nutrition 102, 1370–1374. [DOI] [PubMed] [Google Scholar]
- Muthayya S., Dwarkanath P., Thomas T., Ramprakash S., Mehra R., Mhaskar A. et al (2009a) The effect of fish and omega‐3 LCPUFA intake on low birth weight in Indian pregnant women. European Journal of Clinical Nutrition 63, 340–346. [DOI] [PubMed] [Google Scholar]
- Muthayya S., Eilander A., Transler C., Thomas T., van der Knaap H.C., Srinivasan K. et al (2009b) Effect of fortification with multiple micronutrients and n‐3 fatty acids on growth and cognitive performance in Indian schoolchildren: the CHAMPION (Children's Health and Mental Performance Influenced by Optimal Nutrition) Study. The American Journal of Clinical Nutrition 89, 1766–1775. [DOI] [PubMed] [Google Scholar]
- Nyuar K.B., Min Y., Ghebremeskel K., Khalil A.K., Elbashir M.I. & Cawford M.A. (2010) Milk of Northern Sudanese mothers whose traditional diet is high in carbohydrate contains low docosahexaenoic acid. Acta Paediatrica 99 (12), 1824–1827. [DOI] [PubMed] [Google Scholar]
- Ohlund I., Hornell A., Lind T. & Hernell O. (2008) Dietary fat in infancy should be more focused on quality than on quantity. European Journal of Clinical Nutrition 62, 1058–1064. [DOI] [PubMed] [Google Scholar]
- Oken E., Wright R.O., Kleinman K.P., Bellinger D., Amarasiriwardena C.J., Hu H. et al (2005) Maternal fish consumption, hair mercury, and infant cognition in a U.S. Cohort. Environmental Health Perspectives 113, 1376–1380. [DOI] [PMC free article] [PubMed] [Google Scholar]
- Olsen S.F., Grandjean P., Weihe P. & Videro T. (1993) Frequency of seafood intake in pregnancy as a determinant of birth weight: evidence for a dose dependent relationship. Journal of Epidemiology and Community Health 47, 436–440. [DOI] [PMC free article] [PubMed] [Google Scholar]
- Osendarp S.J., Baghurst K.I., Bryan J., Calvaresi E., Hughes D., Hussaini M. et al (2007) Effect of a 12‐mo micronutrient intervention on learning and memory in well‐nourished and marginally nourished school‐aged children: 2 parallel, randomized, placebo‐controlled studies in Australia and Indonesia. The American Journal of Clinical Nutrition 86, 1082–1093. [DOI] [PubMed] [Google Scholar]
- Otto S.J., van Houwelingen A.C. & Hornstra G. (2000) The effect of supplementation with docosahexaenoic and arachidonic acid derived from single cell oils on plasma and erythrocyte fatty acids of pregnant women in the second trimester. Prostaglandins, Leukotrienes, and Essential Fatty Acids 63, 323–328. [DOI] [PubMed] [Google Scholar]
- Parra‐Cabrera S., Moreno‐Macias H., Mendez‐Ramirez I., Schnaas L. & Romieu I. (2008) Maternal dietary omega fatty acid intake and auditory brainstem‐evoked potentials in Mexican infants born at term: cluster analysis. Early Human Development 84, 51–57. [DOI] [PubMed] [Google Scholar]
- Parra‐Cabrera S., Stein D.A., Wang M., Martorell R., Rivera J. & Ramakrishnan U. (2010) Dietary intakes of polyunsaturated fatty acids among pregnant Mexican women. Maternal and Child Nutrition 7 (2), 140–147. [DOI] [PMC free article] [PubMed] [Google Scholar]
- Patel V., Araya R. & Bolton P. (2004) Editorial: Treating depression in the developing world. Tropical Medicine & International Health 9, 539–541. Article first published online: 29 APR 2004. DOI: 10.1111/j.1365‐3156.2004.01243.x. [DOI] [PubMed] [Google Scholar]
- Pawlosky R.J., Hibbeln J.R., Novotny J.A. & Salem N., Jr (2001) Physiological compartmental analysis of alpha‐linolenic acid metabolism in adult humans. Journal of Lipid Research 42, 1257–1265. [PubMed] [Google Scholar]
- Peng Y., Zhou T., Wang Q., Liu P., Zhang T., Zetterstrom R. et al (2009) Fatty acid composition of diet, cord blood and breast milk in Chinese mothers with different dietary habits. Prostaglandins, Leukotrienes, and Essential Fatty Acids 81, 325–330. [DOI] [PubMed] [Google Scholar]
- Prentice A.M. & Paul A.A. (2000) Fat and energy needs of children in developing countries. The American Journal of Clinical Nutrition 72, 1253S–1265S. [DOI] [PubMed] [Google Scholar]
- Ramakrishnan U., Stein A.D., Parra‐Cabrera S., Wang M., Imhoff‐Kunsch B., Juarez‐Marquez S. et al (2010) Effects of docosahexaenoic acid supplementation during pregnancy on gestational age and size at birth: randomized, double‐blind, placebo‐controlled trial in Mexico. Food Nutr Bull 31, S108–S116. [DOI] [PubMed] [Google Scholar]
- Rocquelin G., Tapsoba S., Dop M.C., Mbemba F., Traissac P. & Martin‐Prevel Y. (1998) Lipid content and essential fatty acid (EFA) composition of mature Congolese breast milk are influenced by mothers' nutritional status: impact on infants' EFA supply. European Journal of Clinical Nutrition 52, 164–171. [DOI] [PubMed] [Google Scholar]
- Rocquelin G., Tapsoba S., Kiffer J. & Eymard‐Duvernay S. (2003) Human milk fatty acids and growth of infants in Brazzaville (The Congo) and Ouagadougou (Burkina Faso). Public Health Nutrition 6, 241–248. [DOI] [PubMed] [Google Scholar]
- Root A.W. (1992) Mechanisms of hormone action: general principles In: Clinical Pediatric Endocrinology (ed. Hung W.), pp 1–12. Mosby‐Year Book: St. Louis. [Google Scholar]
- Rosenfeld E., Beyerlein A., Hadders‐Algra M., Kennedy K., Singhal A., Fewtrell M. et al (2009) IPD meta‐analysis shows no effect of LC‐PUFA supplementation on infant growth at 18 months. Acta Paediatrica 98, 91–97. [DOI] [PubMed] [Google Scholar]
- Ryan A.S. & Nelson E.B. (2008) Assessing the effect of docosahexaenoic acid on cognitive functions in healthy, preschool children: a randomized, placebo‐controlled, double‐blind study. Clinical Pediatrics 47, 355–362. [DOI] [PubMed] [Google Scholar]
- Salem N., Jr , Pawlosky R., Wegher B. & Hibbeln J. (1999) In vivo conversion of linoleic acid to arachidonic acid in human adults. Prostaglandins, Leukotrienes, and Essential Fatty Acids 60, 407–410. [DOI] [PubMed] [Google Scholar]
- Simmer K., Patole S.K. & Rao S.C. (2008) Longchain polyunsaturated fatty acid supplementation in infants born at term. Cochrane Database of Systematic Reviews 9 (3), 1–66. [DOI] [PubMed] [Google Scholar]
- Smit E.N., Muskiet F.A. & Boersma E.R. (2004) The possible role of essential fatty acids in the pathophysiology of malnutrition: a review. Prostaglandins, Leukotrienes, and Essential Fatty Acids 71, 241–250. [DOI] [PubMed] [Google Scholar]
- Smit E.N., Oelen E.A., Seerat E., Muskiet F.A. & Boersma E.R. (2000) Breast milk docosahexaenoic acid (DHA) correlates with DHA status of malnourished infants. Archives of Disease in Childhood 82, 493–494. [DOI] [PMC free article] [PubMed] [Google Scholar]
- Smuts C.M., Tichelaar H.Y., Vanjaarsveld P.J., Badenhorst C.J., Kruger M., Laubscher R. et al (1994) The effect of iron fortification on the fatty‐acid composition of plasma and erythrocyte‐membranes in primary‐school children with and without iron‐deficiency. Prostaglandins, Leukotrienes, and Essential Fatty Acids 51, 277–285. [DOI] [PubMed] [Google Scholar]
- Szajewska H., Horvath A. & Koletzko B. (2006) Effect of n‐3 long‐chain polyunsaturated fatty acid supplementation of women with low‐risk pregnancies on pregnancy outcomes and growth measures at birth: a meta‐analysis of randomized controlled trials. The American Journal of Clinical Nutrition 83, 1337–1344. [DOI] [PubMed] [Google Scholar]
- Thiombiano‐Coulibaly N., Rocquelin G., Eymard‐Duvernay S., Kiffer‐Nunes J., Tapsoba S. & Traore S.A. (2003) Seasonal and environmental effects on breast milk fatty acids in Burkina Faso and the need to improve the omega 3 PUFA content. Acta Paediatrica 92, 1388–1393. [PubMed] [Google Scholar]
- Tinoco S.M., Sichieri R., Setta C.L., Moura A.S. & Carmo M.G. (2009) n‐3 polyunsaturated fatty acids in milk is associate to weight gain and growth in premature infants. Lipids in Health and Disease 26, 8–23. [DOI] [PMC free article] [PubMed] [Google Scholar]
- Tofail F., Kabir I., Hamadani J.D., Chowdhury F., Yesmin S., Mehreen F. et al (2006) Supplementation of fish‐oil and soy‐oil during pregnancy and psychomotor development of infants. Journal of Health, Population, and Nutrition 24, 48–56. [PubMed] [Google Scholar]
- Uauy R. & Dangour A.D. (2009) Fat and fatty acid requirements and recommendations for infants of 0–2 years and children of 2–18 years. Annals of Nutrition & Metabolism 55, 76–96. [DOI] [PubMed] [Google Scholar]
- Uauy R. & Castillo C. (2003) Lipid requirements of infants: Implications for nutrient composition of fortified complementary foods. The Journal of Nutrition 133, 2962S–2972S. [DOI] [PubMed] [Google Scholar]
- Udell T., Gibson R.A. & Makrides M. (2005) The effect of alpha‐linolenic acid and linoleic acid on the growth and development of formula‐fed infants: A systematic review and meta‐analysis of randomized controlled trials. Lipids 40, 1–11. [DOI] [PubMed] [Google Scholar]
- Unay B., Sarici S.U., Ulas U.H., Akin R., Alpay F. & Gokcay E. (2004) Nutritional effects on auditory brainstem maturation in healthy term infants. Archives of Disease in Childhood. Fetal and Neonatal Edition 89, F177–F179. [DOI] [PMC free article] [PubMed] [Google Scholar]
- van Eijsden M., Hornstra G., van der Wal M.F., Vrijkotte T.G. & Bonsel G.J. (2008) Maternal n‐3, n‐6, and trans fatty acid profile early in pregnancy and term birth weight: a prospective cohort study. The American Journal of Clinical Nutrition 87, 887–895. [DOI] [PubMed] [Google Scholar]
- Vermunt S.H., Mensink R.P., Simonis A.M. & Hornstra G. (1999) Effects of age and dietary n‐3 fatty acids on the metabolism of [13C]‐alpha‐linolenic acid. Lipids 34 (Suppl.), S127. [DOI] [PubMed] [Google Scholar]
- Wang Y., Chen C., Wang F. & Wang K. (2007) Effects of nutrient fortified complements food supplements on growth of Chinese infants and young children in poor rural area in Gansu Province. Wei Sheng Yan Jiu 36 (1), 78–81. [PubMed] [Google Scholar]
- Wolmarans P. (2009) Background paper on global trends in food production, intake and composition. Annals of Nutrition & Metabolism 55, 244–272. [DOI] [PubMed] [Google Scholar]
- World Bank (2010) The World Bank. Classification of economies Available at: http://data.worldbank.org/about/country-classifications (Accessed August 4 2011).
- Yakes E.A. (2010) Polyunsaturated Fatty Acid Intake and Status of Breast Fed and Non‐Breast Fed Bangladeshi Children 24–47 Months of Age. PhD, Dissertation., University of California Davis.
- Yuhas R., Pramuk K. & Lien E.L. (2006) Human milk fatty acid composition from nine countries varies most in DHA. Lipids 41, 851–858. [DOI] [PubMed] [Google Scholar]