

Abstract
Fatty acid concentrations in blood are potential biomarkers of dietary fat intake, but methodological studies among children are scarce. The large number of fatty acids and their complex interrelationships pose a special challenge in research on fatty acids. Our target was to assess the interrelationships between the total fatty acid profiles in diet and serum of young children. The study subjects were healthy control children from the birth cohort of the Type 1 Diabetes Prediction and Prevention Study. A 3‐day food record and a frozen serum sample were available from 135 children at the age of 1 year, from 133 at 2 years, and from 92 at 3 years. The relationship between dietary and serum fatty acid profiles was analysed using canonical correlation analysis. The consumption of fatty milk correlated positively with serum fatty acids, pentadecanoic acid, palmitic acid and conjugated linoleic acid (CLA) at all ages. Correlations between dietary and serum eicosapentaenoic and/or docosahexaenoic acid were observed at 2 and 3 years of age. Serum linoleic acid was positively associated with the consumption of infant formula at the age of 1 year, and with the consumption of vegetable margarine at 2 and 3 years. The results indicate a high quality of the 3‐day food records kept by parents and other caretakers of the children, and suitability of non‐fasting, un‐fractioned serum samples for total fatty acid analyses. The correlation between intake of milk fat and serum proportion of CLA is a novel finding.
Keywords: child, diet, fatty acids, food, infant, serum
Introduction
Fatty acid levels in blood are promising biomarkers of dietary fat intake (Hunter 1998). Polyunsaturated n‐6 and n‐3, trans and odd‐numbered saturated fatty acids are proposed as the most optimal biomarkers among fatty acids (Baylin & Campos 2006). However, the correlation between polyunsaturated fatty acids in diet and tissues may be weakened by desaturation, elongation and other metabolic processes (Andersen et al. 1999). Even‐numbered saturated fatty acids and monounsaturated fatty acids may not be valid biomarkers because of endogenous synthesis, the relatively small range of intake in habitual diets and wide intra‐individual variation in intake (Baylin & Campos 2006).
Among adult populations, dietary intake and serum or plasma concentrations of fatty acids were compared in a number of studies (De Backer et al. 1989; von Houwelingen et al. 1989; Iso et al. 1989; Lopes et al. 1991; Renaud et al. 1991; Bonaa et al. 1992; Ma et al. 1995; Nikkari et al. 1995; Hjartaker et al. 1997; Andersen et al. 1999; Smedman et al. 1999; Amiano et al. 2001; Kobayashi et al. 2001; Wolk et al. 2001; Kuriki et al. 2003; Baylin et al. 2005; Philibert et al. 2006; Sun et al. 2007), and empirical equations have been developed to relate the fatty acid composition in diet to that of plasma lipids (Lands et al. 1992). However, research among children is scarce. Type of fat spread and milk, measured with a short questionnaire, were associated with serum fatty acid composition among 8‐year‐old boys (Nikkari et al. 1995). Correlations of food consumption and dietary fatty acid intake with serum fatty acid composition were reported among 3–18‐year‐old (Moilanen et al. 1985) and 9–24‐year‐ old children and youths (Moilanen et al. 1992). Diet was assessed by 48 h recall interview in these two studies. Type of infant formula consumed and serum fatty acid composition were associated among 7‐month‐old children (Salo et al. 1997).
The large number of fatty acids and their complex interrelationships are challenges in methodological research in which dietary and tissue fatty acid profiles are compared. Typical approaches in previous studies using serum or plasma were: (1) to focus on a few specific fatty acids or food groups (Nikkari et al. 1983; Moilanen et al. 1985; De Backer et al. 1989; von Houwelingen et al. 1989; Iso et al. 1989; Lopes et al. 1991; Bonaa et al. 1992; Vatten et al. 1993; Ma et al. 1995; Hjartaker et al. 1997; Salo et al. 1997; Smedman et al. 1999; Amiano et al. 2001; Wolk et al. 2001; Philibert et al. 2006); (2) to analyse aggregated fatty acid variables (Renaud et al. 1991; Moilanen et al. 1992; Nikkari et al. 1995); and (3) to present bivariate correlations between values for single fatty acids in diet and in blood (Andersen et al. 1999; Kobayashi et al. 2001; Kuriki et al. 2003; Baylin et al. 2005; Sun et al. 2007). Cross tabulations of specific fatty acids in diet with other fatty acids in serum or plasma, and vice versa, were presented in a few studies (Ma et al. 1995), but most often for only some selected fatty acids (von Houwelingen et al. 1989; Lopes et al. 1991; Wolk et al. 2001). Considering the complex interdependencies between the separate fatty acid entities, both in intake and in tissue concentrations, these analytical choices often leave the data underexploited.
In the present study, our target was to assess the agreement between the total fatty acid profiles in diet and serum of young children. For this we employed canonical correlation analysis (CCA), which is a method for representing the relationships between two groups of variables. CCA is not widely used within nutrition research, and, to the best of our knowledge, it has not been previously used in methodological studies on fatty acids.
Key messages
-
•
High consumption of fatty milk was associated with high serum proportions of pentadecanoic acid, palmitic acid and conjugated linoleic acid among toddlers.
-
•
High consumption of infant formula and vegetable margarine were associated with a high serum proportion of linoleic acid.
-
•
The 3‐day food records kept by parents and day‐care personnel were of high quality.
-
•
Non‐fasting, un‐fractioned whole serum is suitable for total fatty acid analyses among toddlers.
Materials and methods
The Type 1 Diabetes Prediction and Prevention (DIPP) Project is a birth cohort of children with increased genetic risk of type 1 diabetes. In the university hospitals of Turku, Oulu and Tampere, Finland, cord blood samples from all newborn infants were screened for human leukocyte antigen‐DQB1 alleles shown to be associated with risk of type 1 diabetes in the Finnish population (Ilonen et al. 1996) with written informed consent of the parents. The families of children with a genetic susceptibility to type 1 diabetes were invited to a prospective follow‐up study. The children were monitored for the emergence of type 1 diabetes‐associated autoantibodies, growth, diet and viral infections with clinical visits at the age of 3, 6, 12, 18 and 24 months, and thereafter once a year. The DIPP Nutrition Study was implemented within the framework of DIPP at the university hospitals in Oulu and Tampere. The procedures were approved by the local Ethics Committees.
Subjects
The study subjects in the present analyses come from a cohort of the genetically at‐risk children born between 1 October 1996 and 1 July 2004 in Oulu University Hospital and between 20 October 1997 and 6 July 2004 in Tampere University Hospital (n = 5787, 76% of the children invited). For aetiological analyses using serum biomarkers, cases of pre‐type 1 diabetes or clinical type 1 diabetes were identified from this cohort (n = 108) (Uusitalo et al. 2008). Two control participants, free of pre‐ or clinical type 1 diabetes and matched for birth date, sex, hospital of birth and genetic risk group, were randomly selected for each case. The subjects of the present analyses consist of these control children (n = 207). In the present study, the data from ages 1, 2 and 3 years is used. One‐year data from infants who were breastfed (n = 47) were excluded from the analysis, because their dietary intake could not be estimated reliably. Background characteristics of the study population are presented in (Uusitalo et al. 2008); 62.3% were boys, and 51.2% had been born in Tampere University Hospital.
Dietary methods
Dietary information was collected using 3‐day open food records completed by parents and day‐care personnel prior to each visit to the study clinic, as described in (Kyttala et al. 2010). The parents received written and oral instructions in keeping the records. The amount, brand, recipe and preparation method of each food item was recorded. Portion sizes were estimated using either household measures (e.g. spoons, cups, glasses and decilitres) or a booklet with photos of food portions. During the clinic visit, the study nurse checked the records making complementary questions if needed. The food records were entered into a study database by qualified nutritional scientists and final stage students majoring in nutritional science. Food consumption and intake of energy and nutrients were calculated using the annually updated Finnish food composition databank by in‐house software of the National Institute for Health and Welfare, Nutrition Unit (2009). The databank contains standard recipes based on current Finnish cookbooks. When appropriate, recipes were modified by nutritionists according to the actual recipes in the children's food records. The fatty acid composition of foods in the databank is based on detailed quantitative analyses (Hyvönen et al. 1993). Dietary fatty acids were expressed as a percentage of total triglyceride intake, and food consumption was calculated per 1 MJ. The consumption of dietary supplements was entered into the database and the contribution of supplements to the intake of each nutrient was expressed in a separate variable.
Serum samples
Non‐fasting blood samples for nutrient analyses were collected by venipuncture. Samples were protected from light during processing. They were kept at room temperature for 30–60 min to clot. After centrifugation, an aliquot of at least 1 mL serum from 1‐year‐old children and 2 mL from age 2 onwards was separated and stored at −70°C prior to analyses. The average storage time between sample collection and analysis was 5.5 years (range 1.9–7.8 years). Samples were transported on dry ice to the National Institute for Health and Welfare for the analyses. (Uusitalo et al. 2008) Fat was extracted from 50 µL of serum with dichloromethane – methanol (2:1, v : v) (Folch et al. 1957). Total fatty acids were methylated with acidic methanol (5% weight H2SO4) (Stoffel et al. 1959). The percentage composition of methylated total fatty acids from 14:0 to 22:6 n‐3 was determined by a HP 6890 gas chromatograph (Hewlett Packard, Palo Alto, CA, USA) equipped with Chemstation (version A.06.03) having a DB225 column (30‐m long I.D. 0.32 mm, phase layer 0.25 µm; Agilent J&W GC, Palo Alto, CA, USA), using split injection and hydrogen as carrier gas. A temperature programme from 160°C to 230°C was used. The percentage composition of fatty acid methyl esters was normalised to 100%. Between‐series variability of control samples was 2–7% for fatty acid peaks over 1% and 6–18% for smaller peaks. Altogether, 17 individual fatty acids were determined. The fatty acids were expressed as percentages of total fatty acids in serum. (Virtanen et al. 2010).
Statistical methods
The distributions of dietary and serum fatty acid variables were examined, and natural log transformation was employed in cases when it improved the normality of the distribution. Dietary heptadecenoic acid (all ages), γ‐linolenic acid (1 and 2 years of age and all ages combined), dihomo‐γ‐linolenic acid (all ages) and docosapentaenoic acid (3 years of age) were excluded from the canonical correlation analyses because of the minimal intake and highly skewed distribution. The effective sample size, i.e. the number of children with both dietary and serum data was 135 at 1 year of age, 133 at 2 years, and 92 at 3 years.
CCA is a technique for expressing relationships between two sets of variables, x1, x2, . . . , xp and y1, y2, . . . , yq (say), measured on the same sampling unit. Its main advantage is that it provides an effective summary of the linear relationships between the members of the sets, rather than a large matrix of bivariate correlations, most of which would actually be redundant. That is, CCA attempts to find the association structures between all variables in one data set relative to all variables in the another set of data. In contrast, principal component analysis (PCA) aims to identify principal sources of variation in a single data set; this is achieved by sequentially forming linear combinations of variables in such a way that the variance is maximised. Thus, the objective of PCA is completely different to CCA, where the linear combinations are intended to be maximally correlated. In the present setting, the sampling unit is one child at a specific age point, the ‘x‐variables’ are the dietary fatty acids (P = 17) and the ‘y‐variables’ are the serum fatty acids (q = 17). In general, P does not need to be equal to q.
CCA works in the following manner. Find coefficients α and β such that a linear combination of the x‐variables, u 1 = β 1 x 1 + β 2 y 2 + . . . + β p y p and a linear combination of the y‐variables v 1 = α 1 y 1 + α 2 y 2 + . . . + α q y q, such that u 1 and v 1 are maximally correlated. This is the first canonical correlation indicating the strongest linear relationship between the two sets of variables, and u 1 and v 1 are called the first canonical variates. After this, a second pair, u 2 and v 2, of maximally correlating canonical variates are found subject to the constraint that they are uncorrelated with the previous ones. By doing so, one can reduce the number of dimensions of the variables substantially and effectively summarise the distinct relationships between the sets of variables in just a few first patterns. In principle, one can continue with this procedure until all information has been exhausted, but this is rarely done in practice.
Each canonical variate represents a group of those variables actually observed (from each set). The meaning of the canonical variate, or the groups of variables represented by it, may be further described by loadings which are simple bivariate correlations of the original variables and the canonical variates. Those x‐variables and y‐variables that have high bivariate correlations would be expected to have similar loadings in their canonical variates. The statistical significance of the canonical correlations can be assessed assuming multivariate normality in standard software (PROC CANCORR in SAS, for instance). The number of canonical variates chosen to be reported within each separate CCA was based on whether a meaningful interpretation could be identified and on the magnitude of the canonical loadings.
Canonical correlation analyses were performed using PROC CANCORR in SAS version 8.2 (SAS Institute, Cary, NC, USA). Descriptive statistics and bivariate Pearson and Spearman correlation coefficients were calculated using PASW Statistics 17.0 (SPSS, Chicago, IL, USA).
Results
The major fatty acids both in diet and serum were palmitic acid, oleic acid and linoleic acid (Table 1). The average proportion of palmitic acid was approximately 20%, and that of stearic acid about 10%. The proportion of oleic acid accounted for about a quarter of all fatty acids, while other monounsaturated fatty acids were present in minor proportions. The major polyunsaturated fatty acid was linoleic acid. Its proportion was almost 30% in serum and about 10% in diet. The second most abundant polyunsaturated fatty acid in the diet was α‐linolenic acid and in serum arachidonic acid. The average proportions of long‐chain polyunsaturated fatty acids dihomo‐γ‐linolenic acid, arachidonic acid, eicosapentaenoic acid (EPA), docosapentaenoic acid and docosahexaenoic acid (DHA) were much higher in serum than in diet. Overall, the proportions of fatty acids were similar in different age groups. The proportions of EPA and DHA tended to be higher in 2‐ and 3‐year‐old children compared with 1‐year‐olds.
Table 1.
Proportions in % (Mean, standard deviation) of fatty acids in diet and serum of 1–3‐year‐old Finnish children born between 1996 and 2004
| Fatty acid | 1 year (n = 135) | 2 years (n = 133) | 3 years (n = 92) | ||||
|---|---|---|---|---|---|---|---|
| Diet* | Serum † | Diet* | Serum † | Diet* | Serum † | ||
| 14:0 | Myristic acid | 5.00 (1.79) | 0.87 (0.45) | 5.83 (1.80) | 0.83 (0.39) | 5.51 (1.50) | 0.84 (0.44) |
| 15:0 | Pentadecanoic acid | 0.39 (0.17) | 0.20 (0.08) | 0.45 (0.16) | 0.20 (0.06) | 0.42 (0.13) | 0.20 (0.06) |
| 16:0 | Palmitic acid | 20.8 (3.76) | 21.7 (1.82) | 21.3 (3.00) | 20.9 (1.53) | 20.5 (2.21) | 20.6 (1.46) |
| 18:0 | Stearic acid | 7.83 (1.93) | 8.11 (0.94) | 10.2 (1.47) | 8.64 (0.90) | 10.2 (1.44) | 8.80 (0.89) |
| 20:0 | Arachidic acid | 0.21 (0.03) | – ‡ | 0.24 (0.05) | – ‡ | 0.25 (0.05) | – ‡ |
| 16:1n–7 | Palmitoleic acid | 0.96 (0.35) | 1.61 (0.57) | 1.14 (0.28) | 1.61 (0.47) | 1.10 (0.24) | 1.57 (0.47) |
| 16:1n–9 | 0.26 (0.14) | 0.33 (0.12) | 0.29 (0.16) | 0.35 (0.10) | 0.27 (0.20) | 0.35 (0.09) | |
| 18:1n–7 | Vaccenic acid | 1.04 (0.34) | 1.81 (0.29) | 1.16 (0.44) | 1.79 (0.21) | 1.21 (0.37) | 1.77 (0.22) |
| 18:1n–9 | Oleic acid | 24.1 (7.89) | 27.8 (2.65) | 19.4 (6.45) | 26.0 (2.79) | 20.5 (5.53) | 25.2 (2.90) |
| 18:2n–6 | Linoleic acid | 12.6 (6.02) | 27.1 (3.42) | 9.00 (3.17) | 27.1 (3.36) | 9.18 (2.38) | 27.8 (3.28) |
| 18:2CON | Conjugated linoleic acid | 0.22 (0.09) | 0.21 (0.11) | 0.23 (0.08) | 0.24 (0.12) | 0.21 (0.07) | 0.23 (0.09) |
| 18:3n–3 | α‐Linolenic acid | 3.03 (1.50) | 0.97 (0.34) | 2.38 (1.02) | 1.00 (0.38) | 2.52 (0.81) | 1.02 (0.36) |
| 18:3n–6 | γ‐Linolenic acid | – § | 0.27 (0.12) | – § | 0.30 (0.12) | 0.06 (0.03) | 0.30 (0.12) |
| 20:3n–6 | Dihomo‐ γ‐linolenic acid | – § | 1.49 (0.40) | – § | 1.65 (0.35) | – § | 1.64 (0.36) |
| 20:4n–6 | Arachidonic acid | 0.07 (0.05) | 4.89 (1.10) | 0.08 (0.04) | 5.96 (1.30) | 0.08 (0.04) | 6.01 (1.25) |
| 20:5n–3 | Eicosapentaenoic acid | 0.05 (0.08) | 0.49 (0.32) | 0.07 (0.10) | 0.76 (0.36) | 0.07 (0.11) | 0.82 (0.43) |
| 22:5n–3 | Docosapentaenoic acid | 0.04 (0.03) | 0.54 (0.16) | 0.06 (0.05) | 0.62 (0.13) | – § | 0.62 (0.14) |
| 22:6n–3 | Docosahexaenoic acid | 0.12 (0.23) | 1.55 (0.65) | 0.19 (0.30) | 2.05 (0.76) | 0.19 (0.31) | 2.15 (0.77) |
*Values represent mean of 3 days and are expressed as a percentage of total triglyceride intake (as glycerol is included in the denominator, the sum of percentages is <100). †Percentage of total fatty acids in serum. ‡Not identified in serum. §Excluded because of minimal intake and highly skewed distribution.
The bivariate Pearson correlation coefficient for dietary and serum proportion of 15:0 was 0.62 at 1 year of age, 0.52 at 2 years and 0.42 at 3 years (P for each < 0.01). Pearson correlation coefficient for linoleic acid was 0.35 (P < 0.01) at 1 year of age, 0.27 (P < 0.01) at 2 years and 0.19 (not significant) at 3 years. For DHA, nonparametric Spearman correlation coefficients were 0.41 among 1‐year‐olds, 0.43 among 2‐year‐olds and 0.38 among 3‐year‐olds (P for each < 0.01).
Children who had a high consumption of fatty milk tended to have high serum proportions of pentadecanoic acid, palmitic acid, palmitoleic acid and conjugated linoleic acid (CLA) at the age of 1 year. High consumption of cow's milk‐based formula and low consumption of fat‐free milk were associated with high proportion of linoleic acid and low proportions of monounsaturated fatty acids palmitoleic acid, 16:1n‐9 and vaccenic acid (18:1n‐7) in serum (Table 2).
Table 2.
Food consumption and serum fatty acids
| Variable | First canonical correlation: 0.90, P < 0.0001* | Second canonical correlation: 0.80, P < 0.0001* | |||||
|---|---|---|---|---|---|---|---|
| Canonical loading †‡ | Variable | Canonical loading †§ | Variable | Canonical loading †‡ | Variable | Canonical loading †§ | |
| Fruits and berries | −0.05 | 14:0 | 0.26 | Fruits and berries | −0.08 | 14:0 | −0.35 |
| Juice, fruit and berry drinks | 0.12 | 15:0 | 0.67 | Juice, fruit and berry drinks | 0.05 | 15:0 | −0.28 |
| Potatoes and potato products | 0.11 | 16:0 | 0.56 | Potatoes and potato products | −0.06 | 16:0 | 0.16 |
| Vegetables | −0.08 | 18:0 | 0.18 | Vegetables | 0.26 | 18:0 | −0.31 |
| Nuts, seeds | −0.08 | 16:1n–7 ¶ | 0.69 | Nuts, seeds | 0.10 | 16:1n–7 ¶ | −0.30 |
| Soy products | −0.18 | 16:1n–9 | 0.30 | Soy products | 0.16 | 16:1n–9 | −0.43 |
| Cereals and cereal products | 0.04 | 18:1n–7 | 0.27 | Cereals and cereal products | 0.06 | 18:1n–7 | −0.52 |
| Cow's milk‐based formula | −0.17 | 18:1n–9 | −0.34 | Cow's milk‐based formula | 0.34 | 18:1n–9 | −0.23 |
| Soy‐based formula | −0.08 | 18:2n–6 | −0.40 | Soy‐based formula | 0.11 | 18:2n–6 | 0.50 |
| Hydrolysed formula | −0.76 | 18:2CON | 0.73 | Hydrolysed formula | −0.15 | 18:2CON | −0.14 |
| Fatty milk and sourmilk | 0.61 | 18:3n–3 | −0.48 | Fatty milk and sourmilk | −0.36 | 18:3n–3 | −0.00 |
| Fat‐free milk and sourmilk | 0.03 | 18:3n–6 | 0.11 | Fat‐free milk and sourmilk | −0.43 | 18:3n–6 | −0.09 |
| Cheese | 0.08 | 20:3n–6 | 0.25 | Cheese | 0.03 | 20:3n–6 | −0.29 |
| Other milk products | 0.01 | 20:4n–6 | 0.16 | Other milk products | 0.20 | 20:4n–6 | −0.20 |
| Vegetable oils | −0.08 | 20:5n–3 | 0.25 | Vegetable oils | 0.27 | 20:5n–3 | −0.14 |
| Vegetable margarine | −0.22 | 22:5n–3 | 0.20 | Vegetable margarine | −0.19 | 22:5n–3 | 0.09 |
| Low‐fat margarine | −0.08 | 22:6n–3 | 0.29 | Low‐fat margarine | 0.04 | 22:6n–3 | −0.12 |
| Butter, butter‐oil mixes | 0.23 | Butter, butter‐oil mixes | −0.09 | ||||
| Industrial and animal fats | 0.28 | Industrial and animal fats | 0.08 | ||||
| Pork | −0.22 | Pork | 0.13 | ||||
| Beef | 0.23 | Beef | −0.08 | ||||
| Poultry | 0.19 | Poultry | 0.07 | ||||
| Sausage | 0.11 | Sausage | 0.05 | ||||
| Other meats | −0.19 | Other meats | −0.52 | ||||
| Fish and shellfish | 0.22 | Fish and shellfish | 0.08 | ||||
| Eggs | 0.03 | Eggs | −0.49 | ||||
| Chocolate | 0.08 | Chocolate | −0.06 | ||||
| Sweets and soft drinks | −0.17 | Sweets and soft drinks | 0.01 | ||||
Canonical structure of the first two pairs of canonical variates in 1‐year‐old Finnish children (n = 135). *Canonical correlation analysis is based on finding a linear combination of the variables in each of the two data sets (food variables and serum variables), which correlate maximally with each other. The canonical correlation coefficients tend to be high. †The magnitude and direction (positive vs. negative) of the coefficient indicates the strength and direction of the association with the variables in the other data set, e.g. a variable that has a high positive loading within the food variable group, is inversely associated with a variable that has a high negative loading within the fatty acid group. ‡Correlation of each food with the linear combination of all the food variables that produces the largest correlation with the set of serum fatty acid variables. §Correlation of each serum fatty acid with the linear combination of all the serum fatty acid variables that produces the largest correlation with the set of food variables. ¶Ln‐transformed.
Two‐year‐olds who had a low consumption of fatty milk and butter, and high consumption of soy products, vegetable margarine and fat‐free milk had low serum proportions of myristic acid, pentadecanoic acid, palmitic acid and CLA and high proportion of linoleic acid (Table 3).
Table 3.
Food consumption and serum fatty acids
| Variable | First canonical correlation: 0.82, P < 0.0001* | Second canonical correlation: 0.80, P < 0.001* | |||||
|---|---|---|---|---|---|---|---|
| Canonical loading †‡ | Variable | Canonical loading †§ | Variable | Canonical loading †‡ | Variable | Canonical loading †§ | |
| Fruits and berries | −0.04 | 14:0 ¶ | −0.52 | Fruits and berries | 0.05 | 14:0 ¶ | 0.34 |
| Juice, fruit and berry drinks | 0.29 | 15:0 | −0.74 | Juice, fruit and berry drinks | −0.06 | 15:0 | −0.03 |
| Potatoes and potato products | 0.09 | 16:0 | −0.63 | Potatoes and potato products | 0.12 | 16:0 | 0.27 |
| Vegetables | 0.16 | 18:0 | −0.27 | Vegetables | −0.06 | 18:0 | −0.24 |
| Nuts, seeds | 0.02 | 16:1n–7 | −0.39 | Nuts, seeds | −0.21 | 16:1n–7 | 0.04 |
| Soy products | 0.50 | 16:1n–9 ¶ | −0.02 | Soy products | −0.03 | 16:1n–9 ¶ | 0.13 |
| Cereals and cereal products | 0.29 | 18:1n–7 | 0.31 | Cereals and cereal products | 0.07 | 18:1n–7 | −0.27 |
| Cow's milk‐based formula | −0.23 | 18:1n–9 | −0.16 | Cow's milk‐based formula | 0.17 | 18:1n–9 | 0.46 |
| Soy‐based formula | 0.16 | 18:2n–6 | 0.53 | Soy‐based formula | 0.19 | 18:2n–6 | −0.05 |
| Fatty milk and sourmilk | −0.77 | 18:2CON | −0.57 | Fatty milk and sourmilk | −0.18 | 18:2CON | −0.22 |
| Fat‐free milk and sourmilk | 0.37 | 18:3n–3 ¶ | 0.43 | Fat‐free milk and sourmilk | 0.15 | 18:3n–3 ¶ | 0.39 |
| Cheese | −0.07 | 18:3n–6 | −0.21 | Cheese | −0.11 | 18:3n–6 | 0.16 |
| Other milk products | −0.02 | 20:3n–6 | −0.24 | Other milk products | 0.41 | 20:3n–6 | −0.40 |
| Vegetable oils | 0.26 | 20:4n–6 | 0.10 | Vegetable oils | 0.38 | 20:4n–6 | −0.85 |
| Vegetable margarine | 0.40 | 20:5n–3 ¶ | −0.14 | Vegetable margarine | 0.17 | 20:5n–3 ¶ | −0.11 |
| Low‐fat margarine | −0.03 | 22:5n–3 ¶ | −0.10 | Low‐fat margarine | 0.07 | 22:5n–3 ¶ | −0.45 |
| Butter, butter‐oil mixes | −0.38 | 22:6n–3 ¶ | 0.18 | Butter, butter‐oil mixes | −0.24 | 22:6n–3 ¶ | −0.28 |
| Industrial and animal fats | 0.08 | Industrial and animal fats | −0.08 | ||||
| Pork | 0.26 | Pork | −0.44 | ||||
| Beef | 0.14 | Beef | 0.23 | ||||
| Poultry | 0.02 | Poultry | 0.22 | ||||
| Sausage | 0.01 | Sausage | −0.24 | ||||
| Other meats | 0.26 | Other meats | −0.02 | ||||
| Fish and shellfish | 0.02 | Fish and shellfish | 0.10 | ||||
| Eggs | −0.09 | Eggs | −0.39 | ||||
| Chocolate | −0.01 | Chocolate | 0.22 | ||||
| Sweets and soft drinks | 0.19 | Sweets and soft drinks | 0.04 | ||||
Canonical structure of the first two pairs of canonical variates in 2‐year‐old Finnish children (n = 133). *Canonical correlation analysis is based on finding a linear combination of the variables in each of the two data sets (food variables and serum variables), which correlate maximally with each other. The canonical correlation coefficients tend to be high. †The magnitude and direction (positive vs. negative) of the coefficient indicates the strength and direction of the association with the variables in the other data set, e.g. a variable that has a high positive loading within the food variable group, is inversely associated with a variable that has a high negative loading within the fatty acid group. ‡Correlation of each food with the linear combination of all the food variables that produces the largest correlation with the set of serum fatty acid variables. §Correlation of each serum fatty acid with the linear combination of all the serum fatty acid variables that produces the largest correlation with the set of food variables. ¶Ln‐transformed.
Low consumption of fatty milk predicted a high proportion of oleic acid and a low proportion of pentadecanoic acid in serum at the age of 3 years. High consumption of fatty milk and low consumption of vegetable margarine were associated with high proportions of pentadecanoic acid, palmitic acid, palmitoleic acid and CLA, and a low proportion of linoleic acid (Table 4).
Table 4.
Food consumption and serum fatty acids
| Variable | First canonical correlation: 0.86, P < 0.001* | Second canonical correlation: 0.82, P = 0.10* | |||||
|---|---|---|---|---|---|---|---|
| Canonical loading | Canonical loading | ||||||
| Canonical loading †‡ | Variable | Canonical loading †§ | Variable | Canonical loading †‡ | Variable | Canonical loading †§ | |
| Fruits and berries | −0.26 | 14:0 ¶ | −0.20 | Fruits and berries | 0.09 | 14:0 ¶ | 0.25 |
| Juice, fruit and berry drinks | 0.51 | 15:0 ¶ | −0.42 | Juice, fruit and berry drinks | −0.30 | 15:0 ¶ | 0.45 |
| Potatoes and potato products | −0.06 | 16:0 | −0.26 | Potatoes and potato products | 0.05 | 16:0 | 0.45 |
| Vegetables | −0.35 | 18:0 ¶ | 0.12 | Vegetables | −0.02 | 18:0 ¶ | −0.25 |
| Nuts, seeds | −0.10 | 16:1n–7 ¶ | −0.09 | Nuts, seeds | 0.00 | 16:1n–7 ¶ | 0.66 |
| Soy products | 0.24 | 16:1n–9 | −0.08 | Soy products | −0.24 | 16:1n–9 | 0.19 |
| Cereals and cereal products | 0.08 | 18:1n–7 ¶ | 0.14 | Cereals and cereal products | −0.31 | 18:1n–7 ¶ | 0.34 |
| Cow's milk‐based formula | −0.16 | 18:1n–9 | 0.35 | Cow's milk‐based formula | −0.00 | 18:1n–9 | 0.05 |
| Soy‐based formula | 0.00 | 18:2n–6 | −0.03 | Soy‐based formula | 0.00 | 18:2n–6 | −0.47 |
| Fatty milk and sourmilk | −0.37 | 18:2CON | 0.24 | Fatty milk and sourmilk | 0.53 | 18:2CON | 0.59 |
| Fat‐free and sourmilk | 0.19 | 18:3n–3 ¶ | −0.06 | Fat‐free milk and sourmilk | −0.10 | 18:3n–3 ¶ | −0.56 |
| Cheese | −0.03 | 18:3n–6 ¶ | 0.04 | Cheese | 0.00 | 18:3n–6 ¶ | 0.13 |
| Other milk products | 0.15 | 20:3n–6 | −0.18 | Other milk products | 0.15 | 20:3n–6 | 0.36 |
| Vegetable oils | −0.16 | 20:4n–6 | −0.06 | Vegetable oils | 0.03 | 20:4n–6 | 0.10 |
| Vegetable margarine | −0.11 | 20:5n–3 ¶ | −0.22 | Vegetable margarine | −0.64 | 20:5n–3 ¶ | 0.33 |
| Low‐fat margarine | 0.35 | 22:5n–3 | −0.33 | Low‐fat margarine | 0.21 | 22:5n–3 | 0.23 |
| Butter, butter‐oil mixes | 0.03 | 22:6n–3 | −0.36 | Butter, butter‐oil mixes | 0.47 | 22:6n–3 | 0.28 |
| Industrial and animal fats | 0.07 | Industrial and animal fats | −0.01 | ||||
| Pork | −0.11 | Pork | −0.09 | ||||
| Beef | −0.10 | Beef | 0.09 | ||||
| Poultry | −0.36 | Poultry | 0.11 | ||||
| Sausage | −0.08 | Sausage | −0.32 | ||||
| Other meats | −0.06 | Other meats | 0.12 | ||||
| Fish and shellfish | 0.08 | Fish and shellfish | −0.09 | ||||
| Eggs | 0.03 | Eggs | 0.05 | ||||
| Chocolate | 0.34 | Chocolate | −0.29 | ||||
| Sweets and soft drinks | 0.06 | Sweets and soft drinks | −0.04 | ||||
Canonical structure of the first two pairs of canonical variates in 3‐year‐old Finnish children (n = 92). *Canonical correlation analysis is based on finding a linear combination of the variables in each of the two data sets (food variables and serum variables), which correlate maximally with each other. The canonical correlation coefficients tend to be high. †The magnitude and direction (positive vs. negative) of the coefficient indicates the strength and direction of the association with the variables in the other data set, e.g. a variable that has a high positive loading within the food variable group, is inversely associated with a variable that has a high negative loading within the fatty acid group. ‡Correlation of each food with the linear combination of all the food variables that produces the largest correlation with the set of serum fatty acid variables. §Correlation of each serum fatty acid with the linear combination of all the serum fatty acid variables that produces the largest correlation with the set of food variables. ¶Ln‐transformed.
One‐year‐old children who had a high proportional dietary intake of myristic, pentadecanoic, palmitic, heptadecanoic, stearic and palmitoleic acids, and low proportional intake of oleic, linoleic and α‐linolenic acids had high serum proportions of pentadecanoic acid, palmitoleic acid and CLA in serum in the CCA (data not shown).
At the age of 2 years, high proportional dietary intake of myristic acid, pentadecanoic acid, palmitic acid, heptadecanoic acid and CLA, and low proportional intake of oleic acid, linoleic acid and α‐linolenic acid was reflected in high serum proportions of pentadecanoic acid and CLA, and in a low‐serum proportion of α‐linolenic acid (Table 5). High intake of EPA and DHA in diet was seen as high proportions of these fatty acids in serum.
Table 5.
Fatty acids in diet and serum
| FA | First canonical correlation: 0.80, P < 0.0001* | Second canonical correlation: 0.67, P < 0.01* | ||
|---|---|---|---|---|
| Canonical loading | Canonical loading | |||
| Dietary FAs with their canonical variable †‡ | Serum FAs with their canonical variable †§ | Dietary FAs with their canonical variable †‡ | Serum FAs with their canonical variable †§ | |
| 14:03 | 0.74 | 0.36 | 0.40 | 0.17 |
| 15:0 | 0.76 | 0.61 | 0.42 | 0.42 |
| 16:0 | 0.85 | 0.44 | 0.19 | 0.16 |
| 17:0 | 0.63 | – | 0.22 | – |
| 18:0 | 0.49 | 0.28 | −0.17 | 0.15 |
| 20:0 | −0.53 | – | −0.14 | – |
| 16:1n–7 | 0.49 | 0.07 | 0.41 | 0.11 |
| 16:1n–9 ¶** | 0.11 | 0.44 | −0.35 | −0.05 |
| 18:1n–7 | −0.54 | −0.12 | −0.30 | −0.04 |
| 18:1n–9 | −0.61 | 0.13 | −0.43 | −0.06 |
| 18:2n–6** | −0.81 | −0.49 | −0.21 | −0.20 |
| 18:2CON | 0.66 | 0.64 | 0.37 | 0.20 |
| 18:3n–3 ¶** | −0.84 | −0.56 | −0.01 | 0.13 |
| 18:3n–6 | – | 0.13 | – | −0.09 |
| 20:3n‐6 | – | 0.40 | – | −0.19 |
| 20:4n–6 | −0.17 | 0.16 | −0.10 | −0.22 |
| 20:5n–3 ¶** | −0.35 | −0.00 | 0.62 | 0.58 |
| 22:5n–3 ¶** | −0.31 | 0.19 | 0.30 | 0.23 |
| 22:6n–3 ¶** | −0.29 | −0.27 | 0.62 | 0.53 |
Canonical structure of the first two pairs of canonical variates in 2‐year‐old Finnish children (n = 133). FA, fatty acids. *Canonical correlation analysis is based on finding a linear combination of the variables in each of the two data sets (food variables and serum variables), which correlate maximally with each other. The canonical correlation coefficients tend to be high. †The magnitude and direction (positive vs. negative) of the coefficient indicates the strength and direction of the association with the variables in the other data set, e.g. a variable that has a high positive loading within the food variable group, is inversely associated with a variable that has a high negative loading within the fatty acid group. ‡Correlation of each dietary fatty acid with the linear combination of all the dietary fatty acid variables that produces the largest correlation with the set of serum fatty acid variables. §Correlation of each serum fatty acid with the linear combination of all the serum fatty acid variables that produces the largest correlation with the set of dietary fatty acid variables. ¶Serum variable ln‐transformed. **Dietary variable ln‐transformed.
Among 3‐year‐olds, high proportional dietary intake of myristic acid, pentadecanoic acid, palmitic acid, heptadecanoic acid and CLA and low proportional intake of arachidic acid, vaccenic acid (18:1n‐7) and oleic acid were associated with a serum fatty acid profile with a high proportion of pentadecanoic acid, palmitic acid and palmitoleic acid and a low proportion of α‐linolenic acid. Dietary EPA and serum EPA and DHA also were moderately correlated (data not shown).
Because there were no major discrepancies in the correlations of dietary and serum fatty acids between the various age points, the CCA was repeated with data from all the age groups combined. Because the analysis involves partially the same individuals, the significance tests are inappropriate, and are not reported for this particular analysis. It serves a descriptive, averaging role. Overall, the correlations between dietary and serum proportions of each fatty acid with their respective canonical variables were similar. The correlations between proportional dietary intake and serum proportions were most distinctive for pentadecanoic acid and CLA and fairly high also for linoleic acid, while the correlations between dietary and serum EPA and DHA were modest in the combined data set (Fig. 1).
Figure 1.
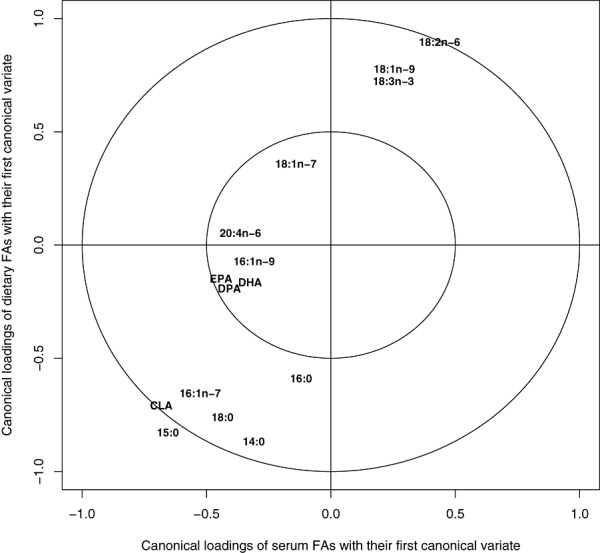
Fatty acids in diet and serum of 1–3‐year‐old Finnish children born between 1996 and 2004. Canonical structure of the first pair of canonical variates with data from all the age groups combined. For fatty acids that have a high positive or negative coefficient in both variable groups (dietary and serum fatty acids), serum proportion is a good biomarker of dietary intake. A perfect biomarker would be expected to be located at an imaginary line drawn from −1,1 to 1,1. The farther the fatty acid lies from the centre of the circle, the more distinct biomarker it is. CLA, conjugated linoleic acid; DHA, docosahexaenoic acid; DPA, docosapentaenoic acid; EPA, eicosapentaenoic acid; FA, fatty acid.
Discussion
The target of the present study was to examine the agreement between dietary fatty acid intake, assessed by 3‐day food records and serum fatty acid composition among toddlers. Both the methods have their intrinsic sources of error as measures of fatty acid intake and the results of this validation study will guide us in interpreting aetiological findings concerning fatty acids. A method of CCA was applied, which has rarely been employed in nutrition research.
The virtue of CCA is that it provides an effective summary of the associations between the two variable groups, fatty acids in diet and in serum. The results show whether there are dependencies between the variable groups, and which variables are most strongly correlated. The main limitation is that CCA does not reveal the exact strength or shape of these correlations.
Serum fatty acids may be measured in cholesteryl ester (CE), phospholipid (PL) and triglyceride (TG) fractions or as free fatty acids (FFA) (Hunter 1998). Most commonly, the fractions are separated before the isolation and identification of fatty acids (Hunter 1998). Because the subjects of the present study were young children, the volume of the blood samples was small and therefore fatty acids were analysed from un‐fractioned serum. Significant correlations between dietary intake of individual fatty acids and their proportions in whole plasma (Kuriki et al. 2003; Baylin et al. 2005) and serum (Andersen et al. 1999) have been observed in previous studies.
When fatty acids are analysed from TG or FFA fractions, it is recommended to use serum samples collected after fasting, whereas fasting is not considered necessary for CE and PL fractions (Hunter 1998). In most of the studies in which fatty acids were analysed from whole plasma or serum, fasting samples were used (Iso et al. 1989; Andersen et al. 1999; Kuriki et al. 2003; Baylin et al. 2005). In the present study, fasting was not required from the participating children. Nevertheless, bivariate correlations between dietary intake and serum proportion of pentadecanoic acid, linoleic acid and DHA tended to be of similar magnitude as those observed in previous reports (von Houwelingen et al. 1989; Ma et al. 1995; Nikkari et al. 1995; Andersen et al. 1999; Kobayashi et al. 2001; Wolk et al. 2001; Kuriki et al. 2003; Baylin et al. 2005).
In the CCAs, consumption of fatty milk and sour milk correlated positively with pentadecanoic, palmitic and CLA at all age points. In addition, positive correlations were observed between the consumption of fatty milk and myristic and palmitoleic acids in serum. Correlations between dairy fat and proportions of saturated fatty acids in serum have been reported in previous studies among Finnish children and young adults (Nikkari et al. 1983; 1985, 1992). The associations were stronger for butter than for milk in two reports published in the 1980s (Nikkari et al. 1983; Moilanen et al. 1985). Butter consumption has decreased dramatically in Finland since then (Lahelma et al. 1997). In the present study, butter was a less important predictor of serum proportions of saturated fatty acids than were liquid milk products.
The most prominent indicators of fatty milk consumption were pentadecanoic acid and CLA. Pentadecanoic acid has been implicated as an indicator of dairy fat intake (1998, 2001; Innis & King 1999; Smedman et al. 1999; Shahin et al. 2006; Zlatanos et al. 2008), and the results of the present study confirm previous findings. To the best of our knowledge, this is the first study to report correlations between consumption of fatty milk products and serum CLA, although a correlation has been reported between milk fat intake and the proportion of CLA in adipose tissue (Jiang et al. 1999). Myristic and palmitoleic acids have been suggested as indicators of saturated fat intake (Renaud et al. 1991), and our results are in accordance with those earlier findings.
The positive association between dietary intake of EPA and DHA and the proportion of EPA and DHA in serum or plasma is well established (von Houwelingen et al. 1989; Ma et al. 1995; Andersen et al. 1999; Kobayashi et al. 2001; Kuriki et al. 2003; Baylin et al. 2005; Sun et al. 2007), and correlation coefficients of 0.60–0.75 have been observed (Kobayashi et al. 2001; Kuriki et al. 2003). EPA and/or DHA concentrations in serum or plasma have been shown to indicate the consumption of fatty fish (Iso et al. 1989; Hjartaker et al. 1997; Philibert et al. 2006), total fish (1985, 1992; Iso et al. 1989; Bonaa et al. 1992; Amiano et al. 2001) and fish meals (Vatten et al. 1993). In the CCAs of the present study, dietary and serum EPA and DHA were correlated at the age of 2 years and in all age groups combined, and EPA at 3 years. The associations were less marked for EPA and DHA than for milk‐derived fatty acids, and fish consumption was not associated with serum proportions of EPA and DHA in the present study. This may result from the fact that the dietary information in each age group was based on 3‐day food records only. Fish is typically consumed less frequently than, e.g. milk products (Kyttala et al. 2010), and 3 days is probably a too short period of time to accurately estimate individual fish consumption. We did not analyse the consumption of fatty and lean fish separately, which may have weakened the correlations between fish consumption and serum proportions of fish‐derived fatty acids. In earlier studies, the consumption of fatty fish was associated with serum EPA and DHA (Hjartaker et al. 1997; Philibert et al. 2006), while the association was weak (Hjartaker et al. 1997) or non‐existent (Philibert et al. 2006) for total fish.
The serum proportion of linoleic acid was largely determined by the type of milk and fat spread. At the age of 1 year, serum linoleic acid was positively associated with the consumption of cow's milk‐based infant formula. Infant formulas are rich in linoleic acid, and serum proportion of linoleic acid reflected its concentration in ingested milk type among 7‐month‐old infants (Salo et al. 1997). Among 2‐ and 3‐year‐old children in the current study, serum linoleic acid was positively correlated with the consumption of vegetable margarine, and inversely correlated with fatty milk and butter. These results are well in accordance with previous observations among Finnish children, adolescents and young adults (Nikkari et al. 1983; 1985, 1992). Dietary and serum proportions of linoleic acid tended to be positively correlated at all ages and in the combined data. In previous studies, the correlations between linoleic acid content of various fractions of serum or plasma and dietary intake measured by food frequency questionnaire or food records have varied from weak to high (von Houwelingen et al. 1989; Andersen et al. 1999; Kobayashi et al. 2001; Kuriki et al. 2003; Baylin et al. 2005; Sun et al. 2007).
Serum proportion of α‐linolenic acid correlated inversely with dietary intake of saturated fat at the ages of 2 and 3 years, and positively with dietary α‐linolenic acid intake and the consumption of vegetable oils at the age of 3 years. In earlier studies from 1970–1980s, α‐linolenic acid in serum CEs and/or PLs (1985, 1992) correlated positively with the consumption of milk (Moilanen et al. 1985), butter (1985, 1992) and intake of saturated fat (Moilanen et al. 1992; Ma et al. 1995), and inversely with margarine (1985, 1992), oil (Moilanen et al. 1985) and intake of polyunsaturated fat (Moilanen et al. 1992). This discrepancy may be related to the increased consumption of rapeseed oil, rich in α‐linolenic acid, in Finland during recent decades. As vegetable oil nowadays is an important source of α‐linolenic acid, a positive correlation is expected. Weak to moderate positive correlations between intake and serum proportions of α‐linolenic acid have been observed previously in PL (Ma et al. 1995), CE (Ma et al. 1995) and total serum or plasma lipids (Andersen et al. 1999; Kuriki et al. 2003; Baylin et al. 2005; Sun et al. 2007).
Dietary and serum proportions of oleic acid were not strongly associated, which was an expected finding in the light of previous research (Ma et al. 1995; Nikkari et al. 1995; Andersen et al. 1999; Kobayashi et al. 2001; Kuriki et al. 2003; Sun et al. 2007). At 2 years of age, oleic acid correlated positively with vegetable oil consumption, and at 3 years it correlated inversely with fatty milk. These results are not in line with earlier Finnish studies, in which positive associations with butter and inverse associations with margarine and oil were observed (1985, 1992). Again, increased consumption of rapeseed oil is a likely explanation for the discrepant results. Oleic acid in serum or plasma has been shown to correlate positively with dietary intake of saturated fatty acids (Moilanen et al. 1992; Ma et al. 1995; Nikkari et al. 1995) and inversely with polyunsaturated fatty acids (De Backer et al. 1989; Lopes et al. 1991; Renaud et al. 1991; Moilanen et al. 1992; Ma et al. 1995). In the present study, however, the correlations of serum oleic acid with the respective canonical variable tended to be low, and few associations stood out.
In conclusion, expected associations between proportions of fatty acids in diet and in serum samples were documented in a study population of toddlers. The result indicates high quality of the 3‐day food records kept by parents and other caretakers of the children, and suitability of non‐fasting, un‐fractioned serum samples for fatty acid analyses. The relationships between fatty acids in diet and serum seem to be similar among 1–3‐year‐old children as among older children and adults.
Source of funding
This work was supported by the European Foundation for the Study of Diabetes; the Academy of Finland (63672, 79685, 79686, 80846, 201988, 210632, 129492); the Finnish Diabetes Research Foundation; the Juho Vainio Foundation; the Yrjö Jahnsson Foundation; Medical Research Funds, Turku, Oulu and Tampere University Hospitals; Juvenile Diabetes Research Foundation (197032, 4‐1998‐274, 4‐1999‐731, 4‐2001‐435); Novo Nordisk Foundation; the EU Biomed 2 Program (BMH4‐CT98‐3314); and the Competitive Research Funding of the Tampere University Hospital (9 L109).
Conflicts of interest
One of the authors (CK‐K) moved from the National Institute for Health and Welfare to work at Danone Nutricia Baby after the analyses and writing of the current manuscript were completed. Danone Nutricia Baby is a producer of infant formulas and other baby foods. Danone Nutricia Baby has not sponsored the research.
Contributions
LU participated in designing the study, in preparing, analysing and interpreting the data, and in writing the manuscript. JN participated in designing the study and in planning the statistical analyses. IS was responsible for the laboratory analyses and participated in interpreting the data. M‐LO, CK‐K, SA and SN participated in preparing, analysing and interpreting the data. GA participated in planning the laboratory analyses and interpreting the data. OS, JI, RV and MK participated in conceiving and designing the DIPP study and interpreting the data. SMV participated in designing the study and interpreting the data. All authors approve the final version of the manuscript.
Acknowledgements
We thank the DIPP research staff and laboratory staff for excellent collaboration. We also thank the children and parents who participated in the study.
References
- Amiano P., Dorronsoro M., de Renobales M., Ruiz de Gordoa J.C. & Irigoien I. (2001) Very‐long‐chain omega‐3 fatty acids as markers for habitual fish intake in a population consuming mainly lean fish: the EPIC cohort of Gipuzkoa. European Prospective Investigation into Cancer and Nutrition. European Journal of Clinical Nutrition 55, 827–832. [DOI] [PubMed] [Google Scholar]
- Andersen L.F., Solvoll K., Johansson L.R., Salminen I., Aro A. & Drevon C.A. (1999) Evaluation of a food frequency questionnaire with weighed records, fatty acids, and alpha‐tocopherol in adipose tissue and serum. American Journal of Epidemiology 150, 75–87. [DOI] [PubMed] [Google Scholar]
- Baylin A. & Campos H. (2006) The use of fatty acid biomarkers to reflect dietary intake. Current Opinion in Lipidology 17, 22–27. [DOI] [PubMed] [Google Scholar]
- Baylin A., Kim M.K., Donovan‐Palmer A., Siles X., Dougherty L., Tocco P. et al (2005) Fasting whole blood as a biomarker of essential fatty acid intake in epidemiologic studies: comparison with adipose tissue and plasma. American Journal of Epidemiology 162, 373–381. [DOI] [PubMed] [Google Scholar]
- Bonaa K.H., Bjerve K.S. & Nordoy A. (1992) Habitual fish consumption, plasma phospholipid fatty acids, and serum lipids: the Tromso study. The American Journal of Clinical Nutrition 55, 1126–1134. [DOI] [PubMed] [Google Scholar]
- De Backer G., De Craene I., Rosseneu M., Vercaemst R. & Kornitzer M. (1989) Relationship between serum cholesteryl ester composition, dietary habits and coronary risk factors in middle‐aged men. Atherosclerosis 78, 237–243. [DOI] [PubMed] [Google Scholar]
- Folch J., Lees M. & Sloane Stanley G.H. (1957) A simple method for the isolation and purification of total lipides from animal tissues. The Journal of Biological Chemistry 226, 497–509. [PubMed] [Google Scholar]
- Hjartaker A., Lund E. & Bjerve K.S. (1997) Serum phospholipid fatty acid composition and habitual intake of marine foods registered by a semi‐quantitative food frequency questionnaire. European Journal of Clinical Nutrition 51, 736–742. [DOI] [PubMed] [Google Scholar]
- von Houwelingen A.C., Kester A.D., Kromhout D. & Hornstra G. (1989) Comparison between habitual intake of polyunsaturated fatty acids and their concentrations in serum lipid fractions. European Journal of Clinical Nutrition 43, 11–20. [PubMed] [Google Scholar]
- Hunter D. (1998) Biochemical indicators of dietary intake In: Nutritional Epidemiology (ed. Willett W.), pp 174–243. Oxford University Press: New York. [Google Scholar]
- Hyvönen L., Lampi A.M., Varo P. & Koivistoinen P. (1993) Fatty acid analysis, TAG equivalents as net fat value, and nutritional attributes of commercial fats and oils. Journal of Food Composition and Analysis 6, 24–40. [Google Scholar]
- Ilonen J., Reijonen H., Herva E., Sjoroos M., Iitia A., Lovgren T. et al (1996) Rapid HLA‐DQB1 genotyping for four alleles in the assessment of risk for IDDM in the Finnish population. The Childhood Diabetes in Finland (DiMe) Study Group. Diabetes Care 19, 795–800. [DOI] [PubMed] [Google Scholar]
- Innis S.M. & King D.J. (1999) trans Fatty acids in human milk are inversely associated with concentrations of essential all‐cis n–6 and n–3 fatty acids and determine trans, but not n–6 and n–3, fatty acids in plasma lipids of breast‐fed infants. The American Journal of Clinical Nutrition 70, 383–390. [DOI] [PubMed] [Google Scholar]
- Iso H., Sato S., Folsom A.R., Shimamoto T., Terao A., Munger R.G. et al (1989) Serum fatty acids and fish intake in rural Japanese, urban Japanese, Japanese American and Caucasian American men. International Journal of Epidemiology 18, 374–381. [DOI] [PubMed] [Google Scholar]
- Jiang J., Wolk A. & Vessby B. (1999) Relation between the intake of milk fat and the occurrence of conjugated linoleic acid in human adipose tissue. The American Journal of Clinical Nutrition 70, 21–27. [DOI] [PubMed] [Google Scholar]
- Kobayashi M., Sasaki S., Kawabata T., Hasegawa K., Akabane M. & Tsugane S. (2001) Single measurement of serum phospholipid fatty acid as a biomarker of specific fatty acid intake in middle‐aged Japanese men. European Journal of Clinical Nutrition 55, 643–650. [DOI] [PubMed] [Google Scholar]
- Kuriki K., Nagaya T., Tokudome Y., Imaeda N., Fujiwara N., Sato J. et al (2003) Plasma concentrations of (n–3) highly unsaturated fatty acids are good biomarkers of relative dietary fatty acid intakes: a cross‐sectional study. The Journal of Nutrition 133, 3643–3650. [DOI] [PubMed] [Google Scholar]
- Kyttala P., Erkkola M., Kronberg‐Kippila C., Tapanainen H., Veijola R., Simell O. et al (2010) Food consumption and nutrient intake in Finnish 1–6‐year‐old children. Public Health Nutrition 13, 947–956. [DOI] [PubMed] [Google Scholar]
- Lahelma E., Rahkonen O., Berg M.A., Helakorp S., Prattala R., Puska P. et al (1997) Changes in health status and health behavior among Finnish adults 1978–1993. Scandinavian Journal of Work, Environment & Health 23 (Suppl. 3), 85–90. [PubMed] [Google Scholar]
- Lands W.E., Libelt B., Morris A., Kramer N.C., Prewitt T.E., Bowen P. et al (1992) Maintenance of lower proportions of (n–6) eicosanoid precursors in phospholipids of human plasma in response to added dietary (n–3) fatty acids. Biochimica et Biophysica Acta 1180, 147–162. [DOI] [PubMed] [Google Scholar]
- Lopes S.M., Trimbo S.L., Mascioli E.A. & Blackburn G.L. (1991) Human plasma fatty acid variations and how they are related to dietary intake. The American Journal of Clinical Nutrition 53, 628–637. [DOI] [PubMed] [Google Scholar]
- Ma J., Folsom A.R., Shahar E. & Eckfeldt J.H. (1995) Plasma fatty acid composition as an indicator of habitual dietary fat intake in middle‐aged adults. The Atherosclerosis Risk in Communities (ARIC) Study Investigators. The American Journal of Clinical Nutrition 62, 564–571. [DOI] [PubMed] [Google Scholar]
- Moilanen T., Rasanen L., Viikari J., Akerblom H.K., Ahola M., Uhari M. et al (1985) Fatty acid composition of serum cholesteryl esters in 3‐ to 18‐year‐old Finnish children and its relation to diet. The American Journal of Clinical Nutrition 42, 708–713. [DOI] [PubMed] [Google Scholar]
- Moilanen T., Rasanen L., Viikari J., Akerblom H.K. & Nikkari T. (1992) Correlation of serum fatty acid composition with dietary intake data in children and young adults. Annals of Medicine 24, 67–70. [DOI] [PubMed] [Google Scholar]
- National Institute for Health and Welfare, Nutrition Unit (2009) Fineli®– Finnish Food Composition Database.
- Nikkari T., Rasanen L., Viikari J., Akerblom H.K., Vuori I., Pyorala K. et al (1983) Serum fatty acids in 8‐year‐old Finnish boys: correlations with qualitative dietary data and other serum lipids. The American Journal of Clinical Nutrition 37, 848–854. [DOI] [PubMed] [Google Scholar]
- Nikkari T., Luukkainen P., Pietinen P. & Puska P. (1995) Fatty acid composition of serum lipid fractions in relation to gender and quality of dietary fat. Annals of Medicine 27, 491–498. [DOI] [PubMed] [Google Scholar]
- Philibert A., Vanier C., Abdelouahab N., Chan H.M. & Mergler D. (2006) Fish intake and serum fatty acid profiles from freshwater fish. The American Journal of Clinical Nutrition 84, 1299–1307. [DOI] [PubMed] [Google Scholar]
- Renaud S., De Backer G., Thevenon C., Joossens J.V., Vermylen J., Kornitzer M. et al (1991) Platelet fatty acids and function in two distinct regions of Belgium: relationship to age and dietary habits. Journal of Internal Medicine 229, 79–88. [DOI] [PubMed] [Google Scholar]
- Salo P., Viikari J., Ronnemaa T., Hamalainen M., Jokinen E., Valimaki I. et al (1997) Milk type during mixed feeding: contribution to serum cholesterol ester fatty acids in late infancy. The Journal of Pediatrics 130, 110–116. [DOI] [PubMed] [Google Scholar]
- Shahin A.M., Mcguire M.K., Anderson N., Williams J. & Mcguire M.A. (2006) Effects of margarine and butter consumption on distribution of trans‐18:1 fatty acid isomers and conjugated linoleic acid in major serum lipid classes in lactating women. Lipids 41, 141–147. [DOI] [PubMed] [Google Scholar]
- Smedman A.E.M., Gustafsson I.B., Berglund L.G.T. & Vessby B.O.H. (1999) Pentadecanoic acid in serum as a marker for intake of milk fat: relations between intake of milk fat and metabolic risk factors. American Journal of Clinical Nutrition 69, 22–29. [DOI] [PubMed] [Google Scholar]
- Stoffel W., Chu F. & Ahrens E.H. Jr (1959) Analysis of long‐chain fatty acids by gas‐liquid chromatography. Micromethod for preparation of methyl esters. Analytical Chemistry 31, 307–308. [Google Scholar]
- Sun Q., Ma J., Campos H., Hankinson S.E. & Hu F.B. (2007) Comparison between plasma and erythrocyte fatty acid content as biomarkers of fatty acid intake in US women. The American Journal of Clinical Nutrition 86, 74–81. [DOI] [PubMed] [Google Scholar]
- Uusitalo L., Nevalainen J., Niinisto S., Alfthan G., Sundvall J., Korhonen T. et al (2008) Serum alpha‐ and gamma‐tocopherol concentrations and risk of advanced beta cell autoimmunity in children with HLA‐conferred susceptibility to type 1 diabetes mellitus. Diabetologia 51, 773–780. [DOI] [PubMed] [Google Scholar]
- Vatten L.J., Bjerve K.S., Andersen A. & Jellum E. (1993) Polyunsaturated fatty acids in serum phospholipids and risk of breast cancer: a case‐control study from the Janus serum bank in Norway. European Journal of Cancer 29A, 532–538. [DOI] [PubMed] [Google Scholar]
- Virtanen S.M., Niinisto S., Nevalainen J., Salminen I., Takkinen H.M., Kaaria S. et al (2010) Serum fatty acids and risk of advanced beta‐cell autoimmunity: a nested case‐control study among children with HLA‐conferred susceptibility to type I diabetes. European Journal of Clinical Nutrition 64, 792–799. [DOI] [PubMed] [Google Scholar]
- Wolk A., Vessby B., Ljung H. & Barrefors P. (1998) Evaluation of a biological marker of dairy fat intake. The American Journal of Clinical Nutrition 68, 291–295. [DOI] [PubMed] [Google Scholar]
- Wolk A., Furuheim M. & Vessby B. (2001) Fatty acid composition of adipose tissue and serum lipids are valid biological markers of dairy fat intake in men. Journal of Nutrition 131, 828–833. [DOI] [PubMed] [Google Scholar]
- Zlatanos S.N., Laskaridis K. & Sagredos A. (2008) Conjugated linoleic acid content of human plasma. Lipids in Health and Disease 7, 34. [DOI] [PMC free article] [PubMed] [Google Scholar]