

Abstract
Beverages are selected based on availability, culture, taste preference, health, safety and social context. Beverages may be important to energy and to the macronutrient and micronutrient quality of overall intake. The aim of this study was to determine the contribution of beverages to the dietary energy and estimated macro‐ and micronutrient intake to the diet of young schoolchildren. We analyzed data from third‐ and fourth‐grade urban Guatemalan school‐children aged predominantly 8–10 years old. One‐day pictorial registries of all beverages, foods and snacks consumed over a 24‐h period were collected from children from private (n = 219) and public (n = 230) schools. Food composition nutrient values were assigned to the items consumed. Eleven main categories of beverages were identified. The contribution of each of the 11 beverage categories to energy, macro‐ and micronutrients was evaluated. The estimated intake of beverages was 475 300 mL, as reported by the 449 children. As a group, the beverage consumed in the greatest quantity was coffee (126 500 mL), followed by plain water (62 000 mL). Beverages represented a mean energy contribution of 418 ± 26 kcal (21.5% of total dietary energy). The beverages varied in energy density from 0 (water) to 1.5 kcal mL−1 (thin gruels). Beverages contributed one‐third of the dietary carbohydrate. Through the contribution of fortified drinks, beverages were important sources of vitamin A (55%), vitamin C (38%), zinc (21%) and calcium (19%). Milk was an important source for vitamin D (10%). These results show the importance of drinks to nutrition and the balance of concerns of overweight/obesity with micronutrient quality.
Keywords: water, beverage, juice, milk, energy, micronutrients, schoolchildren, 24‐h food record, childhood nutrition, Guatemala
Introduction
The first sustenance in life comes as a beverage: maternal milk. After weaning, however, beverage consumption was problematic in prehistory. Within the hunter‐gatherer lifestyle, the only beverages for drinking were the nectar of flowers, the saps beneath tree barks and the water obtained from dew condensation, rain water, snow and ice, from static collections (puddles, ponds, lakes) and from flowing sources (springs, streams, rivers). More complex beverages were presumably available to primitive men in the form of blood and other body fluids drained from their prey, and one presumes that early humans learned to squeeze the juices from succulent fruits.
With the advent of the pastoralist age, some 40 000 years ago (Simoons 1978), dairying activities yielded milk as an abundant beverage; it was consumed fresh, curdled and fermented. Moreover, sometime in cultural evolution, after the discovery of fire and the invention of cooking pots, leaves and beans were probably converted to hot infusions, the precursors of tea, coffee and chocolate drinks. With the emergence of the agricultural era, some 10 000 years ago (Cordain 1999, 2002), the domestication of grains and fruits set the stage for the fermentation of mashes and juices to produce alcoholic beverages: beers and wines.
All of these drinks of prehistory and antiquity have continued into the modern era. Home and industrial processing technology, moreover, has allowed for the emergence of a wide variety of beverage recipes, from distilled liquors and fortified wines on the alcoholic side to sweetened and flavoured drinks with still water or carbonated bases. The selection of the beverages is not only based on availability and accessibility in particular situations, but also on culture, taste preference and the social context (Rolls & Rolls 1982). A series of health (Dennison et al. 1999; Nawrot et al. 2003; Shenkin et al. 2003; Ritz & Berrut 2005; Gilbert 2006) and safety (Avery 1999; Pizarro et al. 1999; Kruawal et al. 2005; Liang et al. 2006) issues are attendant to the selection of different beverage options.
In developed countries, the pattern of beverage consumption is in continuous flux and evolution (Forshee & Storey 2003; Nielsen & Popkin 2004; Blum et al. 2005; Popkin et al. 2006). A dramatic increase in the consumption of sweetened drinks was documented over a 7‐year period from 1999 to 2006 in nationally representative surveys of Guatemala's northern neighbour, Mexico (Rivera et al. 2008). A survey in a convenience sample of schoolchildren in the western Guatemalan highlands city of Quetzaltenango (Groeneveld et al. 2007a; Vossenaar et al. 2008), employing an innovative pictorial registry of 1‐day intake of foods and drinks, provided an opportunity to evaluate beverage consumption in this Central American setting. Here we present a description of the beverage pattern and its contribution to the nutrient intake in a sample of third‐ and fourth‐grade schoolchildren aged 8–10 years from an urban setting in the Guatemalan highlands.
Key messages
-
•
This study indicates insufficient water is being consumed by Guatemalan school children. In Quetzaltenango, less than a third of the schoolchildren reported consuming water in a single 24‐h recall, raising the concern that most of these children are not sufficiently hydrated.
-
•
Drinking patterns of Guatemalan children are unique in that coffee and atoles (gruels) figure prominently; these patterns most closely resemble those found in Mexico.
-
•
In this study, school children in Guatemala were found to consume nearly one‐fifth of their total dietary energy in beverages, a finding that is consistent with studies elsewhere and underscores the potential for beverages to contribute to excess energy intake.
-
•
A policy of fortified table sugar explains both the high energy as well as the high vitamin A contribution of sugar sweetened beverages.
-
•
Water consumption should be promoted through greater availability of fresh, plain drinking water. Children should consume micronutrients, not through fortified drinks, but rather through the consumption of fresh fruits and vegetables.
Methods
Study site
The study was conducted in Quetzaltenango, the second largest city in Guatemala with a population of ∼127 600 inhabitants, and the urban area is roughly equally divided between inhabitants of Spanish and Mayan indigenous origin. The city is located 210 km south‐west from the capital and has an altitude above sea level of 2333 m with an average annual temperature of 14°C and average annual precipitation in excess of a meter.
Subjects
The general demographic aspects of recruiting the sample have been presented earlier (2007a, 2007b; Solomons et al. 2008; Vossenaar et al. 2008; Montenegro‐Bethancourt et al. 2009). In short, a total of 1124 third‐ and fourth‐grade children, mostly aged between 8 and 10 years old, were recruited from private and public elementary schools. From a list of 16 schools assembled, the first 12 consulted were willing to participate. Two hundred thirty of the children were enrolled from seven private schools catering to affluent families, and 219 from five public schools serving the majority low‐income population. The only exclusion criteria were self‐proclaimed inability to comply with instructions and the failure to present consent and assent documentation. A large proportion of children (n = 675, 60%) did not participate in the study for various reasons, such as absence on the day of data collection and ‘forgetting’ consent form or data collection booklet at home. The final sample comprised 449 (40%) children, 232 girls and 217 boys.
The Human Subjects Committee of the Center for Studies of Sensory Impairment, Aging and Metabolism (CeSSIAM) approved the protocol. Permissions were obtained from the district educational authorities of Quetzaltenango and from the directors of the individual schools. Parents or guardians signed a written informed consent form after a written explanation of the nature, purpose, inconvenience, benefits and anonymity provisions had been circulated. Children gave verbal assent for their participation. Each child received a box of crayons both as an incentive for participation and to complete the pictorial task.
Dietary intake data collection
The general dietary collections in this study have been described in detail elsewhere (Solomons et al. 2008; Vossenaar et al. 2008; Montenegro‐Bethancourt et al. 2009). Children were instructed in the procedures for a recording of their own dietary intake with a lecture from the research staff. They then received a special five‐page workbook designed for the study. The first page contained a reminder of the instructions in Spanish. The following four pages were blank sheets labelled with the Spanish terms breakfast, lunch, dinner and snacks, respectively. The participants were asked to fill in and file a registry of intake of all edible items eaten, drunk, sucked or chewed over the following 24‐h period. This was performed in a pictorial manner, depicting the consumption in graphic form on the respective sheets of the workbook. On the following day, the registry was collected by the nutritionist and reviewed with the submitting subject. The depiction of each item was clarified and quantified as it was referred on the collection form. Models of serving items were available for reference.
Registries were made during school days covering the four bridging days; school holidays and weekends were excluded. If a child had failed to comply with the request but was still interested in participation, he or she was enrolled into another cohort and given an additional opportunity to register a day's dietary intake. However, as the survey had a 14‐week time horizon, it was impossible to remain at any given school to consolidate upon all of the potential participants that might have been recruited with the luxury of more time or trained field personnel.
Quantification of mentions and volumes; energy, macro‐ and micronutrient intakes
The quantification of interest was the number of mentions of the consumption by a given child of any liquid, including drinking water and beverages. A mention was the report of consumption of an item at any mealtime or snack. If a child refilled at the same meal, it was still considered a single mention. If a child had the same item at lunch and at a snack, for instance, it was recorded as two separate mentions. The water consumers were classified as the number of draughts, the mealtimes of consumption, and volumes of water per drink and over the course of the registry day. Volume was the quantity of a beverage in mL, converted from the reported household measures. For beverages different than water, the same procedure was followed. However, one child could be a ‘non‐water consumer’ or a ‘water consumer’ and at the same time be an ‘other liquids consumer’.
For the quantification of nutrients, the energy, macronutrients and selected micronutrient content of the reported foods and beverages were primarily obtained from the food composition table (FCT) from the Institute of Nutrition of Central America and Panama (Menchú & Méndez 2000), where they are expressed per 100‐g edible portions. In the literature and in this and other FCT, beverages are reported in gravimetric units (e.g. grams), whereas in our calculations and in other comparative literature, volumetric units (e.g. mL) are used. Although it may represent a minor mathematical distortion, given the contribution of solid components to specific gravity of beverages, we converted all expressions to volumetric units, based on a convention of 1 g = 1 mL. Nutritional values for specific brands of commercial products not found in the FCT were obtained from package labels or manufacturer information. Additionally, to obtain local recipes for common home‐made beverages reported (e.g. thin gruels, fruit‐based drinks), a sub‐study was conducted. Volunteer nutrition students from a local university were asked to interview different key informers such as mothers, helpers or people involved in food preparation to fill up a questionnaire with the recipes of the most commonly consumed drinks to develop a standard recipe. For some beverages, such as coffee, which is regularly consumed but in different forms, different codes were assigned. For example: plain coffee represents the total volume with no sugar or any other item added (e.g. milk), and in this case sugar was coded separated; coffee with sugar corresponds to cases when the child expressed that it was served already sweetened, and it was assigned as recipe. Specific micronutrients, such as vitamin D, were obtained from the online USDA National Nutrient Database for Standard Reference (Gebhardt et al. 2004) (http://www.nal.usda.gov/fnic/foodcomp/data). Values for vitamin A and vitamin C contained in commercially fortified drinks were obtained from the manufacturer information on labels.
We based our classification in similar generically beverage characteristics, and 11 categories were designated. Drinks were categorized into 11 distinct classes, namely: (1) plain water; (2) infusions (coffee, sugared water, tea and herbal drinks commonly consumed with sugar); (3) dairy drinks (milk and all derivatives of cow's milk including flavoured varieties, and preparations such as milkshakes); (4) thin gruels (to include all the atole or atol varieties commonly consumed, that is mainly cereal‐based drink, warm at different mealtimes); (5) pure vegetable or fruit juices (100% fruit juices or vegetable juice, not from concentrate); (6) commercial fruit nectar (bottled, canned or packed); (7) home‐made fruit drinks (preparations are fruit‐based and sweetened with table sugar, such as lemonade or pineapple); (8) commercial fruit drinks (fruit‐flavoured packed drinks containing <100% juice and ‘powder’ drinks to be prepared); (9) carbonated sodas (all regular sodas, non‐diet carbonated beverages); (10) sports drinks; and (11) alcoholic beverages. In addition, beverage energy density, expressed as kcal per 100 mL, was calculated for each beverage item.
Milk was consumed both as a drink and part of a breakfast‐cereal serving. To estimate the specific intake of milk as ‘beverage’, a subsequent analysis was performed. From the total volume of milk and sugared milk reported (as separated items), we selected the children who reported any ready‐to‐eat cereal at any mealtime, which is the alternative form of milk consumption. Those children were analyzed separately and the quantity of milk reported used specifically for the cereal was subtracted from the total of milk reported for each specific child, and then the added individual volume from the total volume for the whole sample. The obtained value was used to estimate well the nutrient contribution from dairy to the child day‐beverage intake.
Data handling and statistical analysis
Descriptive statistics of mean and variance were generated for the volume of all beverage water recorded in the 24‐h registry for the entire sample population (n = 449). To estimate the dietary contribution of beverages to the daily intake for each nutrient, the beverage items were separated from the total food articles. Beverage contribution was estimated for energy, protein, fat and carbohydrates. Specific micronutrients, which were evaluated, included vitamin A, vitamin C, vitamin D, thiamine, riboflavin, folate, calcium, iron and zinc. Descriptive statistics were performed on the contribution of the various nutrients derived from beverages for each individual registration day. Despite a non‐Gaussian distribution for most nutrients across the sample, these statistics have been expressed as the arithmetic mean and standard deviation, as well as the median. Because of the extreme skewness of the distributions, the geometric means could not be computed. To calculate the relative contribution of beverage sources to the total intake of nutrients across the sample, the cumulative sum of nutrients in the beverage and non‐beverage items was tabulated as numerator and denominator, respectively, and expressed as a percentage. Main sources for each specific nutrient were based on mean intakes and the contribution to total intake of a specific nutrient. All analyses were completed using SPSS 11.0 (SPSS Inc., Chicago, IL, USA). Here, we have consciously eschewed gender and socio‐economic subgroup analyses and comparisons, and limit our description to the aggregate behaviour of the whole combined sample, given the enormity of text and illustrative materials that would be needed to achieve both in a single publication.
Results
Participation in consumption of the beverages
From a total of 247 food items recorded, 54 (22%) were beverages. The individually coded items and classification used for primary analyses are listed in Appendix 1. For each of the items, the number of consumers, number of separate mentions and cumulative volume consumed, across the 449 1‐day records, are shown. The number of consumers for the 10 beverages attracting the most participants, in descending order, was: (1) coffee with sugar (n = 267); (2) plain water (n = 126); (3) brand T artificial drink (n = 96); (4) brand P cola (n = 49); (5) lemonade (n = 46); (6) fluid milk with sugar (n = 43); (7) orange juice (n = 41); (8) tea and herbal drinks with sugar (n = 40); (9) plain coffee (n = 40); and (10) unflavoured whole (full‐fat) milk (n = 38). The fraction of the population that consumed sweetened coffee was 59.5%. Combining that group with those who reported to consume plain coffee and those who consume sweetened coffee with milk produced a cumulative total for coffee consumers of 310 (69.0%). The beverage with the second highest number of consumers was plain water (28.1%).
Frequency of drinking
For the total 449 1‐day registries, 1608 draughts (mentions) of beverages were recorded. The average number of mentions of beverages was 4.1 ± 1.1 drinks per individual on the collection day, with a median of 4.0 and a range of 1.0–8.0. The partition of the beverage classes in terms of the respective percentages of mentions is illustrated in Fig. 1. Infusions category lead at 35%, followed by thin gruels and commercial fruit drinks tied at 13%; plain water was the fourth most frequently drunk among the group categories. When the frequency of mentions was analyzed on the basis of individually coded items, the leading 10 items were: (1) coffee with sugar (402); (2) plain water (170); (3) brand T artificial drink (109); (4) oatmeal gruel (74); (5) lemonade (53); (6) unsweetened coffee (52); (7) brand P cola (51); (8) unsweetened fluid milk (45); (9) fluid milk with sugar (44); and (10) tea drinks with sugar (44) (Appendix 1). Drinking coffee with sugar constituted one‐fourth of the beverage‐taking behaviour in our sample.
Figure 1.
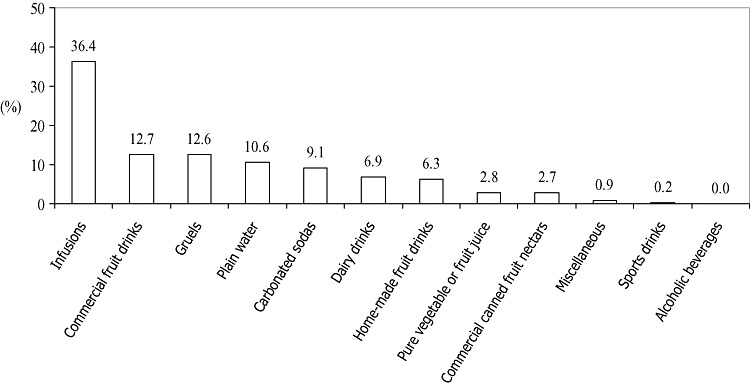
Mentions of beverages classified into 12 categories based on 449 1‐day registries, presented as percentage of total mentions.
Volume of consumption of the beverages
The cumulative volumes of the 11 operative beverage classes identified in Appendix 1 are presented in Table 1. Infusions, which included coffee, tea and chocolate drink from tablet, over‐represented 163 L of intake. There was, fortunately, no representation of alcoholic beverages in these schoolchildren. The relative contribution of items as percentages of the total 475.3 L consumed is illustrated in Fig. 2. Using individual data, the aggregate arithmetic mean was 1058 ± 438 mL, with a median of 980 mL and a range of 236–3680 mL.
Table 1.
Volume of reported beverages by category in descending order, from 449 1‐day registries and their energy density range
| Rank order | Beverage category | Volume* | Energy density |
|---|---|---|---|
| (mL) | (kcal 100 mL−1) | ||
| 1 | Infusions | 163 400 | 2–114 |
| 2 | Commercial fruit‐flavoured drinks † | 65 400 | 25–44 |
| 3 | Plain water | 62 000 | 0 |
| 4 | Thin gruels | 51 500 | 41–151 |
| 5 | Carbonated sodas | 41 200 | 41–48 |
| 6 | Home‐made fruit drinks | 33 000 | 48–68 |
| 7 | Dairy drinks | 27 900 | 65–120 |
| 8 | Commercial canned fruit nectars | 13 300 | 51 |
| 9 | Pure vegetable/fruit juices | 13 000 | 30–40 |
| 10 | Miscellaneous | 3 900 | 41–90 |
| 11 | Sport drinks | 800 | 25 |
| Total | 475 300 |
All volume values were rounded off to the nearest 100 mL.
† Commercial fruit‐flavoured drinks include powder drinks prepared at home and sweetened packed beverages with a small percentage of fruit or flavouring.
Figure 2.
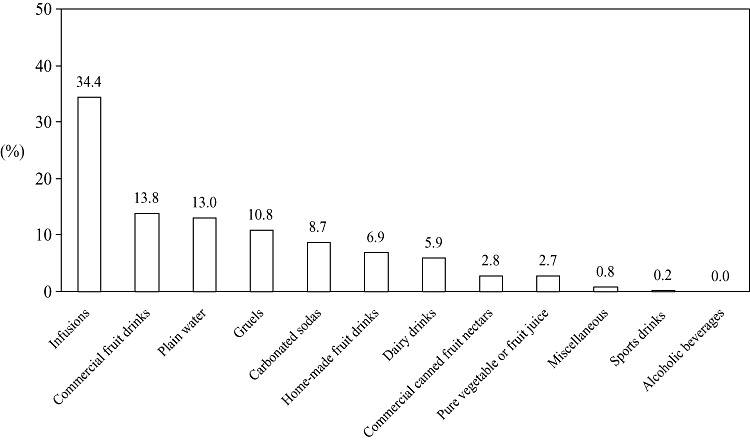
Volume of beverages classified into 12 categories based on 449 1‐day registries, presented as the percentage of total volume.
In addition to the ranking by classes of beverages, the relative contribution of individual beverage items to the recorded consumption by the sample was examined. The top 10, in descending order, were: (1) coffee with sugar (106 200 mL); (2) plain water (62 000 mL); (3) brand T artificial drink (35 300 mL); (4) lemonade (18 000 mL); (5) brand Ta fruit drink (16 800 mL); (6) brand P cola (16 600 mL); (7) sugared water (16 500 mL); (8) oatmeal gruel (16 400 mL); (9) brand C cola (14 900 mL); and (10) plain coffee (12 600 mL) (Appendix 1).
Variety of beverages
The variety in the consumption of individual beverage items was examined in the individual child by day and by mealtime. The mean number of different beverage items reported in the 449 daily registries was 3.4 ± 1.1, ranging from one to seven items across the population.
The 10 leading beverages reported at the four specific mealtimes of interest are presented in Table 2. There is a recognizable and not unexpected pattern of aggregation. In terms of hot and cold beverages, only water and orange juice were served exclusively chilled or at room temperature at breakfast; by custom, the remaining eight items in the dairy, infusion or gruel classes would be served hot or warm in the morning. By contrast, for lunch and snacks, the beverages preferred are of the chilled, refreshing varieties, with the notable exceptions of coffee and oatmeal gruel. The leading dinner drinks represent a serving‐temperature balance with coffee, tea and gruels, which would be consumed hot, alongside water, milk, sodas and sugar‐sweetened water, which by convention would be consumed chilled or at room temperature with the evening meal.
Table 2.
Most frequently consumed beverage items in descending order by mealtime
| Mealtime | |||
|---|---|---|---|
| Breakfast | Lunch | Dinner | Combined snacks |
| Coffee with sugar* | Fruit‐flavoured powdered drink brand To * | Coffee with sugar* | Plain water |
| Milk with sugar* | Plain water | Plain water | Coffee with sugar* |
| Fluid whole milk | Lemonade* | Fluid whole milk | Brand F packed fruit juice* |
| Plain water | Vitamin‐fortified fruit drink brand Ta * | Coffee † | Brand P cola* |
| Incaparina gruel* | Brand P cola* | Milk with sugar* | Oatmeal gruel* |
| Orange juice | Coffee with sugar* | Herbal drinks or tea with sugar* | Brand S fruit‐flavoured drink* |
| Oatmeal gruel* | Brand C cola* | Sweetened water* | Non‐cola carbonated soda* |
| Coffee † | Sweetened water* | Non‐cola carbonated sodas* | Maize gruel* |
| Herbal drinks or tea with sugar* | Pineapple drink* | Incaparina gruel* | Brand C cola* |
| Hot chocolate drink from tablet* | Coffee with sugar and milk* | Fluid whole milk | |
Sweetened drinks to which sugar was added during processing or preparation at home.
† Sweetened drinks to which sugar was added at the table.
Contribution of beverages to total diet
Different classes of beverages have different energy densities, as illustrated in Table 1. Assorting all 54 individual items by their energy density, we illustrate the top 20 most energy‐dense beverages (Table 3). Plantain gruel was the most energy dense at 151 kcal per 100 mL. These 20 items represented only 4 of 11 beverage categories, namely thin gruels, infusions, dairy drinks and home‐made fruit drinks, in addition to canned nutritional supplements that are classified as miscellaneous. The energy density of all of the remaining 34 beverage items fell below 54 kcal 100 mL−1.
Table 3.
Energy density of the 20 most energy‐dense drinks in descending order
| Rank order | Beverage* | Energy density † (kcal 100 mL−1) |
|---|---|---|
| 1 | Plantain gruel ‡ | 151 |
| 2 | Nutritive beverage (Incaparina) ‡ , § | 139 |
| 3 | Egg‐nog (alcohol‐free) | 120 |
| 4 | Chocolate drink from tablet | 114 |
| 5 | Rice and chocolate gruel ‡ | 112 |
| 6 | Banana milkshake | 107 |
| 7 | Nutritional formula brand E | 90 |
| 8 | Sweet corn gruel (atole de elote) ‡ | 89 |
| 9 | Fluid whole milk with sugar | 88 |
| 10 | Rice and milk gruel ‡ | 78 |
| 11 | Maize gruel (atole de masa) ‡ | 75 |
| 12 | Rice‐based drink (Horchata) | 74 |
| 13 | Chocolate milk, commercial | 72 |
| 14 | Flavoured milk, strawberry or vanilla | 72 |
| 15 | Tamarind drink | 68 |
| 16 | Fluid whole milk | 65 |
| 17 | Pineapple drink | 59 |
| 18 | Corn‐based gruel (atole de pinole) ‡ | 55 |
| 19 | Blackberry drink | 55 |
| 20 | Cream of wheat gruel ‡ | 54 |
The Spanish name was added in brackets.
† The density can vary depending on the recipe. Density was estimated based on local home recipes as described in the Methods section.
‡ Gruels were included as beverages.
§ Incaparina is the brand name for a popular plant‐based fortified beverage.
Beverages consumed on the day of record provided approximately one‐fifth of total daily energy, as compared with that obtained from the non‐beverage (food) items reported in the sample (Table 4). The contribution of all carbohydrates was more than one‐third. Obviously, protein and fat were relatively under‐represented as macronutrient classes, with over 90% of these coming from foods.
Table 4.
Mean energy and nutrient value of all beverages consumed over 449 registries and their contribution to the total diet
| Nutrient | Mean ± SD | Median | Beverage per cent contribution (%)* | Non‐beverage per cent contribution (%)* |
|---|---|---|---|---|
| Energy (kcal) | 418 ± 255 | 371 | 21.5 | 78.5 |
| Protein (g) | 6 ± 8 | 2 | 8.4 | 91.6 |
| Fat (g) | 4 ± 6 | 1 | 6.2 | 93.8 |
| Carbohydrates (g) | 93 ± 56 | 84 | 31.3 | 68.7 |
| Vitamin A (RAE) | 513 ± 405 | 444 | 55.2 | 44.8 |
| Vitamin C (mg) | 35 ± 62 | 2 | 37.5 | 62.5 |
| Vitamin D (µg) | 0.4 ± 0.7 | 0 | 15.3 | 84.7 |
| Thiamine (mg) | 0.1 ± 0.4 | 0 | 14.6 | 85.4 |
| Riboflavin (mg) | 0.3 ± 0.4 | 0 | 7.3 | 92.7 |
| Folate (DFE) | 25 ± 40 | 6 | 10.6 | 89.4 |
| Calcium (mg) | 156 ± 222 | 38 | 19.4 | 80.6 |
| Iron (mg) | 2.1 ± 3.0 | 1 | 14.7 | 85.3 |
| Zinc (mg) | 1.8 ± 3.5 | 0 | 21.2 | 78.8 |
RAE, retinol activity equivalent; DFE, dietary folate equivalent. *Percentage contributions were calculated based on the cumulative sum of consumption of all beverage items reported and all non‐beverages reported.
The beverages contributed variously to the total micronutrient intake of the population on their diet‐registry day. More than half of the estimated vitamin A intake came from beverages, partly explained by sugar table fortification. Over 35% of vitamin C intake was drunk, rather than eaten. The comparable fraction for calcium and zinc was 20% in the whole sample's diet. Riboflavin was the micronutrient with the highest dependence on the food items consumed.
The top five beverage sources of the six vitamins and the three minerals of interest are illustrated in Table 5. Of note is the nature of the drinks heading the list of vitamin A; all five are sweetened beverages with added sugar and they represent one‐third of the total intake. Vitamin C came through natural and fortified fruit drinks in first instance, followed by dairy and plantain. Dairy drinks logically dominated the vitamin D column. Dairy, fruit and grain gruel items shared the contribution to folate to the diet. Although 54 beverage items were of interest, only the first three sources had measurable contributions of vitamin D, thiamine or riboflavin. Dairy and gruel items dominated the calcium contribution (>12%). For iron and zinc, two fortified gruels headed the list; each provided more than 3% of these nutrients to the diet, and in the case of zinc, just the Incaparina gruel contributed 10% of zinc intake.
Table 5.
Top five beverage sources of selected micronutrients in the sample population (n = 449)
| 1 | 2 | 3 | 4 | 5 | ||||||
|---|---|---|---|---|---|---|---|---|---|---|
| Beverage | % | Beverage | % | Beverage | % | Beverage | % | Beverage | % | |
| Vitamin A | Coffee with sugar | 15 | Lemonade | 5 | Fruit‐flavoured powdered drink | 5 | Vitamin‐fortified fruit drink brand Ta | 4 | Incaparina gruel* | 3 |
| Vitamin C | Natural orange juice | 16 | Fruit nectar brand D | 8 | Commercial fruit‐flavoured drink | 5 | Lemonade | 2 | Fruit nectar brand K | 2 |
| Vitamin D | Fluid whole milk with sugar | 5 | Fluid whole milk | 5 | Rice and milk gruel | 5 | Banana milkshake | 1 | Coffee with sugar and milk | <1 |
| Thiamine | Incaparina gruel* | 8 | Oatmeal gruel | 3 | Natural orange juice | 2 | Nutritional formula brand E | <1 | Instant oatmeal drink | <1 |
| Riboflavin | Incaparina gruel* | 2 | Fluid whole milk with sugar | 3 | Fluid whole milk | 1 | Oatmeal gruel | 1 | Rice and milk gruel | <1 |
| Folate | Oatmeal gruel | 4 | Natural orange juice | 3 | Fluid whole milk with sugar | <1 | Fluid whole milk | <1 | Plantain gruel | <1 |
| Calcium | Fluid whole milk with sugar | 5 | Fluid whole milk | 4 | Incaparina gruel* | 3 | Rice and milk gruel | 2 | Banana milkshake | <1 |
| Iron | Incaparina gruel* | 5 | Oatmeal gruel | 3 | Natural orange juice | 1 | Maize gruel | 1 | Hot chocolate drink from tablet | <1 |
| Zinc | Incaparina gruel* | 10 | Oatmeal gruel | 4 | Maize gruel | 2 | Fluid whole milk with sugar | 1 | Fluid whole milk | 1 |
Incaparina is the brand name for a popular plant‐based fortified beverage.
Discussion
For reasons related to hydration and health, patterns of consumption of liquids in the diet have been gaining increasing interest in clinical medicine and public health. Numerous reports of beverage consumption patterns based on national surveys (Nielsen & Popkin 2004; Popkin et al. 2006; Rivera et al. 2008), including some with an isolation on the juvenile segments (Forshee et al. 2006; Storey et al. 2006), have recently been published. Reports have also circulated about selection of beverages among specific, non‐representative samples of children in developed countries (Forshee & Storey 2003; Blum et al. 2005; Forshee et al. 2006). When monitored serially, patterns of beverage consumption generally appear to be in rapid transition, such as the instances of the US (Popkin et al. 2006) and Mexican (Rivera et al. 2008) populations. For children in a developing country, descriptive examinations of beverage selection and consumption are scarce, if not non‐existent. The issue of assortment and hierarchy of beverage consumption by schoolchildren focus us on a neglected area of scholarship, while providing a basis for examining change. Our age group of interest has additional relevance insofar as long‐term health and nutrition may be influenced by the preferences and dislikes set early in life (Benton 2004; Dehghan et al. 2005). Finally, diet descriptions provide leverage into ways in which remedial meal planning and educational interventions might be implemented to promote more beneficial eating and drinking patterns for later life.
Traditional themes in beverage consumption
As shall be illustrated later, the hierarchy of consumption for these schoolchildren in the Guatemalan highlands does not parallel the patterns currently reported for industrialized nations. This attests in part to the persistency of cultural consistencies deeply rooted in traditions of Guatemalan cuisine. First, the distribution of drinks in relationship to meals has a credible cultural pattern. It is not surprising, for instance, that hot beverages such as coffee and warm milk are reported predominantly at the morning breakfast, whereas cool, refreshing beverages such as artificial fruit drinks and plain water are reported at lunch time. With coffee and drinking water as the two primary choices for dinner and snacks, we can surmise that the temperature of the beverages shows no consistency within these two repasts. Other aspects of the Mesoamerican geography and tradition, moreover, are reflected in the present observations. Given the reluctance in Western nations to offer coffee as a beverage before adolescence, it might come as a surprise that children below 12 years have such universal participation in drinking large amounts of coffee. However, Guatemala is one of the major coffee‐growing and exporting countries, with an annual production of 217 000 metric tonnes (ANACAFE 2008). Our earlier studies (1997a, 1997b; Engle et al. 1999) indicate that even toddlers commonly drink coffee, such that its predominance as the leading beverage here, consistently consumed as a beverage by schoolchildren from Quetzaltenango, is not the cool refrigerated drink of the US tradition, but served warm, and again, sugar‐sweetened. Milk ranked below thin gruels (atoles), which originated with a maize drink but also embrace other grains, seeds and plantain. A commercial maize‐soy blend, Incaparina, was a landmark commercial gruel. Lastly, home‐made fruit drinks (licuados), prepared from whole fruits in a blender and sweetened with sugar, also have an important contribution to the drink options. All four of these examples of culturally rooted beverages, uncommon in their format in industrialized countries, are drunk sweet.
Modernization themes in beverage consumption
For discussion of the relationship of beverage patterns and the obesity epidemic, sweetened beverages other than those with firm cultural roots in Guatemala have been mentioned in the international literature. These include the constellation of carbonated sodas; sweetened, artificially‐flavoured fruit drinks; and even natural fruit juices. The conclusions from the literature are mixed (James & Kerr 2005; Dietz 2006; Gill et al. 2006; Malik et al. 2006; O'Connor et al. 2006; Striegel‐Moore et al. 2006; Gibson & Neate 2007; Johnson et al. 2007; Sanigorski et al. 2007). For instance, O'Connor et al. (2006) could find no association between milk or sweetened‐drink consumption and body composition in a secondary analysis of the data from the National Health and Nutrition Examination Survey (NHANES) 1999–2002. Meanwhile, Gibson and Neate (2007), in a nationally representative sample of British children, aged 7–18 years, confirmed these observations; general overeating and sedentary habits best explained body composition. Two longitudinal, cohort studies, however, illustrate the continued bases for controversy. In a cohort study of Black and White adolescents followed for a decade in the USA, the specific consumption of carbonated sodas increased with age, explained energy intake and was associated with body mass index (BMI) (Striegel‐Moore et al. 2006). The consumption between 5 and 7 years by British children failed to predict fatness at age 9 years, but an increased consumption of low‐calorie beverages by heavier children was, in fact, seen as an adaptation to control their overweight status (Johnson et al. 2007).
The setting for the present study, Quetzaltenango city, has already been identified, from the present population, as a situation of nutritional transition (2007a, 2007b). Obesity and overweight are on the verge of reaching a problematic prevalence among the higher socio‐economic sectors of the juvenile population (Groeneveld et al. 2007b). How sweetened beverages might be associated to body composition in this setting is an emergent question.
The quantitative intake and qualitative inter‐relationships among the beverage selections for this schoolchild population can be appreciated from the hierarchical tabulation presented in Table 1. Differential classification of beverage groups among authors hampers strict comparison with other survey results in the literature. What is discernable from published reports, however, is generally more dissimilar, than similar, to the Quetzaltenango pattern. There is a stark contrast for these children and juvenile patterns recorded in the Western countries, in which milk and dairy drinks, carbonated sodas and juices were generally among the most prominent drinks (Forshee & Storey 2003; Blum et al. 2005; Forshee et al. 2006; O'Connor et al. 2006). Here, the traditional beverages discussed earlier overbalanced such modern elements. The closest resemblance to another setting is that with the beverage pattern of the Mexican population at large (Rivera et al. 2008), insofar as coffee and atoles figure prominently. This is not surprising given the proximity of the two countries.
Beverage contribution to dietary energy
From the foregoing discussion, we can conclude that beverage selection, still inclined towards those rooted in Guatemala, characterized the Quetzaltenango pattern. Notwithstanding the cultural origins, however, most of the drinks consumed by this sample of schoolchildren were sweetened. They accounted for 21.5% of total dietary energy, which compares almost exactly with the 21.0% documented by Nielsen and Popkin (2004) for the US NHANES and the 21.0% found in the 2007 National Mexican Survey (Rivera et al. 2008), both for persons across all ages. Storey et al. (2006) stratified energy contribution from beverages in the USA from the NHANES survey by age groups. For a comparable age group as out sample, about 17% of energy was beverage‐derived.
Beverage contribution to micronutrient adequacy
If the solid and semi‐solid elements of a diet were sufficiently micronutrient dense, beverages would not have to be relied upon as major sources of vitamins and minerals. This latter mission, however, might be a challenge too for vitamin D, insofar as dairy products, such as cow's milk, are commonly the major sources of this vitamin (Cotton et al. 2004). As seen in Quetzaltenango, moreover, nutrient‐contributor beverages are common, and the beverage component of the diet holds up its end as a factor in fulfilling micronutrient adequacy for the diet as a whole. The participation of fortification turns out to be an important feature. This begins again with sweetened drinks, those sweetened to taste at household level, with the notably liberal addition of granulated table sugar. As a public health measure, the sugar of Guatemala has been fortified with 10 mg of vitamin A as retinyl palmitate per kilogram of granulated sugar (Krause et al. 1998; Dary & Mora 2002). The sugar from beverages alone fulfils the established recommended daily vitamin A intake for this age group.
The sector of fruit‐flavoured drinks has a burgeoning market. Vitamin C has long been a common additive in beverages with a fruit motif, both artificial and containing natural fruit. More recently, nutrients such as iron and zinc have become fortificants in this beverage class. Allen et al. (2006) have termed this process as ‘market‐driven’ fortification. It often has little or no relationship to the endemic public health deficits in the diets of the locality and is as likely not to contribute to excessive intake of a given vitamin or mineral, even in a low‐income setting.
Consumption of plain water
Drinking water is the quintessential calorie‐free, micronutrient‐free beverage. It has been lamented that plain water intake is rarely captured in dietary survey research (Fulgoni 2007). The freehand, pictorial depiction of the dietary intake possibly favoured recording of information on consumption of plain water. In dramatic contrast to the North American population in which 87% of respondents from 2 years and older reported consumption of at least some drinking water on their day of dietary recall (Popkin et al. 2005), only one‐third as many schoolchildren of Quetzaltenango had consumed this beverage. Stookey (2001), in China, identified an inverse association between water consumption and BMI. The response to the concern about obesogenic consequences of energy‐dense drinks has been a call to increase the consumption of low‐energy and no‐energy beverages. Insofar as plain water is not only energy‐free, but virtually nutrient‐free as well, the considerations in the beverages' sources for micronutrients previously presented are of note. Substitution of water for sweetened beverages in these children's diets could have implications for continued maintenance of micronutrient adequacy for selected vitamins and minerals.
Strengths and limitations of the study
This study has a number of strengths and limitations. By convention, FCTs use gravimetric expression (per 100 g of edible portion), whereas individuals report beverages in volumetric liquid household measures (ounces or cups converted to millilitres). We recognize a mathematical consideration regarding our assumption equivalency, which was made regarding the weight and volume expressions of beverages. Our presentation in litres and millilitres is consistent with the subjects' reports. We acknowledge, however, some slight and variable degree of over‐estimation of macro‐ and micronutrient contents and contributions because of a differential impact of solid components in beverages to the specific gravity.
It is a stratified convenience sample that does not reflect the socio‐economic make‐up of the community as a whole, over‐representing the higher socio‐economic class. It was our hope, however, that we would capture the variety in the pattern by blending the polar social classes. Self‐reporting recalls of diet are problematic at any age, and potentially more so at younger ages. Experts in juvenile nutrition, however, have expressed favourable disposition towards the information obtained by recall in children (Livingstone & Robson 2000; Baxter et al. 2006). Our prospective, 24‐h pictorial method has not been strictly validated against conventional recall for obvious logistical reasons, but it was devised with the notion of reducing errors of omission in registry of diet. A pictorial approach in children has been favourably reviewed (Pridmore & Bendelow 1995; Moore et al. 2007). As the assignment to record intake came home from school, although it was not an official schoolwork, parents may have viewed it as a homework; our process did not allow any assessment of the degree of parental participation in depicting intake. There are acknowledged errors in the 24‐h recall with regard to accurately capturing energy and micronutrient intakes (Dodd et al. 2006).
Given the traditional exclusion of plain water intake in survey design (Fulgoni 2007), a method that allows and favours reporting drinking water provided a special opportunity. Plain water, however, could have been under‐reported, especially for casual intake from sources such as drinking fountains, garden hoses or faucets, which would be impossible to depict graphically.
Conclusions
Attention to the beverage selection consumed by schoolchildren in developing countries is long overdue given the potentially beneficial and detrimental influences that the liquid portion of the diet can exert on hydration, nutrition, body composition and long‐term health. In the provincial capital in the Western Highlands of Guatemala, we find an extensive array of different beverage classes and individual drinks consumed by 8–10‐year‐olds in public and private schools. Beverages deeply rooted in the economy and traditions of Guatemala are among the leading selections even in the new millennium. Although carbonated soda is still low in rank, other pre‐sweetened beverages of commercial manufacture are becoming a major part of the drink selection and energy sources for this community. The one‐fifth contribution to total dietary energy of beverages is in line with the entire US (Nielsen & Popkin 2004) and Mexican (Rivera et al. 2008) survey populations; plain water, however, is much below that of these two surveys.
Source of funding
Funding for parts of the project data collection and analysis was provided by Task‐Force Sight and Life of Basel, Switzerland, and the American Institute of Cancer Research of Washington, DC. This research was a collaborative partnership between CeSSIAM and the Vrije Universiteit of Amsterdam. Funds for the analyses reported in this article were provided for the VittelWaters, France.
Conflicts of interest
No conflicts of interest have been declared.
Acknowledgements
We thank the local education authorities and participant schools for approving and collaborating with the execution of the project. Special thanks to Dr J. Seidell, Department of Health Sciences, Vrije Universiteit of Amsterdam, for the collaboration with CeSSIAM. Finally, we thank the parents of the children for authorizing their children's participation, and to the children for their enthusiasm and willingness to participate in the study.
Table 6.
Appendix. Individual beverage item as identified and disaggregated from the 449 one‐day registries collected, and grouped into 11 operative beverage classes. The total number of beverages and the cumulative population‐wide volume are reported
| Group Classification | Consumers | Mentions | Volume (mL) |
|---|---|---|---|
| PLAIN WATER | |||
| Plain water | 126 | 170 | 62 000 |
| INFUSIONS | |||
| Sugared water | 25 | 27 | 16 480 |
| Barley water with sugar | 3 | 3 | 720 |
| Tea, herbal drinks with sugar | 40 | 44 | 11 760 |
| Hibiscus drink | 5 | 5 | 1 750 |
| Coffee unsweetened | 40 | 52 | 12 600 |
| Coffee with sugar | 267 | 402 | 106 200 |
| Coffee with sugar and milk | 27 | 29 | 7 680 |
| Hot chocolate drink from tablet | 20 | 23 | 6 180 |
| DAIRY DRINKS | |||
| Fluid whole milk | 38 | 45 | 10 500 |
| Fluid whole milk with sugar | 43 | 44 | 11 280 |
| Eggnog (alcohol‐free) | 1 | 1 | 240 |
| Chocolate milk (commercial) | 6 | 6 | 1 440 |
| Flavoured milk (strawberry, vanilla) | 5 | 5 | 1 180 |
| Banana milkshake | 10 | 10 | 3 250 |
| THIN GRUELS | |||
| Nutritive beverage Incaparina | 32 | 34 | 10 200 |
| Sweet corn gruel (atole de elote) | 2 | 2 | 480 |
| Plantain gruel | 14 | 15 | 3 840 |
| Rice and chocolate gruel | 1 | 1 | 240 |
| Rice and milk gruel | 27 | 29 | 7 680 |
| Cornstarch gruel | 1 | 1 | 240 |
| Maize gruel (atole de masa) | 38 | 38 | 10 500 |
| Corn‐based gruel (pinol) | 1 | 1 | 240 |
| Oatmeal gruel | 32 | 74 | 16 420 |
| Cream of wheat gruel | 7 | 7 | 1 680 |
| PURE VEGETABLE OR FRUIT JUICES | |||
| Natural carrot juice | 2 | 2 | 750 |
| Natural orange juice | 41 | 43 | 12 250 |
| COMMERCIAL FRUIT NECTARS | |||
| Fruit nectar brand D | 28 | 28 | 9 860 |
| Fruit nectar brand K | 9 | 10 | 2 250 |
| Fruit juice brand J | 2 | 2 | 400 |
| Fruit juice brand F | 4 | 4 | 800 |
| HOME MADE FRUIT DRINKS | |||
| Blackberries drink | 11 | 11 | 3 750 |
| Mango drink | 3 | 3 | 1 000 |
| Melon drink | 2 | 2 | 500 |
| Papaya drink | 6 | 6 | 2 000 |
| Pineapple drink | 15 | 15 | 4 250 |
| Star fruit drink | 1 | 1 | 250 |
| Watermelon drink | 1 | 1 | 250 |
| Tamarind drink | 7 | 7 | 2 000 |
| Lemonade | 46 | 53 | 18 000 |
| Orangeade | 3 | 3 | 1 000 |
| COMMERCIAL FRUIT FLAVORED DRINKS | |||
| Artificial packed drink brand C | 28 | 28 | 7 788 |
| Artificial packed drink S | 8 | 8 | 1 600 |
| Juice fruit artificial flavour | 19 | 19 | 4 000 |
| Fortified fruit drink, brand Ta | 36 | 40 | 16 750 |
| Brand T artificial drink | 96 | 109 | 35 250 |
| CARBONATED SODAS | |||
| Cola, brand C | 36 | 42 | 14 900 |
| Cola, brand P | 49 | 51 | 16 600 |
| Non‐cola carbonated sodas | 32 | 33 | 9 660 |
| SPORTS DRINKS | |||
| Gatorade | 4 | 4 | 800 |
| ALCOHOLIC BEVERAGES | |||
| None | 0 | 0 | 0 |
| MISCELLANEOUS | |||
| Rice‐based drink (Horchata) | 6 | 8 | 2 500 |
| Instant oatmeal drink | 3 | 3 | 750 |
| Fruit‐flavoured soy drink | 1 | 1 | 250 |
| Nutritional formula brand E | 2 | 3 | 350 |
References
- Allen L.H., De Benoist B., Dary O. & Hurrell R. (2006) Guidelines for Food Fortification with Micronutrients. World Health Organization: Geneva. [Google Scholar]
- ANACAFE (2008) Association of Coffee Growers of Guatemala. Available at: http://portal.anacafe.org/portal (accessed 9 September 2008).
- Avery A.A. (1999) Infantile methemoglobinemia: reexamining the role of drinking water nitrates. Environmental Health Perspectives 107, 583–586. [DOI] [PMC free article] [PubMed] [Google Scholar]
- Baxter S.D., Smith A.F., Nichols M.D., Guinn C.H. & Hardin J.W. (2006) Children's dietary reporting accuracy over multiple 24‐hour recalls varies by body mass index category. Nutrition Research 26, 241–248. [DOI] [PMC free article] [PubMed] [Google Scholar]
- Benton D. (2004) Role of parents in the determination of the food preferences of children and the development of obesity. International Journal of Obesity and Related Metabolic Disorders 28, 858–869. [DOI] [PubMed] [Google Scholar]
- Blum J.W., Jacobsen D.J. & Donnelly J.E. (2005) Beverage consumption patterns in elementary school aged children across a two‐year period. Journal of the American College of Nutrition 24, 93–98. [DOI] [PubMed] [Google Scholar]
- Cordain L. (1999) Cereal grains: humanity's double‐edged sword World Review of Nutrition and Dietetics 84, 19–73. [DOI] [PubMed] [Google Scholar]
- Cordain L. (2002) Fatty acid composition and energy density of foods available in African hominids: evolutionary implications for human brain development In: Metabolic Studies in Health and Disease (eds Simopoulos A.P. & Pavlou K.N.), pp 144–161. Karger: Basel, Switzerland. [DOI] [PubMed] [Google Scholar]
- Cotton P.A., Subar A.F., Friday J.E. & Cook A. (2004) Dietary sources of nutrients among US adults, 1994 to 1996. Journal of the American Dietetic Association 104, 921–930. [DOI] [PubMed] [Google Scholar]
- Dary O. & Mora J.O. (2002) Food fortification to reduce vitamin A deficiency: International Vitamin A Consultative Group recommendations. The Journal of Nutrition 132, 2927S–2933S. [DOI] [PubMed] [Google Scholar]
- Dehghan M., Akhtar‐Danesh N. & Merchant A.T. (2005) Childhood obesity, prevalence and prevention. Nutrition Journal 2, 4–24. [DOI] [PMC free article] [PubMed] [Google Scholar]
- Dennison B.A., Rockwell H.L., Nichols M.J. & Jenkins P. (1999) Children's growth parameters vary by type of fruit juice consumed. Journal of the American College of Nutrition 18, 346–352. [DOI] [PubMed] [Google Scholar]
- Dewey K.G., Romero‐Abal M.E., Quan de Serrano J., Bulux J., Peerson J.M., Eagle P. et al. (1997a) A randomized intervention study of the effects of discontinuing coffee intake on growth and morbidity of iron‐deficient Guatemalan toddlers. The Journal of Nutrition 127, 306–313. [DOI] [PubMed] [Google Scholar]
- Dewey K.G., Romero‐Abal M.E., Quan de Serrano J., Bulux J., Peerson J.M., Eagle P. et al. (1997b) Effects of discontinuing coffee intake on iron status of iron‐deficient Guatemalan toddlers: a randomized intervention study. The American Journal of Clinical Nutrition 66, 168–176. [DOI] [PubMed] [Google Scholar]
- Dietz W.H. (2006) Sugar‐sweetened beverages, milk intake, and obesity in children and adolescents. The Journal of Pediatrics 148, 152–154. [DOI] [PubMed] [Google Scholar]
- Dodd K.W., Guenther P.M., Freedman L.S., Subar A.F., Kipnis V., Midthune D. et al. (2006) Statistical methods for estimating usual intake of nutrients and foods: a review of the theory. Journal of the American Dietetic Association 106, 1640–1650. [DOI] [PubMed] [Google Scholar]
- Engle P.L., VasDias T., Howard I., Romero‐Abal M.E., Quan de Serrano J., Bulux J. et al. (1999) Effects of discontinuing coffee intake on iron deficient Guatemalan toddlers' cognitive development and sleep. Early Human Development 53, 251–269. [DOI] [PubMed] [Google Scholar]
- Forshee R. & Storey M. (2003) Total beverage consumption and beverage choices among children and adolescents. International Journal of Food Sciences and Nutrition 54, 297–307. [DOI] [PubMed] [Google Scholar]
- Forshee R.A., Anderson P.A. & Storey M.L. (2006) Changes in calcium intake and association with beverage consumption and demographics: comparing data from CSFII 1994–1996, 1998 and NHANES 1999–2002. Journal of the American College of Nutrition 25, 108–116. [DOI] [PubMed] [Google Scholar]
- Fulgoni V. (2007) Limitations of data on fluid intake. Journal of the American College of Nutrition 26, 588S–591S. [DOI] [PubMed] [Google Scholar]
- Gebhardt S.E., Howe J.C., Lemar L.E., Haytowitz D.B., Pehrsson P.R. et al (2004) USDA nutrient database for standard reference, release no. 16. Available at: http://www.nal.usda.gov/fnic/foodcomp.
- Gibson S. & Neate D. (2007) Sugar intake, soft drink consumption and body weight among British children: further analysis of National Diet and Nutrition Survey data with adjustment for under‐reporting and physical activity. International Journal of Food Sciences and Nutrition 58, 445–460. [DOI] [PubMed] [Google Scholar]
- Gilbert R. (2006) Fluid intake and bladder and bowel function. Nursing Times 102, 55–59. [PubMed] [Google Scholar]
- Gill T.P., Rangan A.M. & Webb K.L. (2006) The weight of evidence suggests that soft drinks are a major issue in childhood and adolescent obesity. There is much to be gained by reducing children's intake of soft drinks and little – except excess weight – to be lost. The Medical Journal of Australia 184, 263–264. [DOI] [PubMed] [Google Scholar]
- Groeneveld I.F., Solomons N.W. & Doak C.M. (2007a) Determination of central body fat by measuring natural waist and umbilical abdominal circumference in Guatemalan schoolchildren. International Journal of Pediatric Obesity 2, 114–121. [DOI] [PubMed] [Google Scholar]
- Groeneveld I.F., Solomons N.W. & Doak C.M. (2007b) Nutritional status of urban schoolchildren of high and low socioeconomic status in Quetzaltenango, Guatemala. Revista Panamericana de Salud Pública 22, 169–177. [DOI] [PubMed] [Google Scholar]
- James J. & Kerr D. (2005) Prevention of childhood obesity by reducing soft drinks. International Journal of Obesity 29 (Suppl. 2), S54–S57. [DOI] [PubMed] [Google Scholar]
- Johnson L., Mander A.P., Jones L.R., Emmett P.M. & Jebb S.A. (2007) Is sugar‐sweetened beverage consumption associated with increased fatness in children? Nutrition 23, 557–563. [DOI] [PubMed] [Google Scholar]
- Krause V.M., Delisle H. & Solomons N.W. (1998) Fortified foods contribute one half of recommended vitamin A intake in poor urban Guatemalan toddlers. The Journal of Nutrition 128, 860–864. [DOI] [PubMed] [Google Scholar]
- Kruawal K., Sacher F., Werner A., Müller J. & Knepper T.P. (2005) Chemical water quality in Thailand and its impacts on the drinking water production in Thailand. The Science of the Total Environment 340, 57–70. [DOI] [PubMed] [Google Scholar]
- Liang J.L., Dziuban E.J., Craun G.F., Hill V., Moore M.R., Gelting R.J. et al. and Centers for Disease Control and Prevention (CDC) (2006) Surveillance for waterborne disease and outbreaks associated with drinking water and water not intended for drinking – United States, 2003–2004. MMWR Surveillance Summaries 55, 31–65. [PubMed] [Google Scholar]
- Livingstone M.B. & Robson P.J. (2000) Measurement of dietary intake in children. The Proceedings of the Nutrition Society 59, 279–293. [DOI] [PubMed] [Google Scholar]
- Malik V., Schulze M. & Hu F.B. (2006) Intake of sugar‐sweetened beverages and weight gain: a systematic review. The American Journal of Clinical Nutrition 84, 274–288. [DOI] [PMC free article] [PubMed] [Google Scholar]
- Menchú M.T. & Méndez H. (eds) (2000) Tabla de Composición de Alimentos de Centroamérica, 2nd edn. Instituto de Nutrición de Centro América y Panamá (INCAP) Organización Panamericana de la Salud (OPS): Guatemala City. [Google Scholar]
- Montenegro‐Bethancourt G., Doak C.M. & Solomons N.W. (2009) Fruit and vegetable intake of schoolchildren in Quetzaltenango, Guatemala. Revista Panamericana de Salud Pública 25, 146–156. [DOI] [PubMed] [Google Scholar]
- Moore G.F., Tapper K., Murphy S., Clark R., Lynch R. & Moore L. (2007) Validation of a self‐completion measure of breakfast, foods, snacks and fruits and vegetables consumed by 9‐ to 11‐year‐old schoolchildren. European Journal of Clinical Nutrition 61, 420–430. [DOI] [PubMed] [Google Scholar]
- Nawrot P., Jordan S., Eastwood J., Rotstein J., Hugenholtz A. & Feeley M. (2003) Effects of caffeine on human health. Food Additives and Contaminants 20, 1–30. [DOI] [PubMed] [Google Scholar]
- Nielsen S. & Popkin B. (2004) Changes in beverage intake between 1977–2001. American Journal of Preventive Medicine 27, 205–210. [DOI] [PubMed] [Google Scholar]
- O'Connor T.M., Yang S.J. & Nicklas T.A. (2006) Beverage intake among preschool children and its effect on weight status. Pediatrics 118, 1010–1018. [DOI] [PubMed] [Google Scholar]
- Pizarro F., Olivares M., Gidi V. & Araya M. (1999) The gastrointestinal tract and acute effects of copper in drinking water and beverages. Reviews on Environmental Health 14, 231–238. [DOI] [PubMed] [Google Scholar]
- Popkin B.M., Armstrong L.E., Bray G.M., Caballero B., Frei B. & Willett W.C. (2006) A new proposed guidance system for beverage consumption in the United States. The American Journal of Clinical Nutrition 83, 529–542. [DOI] [PubMed] [Google Scholar]
- Popkin B.M., Barclay D.V. & Nielsen S.J. (2005) Water and food consumption patterns of U.S adults from 1999–2001. Obesity Research 13, 2140–2152. [DOI] [PubMed] [Google Scholar]
- Pridmore P. & Bendelow G. (1995) Health images: the use of the write and draw technique with children. Health Education Journal 54, 473–488. [Google Scholar]
- Ritz P. & Berrut G. (2005) The importance of good hydration for day‐to‐day health. Nutrition Reviews 63, S6–S13. [DOI] [PubMed] [Google Scholar]
- Rivera J.A., Muñoz‐Hernández O., Rosas‐Peralta M., Aguilar‐Salinas C.A., Popkin B.M. & Willett W.C. (2008) Beverage consumption for a healthy life: recommendations for the Mexican population. Salud Pública de México 50, 173–195. [DOI] [PubMed] [Google Scholar]
- Rolls B.J. & Rolls E.T. (1982) Thirst. Cambridge University Press: Cambridge. [Google Scholar]
- Sanigorski A.M., Bell A.C. & Swinburn B.A. (2007) Association of key foods and beverages with obesity in Australian schoolchildren. Public Health Nutrition 10, 152–157. [DOI] [PubMed] [Google Scholar]
- Shenkin J., Heller K. & Warren J. (2003) Soft drink consumption and caries risk in children and adolescents. General Dentistry 51, 30–36. [PubMed] [Google Scholar]
- Simoons F.J. (1978) The geographic hypothesis and lactose malabsorption. A weighing of the evidence. The American Journal of Digestive Diseases 23, 363–380. [DOI] [PubMed] [Google Scholar]
- Solomons N.W., Montenegro‐Bethancourt G., Vásquez C., Vossenaar M. & Doak C. (2008) Concordance with the New American Plate guidelines of the American Institute for Cancer Research in Guatemalan children. Nutrition 25, 385–391. [DOI] [PubMed] [Google Scholar]
- Stookey J.D. (2001) Energy density, energy intake and weight status in a large free‐living sample of Chinese adults: exploring the underlying roles of fat, protein, carbohydrate, fiber and water intakes. European Journal of Clinical Nutrition 55, 349–359. [DOI] [PubMed] [Google Scholar]
- Storey M.L., Forshee R.A. & Anderson P.A. (2006) Beverage consumption in the US population. Journal of the American Dietetic Association 106, 1992–2000. [DOI] [PubMed] [Google Scholar]
- Striegel‐Moore R.H., Thompson D., Affenito S.G., Franko D.L., Obarzanek E., Barton B.A. et al. (2006) Correlates of beverage intake in adolescent girls: the National Heart, Lung, and Blood Institute Growth and Health Study. The Journal of Pediatrics 148, 183– 187. [DOI] [PubMed] [Google Scholar]
- Vossenaar M., Montenegro‐Bethancourt G., Kuijper L.D., Doak C.M. & Solomons N.W. (2008) Distribution of macro‐ and micronutrient intakes in relation to the meal pattern of third‐ and fourth‐grade schoolchildren in the city of Quetzaltenango, Guatemala. Public Health Nutrition 9, 1–13. [DOI] [PubMed] [Google Scholar]