

Abstract
Long‐chain polyunsaturated fatty acids (LCPUFA) in breastmilk, specifically docosahexaenoic acid (DHA), are important for infant brain development. Accretion of DHA in the infant brain is dependent on DHA‐status, intake and metabolism. The aim of this study was to describe changes in maternal and infant erythrocyte (RBC) DHA‐status during the first four months of lactation. We examined 17 mothers and their term infants at 1, 2 and 4 months of age. Milk samples and RBC from the mothers and infants were obtained and analysed for fatty acid composition. Comparative analysis of the results showed that the content of DHA in maternal RBC‐phosphatidylcholine (PE) decreased over the four month period and this was not accompanied by a decrease in DHA in infant RBC‐PE (P = 0.005). The ratio of n‐6 PUFA to n‐3 PUFA increased over time in maternal RBC‐PE, but not in infant RBC‐PE (P < 0.001). The level of 22:5n‐6 and the ratio of LCPUFA to precursor PUFAs in infant RBC was higher than in maternal RBC phospholipids. (P = and P < 0.001 respectively). We found a decrease in the level of LCPUFA in milk, specifically AA. However, we did not observe a significant decrease in milk DHA, which may have been due to two outliers. These results indicate better DHA‐status and a higher n‐3/n‐6 PUFA in RBC of infants than in mothers. Whether these differences reflect preferential n‐3 PUFA transfer via breastmilk or differences in PUFA‐metabolism and utilization remains to be shown.
Keywords: Long‐chain polyunsaturated fatty acid, docosahexaenoic acid, arachidonic acid, human milk, breastfeeding, infant
Introduction
Long‐chain polyunsaturated fatty acids (LCPUFA) play a major role in brain development during the first year of life (Lauritzen et al., 2001). In the human body the essential polyunsaturated fatty acids (PUFA) linoleic acid (18:2n‐6, LA) and α‐linolenic acid (18:3n‐3, LNA) can be converted to n‐6 and n‐3 LCPUFA through elongation‐ and desaturation steps. The most dominant LCPUFA of the two families are docosahexaenoic acid (22:6n‐3, DHA) and arachidonic acid (20:4n‐6, AA). These fatty acids are accumulated in the central nervous system during the last trimester of pregnancy and the first year of life. Fatty acids of the n‐3 family are essential for development of the central nervous system (Lauritzen et al., 2001) and DHA‐intake has been shown to be important for optimal visual development in formula‐fed infants (SanGiovanni et al., 2000). Recent studies indicate that the DHA‐content of breastmilk on a long‐term basis may affect the mental abilities (Helland et al., 2003) and possible also immune function in the offspring (Lauritzen et al. unpublished observations). However, the optimal infant n‐3 PUFA intake has yet to be determined.
The composition of PUFA in human milk is highly influenced by maternal diet, and metabolism and changes throughout the period of lactation (Yu et al., 1998). The level of DHA and AA in breastmilk decreases during the first months of lactation, while the level of LA and LNA increases during the same period of time (Yu et al., 1998). These changes in composition of PUFA in milk may reflect a metabolic adaptation in the mother to ensure LCPUFA‐supplies to the fetus and the newborn infant. The n‐3 PUFA seem to be selectively transferred from mother to fetus and neonate through the placenta during pregnancy and breastmilk throughout lactation (Montgomery et al., 2003). During lactation the mother has to sustain her own PUFA‐requirements and the continuous LCPUFA‐accretion of the infant. It has been suggested that pregnancy and lactation deplete maternal DHA‐stores (Otto et al., 2001). Studies have compared the fatty acid composition of plasma and erythrocytes (RBCs) from maternal circulation and cord blood in order to elucidate whether maternal LCPUFA‐status is sufficient to sustain an optimal LCPUFA‐accretion in the fetus and the newborn infant (Al et al., 1990; Min et al., 2001). To asses the optimal level of LCPUFA in breastmilk in order to provide optimal neurological development for infants, studies of changes in maternal and infant LCPUFA are needed. To our knowledge no studies have compared the PUFA‐composition of breastmilk and RBC in mother and infant during lactation.
The specific aim of the present paper was to assess whether infant DHA‐accretion during lactation occur at the expense of impaired maternal DHA‐status. The hypothesis is tested in a study designed to describe PUFA‐levels in RBC phospholipids of lactating mothers and their infants during the first four months of lactation. In addition to DHA we also focus on the ratio between the n‐6 and n‐3 PUFA. Furthermore, we examine changes in PUFA‐composition of breastmilk and indices of change in PUFA‐metabolism determined by the ratio of LCPUFA to precursor PUFA in milk and RBC phospholipids.
Materials and methods
Ethical considerations
Ethical approval was obtained from the local ethics committee of the Copenhagen and Frederiksberg municipalities. Written, informed consent was obtained from parents before enrolment.
Subjects
Mothers and their infants were recruited from the maternity ward within the first 30 days after birth. Inclusion criteria for mother and child were: term delivery, normal weight for gestation according to national standards (Greisen & Michaelsen, 1989), intention to breastfeed for at least four months, healthy mothers with no history of diabetes, pre‐eclampsia, hypertension or no complication during delivery (Apgar > 7 after 5 min). Twenty‐four mothers fulfilled the inclusion criteria. Seven mother–infant pairs were excluded: three because they only attended the first examination, two because the infants were given infant formula and two because two out of the three infants blood samples were too small to supply the required amount of RBC phospholipids for the fatty acid analysis. The minimum volume of blood needed to run the analyses was 150 µl. Data were obtained from 17 mother–infant pairs who were included in the final analyses. Of the 17 mother–infant pairs, one mother did not attend the first examination and another mother did not participate in the third examination. One milk sample and two maternal blood samples disappeared during transport. Furthermore, we were unable to analyse four of the phosphatidylethanolamine (PE) fraction from infant RBC owing to unidentified analytical problems. Full data sets were obtained for 12 mother–infant‐pairs in PE and 15 in phosphatidylcholine (PC), the total amounts of successful fatty acid analysis in each pool at each time are given in the tables. All infants were exclusively breastfed for 4 months except for one, who was exclusively breastfed for 3 months and then from 3 months of age given one meal of solid food per day in addition to breastfeeding.
Examination
All mother–infant pairs were examined at 1, 2 and 4 months after delivery. At the first examination the mothers were asked about weight gain during pregnancy, feeding pattern, gestational age, weight, length and Apgar‐score at delivery. At each visit blood samples were obtained from both mothers (2 ml EDTA, blood from vein puncture) and infants (150–750 µl EDTA, blood from a heel prick). The mothers expressed a breastmilk sample (5 ml) either the day before or on the day of examination and kept the sample in the freezer at home until it was transported to the department.
Fatty acid analysis
Erythrocytes were separated from plasma and washed three times with 150 mM NaCl and 1 M EDTA. Two ml methanol containing 0.01% butylated hydroxytoluene (BHT) was added as an antioxidant. RBCs and milk samples were stored at −80°C until analysis. Total RBC lipids were extracted (Folch et al., 1957) and phospholipids classes were separated by thin‐layer chromatography (Gilfillan et al., 1983). Methyl esters were prepared (Høy & Hølmer, 1988) from the two major phospholipids classes of the RBC, PC and PE. The fatty acid composition of the PC and PE fractions were then determined by gas liquid chromatography (GC) on a Hewlett‐Packard 5890 instrument with on‐column injection and a 50‐m × 0.25‐mm fused silica capillary column coated with a 0.2‐µm film of CP‐Sil 88 (Chrompack, the Netherlands). The oven temperature was programmed from 90°C to 160°C at a rate of 40°C min−1, then to 20°C at 4°C min−1, and finally after 10 min to 220°C at a rate of 4°C min−1. After extraction (Folch et al., 1957) the methyl esters of total lipids from breastmilk was prepared by direct methylation (Christopherson & Glass, 1969). The fatty acid composition was determined on a Hewlett‐Packard 5880 A instrument with split injection and a 30‐m × 0.32‐mm fused silica column with a 0.2‐µm film of SP2380 (Supelco, Bellefonte, PA, USA). The temperature programme started at 80°C, was increased to 110°C at a rate of 30°C min−1 and was then increased to 200°C at 4°C min−1. Identification and qualification of the fatty acids was based on standards of fatty acids methyl esters (GLC 68 A and GLC 411) purchased from NuChek Prep. (Elysian, Mn, USA). For analytical control a pool sample of RBC was methylated and analysed on the GC every time a sequence was run.
Statistical analyses
Data were entered and analysed by SPSS™ computer software (version 10, SPSS Inc., Chicago). Normally distributed data are presented as mean ± SD. Data that do not comply with a Gaussian distribution is given as median (25th−75th percentile). For Gauss distributed data changes over time in the three FA‐pools (breastmilk or RBC of mothers or infants) were analysed using a General Linear Model (GLM) of Repeated Measurements Analyses of Variance (anova). Changes over time of individual fatty acids or groups of fatty acids in the phospholipid fractions of RBC from infants and mothers were compared using paired GLM‐models of repeated measurements anova. All data from mother and baby were entered on one record. There were two within‐record factors: time and person (mother or baby). In this way it was possible to study changes over time taking into account the pairing of mother and baby. We used the combined time and person factor in order to determine if changes over time differed between mothers and infants. The overall levels of various fatty acids in RBC phospholipids of mothers and infants were compared using the person factor. The paired repeated measurement anova test result was corrected if sphericity could not be assumed in the data (as tested by Manchly's test). The repeated measurement analysis only used information from mother–infant pairs with complete data set. A P‐value < 0.05 was considered statistically significant.
Results
The characteristics of the included mother–infant pairs are shown in Table 1. The composition of fatty acids in human milk during the first four months of lactation is shown in Table 2. No significant change was seen in the total percentage of PUFA over time. There was a significant decrease in the portion of n‐6 LCPUFA, which decreased from 1.3 to 1.0% over the four‐month period (F = 12.54, degrees of freedom (d.f.) = 2, P < 0.001). The level of AA decreased, but the level of DHA in milk was not significantly changed. This appeared to be due to two outliers in the data set (DHA in milk 1.8 and 2.0 respectively). Without these outliers there was a significant decrease in the DHA‐content of breastmilk (F = 5.28, d.f. = 2, p = 0.013) to a mean levels of 0.32 ± 0.11 at four months of age. No significant change was seen in the ratio of n‐6 to n‐3 PUFA or in the ratio of LCPUFA to precursor PUFA over time.
Table 1.
Characteristics of mother–infant pairs
| n = 17 | |
|---|---|
| Maternal age (years) | 30.6 ± 3.7 |
| Pregnancy weight gain (kg) | 15.1 ± 4.4 |
| Apgar < 10 after 5 min (%) | 6 |
| Gestational age (weeks) | 40.2 ± 1.2 |
| Weight at birth (kg) | 3.54 ± 0.44 |
| Weight at 4 months (kg) | 6.82 ± 0.76 |
| Length at birth (cm) | 51.9 ± 1.9 |
| Length at 4 months (cm) | 63.9 ± 2.0 |
| Head circumference at 4 months (cm) | 42.8 ± 0.9 |
| Sex, girls (%) | 53 |
Values are mean (SD) or percentage.
Table 2.
Fatty acid composition of human milk from 1 to 4 months of lactation
| Fatty acids | 1 month (n = 16) | 2 months (n = 17) | 4 months (n = 15) | P (Changes over time) |
|---|---|---|---|---|
| SFA | 43.60 ± 5.06 | 42.30 ± 4.73 | 41.52 ± 5.67 | 0.740 |
| MUFA | 39.16 ± 4.11 | 39.64 ± 3.55 | 40.87 ± 3.47 | 0.430 |
| PUFA total | 14.03 ± 2.51 | 14.27 ± 3.03 | 14.94 ± 3.68 | 0.817 |
| C18:2n‐6 | 10.45 ± 2.13 | 10.97 ± 2.47 | 11.38 ± 3.36 | 0.930 |
| C20:2n‐6 | 0.35 ± 0.11 | 0.27 ± 0.05 | 0.25 ± 0.06 | 0.006 |
| C20:3n‐6 | 0.35 ± 0.10 | 0.32 ± 0.09 | 0.27 ± 0.06 | 0.004 |
| C20:4n‐6 | 0.56 ± 0.12 | 0.47 ± 0.07 | 0.44 ± 0.09 | 0.010 |
| n‐6 | 11.77 ± 2.17 | 12.12 ± 2.63 | 12.44 ± 3.52 | 0.906 |
| C18:3n‐3 | 1.41 ± 0.48 | 1.39 ± 0.47 | 1.52 ± 0.24 | 0.678 |
| C20:5n‐3 | 0.13 (0.08–0.19) | 0.13 (0.11–0.15) | 0.23 (0.07–0.15) | – |
| C22:5n‐3 | 0.23 (0.20–0.28) | 0.21 (0.18–0.24) | 0.23 (0.16–0.24) | – |
| C22:6n‐3 | 0.49 (0.39–0.59) | 0.43 (0.28–0.60) | 0.53 (0.26–0.53) | – |
| n‐3 | 2.26 ± 0.46 | 2.15 ± 0.61 | 2.50 ± 0.93 | 0.311 |
| n‐6/n‐3 | 5.31 ± 0.94 | 5.81 ± 1.22 | 5.34 ± 1.82 | 0.465 |
| LCPUFA n‐6 | 1.26 ± 0.21 | 1.05 ± 0.18 | 0.97 ± 0.17 | <0.001 |
| LCPUFA n‐3 | 0.85 ± 0.29 | 0.77 ± 0.30 | 0.99 ± 1.01 | 0.495 |
| LCPUFA total | 2.11 ± 0.43 | 1.82 ± 0.40 | 1.95 ± 1.06 | 0.463 |
| LCPUFA/C18PUFA | 0.18 ± 0.06 | 0.15 ± 0.03 | 0.16 ± 0.09 | 0.621 |
Values are given as area percentage of all fatty acids in the chromatogram; Data given as mean ± SD or median (25–75% percentiles); Individual fatty acids are named by number of carbon atoms: number of double bonds and position of the last double bond; SFA, saturated fatty acids; MUFA, monounsaturated fatty acids; PUFA, polyunsaturated fatty acids; LCPUFA, long‐chain polyunsaturated fatty acids.
The fatty acid profile in the PC and PE‐fraction of maternal RBC during the first 4 months of lactation is outlined in Table 3, and the infant RBC phospholipids is presented in Table 4. The composition of fatty acids in maternal and infant RBC phospholipids was compared using the two‐factor repeated measurements GLM –anova. Changes in the relative content of n‐3 PUFA over the four‐month period differed in mothers and infants, especially that of DHA (F = 514.11, d.f. = 1, P < 0.001). The DHA‐content in maternal RBC‐PE, was decreased significantly (Table 3) and this was not accompanied by a decrease in DHA of infant RBC‐PE (F = 7.28, d.f. = 1, P = 0.005) (Fig. 1). The level of 22:5n‐6 in infant RBC phospholipids both PE and PC was above that in maternal RBC phospholipids (>0.1 versus < 0.1 FA percentage respectively). Infants had at all times relatively higher levels of n‐6 LCPUFA in RBC‐PC (F = 1383.03, d.f. = 1, P < 0.001). The total percentage of LCPUFA increased over time in infant RBC‐PE and this was due to an increase in n‐3 LCPUFA. The percentage of LCPUFA in both maternal RBC phospholipid fractions remained unchanged. The ratio of LCPUFA to precursor PUFA was also at all times higher in infant RBC compared with maternal RBC in both phospholipid classes (PC: F = 87.67, d.f. = 1, P < 0.001, PE: F = 35.35, d.f. = 1, P < 0.001). The LCPUFA/precursor PUFA decreased significantly over time in both phospholipids fractions of infant RBC, whereas a decrease over time in maternal RBC was significant only in the PC‐fraction. The proportion of n‐6 PUFA relative to that of n‐3 PUFA in maternal RBC‐PE increased, but this was not reflected in an increase in the ratio of n‐6 PUFA to n‐3 PUFA in infant RBC‐PE (F = 15.92, d.f. = 1, P < 0.001) (Fig. 2).
Table 3.
Fatty acid composition of maternal RBC
| Fatty acids | PC | PE | ||||||
|---|---|---|---|---|---|---|---|---|
| 1 month (n = 16) | 2 months (n = 16) | 4 months(n = 14) | P * | 1 month(n = 16) | 2 months(n = 16) | 4 months (n = 14) | P * | |
| SFA | 45.98 ± 2.63 | 46.47 ± 2.20 | 44.69 ± 1.11 | 0.041 | 26.63 ± 2.64 | 25.64 ± 4.61 | 22.60 ± 2.20 | 0.008 |
| MUFA | 19.85 ± 1.28 | 19.06 ± 1.01 | 19.66 ± 1.09 | 0.037 | 21.08 ± 1.76 | 20.05 ± 1.58 | 19.71 ± 1.45 | 0.151 |
| Total PUFA | 30.21 ± 2.73 | 31.27 ± 2.04 | 32.66 ± 1.93 | 0.029 | 41.00 ± 3.05 | 41.91 ± 3.63 | 43.93 ± 3.31 | 0.079 |
| C18:2n‐6 | 19.11 ± 2.04 | 20.44 ± 1.51 | 21.76 ± 1.46 | <0.001 | 4.86 ± 0.73 | 5.04 ± 0.51 | 5.59 ± 0.76 | <0.001 |
| C20:3n‐6 | 2.00 ± 0.38 | 1.77 ± 0.45 | 1.74 ± 0.36 | 0.002 | 1.00 ± 0.22 | 1.00 ± 0.21 | 1.02 ± 0.22 | 0.547 |
| C20:4n‐6 | 5.17 ± 0.90 | 5.14 ± 0.94 | 5.44 ± 0.82 | 0.363 | 16.33 ± 1.71 | 17.35 ± 1.94 | 18.86 ± 1.47 | 0.001 |
| C22:4n‐6 | 0.33 (0.21–0.45) | 0.26 (0.20–0.34) | 0.27 (0.20–0.34) | – | 5.04 (4.44–5.61) | 5.27 (4.65–6.08) | 5.19 (4.38–5.76) | – |
| C22:5n‐6 | 0.06 (0.00–0.10) | 0.01 (0.02–0.00) | – | – | 0.05 (0.00–0.01) | 0.06 (0.00–0.01) | 0.05 (0.00–0.10) | – |
| n‐6 | 26.67 ± 2.43 | 27.63 ± 1.67 | 29.24 ± 1.63 | 0.003 | 27.31 ± 2.01 | 28.74 ± 2.55 | 30.73 ± 2.17 | 0.001 |
| C18:3n‐3 | 0.31 ± 0.12 | 0.28 ± 0.16 | 0.25 ± 0.16 | 0.036 | 0.21 ± 0.07 | 0.18 ± 0.12 | 0.16 ± 0.10 | 0.141 |
| C20:5n‐3 | 0.77 ± 0.34 | 0.83 ± 0.31 | 0.72 ± 0.25 | 0.466 | 1.10 ± 0.40 | 1.39 ± 0.49 | 1.60 ± 0.46 | <0.001 |
| C22:5n‐3 | 0.42 ± 0.09 | 0.51 ± 0.11 | 0.54 ± 0.11 | 0.012 | 3.55 ± 0.67 | 3.86 ± 0.44 | 4.30 ± 0.57 | 0.003 |
| C22:6n‐3 | 1.88 ± 0.49 | 1.91 ± 0.63 | 1.83 ± 0.44 | 0.537 | 8.26 ± 1.24 | 7.22 ± 1.31 | 6.73 ± 1.27 | 0.001 |
| n‐3 | 3.54 ± 0.81 | 3.64 ± 0.96 | 3.43 ± 0.73 | 0.800 | 13.68 ± 2.05 | 13.17 ± 2.03 | 13.20 ± 2.15 | 0.631 |
| n‐6/n‐3 | 7.87 ± 1.76 | 8.07 ± 2.07 | 8.91 ± 2.05 | 0.138 | 2.03 ± 0.31 | 2.22 ± 0.35 | 2.39 ± 0.43 | <0.001 |
| LCPUFA n‐6 | 7.55 ± 1.16 | 7.19 ± 1.32 | 7.44 ± 1.10 | 0.342 | 22.42 ± 1.82 | 23.68 ± 2.60 | 25.11 ± 2.08 | 0.005 |
| LCPUFA n‐3 | 3.23 ± 0.81 | 3.36 ± 0.96 | 3.18 ± 0.69 | 0.914 | 13.50 ± 2.05 | 12.99 ± 2.04 | 13.04 ± 2.15 | 0.471 |
| LCPUFA Total | 10.78 ± 1.60 | 10.55 ± 1.92 | 10.62 ± 1.40 | 0.682 | 35.89 ± 2.94 | 36.68 ± 3.79 | 38.16 ± 3.29 | 0.119 |
| LCPUFA/C18PUFA | 0.56 ± 0.09 | 0.51 ± 0.11 | 0.48 ± 0.07 | 0.007 | 7.18 ± 1.21 | 7.11 ± 1.21 | 6.72 ± 1.07 | 0.062 |
Values are gives as area percentage of all fatty acids; Data given as mean ± SD or median (25–75 percentile); *Changes over time.
Table 4.
Fatty acid composition of infant RBC
| Fatty acids | PC | PE | ||||||
|---|---|---|---|---|---|---|---|---|
| 1 month (n = 16) | 2 months (n = 16) | 4 months (n = 14) | P * | 1 month (n = 16) | 2 months (n = 16) | 4 months (n = 14) | P * | |
| SFA | 50.30 ± 3.01 | 49.24 ± 3.54 | 49.64 ± 3.23 | 0.652 | 34.56 ± 4.92 | 31.83 ± 5.58 | 29.85 ± 3.79 | 0.092 |
| MUFA | 20.55 ± 1.25 | 19.99 ± 1.32 | 19.36 ± 1.33 | 0.050 | 18.56 ± 3.21 | 19.39 ± 2.79 | 17.87 ± 1.29 | 0.466 |
| PUFA Total | 26.12 ± 3.44 | 27.84 ± 3.19 | 28.26 ± 4.18 | 0.169 | 39.16 ± 5.52 | 41.16 ± 4.74 | 45.44 ± 3.15 | 0.015 |
| C18:2n‐6 | 12.88 ± 1.33 | 14.68 ± 1.29 | 16.17 ± 2.30 | <0.001 | 2.80 ± 0.54 | 3.72 ± 0.79 | 3.92 ± 0.48 | <0.001 |
| C20:3n‐6 | 2.31 ± 0.57 | 2.12 ± 0.42 | 1.72 ± 0.40 | <0.001 | 1.35 ± 0.33 | 1.26 ± 0.33 | 1.20 ± 0.26 | 0.011 |
| C20:4n‐6 | 6.99 ± 1.59 | 6.70 ± 1.47 | 6.34 ± 1.17 | 0.230 | 17.86 ± 2.33 | 18.44 ± 2.59 | 20.74 ± 1.74 | 0.005 |
| C22:4n‐6 | 0.43 (0.29–0.60) | 0.37 (0.21–0.47) | 0.36 (0.21–0.47) | – | 5.38 (5.0–6.16) | 5.27 (4.71–5.36) | 5.34 (4.70–5.67) | 0.798 |
| C22:5n‐6 | 0.17 (0.10–0.21) | 0.27 (0.15–0.28) | 0.29 (0.19–0.32) | – | 0.25 (0.18–0.31) | 0.26 (0.17–0.29) | 0.28 (0.21–0.32) | 0.599 |
| n‐6 | 22.83 ± 2.66 | 24.17 ± 2.34 | 24.91 ± 3.34 | 0.081 | 27.68 ± 3.56 | 28.99 ± 3.33 | 31.52 ± 2.27 | 0.008 |
| C18:3n‐3 | 0.22 (1.00–0.29) | 0.19 (0.10–0.27) | 0.11 (0.0–0.20) | – | 0.29 (0.11–0.42) | 0.20 (0.31–0.06) | 0.20 (0.10–0.38) | – |
| C20:5n‐3 | 0.40 ± 0.18 | 0.42 ± 0.16 | 0.33 ± 0.12 | 0.140 | 1.09 ± 0.27 | 1.08 ± 0.23 | 1.07 ± 0.22 | 0.762 |
| C22:4n‐3 | 0.18 ± 0.12 | 0.11 ± 0.08 | 0.09 ± 0.07 | 0.012 | 1.17 ± 0.38 | 0.90 ± 0.26 | 0.59 ± 0.14 | <0.001 |
| C22:5n‐3 | 0.29 ± 0.16 | 0.44 ± 0.15 | 0.49 ± 0.17 | <0.001 | 1.21 ± 0.40 | 2.04 ± 0.44 | 3.26 ± 0.42 | <0.001 |
| C22:6n‐3 | 2.20 ± 0.76 | 2.50 ± 0.78 | 2.34 ± 0.71 | 0.445 | 7.72 ± 1.87 | 7.95 ± 1.52 | 8.80 ± 1.02 | 0.418 |
| n‐3 | 3.29 ± 1.03 | 3.67 ± 1.03 | 3.35 ± 1.07 | 0.399 | 11.48 ± 2.36 | 12.17 ± 2.01 | 13.92 ± 1.43 | 0.049 |
| n‐6/n‐3 | 7.60 ± 2.51 | 6.94 ± 1.41 | 8.00 ± 2.01 | 0.280 | 2.47 ± 0.35 | 2.42 ± 0.34 | 2.28 ± 0.22 | 0.292 |
| LCPUFA n‐6 | 9.89 ± 2.03 | 9.46 ± 1.50 | 8.70 ± 1.53 | 0.020 | 24.83 ± 3.70 | 25.23 ± 3.38 | 27.56 ± 2.23 | 0.079 |
| LCPUFA n‐3 | 3.07 ± 1.02 | 3.48 ± 1.02 | 3.24 ± 0.98 | 0.406 | 11.19 ± 2.47 | 11.97 ± 2.06 | 13.71 ± 1.30 | 0.047 |
| LCPUFA Total | 12.97 ± 2.93 | 12.94 ± 2.36 | 11.94 ± 2.35 | 0.176 | 36.03 ± 5.77 | 37.20 ± 4.87 | 41.27 ± 2.96 | 0.060 |
| LCPUFA/C18PUFA | 0.99 ± 0.25 | 0.87 ± 0.14 | 0.73 ± 0.11 | 0.005 | 12.14 ± 3.73 | 9.83 ± 2.36 | 10.05 ± 1.31 | 0.020 |
Values are given as area percentage of all fatty acids; Data given as mean ± SD or median (25–75% percentile); *Changes over time.
Figure 1.
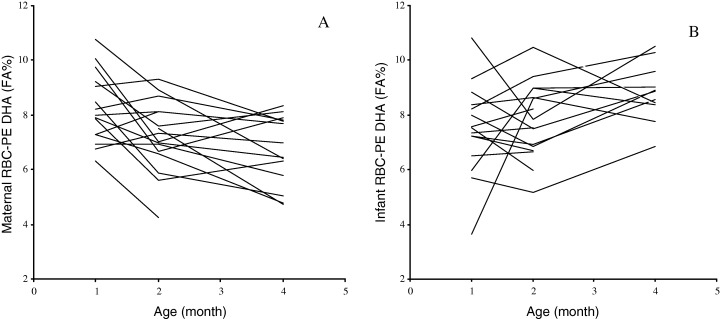
Changes in the relative docosahexaenoic acid (DHA) content of erythrocytes (RBC) in mothers and infants during the first 4 months of lactation. A. DHA in maternal RBC phosphotidylethanolamine (PE). B. DHA in infant RBC‐PE. DHA is expresses as percentage of total fatty acids.
Figure 2.
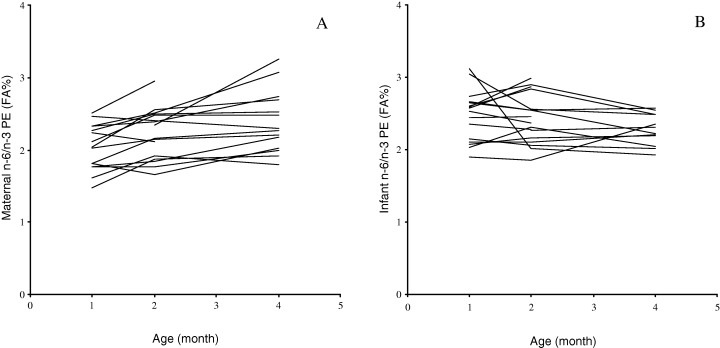
Changes in the level of n‐6 to n‐3 polyunsaturated fatty acids (PUFA) in erythrocytes (RBC) of mothers and infants during the first 4 months of lactation. A. The n‐6/n‐3 PUFA in maternal RBC phosphotidylethanolamin (PE). B. The n‐6/n‐3 PUFA in infant RBC‐PE.
Overall we found a marked increase over time in the level of PUFA in the PC‐fraction of maternal RBC (Table 3), specifically n‐6 PUFA (data not shown), and a concomitant decrease in the relative content of saturated fatty acids (SFA) and monounsaturated fatty acids (MUFA). The level of n‐3 PUFA in maternal RBC phospholipids did not change over time, but that of AA in PE increased, which together with an increase in LA and resulted in the increased ratio of n‐6 PUFA to n‐3 PUFA in maternal RBC‐PE. As in maternal RBC phospholipids, the fatty acids profile of infant RBC‐PE showed a significant increase in PUFA over time and this was due to increases in both n‐3 PUFA and n‐6 PUFA. The increase in n‐3 PUFA was caused primarily by a rise in 22:5n‐3, whereas the level of DHA in infant RBC was unchanged. The increase in n‐6 PUFA in the PE‐fraction is primarily caused by an increase in the level of AA.
Discussion
As hypothesized maternal DHA‐status assessed as DHA in the PE‐fraction of RBC was found to decrease significantly during lactation. The decline in DHA in maternal RBC was not reflected in the infant RBC‐PE (Fig. 1). Blood samples from mothers and infants were sampled by different methods, which complicates the comparison. In a pilot study the levels of LCPUFA in RBC from capillary samples was found to be 9% lower than that in venous samples (Jørgensen et al. unpublished data). The difference between mothers and infants in this study may therefore be underestimated. A decrease in maternal DHA‐status has previously been shown to occur throughout the first month of lactation (Makrides & Gibson, 2000; Otto et al., 2001) as well as during pregnancy (Al et al., 1995; Hornstra, 2000). Infant DHA‐status, as measured in plasma phospholipids, has in a previous study been shown to increase during the first 10 weeks of lactation (Boehm et al., 1996). However, other studies have shown a slight decrease in n‐3 LCPUFA of infant RBC throughout the first 3 months of lactation (Bondia‐Martinez et al., 1998). The level of DHA in infant RBC has both been shown to increase (Boehm et al., 1996) and to decrease (Lapillonne et al., 2000) during the first month of lactation. These differences may reflect differences in the intake of n‐3 LCPUFA from fish. The Danish population has a relative high intake of fish compared with most other countries (Welch et al., 2002), which is reflected in higher levels of DHA in RBC phospholipids and breastmilk (Lauritzen et al., 2001).
The PUFA‐profile of breastmilk changed within the first 4 months of lactation. In agreement with results of previously published data (Makrides et al., 1995; Duchén & Björksten, 2001), we found a decrease in the level of LCPUFA, specifically AA. However, we did not observe a significant decrease in milk‐DHA, which may have been due to two outliers. When these were excluded, DHA in breastmilk decreased over the 4‐month period as reported by others (Makrides et al., 1995; Koletzko & Rodriguez‐Palmero, 1999). The content of DHA in breastmilk is influenced by the immediate intake of fish (Jørgensen et al., 2001). The dietary intake of n‐3 fatty acids has been shown to be reflected in the milk with a peak around 10 h after the meal (Lauritzen et al., 2002). Thus, a possible explanation for the high outlier values could be an intake of a fish‐meal before the milk sampling. The two elevated milk‐DHA values observed were, as expected, not reflected in the DHA‐levels of infant or maternal RBC phospholipids. As shown in a previous study (Lauritzen et al., 2002), the DHA‐content of breastmilk shows large day‐to‐day variations and thus a single sample of breastmilk may not be a very good indicator of infant PUFA‐intake. In the present study we did not see any change in the total amount of PUFA in breastmilk. In contrast, others have found that the LA and LNA levels in breastmilk increased during within the first weeks of lactation and then tended to decrease (Duchén & Björksten, 2001). Since the milk samples in our study were collected in the 1st, 2nd and 4th month of lactation we may have missed the strongest part of the increase.
The decrease in maternal RBC‐DHA has been suggested to reflect depletion of maternal stores and a decrease in DHA‐status (Al et al., 1995). Changes in the PUFA‐profiles of maternal RBC phospholipids may also reflect a metabolic adaptation in maternal PUFA‐metabolism during pregnancy to sustain the continuing accretion by the fetus and the newborn infant. Duchén and Björksten (2001) have suggested a hormonal induced increase of Δ6‐desaturase activity during pregnancy leading to increased levels of LCPUFA to PUFA. It has been hypothesized that maternal metabolism normalizes during the first months of lactation. This theory is supported by results from Makrides & Gibson (2000) and Otto et al. (2001), who observed a decrease in DHA in maternal plasma and RBC post‐partum in both lactating and non‐lactating women. However, in one of these studies, the extent was somewhat greater in lactating mothers (Otto et al., 2001). These findings could indicate that the decrease of DHA in maternal RBC may to some extent be caused by a post partum normalization process.
No changes were seen in the ratio of n‐6 to n‐3 PUFA in infant RBC‐PE despite a significant increase in the n‐6 to n‐3 PUFA ratio of maternal RBC‐PE (Fig. 2). These findings may indicate a selective transfer of n‐3 PUFA, especially DHA, between mother and infant. However, infants do have the ability to convert LNA and LA to LCPUFA (Uauy et al., 2000). The endogenous conversion may explain a specific increase in n‐3 LCPUFA of infant RBC‐PE, not reflected in the n‐3 LCPUFA‐content of breastmilk or maternal RBC‐PE. The rate of infant conversion of essential fatty acids to LCPUFA is variable among infants and the magnitude of the conversion is not yet known. Differences in PUFA‐levels of RBC phospholipids between mother and their infants could also reflect differences in their PUFA‐utilization.
The endogenous conversion of LNA in infants may not be sufficient to support their needs for n‐3 LCPUFA. During the last few decades there has been an extensive research in order to determine whether there is a special dietary need for preformed DHA (Makrides & Gibson, 2001). 22:5n‐6 (osborn acid) is suggested as a useful marker of the DHA‐status (Hornstra, 2000). Maternal depletion would be expected to cause a compensatory increase in 22:5n‐6 in maternal RBC phospholipids. However, we observed higher levels of 22:5n‐6 at all times in infant RBC than in maternal RBC phospholipids. The higher level of 22:5n‐6 in infant RBC phospholipids could be an indication of a suboptimal infant intake of n‐3 PUFA. A recent paper has questioned the usefulness of 22:5n‐6 as an indicator of DHA‐deficiency because they found a positive correlation between these two LCPUFA (Innis et al., 2004). However, contradictory to past beliefs synthesis of DHA – and other LCPUFA – appears to be inhibited by a high intake of LNA and other C‐18 PUFA (Blank et al., 2002). These studies underline that the use of 22:5n‐6 as an indicator of suboptimal DHA‐status should take the overall PUFA‐intake into consideration.
The fatty acid composition of RBC is known to be a good indicator of the fatty acids composition of tissue and brain (Sanjurjo et al., 1995; Maurage et al., 1998). However, the PUFA‐composition of maternal and infant RBC can only give an impression of total body PUFA‐status of mother and infant and does not provide valid information about the mechanisms that caused the changes within the RBC fatty acids composition. Selective transfer of LCPUFA or changes in the metabolism of mother or infant are expected to be reflected in the fatty acid composition in RBC, but the changes observed in RBC are not conclusive. However, this study is the first to describe changes in RBC fatty acid composition in mother and infant during lactation in parallel. The results indicate better DHA‐status in infant RBC and a higher ratio of n‐3 to n‐6 PUFA than in mothers, although the higher 22:5n‐6 levels could indicate suboptimal infant supply. Whether these differences reflect preferential transfer via breastmilk or differences in metabolism and utilization remains to be shown. Further larger studies using stable isotopes would be desirable to provide new information to our findings. Thus, such studies would likely contribute to the current understanding of the neurological and developmental importance of the breastmilk PUFA‐composition especially concerning the infant LCPUFA‐need and maternal status during pregnancy and the first period of lactation.
Acknowledgements
We thanks all parents and infants who participated in the study; and all laboratory technicians, dieticians and secretaries, who took part in the data collection, fatty acid analysis, and preparation of the manuscript. The study was funded by The Danish Research and Development Program for Food and Technology and BASF Aktiengesellshaft. None of the authors have any financial or personal interests in any company or organization sponsoring this research.
References
- Al M.D.M., Hornstra G., Van Der Schouw Y.T., Bulstra‐Ramakers M.T.E.W. & Huisjes H.J. (1990) Biochemical EFA status of mothers and their neonates after normal pregnancy. Early Human Development, 24, 239–248. [DOI] [PubMed] [Google Scholar]
- Al M.D.M., Van Houwelingen A.C., Kester A.D.M., Hasaart T.H.M., Dejong A.E.P. & Hornstra G. (1995) Maternal essential fatty acid patterns during normal pregnancy and their relationship to the neonatal essential fatty acid status. British Journal of Nutrition, 74, 55–68. [DOI] [PubMed] [Google Scholar]
- Blank C., Neumann M.A., Makrides M. & Gibson R.A. (2002) Optimizing DHA levels in piglets by lowering the linoleic acid to α‐linolenic acid ratio. Journal of Lipid Research, 43, 1537–1543. [DOI] [PubMed] [Google Scholar]
- Boehm G., Borte M., Bohles H.J., Muller H., Kohn G. & Moro G. (1996) Docosahexaenoic and arachidonic acid content of serum and red blood cell membrane phospholipids of preterm infants fed breast‐milk, standard formula or formula supplemented with n‐3 and n‐6 long‐chain polyunsaturated fatty acid. European Journal of Pediatrics, 155, 410– 416. [DOI] [PubMed] [Google Scholar]
- Bondia‐Martinez E., Lopez‐Sabater M.C., Castellote‐Bargallo A.I., Rodriguez‐Palmero M., Gonzalez‐Corbella M.J., Rivero‐Urgell M., et al. (1998) Fatty acid composition of plasma and erythrocytes in term infants fed human milk and formulae with and without docosahexaenoic and arachidonic acids from egg yolk lecithin. Early Human Development, 53(Suppl.), S109–S119. [DOI] [PubMed] [Google Scholar]
- Christopherson S.W. & Glass R.L. (1969) Preparation of milk fat methyl esters by alcoholysis in an essentially non‐alcoholic solution. Journal of Dairy Science, 52, 1289–1290. [Google Scholar]
- Duchén K. & Björksten B. (2001) Polyunsaturated n‐3 fatty acids and the development of atopic disease. Lipids, 36, 1033–1042. [DOI] [PubMed] [Google Scholar]
- Folch J., Lees M. & Sloane G.H. (1957) A simple method for the isolation and purification of total lipids from animal tissues. Journal of Biological Chemistry, 226, 497–509. [PubMed] [Google Scholar]
- Gilfillan A.M., Chu A.J., Smart D.A. & Rooney S.A. (1983) Single plate separation of lung phospholipids including disaturated phosphatidylcholine. Journal of Lipid Research, 24, 1651–1656. [PubMed] [Google Scholar]
- Greisen G. & Michaelsen K.F. (1989) Perinatal vækst (Perinatal growth). Danish Medical Bulletin (Ugeskrift for Læger), 151, 1813–1816 (in Danish). [PubMed] [Google Scholar]
- Helland I.B., Smith L., Saarem K., Saugstad O.D. & Drevon C.A. (2003) Maternal supplementation with very long‐chain n‐3 fatty acids during pregnancy and lactation augments children's IQ at 4 years of age. Pediatrics, 111, e39–e44. [DOI] [PubMed] [Google Scholar]
- Hornstra G. (2000) Essential fatty acids in mothers and their neonates. American Journal of Clinical Nutrition, 71, 1262S–1269S. [DOI] [PubMed] [Google Scholar]
- Høy C.E. & Hølmer G. (1988) Dietary linoleic acid and the fatty acid profiles in rats fed partially hydrogenated marine oils. Lipids, 23, 973–980. [DOI] [PubMed] [Google Scholar]
- Innis S.M., Vaghri Z. & King D.J. (2004) n‐6 Docosapentaenoic acid is not a predictor of low docosahexaenoic acid status in Canadian preschool children. American Journal of Clinical Nutrition, 80, 768–773. [DOI] [PubMed] [Google Scholar]
- Jørgensen M.H., Hernell O., Hughes E.L. & K.F. Michaelsen (2001) Is there a relation between docosahexaenoic acid concentration in mothers’ milk and visual development in term infants? Journal of Pediatric Gastroenterology and Nutrition, 32, 293–296. [DOI] [PubMed] [Google Scholar]
- Koletzko B. & Rodriguez‐Palmero M. (1999) Polyunsaturated fatty acids in human milk and their role in early infant development. Journal of Mammary Gland Biology and Neoplasia, 4, 269–284. [DOI] [PubMed] [Google Scholar]
- Lapillonne A., Brossard N., Claris O., Reygrobellet B. & Salle B.L. (2000) Erythrocyte fatty acid composition in term infants fed human milk or a formula enriched with a low eicosapentanoic acid fish oil for 4 months. European Journal of Pediatrics, 159, 49–53. [DOI] [PubMed] [Google Scholar]
- Lauritzen L., Hansen H.S., Jørgensen M.H. & Michaelsen K.F. (2001) The essentiality of long‐chain n‐3 fatty acids in relation to development and function of the brain and retina. Progress in Lipid Research, 40, 1–94. [DOI] [PubMed] [Google Scholar]
- Lauritzen L., Jørgensen M.H., Hansen H.S. & Michaelsen K.F. (2002) Fluctuations in human milk long‐chain PUFA levels in relation to dietary fish intake. Lipids, 37, 237–244. [DOI] [PubMed] [Google Scholar]
- Makrides M. & Gibson R.A. (2000) Long‐chain polyunsaturated fatty acid requirements during pregnancy and lactation. American Journal of Clinical Nutrition, 71, 307S–311S. [DOI] [PubMed] [Google Scholar]
- Makrides M. & Gibson R.A. (2001) Specific requirements for n‐3 and n‐6 long‐chain polyunsaturated fatty acids for preterm and term infants? European Journal of Lipid Science and Technology, 103, 373–378. [Google Scholar]
- Makrides M., Simmer K., Neumann M. & Gibson R.A. (1995) Changes in the polyunsaturated fatty acids of breast‐milk from mothers of full‐term infants over 30 wk of lactation. American Journal of Clinical Nutrition, 61, 1231–1233. [DOI] [PubMed] [Google Scholar]
- Maurage C., Guesnet P., Pinault M., De Lempdes J.B.R., Durand G., Antoine J.M. & Couet C. (1998) Effect of two types of fish oil supplementation on plasma and erythrocyte phospholipids in formula‐fed term infants. Biology of the Neonate, 74, 416–429. [DOI] [PubMed] [Google Scholar]
- Min Y., Ghebremeskel K., Crawford M.A., Nam J.H., Kim A., Lee I.S. & Suzuki H. (2001) Maternal‐fetal n‐6 and n‐3 polyunsaturated fatty acids gradient in plasma and red cell phospholipids. International Journal for Vitamin and Nutrition Research, 71, 286–292. [DOI] [PubMed] [Google Scholar]
- Montgomery C., Speake B.K., Cameron A., Sattar N. & Weaver L.T. (2003) Maternal docosahexaenoic acid supplementation and fetal accretion. British Journal of Nutrition, 90, 135–145. [DOI] [PubMed] [Google Scholar]
- Otto S.J., Van Houwelingen A.C., Badart‐Smook A. & Hornstra G. (2001) Comparison of the peripartum and postpartum phospholipid polyunsaturated fatty acid profiles of lactating and non‐lactating women. American Journal of Clinical Nutrition, 73, 1074–1079. [DOI] [PubMed] [Google Scholar]
- SanGiovanni J.P., Berkey C.S., Dwyer J.T. & Colditz G.A. (2000) Dietary essential fatty acids, long‐chain polyunsaturated fatty acids, and visual resolution acuity in healthy fullterm infants: a systematic review. Early Human Development, 57, 165–188. [DOI] [PubMed] [Google Scholar]
- Sanjurjo P., Matorras R. & Perteagudo L. (1995) Influence of fatty fish intake during pregnancy in the polyunsaturated fatty acids of erythrocyte phospholipis in the mother at labor and new‐born infant. Acta Obstetricia et Gynecologica Scandinavica, 74, 594–598. [DOI] [PubMed] [Google Scholar]
- Uauy R.D., Mena P., Wegher B., Nieto S. & Salem N. Jr (2000) Long‐chain polyunsaturated fatty acid formation in neonates: effect of gestational age and intrauterine growth. Pediatric Research, 47, 127–135. [DOI] [PubMed] [Google Scholar]
- Welch A.A., Lund E., Amiano P., Dorronsoro M., Brustad M., Kumle M., et al. (2002) Variability of fish consumption within the 10 European countries participating in the European Investigation into Cancer and Nutrition (EPIC) study. Public Health Nutrition, 5, 1273–1285. [DOI] [PubMed] [Google Scholar]
- , Yu G. , Duchén K. & Björksten B. (1998) Fatty acid composition in colostrum and mature milk from non‐atopic and atopic mothers during the first 6 months of lactation. Acta Pediatrica, 87, 729–736. [DOI] [PubMed] [Google Scholar]