

Abstract
Exclusive breastfeeding during the first 6 months of infant's life is a public health recommendation and important factor for the promotion of optimal growth, health and behavioural development of each child. The accuracy of the mothers' self‐reported past infant‐feeding events was examined and compared with the isotopic dilution technique. Breastfeeding practices were assessed in a sample of 44 Cameroonian mother–infant pairs using dietary recall since birth. Intakes of breast milk and non‐breast milk water were measured in the same sample using the dose‐to‐the‐mother deuterium‐oxide turnover technique and compared with questionnaire. Results showed that mothers' self‐reported behaviour overestimates the exclusive breastfeeding rate. Seventy‐five per cent of the mothers who claimed to be exclusively breastfeeding were found to be predominantly or partially breastfeeding by the dose‐to‐the‐mother deuterium‐oxide turnover technique. Only 11% of the infants were exclusively breastfed, and the breast milk output was not significantly affected (P ≤ 0.05) by the mother's body composition. Mean intakes of breast milk and non‐breast milk water were 701 mL day−1 and 268 mL day−1, respectively. Introduction of non‐breast milk foods is associated with a reduction in the level of breast milk intake, but the difference in breast milk intake was not significant between exclusively and predominantly breastfed infants. In conclusion, the dose‐to‐the‐mother deuterium‐oxide turnover technique can be applied to validate the mother's reports of infant‐feeding practices, but non‐breast milk water intake by breastfeeding category still needs to be normalized.
Keywords: breastfeeding, deuterium‐oxide turnover method, dietary recall since birth, social desirability
Introduction
Adequate nutrition during infancy is fundamental for promotion of optimal growth, health and behavioural development of each child, and exclusive breastfeeding (EBF) during the first 6 months of an infant's life is now a global public health recommendation [2001a, 2001b]. EBF is defined by WHO (2008) as ‘the infant has received only breast milk from the mother or a wet nurse, or expressed breast milk, and no other liquids or solids with the exception of drops or syrups consisting of vitamins, mineral supplements or medicines.’ Despite documented evidence of the benefits of breastfeeding, EBF is rare in many societies, and global estimates show that 64% of mothers in developing world do not conform to optimal breastfeeding practices (UNICEF 2008a). Although breastfeeding is widely practised and accepted in many African societies, only 21% of Cameroonian infants are exclusively breastfed (UNICEF 2008b).
EBF prevalence can be increased with breastfeeding promotion programmes, but varying results can be obtained according to the method used to evaluate breastfeeding and EBF practices. For WHO (2008), EBF rates should be based on the 24‐h recall method, where information is collected on feeding practices for the day preceding the survey. However, several authors have questioned the validity of this method (Piwoz et al. 1995; Webb et al. 2001), arguing that the 24‐h recall method substantially overestimates the EBF rate in a population, as investigators classify infants who were given infrequent liquids or foods, but not given those foods/liquids during the previous day, as exclusively breastfed infants. Another widely used method to estimate EBF is the ‘recall since birth’. This method requires a longer recall period and categorizes an infant as exclusively breastfed only if he has not received any food or liquid other than breast milk since birth. A concern with recall methods is that results may be affected by bias on mothers' self‐reported behaviour. However, no gold standard method of validation is available. Because the dose‐to‐the‐mother deuterium‐oxide turnover method also estimates the intake of non‐milk fluids, it could potentially be used to validate mother's reports of infant‐feeding practices. The present study was conducted to measure breast milk and non‐breast milk water intake using the dose‐to‐the‐mother deuterium‐oxide turnover technique and to validate the mother's reports of infant‐feeding practices.
Key messages
-
•
The dose‐to‐the‐mother deuterium‐oxide turnover technique revealed that 75% of mothers overestimated self‐reported exclusive breastfeeding rates.
-
•
Mothers' self‐reporting of infant's past feeding events are likely to be altered by the traits of social desirability and social approval biases.
-
•
The dose‐to‐the‐mother deuterium‐oxide turnover technique has important advantages over dietary recall methods and can be applied to validate the mothers' reports of infant feeding practices.
Materials and methods
Subjects
During the first 2 weeks of the study, all lactating mothers attending the paediatric unit of the Yaoundé Teaching Hospital for post‐partum follow‐up and counselling, who agreed to sign the consent form, were included in the study. Forty‐four mother–infant pairs participated in the study, and the protocol was approved by the ethics committee held by the Ministry of Public Health, Cameroon. The mothers, between 19 and 42 years old, were non‐smokers and declared to breastfeed their infants. The infants, boys (n = 15) and girls (n = 29), aged between 1.15 and 4.50 months, were single births with gestational age between 37 and 42 weeks. Assuming the recommended cut‐offs for data exclusion (WHO 2006), data were excluded if a child's length‐for‐age z‐score (LAZ) was below −6 or above +6, weight‐for‐age z‐score was below −6 or above +5, or weight‐for‐length z‐score (WLZ) was below −5 or above +5, as these extreme values were most likely a result of errors in measurement or data entry (WHO 2006).
Anthropometry
Measurements were made by trained personnel using standard procedures (Lohman et al. 1988; Cogill 2003). Wearing minimal clothes, the mothers were weighed to the nearest 10 g with an electronic scale (Seca, Hamburg, Germany). Height was measured to the nearest millimetre with a portable gauge. The body mass index (BMI) was calculated as weight (kg)/height (m)2. The infants were weighed without clothes using a portable electronic infant scale accurate to 5 g. Length was measured using a standardized infantometer.
Questionnaire
On the basis of focus group discussions with mothers in rural and urban sites, a structured questionnaire was developed and pre‐tested to check for glitches in wording of questions, lack of clarity of instructions and anything that could impede the questionnaire's ability to collect data in an economical and systematic fashion. Twelve liquid and food items were asked for a dietary recall since birth. The mothers were asked whether the infant received any of the listed liquids and foods since birth and, if so, when was that done the first time. The questionnaire also included questions on socio‐demographic characteristics, infant health status, prelacteals (any food item given within the first 3 days) and breastfeeding.
All answers about food items were grouped into three feeding categories according to WHO recommendation (WHO, 2008) – that is, EBF (breast milk only), predominant breastfeeding (breast milk plus other liquids such as water, tea, or juice) and partial breastfeeding (other food or milk in addition to breast milk).
Dose‐to‐the‐mother deuterium‐oxide turnover technique
The dose‐to‐the‐mother deuterium‐oxide turnover technique was used to assess breast milk and non‐breast milk water intakes (Coward et al. 1982; Orr‐Ewing et al. 1986; Butte et al. 1988; Cisse et al. 2002). This technique also allows estimation of the mother's body composition. A baseline sample of 2 mL of saliva from the mother and the child was collected on day 0, after which, the mother received an oral dose (30 g) of deuterium oxide (99.8% purity; Cambridge Isotope Laboratories Inc., Andover, MA., USA). Further, six saliva samples were collected from the mother and the infant on days 1, 2, 3, 4, 10 and 14. Saliva collection was carried out after having been assured that the mother and the infant did not eat or drink in the previous 30 min. The time of collection was recorded. Small pieces of cotton wool were used to collect saliva samples (2 mL), after which, the saliva was released into sterile tubes by compressing them in a syringe. Samples were stored on ice during transport on the days of collection, brought to the laboratory and stored at −20°C until analysis.
Deuterium enrichment of saliva samples was measured using a Fourier transform infrared spectrometer (FTIR‐8400S; Shimadzu, Vienna, Austria) with calcium fluoride cell with 0.1‐mm path length. Before measuring deuterium in saliva, the calibration procedure involved preparation of D2O calibrator by dilution of D2O with deionized water. The infrared spectra were measured in the range 2300–2800 cm−1. The magnitude of the response obtained from the FTIR was deducted from the deuterium absorption curve by an algorithm (isotope software) developed by the Medical Research Council (MRC; Human Nutrition Research, Cambridge, UK).
Intake of breast milk and water from non‐milk sources was calculated by fitting the isotopic data to a model for water turnover in the mothers and infants, and the transfer of milk from mother to the infant (Coward et al. 1982; Orr‐Ewing et al. 1986), using an algorithm [Excel (2007) spreadsheet] developed by the MRC. For the mother, data were fitted to
| (1) |
where Em (t) is isotopic enrichment above background at time t (ppm), Em (0) is the zero‐time isotope enrichment (ppm), t is time post‐dose (day) and Kmm is water turnover in the mother (day−1).
For the infant, data were fitted to
 |
(2) |
where Eb (t) is isotopic enrichment above background at time t (ppm), Fbm is the transfer of water from the mother to the infant via breast milk (kg day−1), Vb is the infant's total D2O distribution space (kg) and Fbb is the total water loss in the infant (kg day−1).
Curve fitting was performed using the Solver function in Microsoft Excel® to minimize the sum of the squares of the differences between observed and fitted values for mother and infant data combined. Parameters fitted were Em (0), Fbm, Kmm and Fbb. Vb was assumed to change linearly with weight (W, kg) during the experimental period and was related to infant W as
| (3) |
The data about non‐breast milk water intake were grouped into three feeding categories according to the study reported by Haisma et al. (2003) – that is, EBF (non‐breast milk water intake <52 mL day−1), predominant breastfeeding (non‐breast milk water intake = 52–216 mL day−1) and partial breastfeeding (non‐breast milk water intake >216 mL day−1).
Maternal body composition
The same dose of deuterium, given to the mother for measuring breast milk intake, also served to measure maternal total body water (TBW). Zero‐time isotope enrichment (ppm) in the mothers was estimated as the intercept of the fitted maternal isotopic disappearance curve and pool size (ND, kg) calculated from this dilution of the dose. Pool size was corrected for non‐aqueous isotopic exchange to give TBW. Fat‐free mass was calculated using a hydration coefficient of 73% (International Atomic Energy Agency 1990), and fat mass was calculated as the difference between bodyweight and fat‐free mass:
| (4) |
| (5) |
| (6) |
Data analysis
Growth and nutritional status of infants were assessed using WHO Anthro (WHO 2007) for personal computers, version 2 (WHO 2007), and the weight‐for‐age, length‐for‐age and weight‐for‐length were analysed using z‐scores; the normal z‐scores were considered to be between −2 and +2 standard deviation (SD) of the mean.
Statistical analyses were performed using SPSS Statistics 17.0 software (SPSS Inc., Chicago, IL, USA). Results were expressed as mean ± SD. First type error risk was set at 0.05 for all analyses. Comparisons between dependent variables were determined using analysis of variance, Dunnett's T3 test or t‐test for independent samples assuming inequality of variance (from Levene's test). Pearson's correlations were used to study the relation between the breast milk output and non‐breast milk water intake.
Results
The descriptive characteristics of mother–infant pairs by feeding pattern are displayed in Table 1. Based on the dietary recall since birth, 20 mothers were classified as EBF, seven as PreBF (PreBF) and 17 as partially breastfeeding (ParBF). The average age of mothers was 26.6 years. Mothers who were PreBF were significantly (P ≤ 0.05) younger than exclusively and ParBF mothers. The average weight, height, BMI, TBW, fat‐free mass and body fat of mothers were not affected by the feeding pattern. Their average BMI was within the overweight limit (BMI 25–29.9), but the mean percentage of body fat was within the normal range (% body fat 20–30). In general, 29.6% of mothers included in the study have university level, 54.6% have secondary school level and 15.8% have primary school level; 79.6% were unemployed, and 81.8% were married. During the first day, 54.6% of the mothers started breastfeeding, and within the fourth day, everybody was breastfeeding. Prelacteal feeding including plain water, sugar water and indigenous medicine was given to 18.2% of the infants.
Table 1.
General characteristics of the mother–infant pairs by feeding pattern †
| EBF (n = 20) | PreBF (n = 7) | ParBF (n = 17) | Total (n = 44) | |
|---|---|---|---|---|
| Age of the mother (years) | 28.1 ± 5.9a | 22.9 ± 3.4b | 26.7 ± 4.4a,b | 26.6 ± 5.1 |
| Mother's weight (kg) | 70.7 ± 13.8a | 69.4 ± 10.3a | 67.5 ± 8.7a | 69.2 ± 11.4 |
| Mother's height (cm) | 162.6 ± 6.3a | 156.7 ± 5.4a | 160.1 ± 5.2a | 160.7 ± 6.0 |
| Mother's BMI (kg m2−1) | 26.9 ± 4.3a | 28.1 ± 3.4a | 26.1 ± 3.0a | 26.8 ± 3.7 |
| Mother's TBW* (kg) | 37.7 ± 5.2a | 36.1 ± 4.1a | 38.8 ± 4.6a | 37.9 ± 4.8 |
| Mother's FFM* (kg) | 51.6 ± 7.1a | 49.5 ± 5.6a | 53.2 ± 6.3a | 51.9 ± 6.6 |
| Mother's body fat* (kg) | 19.1 ± 8.6a | 19.9 ± 7.4a | 14.3 ± 7.2a | 17.3 ± 8.1 |
| Age of the infant (month) | 2.5 ± 1.2a | 2.0 ± 1.1a | 3.2 ± 1.3a | 2.7 ± 1.3 |
| Infant's birthweight (kg) | 3.4 ± 0.6a | 2.8 ± 0.6a | 3.1 ± 0.5a | 3.2 ± 0.6 |
| Infant's weight (kg) | 5.9 ± 1.2a | 5.2 ± 1.2a | 6.8 ± 1.3a | 6.1 ± 1.4 |
| Infant's length (cm) | 55.8 ± 4.6a,b | 51.9 ± 4.1a | 57.9 ± 4.9b | 56.0 ± 5.0 |
| Gender ratio (male/female) | 9/12 | 3/4 | 4/13 | 15/29 |
BMI, body mass index; EBF, exclusively breastfed; FFM, fat‐free mass; ParBF, partially breastfed; PreBF, predominantly breastfed; TBW, total body water. *Measured by isotopic dilution. †Classification basis on mother's declaration. Mean ± SD. Means in the same line not sharing a common superscript are significantly different (P < 0.05) according to Dunnett's T3 test.
Of the infants included in the study, 15 were male, and 29 were female. The mean birthweight was 3.2 kg. On average, the mean weight was 6.1 kg, and the mean length was 56.0 cm. The growth and nutritional status of the infants are reflected in Table 2. The infants' mean weight‐for‐age z‐score was not significantly affected by the feeding pattern or the gender, and the mean z‐score was within the normal range. In general, 2.3% of the infants were classified as underweight, 93.2% as normal and 4.5% as overweight. The mean LAZ was within the normal range, and there was no significant difference between boys and girls. However, the mean LAZ of infants who were predominantly breastfed were significantly (P ≤ 0.05) lower than that of exclusively and partially breastfed infants. In general, 31.8% of infants were stunted, 63.6% had normal length and 4.6% had high length. For the infant's weight‐for‐length, the mean z‐score was within the normal range and was not significantly affected by the feeding pattern and infant's gender. According to the WLZ classification, 6.8% of infants were wasted, 45.5% had normal WLZ while 47.7% had high WLZ.
Table 2.
Growth and nutritional status of infants by feeding pattern † and gender
| Weight‐for‐age z‐score | Length‐for‐age z‐score | Weight‐for‐length z‐score | ||||||||||
|---|---|---|---|---|---|---|---|---|---|---|---|---|
| Mean ± SD | % < −2 SD ‡ (n) | % Normal (n) | % > 2 SD ‡ (n) | Mean ± SD | % < −2 SD ‡ (n) | % Normal (n) | % > 2 SD ‡ (n) | Mean ± SD | % < −2 SD ‡ (n) | % Normal (n) | % > 2 SD ‡ (n) | |
| EBF (n = 20) | 0.41 ± 1.15 a | 0.0 (0) | 100.0 (20) | 0.0 (0) | −0.91 ± 1.85a | 30.0 (6) | 65.0 (13) | 5.0 (1) | 1.45 ± 2.02a | 5.0 (1) | 50.0 (10) | 45.0 (9) |
| PreBF (n = 7) | 0.18 ± 1.47 a | 14.3 (1) | 85.7 (6) | 0.0 (0) | −2.22 ± 0.58b | 57.1 (4) | 42.9 (3) | 0.0 (0) | 1.90 ± 2.34a | 14.3 (1) | 14.3 (1) | 71.4 (5) |
| ParBF (n = 17) | 0.93 ± 1.18 a | 0.0 (0) | 88.2 (15) | 11.8 (2) | −0.85 ± 1.83a | 23.5 (4) | 70.6 (12) | 5.9 (1) | 2.03 ± 1.41a | 5.9 (1) | 52.9 (9) | 41.2 (7) |
| Boys (n = 15) | 0.44 ± 1.43 | 6.7 (1) | 86.7 (13) | 6.7 (1) | −1.59 ± 1.78 | 53.3 (8) | 40.0 (6) | 6.7 (1) | 1.82 ± 1.97 | 6.7 (1) | 26.7 (4) | 66.7 (10) |
| Girls (n = 29) | 0.56 ± 1.16 | 0.0 (0) | 96.6 (28) | 3.4 (1) | −0.87 ± 1.74 | 20.1 (6) | 75.9 (22) | 3.4 (1) | 1.71 ± 1.81 | 6.9 (2) | 55.2 (16) | 37.9 (11) |
| t‐test* | −0.289 | – | – | – | −1.211 | – | – | – | 0.178 | – | – | – |
| (P = 0.775) | (P = 0.236) | (P = 0.860) | ||||||||||
| Combined (n = 44) | 0.52 ± 1.25 | 2.3 (1) | 93.2 (41) | 4.5 (2) | −1.10 ± 1.75 | 31.8 (14) | 63.6 (28) | 4.6 (2) | 1.74 ± 1.84 | 6.8 (3) | 45.5 (20) | 47.7 (21) |
EBF, exclusively breastfed; ParBF, partially breastfed; PreBF, predominantly breastfed; SD, standard deviation. *t‐test for unequal variances; t‐value significant at P ≤ 0.05. †Classification basis on mother's declaration. ‡Cut‐off. a–bMeans in the same column not sharing a common superscript are significantly different (P < 0.05) according to Dunnett's T3 test.
In Table 3, the means intake of breast milk, non‐breast milk water and total water intake by feeding pattern are given. On the basis of the results of dose‐to‐the‐mother deuterium‐oxide turnover method, five infants were classified as exclusively breastfed (non‐breast milk water intake <52 mL day−1), 20 as predominantly breastfed (non‐breast milk water intake = 52–216 mL day−1) and 19 as partially breastfed (non‐breast milk water intake >216 mL day−1). Breast milk intake decreased from EBF to PreBF to ParBF (EBF = 769 mL day−1; PreBF = 747 mL day−1; ParBF = 634 mL day−1), but the difference favouring the EBF group was statistically significant (P ≤ 0.05) with only ParBF. A different trend was found with non‐breast milk and total water intakes, which increased from EBF to PreBF to ParBF. Figure 1 shows that non‐breast milk water intake was inversely and significantly correlated with breast milk intake (r = 0.451; P = 0.002) suggesting displacement of breast milk by water and food intakes of the infant. The mother and infant anthropometrical parameters showed non‐significant correlation (P ≤ 0.05) with the breast milk output.
Table 3.
Intake of breast milk and other liquids by feeding pattern †
| Feeding pattern | n | Breast milk intake (mL day−1) | t‐test* | Non‐breast milk water intake (mL day−1) | t‐test* | Total water intake (mL day−1) | t‐test* |
|---|---|---|---|---|---|---|---|
| EBF | 5 | 769.4 ± 12.1 | – | 24.0 ± 13.4 | – | 797.8 ± 24.0 | – |
| PreBF | 20 | 746.8 ± 202.0 | 0.50 (P = 0.625) | 113.5 ± 41.8 | −8.05 (P < 0.001) | 846.2 ± 240.1 | −0.89 (P = 0.387) |
| ParBF | 19 | 634.2 ± 219.8 | 2.67 (P = 0.016) | 495.4 ± 223.9 | −9.11 (P < 0.001) | 1134.3 ± 216.7 | −6.65 (P < 0.001) |
| Total | 44 | 700.8 ± 204.3 | – | 268.2 ± 250.3 | – | 965.1 ± 260.1 | – |
EBF, exclusive breastfed; ParBF, partially breastfed; PreBF, predominantly breastfed. *t‐test for unequal variances are compared with EBF; t‐value significant at P ≤ 0.05. †Classification made on the basis of the results of dose‐to‐the‐mother deuterium‐oxide turnover methodology.
Figure 1.
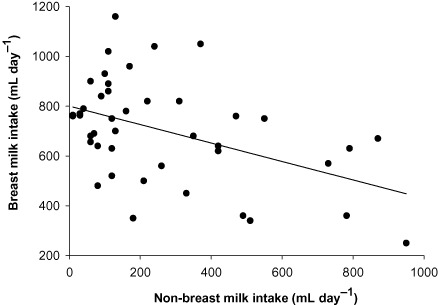
Correlation between breast milk output and non‐breast milk water intake.
A comparison between dietary recall since birth and dose‐to‐the‐mother deuterium‐oxide turnover showed differences in the breastfeeding pattern (Table 4). The dietary recall since‐birth EBF rate was 45% compared with 11% for dose‐to‐the‐mother deuterium‐oxide turnover; consequently, 30% and 5% point differences were noted between the two methods in the predominant and partial breastfeeding rate, respectively.
Table 4.
Comparison of breastfeeding patterns based on data obtained from dietary recall since birth and from dose‐to‐the‐mother deuterium‐oxide turnover
| Feeding pattern | Breastfeeding rate (%) | Bias %* (n) | |
|---|---|---|---|
| Dietary recall since birth (n) | Dose‐to‐the‐mother deuterium‐oxide turnover (n) | ||
| EBF | 45.4 (20) | 11.4 (5) | 34.0 (15) |
| PreBF | 15.9 (7) | 45.4 (20) | −29.5 (13) |
| ParBF | 38.6 (17) | 43.2 (19) | −4.6 (2) |
EBF, exclusive breastfed; ParBF, partially breastfed; PreBF, predominantly breastfed. *A positive value of the bias reflects an overestimation by the dietary recall since birth methodology.
Discussion
The mother–infant pairs included in this study were not representative of the Cameroonian population, and the present analyses were not intended to describe the breastfeeding situation in Cameroon. However, the answers given by the mothers on how they feed their babies made it possible to classify them in breastfeeding categories, and the dose‐to‐the‐mother deuterium‐oxide turnover method allowed us to determine breast milk and non‐breast milk water intakes, which were used to verify mothers' declarations. A large discrepancy was found between the two methods. It appeared that 75% of mothers, who claimed to exclusively breastfeed their infant, were in fact predominantly or ParBF. This can be justified as reported in previous studies (1995, 1997) by the presence of social desirability and social approval biases, which are tendencies for an individual to respond in a manner consistent with expected norms. Some studies reported that women's responses to dietary assessment questions may be more affected by social desirability bias than those of men (Kristal et al. 1998). Indeed, all the women who participated in the present study were exposed to messages about the benefits of EBF and that could likely alter their memory of food given to the infant to be consistent with what is considered good for infant's health. In that connection, Miller et al. (2008) showed that knowledge of the goals of an intervention can produce biases using common dietary assessment tools, and Smith et al. (1991) reported that as time between the behaviour and the report increases, respondents rely more on generic memory, which is more subject to social approval bias. However, there is no quantitative recommendation on the proportion of non‐breast milk water intakes that are associated with the WHO classification of breastfeeding practices into exclusive, predominant and partial breastfeeding, and it is this value that the dose‐to‐the‐mother deuterium‐oxide turnover technique uniquely provides. The present study assumed that the proportion of non‐breast milk water intakes associated with the WHO classification of breastfeeding practices are those reported by Haisma et al. (2003) in a study using the same inclusion criteria for subjects' selection as applied in the WHO Multicenter Growth Reference Study (WHO 1998). The use of the dose‐to‐the‐mother deuterium‐oxide turnover technique to quantify breast milk and non‐breast milk water intakes has important advantages over the dietary recall methods, but the key benefit is that the isotopic method is not subject to social desirability biases. The validity of the dose‐to‐the‐mother deuterium‐oxide method for the assessment of non‐breast milk water intake has been investigated, and a good agreement was noted between the mean of non‐breast milk water intake obtained using weighed bottles and that obtained using labelled bottles (Infante et al. 1991). However, as the use of the dose‐to‐the‐mother deuterium‐oxide method depends only on the volume of non‐breast milk water consumed by infant, the level of that parameter needs to be normalized and associated with the WHO classification of breastfeeding practices.
The average value of breast milk intake obtained in the present study (701 mL day−1) was within the values (600–800 mL day−1) reported for well‐nourished women from industrialized countries (WHO 1987), suggesting that the breast milk production of our sample of Cameroonian mothers was not impaired. Results also indicated, as already demonstrated in previous studies (Heinig et al. 1993; Haisma et al. 2003), that introduction of other liquids or foods reduced the level of breast milk intake. However, there was no significant difference between breast milk intakes of exclusively and predominantly breast milk breastfed infants, as what was agreed with the findings of Haisma et al. (2003), but an introduction of even little amounts of complementary foods between 0 and 6 months can come with some hazards (Long et al. 1994; Monterrosa et al. 2008). However, it should be noted that the number of mother–infant pairs by feeding pattern in the present study was too small to draw conclusions about the differences between groups. Early introduction of complementary foods is well documented (Ross et al. 1983; Savage et al. 1998) and has been associated to several factors including (1) the mother's feeling to not have enough milk; (2) the separation of mother from the infant due to work or schooling and (3) the lack of adequate information about the importance of EBF. Exclusively breastfed infants have been found to grow more rapidly than formula‐fed infants in disadvantaged socio‐economic environments. This was attributed to the protective effects of breast milk against infections that are known to retard growth (Dewey et al. 1992; Villalpando & Lopez‐Alarcon 2000).
Unfortunately, in this study, because of the small sample, we could not draw conclusions about the growth and nutritional status of infants. Results indicated unacceptable growth and nutritional pattern that should be looked carefully in future research. The prevalence of stunting (32%) was high and close to the prevalence reported at the national level (35%) for under‐5‐year‐old children (WHO 2009). However, the non‐significant correlation (r = −0.046; P = 0.768) found between breast milk intake and LAZ suggested that the prevalence of stunting observed should be explained by factors other than breast milk intake. Indeed, the majority of infants consumed non‐negligible amount of non‐breast milk water (Table 3), and it has been reported that the introduction of foods other than breast milk may lead to infections, which are known to reduce linear growth (Lartey et al. 2000). The majority of infants (93.2%) had a normal weight, suggesting that weight was not a major problem for our sample of Cameroonian infants. However, an examination of WLZ showed a high percentage (47.7%) of infants with scores above +2 SD, which is an indication of a high prevalence of overweight stunted children. The low prevalence of underweight, coupled with high prevalence of stunting observed in this study, was also documented in previous studies (Gorstein et al. 1994; Cesar et al., 1996; Post & Victoria 2001; Walsh et al. 2002) and was attributed to body proportionality explained by the hypothesis that wasted infants tend to have large abdominal, head and chest circumferences, which could account for the increased weight resulting in normal or even increased weight‐for‐height z‐scores.
In conclusion, the findings of this study suggested that mothers' declarations, when using the dietary recall method, are likely to be altered by the traits of social desirability and social approval biases. Seventy‐five per cent of the mothers who reported to be exclusively breastfeeding were found to be predominantly or ParBF by the dose‐to‐the‐mother deuterium‐oxide technique. However, for a proper use of the dose‐to‐the‐mother deuterium‐oxide technique to evaluate breastfeeding practice, there is a need to normalize the level of non‐breast milk water for each breastfeeding category.
Source of funding
The study was part of the International Atomic Energy Agency, Technical Cooperation Project N°CMR/6/007.
Conflicts of interest
The authors declare that they have no conflicts of interest.
Contributions
All authors participated in the design and planning of the study; the fieldwork was conducted by ECSN, ACAN and LSE supported by CSM and HAR. The analysis and write‐up were done by GNM and JLEO coordinated the project. All authors reviewed the manuscript and approved the final version.
Acknowledgements
The authors wish to thank the women who generously gave their time and commitment to fulfil the requirements for participating in this study; and V Essa'a, MP Ntsama, C Matchawe, BJ Nsawir, GY Souley and P Emale who participated in the collection of data.
References
- Butte N.F., Wong W.W., Patterson B.W., Garza C. & Klein P.D (1988) Human‐milk intake measured by administration of deuterium oxide to the mother: a comparison with the test‐weighing technique. American Journal of Clinical Nutrition 47, 815–821. [DOI] [PubMed] [Google Scholar]
- Cesar J.A., Victoria C.G., Morris S.S. & Post C.A. (1996) Abdominal circumference contributes to absence of wasting in Brazilian children. Journal of Nutrition 126, 2752–2756. [DOI] [PubMed] [Google Scholar]
- Cisse S.A., Bluck L., Diaham B., Dossou N., Guiro T.A. & Wada S. (2002) Use of Fourier transformed infrared spectrophotometer (FTIR) for determination of breastmilk output by the deuterium dilution method among Senegalese women. Food and Nutrition Bulletin 23, 138–141. [PubMed] [Google Scholar]
- Cogill B. (2003) Anthropometric Indicators Measurement Guide. Food and Nutrition Technical Assistance Project, Academy for Educational Development: Washington, DC. [Google Scholar]
- Coward W.A., Cole T.J., Sawyer M.B. & Prentice A.M. (1982) Breast‐milk intake measurement in mixed‐fed infants by administration of deuterium oxide to their mothers. Human Nutrition-Clinical Nutrition 36, 141–148. [PubMed] [Google Scholar]
- Dewey K.G., Heinig M.J., Nommsen L.A., Peerson J.M. & Lonnerdal B. (1992) Growth of breast‐fed and formula‐fed infants from 0–18 months: the DARLING study. Pediatrics 89, 1035–1040. [PubMed] [Google Scholar]
- Gorstein J., Sullivan K., Yip R., de Onis M., Trowbridge F., Fajans P. et al (1994) Issues in the assessment of nutritional status using anthropometry. Bulletin of the World Health Organization 72, 273–283. [PMC free article] [PubMed] [Google Scholar]
- Haisma H., Coward W.A., Albernaz E., Visser G.H., Wells J.C.K., Wright A. et al (2003) Breast milk and energy intake in exclusively, predominantly, and partially breast‐fed infants. European Journal of Clinical Nutrition 57, 1633–1642. [DOI] [PubMed] [Google Scholar]
- Hebert J.R., Clemow L., Pbert L., Ockene I.S. & Ockene J.K. (1995) Social desirability bias in dietary self‐report may compromise the validity of dietary intake measures. International Journal of Epidemiology 24, 389–398. [DOI] [PubMed] [Google Scholar]
- Hebert J.R., Yunsheng M., Clemow L., Ockene I.S., Saperia G., Stanek E.J. et al (1997) Gender differences in social desirability and social approval bias in dietary self‐report. American Journal of Epidemiology 146, 1046–1055. [DOI] [PubMed] [Google Scholar]
- Heinig M.J., Nommsen L.A., Peerson J.M., Lonnerdal B. & Dewey K.G. (1993) Intake and growth of breast‐fed and formula‐fed infants in relation to the timing of introduction of complementary foods: the darling study. Acta Paediatrica 82, 999–1006. [DOI] [PubMed] [Google Scholar]
- Infante C., Hurtado J., Salazar G., Pollastri A., Aguirre E. & Vio F. (1991) The dose‐to‐mother method to measure milk intake in infants by deuterium dilution: a validation study. European Journal of Clinical Nutrition 45, 121–129. [PubMed] [Google Scholar]
- International Atomic Energy Agency (1990) The doubly labelled water method for measuring energy expenditure. Technical recommendations for use in humans. Vienna, Austria. A consensus report by the IDECG Working Group. NAHRES‐4, A.M. Prentice.
- Kristal A.R., Andrilla H.A., Koepsell T.D., Diehr P.H. & Cheadle A. (1998) Dietary assessment instruments are susceptible to intervention associated response set bias. Journal of the American Dietetic Association 98, 40–43. [DOI] [PubMed] [Google Scholar]
- Lartey A., Manu A., Brown K.H., Peerson J.M. & Dewey K.G. (2000) Predictors of growth from 1 to 18 months among breast‐fed Ghanaian infants. European Journal of Clinical Nutrition 54, 41–49. [DOI] [PubMed] [Google Scholar]
- Lohman T.G., Roche A.F. & Martorell R. (1988) Anthropometric Standardization Reference Manual. Human Kinetics: Champaign, IL. [Google Scholar]
- Long Z.K., Wood W.J., Gariby V.E., Weiss M.K., Mathewson J.J., de la Cabada J.F. et al (1994) Proportional hazards analysis of diarrhea due to enterotoxigenic Escherichia coli and breast feeding in a cohort of urban Mexican children. American Journal of Epidemiology 139, 193–205. [DOI] [PubMed] [Google Scholar]
- Miller M.T., Abdel‐Maksoud F.M., Crane1 A.L., Marcus C.A. & Byers E.T. (2008) Effects of social approval bias on self‐reported fruit and vegetable consumption: a randomized controlled trial. Nutrition Journal 7, 18–25. [DOI] [PMC free article] [PubMed] [Google Scholar]
- Monterrosa C.E., Frongillo A.E., Vasquez‐Garibay M.E., Romero‐Velarde E., Casey M.L. & Willows D.N. (2008) Predominant breast‐feeding from birth to six months is associated with fewer gastrointestinal infections and increased risk for iron deficiency among infants. Journal of Nutrition 138, 1499–1504. [DOI] [PubMed] [Google Scholar]
- Orr‐Ewing A.K., Heywood P.F. & Coward W.A. (1986) Longitudinal measurements of breast milk output by a 2H2O tracer technique in rural Papua New Guinean women. Human Nutrition-Clinical Nutrition 40, 451–467. [PubMed] [Google Scholar]
- Piwoz E.G., Creed de Kanashiro H., Lopez de Romana G., Black R.E. & Brown K.H. (1995) Potential for misclassification of infants' usual feeding practices using 24‐hour dietary assessment methods. Journal of Nutrition 125, 57–65. [DOI] [PubMed] [Google Scholar]
- Post C.A. & Victoria C.G. (2001) The low prevalence of weight‐for‐height deficit in Bazilian children is related to body proportions. Journal of Nutrition 131, 1290–1296. [DOI] [PubMed] [Google Scholar]
- Ross S.M., Van Middelkop A. & Khoza N.C. (1983) Breast‐feeding practices in a black community. South African Medical Journal 63, 23–25. [PubMed] [Google Scholar]
- Savage S.H., Reiley J.J., Edwards C.A. & Durnin J.V.G. (1998) Weaning practice in the Glasgow longitudinal infant growth study. Archives of Disease in Childhood 79, 153–156. [DOI] [PMC free article] [PubMed] [Google Scholar]
- Smith A.F., Jobe J.B. & Mingay D.J. (1991) Retrieval from memory of dietary information. Applied Cognitive Psychology 5, 269–296. [Google Scholar]
- UNICEF (2008a) Overview of breastfeeding patterns. Available at: http://www.childinfo.org/breastfeeding_overview.html[Accessed 3 February 2009].
- UNICEF (2008b) Cameroon – statistics. Available at: http://www.unicef.org/infobycountry/cameroon_statistics.html[Accessed 3 February 2009].
- Villalpando S. & Lopez‐Alarcon M. (2000) Growth faltering is prevented by breast‐feeding in underprivileged infants from Mexico City. Journal of Nutrition 130, 546–552. [DOI] [PubMed] [Google Scholar]
- Walsh C.M., Dannhauser A. & Joubert G. (2002) The impact of a nutrition education programme on the anthropometric nutritional status of low income children in South Africa. Public Health Nutrition 5, 3–9. [DOI] [PubMed] [Google Scholar]
- Webb K., Marks G.C., Lund‐Adams M., Rutishauser I.H. & Abraham B. (2001) Towards a national system for monitoring breastfeeding in Australia: recommendations for population indicators, definitions and next steps. Australian Food and Nutrition Monitoring Unit .
- World Health Organization (WHO) (1987) Quantité et qualité du lait maternel. Rapport sur une étude collective de l'OMS consacrée à l'allaitement au sein. WHO: Geneva. [Google Scholar]
- World Health Organization (WHO) (1998) Working Group on the Growth Reference Protocol. A growth curve for the 21st century: the WHO Multicentre Growth Reference Study protocol.
- World Health Organization (WHO) (2001a) Global Strategy for Infant and Young Child Feeding: The Optimal Duration of Exclusive Breast‐Feeding. Fifty‐Fourth World Health Assembly. Document A54/INF.DOC./4. WHO: Geneva. [Google Scholar]
- World Health Organization (WHO) (2001b) Infant and Young Child Nutrition. Fifty‐Fourth World Health Assembly. Resolution WHA54.2. WHO: Geneva. [Google Scholar]
- World Health Organization (WHO) (2006) Child Growth Standards: Length/Height‐for‐Age, Weight‐for‐Age, Weight‐for‐Length, Weight‐for‐Height and Body Mass Index‐for‐Age: Methods and Development. WHO: Geneva. [Google Scholar]
- World Health Organization (WHO) (2007) WHO Anthro for Personal Computers, Version 2, 2007: Software for Assessing Growth and Development of the World's Children. WHO: Geneva. Available at: http://www.who.int/childgrowth/software/en/ [Google Scholar]
- World Health Organization (WHO) (2008) Indicators for Assessing Infant and Young Child Feeding Practices: Part 1 Definitions Geneva. WHO: Genava. [Google Scholar]
- WHO (2009) Cameroon: child malnutrition estimates by WHO Child Growth Standards. Available at: http://www.who.int/nutgrowthdb/database/countries/who_standards/cmr.pdf[Accessed 3 February 2009].