

Abstract
Assessing micronutrient status in children may also have the benefit of addressing the problems of various micronutrient deficiencies with a unified programmatic approach on a public health scale. A cross‐sectional survey in the Galle district of the micronutrient and anthropometric status of 248 children of ages 3–5 years was performed to determine the prevalence of micronutrient deficiencies [iron, zinc (Zn), folate, calcium, caeruloplasmin, iodine, vitamin A and vitamin D] and the extent to which multiple micronutrient deficiencies coexist. The prevalence of anaemia [haemogbolin (Hb) < 110.0 g L−1] was 34.0% in males and 33.0% in females (overall 33.5%, gender difference, P = 0.92). In anaemic children, 7.0% of males and 15.0% of females were iron deficient (serum ferritin < 15.0 µg L−1). Folate deficiency (<3.00 ng mL−1) was found in 41.0% and 33.0% of male and female, respectively, whereas Zn deficiency (<9.95 µmol L−1) occurred in 57.0% and 50.0% of male and female, respectively. Serum vitamin D deficiency (<35.0 nmol L−1) was found in 26% and 25% of male and female, respectively. Anaemic males had a 3.0‐fold (95% confidence interval (CI) 1.1–8.3) and 2.3‐fold (95% CI 0.8–6.6) greater risk of being underweight and thin, whereas the risk among anaemic females was 0.7‐fold (95% CI 0.3–1.8) and 0.9‐fold (95% CI 0.3–2.6) for being underweight and thin. Only 7.3% of the subjects did not have any micronutrient deficiency, 38.3% were deficient in two micronutrients, 17.7% had three micronutrient deficiencies and 6.0% had four or more micronutrient deficiencies. Multiple micronutrient deficiencies are prevalent in Sri Lankan pre‐school children and established baseline data for future studies.
Keywords: pre‐school children, micronutrient status, iron, zinc, anaemia, vitamin A, vitamin D, folate, caeruloplasmin
Introduction
Inadequate nutrient intake during childhood leads to undernutrition, which results in growth retardation, reduced work capacity, and poor mental and social development (Sandstead et al. 1998; Harahap et al. 2000). The deficiency of nutrients can adversely affect the linear growth, cognition and muscle development. While the role of energy and proteins on physical growth is well established, recent studies have stressed on the importance of micronutrients in enhancing the full‐growth potential of children (Rivera et al. 2003). Micronutrient deficiencies represent a hidden form of hunger, with severe consequences on physical growth, immune functions and cognition (Bhan et al. 2001). The effects of deficiencies are multiple and severe in children and may affect the linear growth, cognition and muscle development which are often irreversible. While the role of energy and proteins on physical growth is well established, a deficiency in the micronutrient intake may add to the insult. The genetic potential of children for physical growth and mental development will be compromised and the susceptibility to infections is increased even in subclinical deficiencies of multiple vitamins and minerals (Sarma 2009).
Multiple micronutrient deficiencies are very common, usually resulting from poor‐quality diets. The deficiencies of iron, vitamin A, zinc (Zn), vitamin B‐12, riboflavin, vitamin D and vitamin E are mostly prevalent and usually occur in combination mainly because of a low intake of foods of animal origin (Ramakrishnan 2002; Murphy & Allen 2003). Assessing micronutrient status in children may also have the benefit of addressing the problems of various micronutrient deficiencies, with a unified programmatic approach on a public health scale. To our knowledge, there is still a dearth of data on the micronutrient status of the Sri Lankan population. Studies on micronutrient status of Sri Lankan pre‐schoolers are rare and often limited to anaemia prevalence only. Therefore, the aim of this study was to investigate the importance of multiple micronutrient deficiencies among pre‐school children in the Southern region of Sri Lanka by examining the prevalence of iron, Zn, calcium, folate, caeruloplasmin, iodine vitamin A and vitamin D deficiencies, as well as anaemia and their interrelationships.
Key messages
-
•
This study reveals that 62% of the Sri Lankan pre‐school children had two or more coexisting micronutrient deficiencies. Of these, 6.0% had coexisting deficiencies with four or more micronutrients. Only 7.3% (n = 18) of the children were free from any of these deficiencies.
-
•
Anaemic boys were at a higher risk of being underweight (3.0‐fold) and thin (2.3‐fold), respectively. Risks among anaemic girls were 0.7 and 0.9. The risk of being folate deficient was 2.2 and 1.5 among anaemic boys and girls, respectively. Female anaemic children were at a higher risk to have deficiencies in caeruloplasmin and retinol.
-
•
The prevalence of vitamin A deficiency was 5.0 % in the sample studied. However, 72.0% of the population appeared vulnerable to vitamin A deficiency.
-
•
Iodine and copper deficiencies were not seen.
Materials and methods
The study was conducted in Galle District, Southern province of Sri Lanka during 2007 after obtaining approval from the Ethical Review Committee of the Faculty of Medicine, Galle. The study population comprised of children aged 3–5 years in the Bope‐Poddala health division which was randomly selected out of 19 such divisions in Galle. Of the four well‐baby clinics conducted in this area, two were selected by random sampling. The population of the eight public health midwifery (PHM) areas (the grass root level public health unit) was covered by these two clinics manned by eight PHMs. The parents of all pre‐school children (aged 3–5 years) who were in the registers maintained by the staff (n = 267) were invited to a meeting at which the purpose of the study was explained in detail. They were given an opportunity to ask questions regarding the study. Informed written consent was obtained from a parent of each study subject. Brief physical examination was conducted and medical history was obtained in order to assess eligibility for the study. Children who had a history of medical conditions lasting more than 1 month (n = 7) and consumed medications [including vitamin or mineral preparations for more than 1 month (n = 12)] were not included in the study. Height was obtained using a portable stadiometer with a precision of 0.1 cm. Weight was measured using a portable beam balance with non‐detachable weights with a precision of 0.1 kg. Each child was measured while wearing a light jacket without shoes. Both instruments were checked for zero error before commencement of each anthropometric session and all the measurements were obtained over a period of 1 week and performed by the same individual. The birthday of each child was obtained from the child's development record and the chronological age was expressed to the nearest month.
The sample (n = 248) was sufficient to detect a prevalence of 50% of any micronutrient deficiency with a confidence interval (CI) of ± 5%, an alpha error of 5% and a design effect of two. A fasting venous blood sample (5 mL) was obtained from the median‐cubital vein under aseptic conditions using disposable syringes. For the determination of haemogbolin (Hb), 20.0 µL of whole blood was pipetted onto filter paper and rest of the blood was collected in an acid‐washed centrifuge tube, kept in an ice box and transferred to the laboratory within 6 h. Serum was separated by centrifugation and stored in acid‐washed polystyrene tubes at −80°C until analysis for calcium, ferritin, folate, freeT4, caeruloplasmin, Zn, vitamin A and vitamin D levels.
Photometric cyanmethaemoglobin method was used to determine Hb levels at the Nutrition Research Laboratory, Faculty of Medicine in Galle. Serum ferritin (SF), vitamin D and folate were measured by the immunoradiometric assay and the radioimmunoassay (RIA) technique, respectively, at the RIA laboratory of the Nuclear Medicine Unit, Faculty of Medicine in Galle using reagents supplied by NETRIA Limited, England and Diagnostic Products Cooperation, LA, USA. Serum Zn and calcium were analysed by the enzyme‐linked immunosorbent assay technique at the RIA laboratory using reagents supplied by Bioassay Systems (Hayward, CA, USA). The serum retinol levels were determined by high‐performance liquid chromatography method at the Industrial Technology Institute, Colombo.
The 1978 CDC/WHO growth reference data were used from Epi‐info version 3.0 [Center for Disease Control and Prevention (CDC), Atlanta, Georgia, USA] for Windows to generate z‐scores of weight‐for‐age, height‐for‐age and weight‐for‐height. A z‐score ≤2.0 from the reference median was used to detect wasting, stunting and thinness, respectively. Anaemia was defined as an Hb concentration < 110.00 g L−1, depleted iron stores as SF < 12.00 µg L−1 and iron deficiency anaemia (IDA) as anaemia with depleted iron stores (Dallman et al. 1996). The following cut‐off values were used to define the deficiency status of respective biochemical parameters: serum folate < 3.00 ng L−1, serum Zn < 9.945 µmol L−1, freeT4 < 10.30 pmol L−1, vitamin D < 35.00 nmol L−1, serum calcium < 1.20 mmol L−1, caeruloplasmin < 240.00 mg dL and serum retinol <0.70 µmol L−1 (Pesce 2007).
Statistical analysis
A one‐sample Kolmogorov–Smirnov test was used to check the data for skewness and appropriate summary statistics was chosen; mean and standard deviation (SD) for symmetric data and median and interquartile range (IQR) for skewed data. Further, the skewed data were log transformed and then adjusted for age using analysis of variance. Further, chi‐square test was used to compare the prevalence of deficiencies and their differences between males and females. Pearson correlation coefficients were used to investigate the relationship between micronutrients status and anthropometry. SPSS (version 10.0; SPSS Inc., Chicago, IL, USA) software package was used for statistical analysis. P values less than 0.05 were considered significant.
Results
Of the 248 children in the study sample, 49.0% (n = 122) were males and 51.0% (n = 126) were females. Anthropometric indices of the subjects are presented in Table 1. Children were between 3 and 5 years of age and there was no significant difference in the mean age between males and females (P = 0.97). The prevalence of stunting (height‐for‐age z‐scores −2.0) was 2% in males and females. In the study population, 21% each of the males and females were underweight, and 19% of males and 14% of females had weight‐for‐height z‐scores less than −2.0 (P = 0.18).
Table 1.
Anthropometric indices and the biochemical status of the children*
| Variable | Unit | Mean (SD) of | |
|---|---|---|---|
| Male (n = 122) | Female (n = 126) | ||
| Age | Months | 45.93 (9.8) | 46.56 (8.5) |
| Weight | kg | 14.02 (2.2) | 13.31 (2.0) |
| Height | cm | 100.74 (5.9) | 99.25 (5.9) |
| Body mass index | kg m−2 | 13.78 (1.2) | 13.45 (1.0) |
| Weight‐for‐age z‐score | −1.39 (1.0) | −1.53 (0.9) | |
| Height‐for‐age z‐score | −0.37 (1.0) | −0.46 (0.9) | |
| Weight‐for‐height z‐score | −1.46 (0.9) | −1.48 (0.8) | |
| Haemoglobin | g L−1 | 111.43 (9.9) | 114.00 (9.9) |
| Serum ferritin | µg L−1 | 34.55 (23.05, 51.09) | 36.57 (25.91, 54.74) |
| Serum calcium | mmol L−1 | 1.88 (0.5) | 1.96 (0.5) |
| Serum caeruloplasmin | mg L−1 | 321.94 (1.3) | 316.93 (1.3) |
| Serum free thyroxine | pmol L−1 | 14.83 (1.4) | 15.08 (1.3) |
| Serum zinc | µmol L−1 | 8.55 (3.3) | 8.90 (3.2) |
| Serum folate | ng mL−1 | 4.54 (1.8) | 4.91 (1.8) |
| Serum retinol | µmol L−1 | 0.92 (0.06) | 1.06 (0.06) |
| Serum vitamin D | nmol L−1 | 87.00 (33.5) | 81.55 (37.0) |
Results are presented as mean (standard deviation), except for serum ferritin presented as median (interquartile range).
The biochemical parameters studied are summarized in Table 1. There was a significant difference in the age‐adjusted mean Hb concentrations between males [111.43 (9.9) g L−1] and females [114.00 (9.9) g L−1] (P = 0.05), showing better Hb status among females. However, there was no difference in the prevalence of anaemia (Hb < 110.g L−1); nearly one‐third of subjects in either sex were found to be affected. A low prevalence of IDA was observed (2% of male children and 5% of female children, respectively, P = 0.59).
Iron stores were assessed by SF and results are presented in median and IQR (Table 1). The SF levels did not show a significant difference between sexes. Although the children in our study were apparently clinically healthy, we did not have any information regarding concurrent subclinical infections. When a more inclusive cut‐off for SF was used (<30 µg L−1), 37% males and 33% females of the sample were classified as iron deficient.
This study has developed the first database on the evaluation of micronutrients and calcium levels in this age group of the Sri Lankan population. Using the cut‐off value of 1.20 mmol L−1, overt calcium deficiency was seen in 8% (n = 10) of males and 6% (n = 8) of females (P = 0.76). Serum caeruloplasmin level was measured as a marker of copper transport protein as well as an acute phase protein using a RIA technique. There was no difference in the mean caeruloplasmin levels between sex and age groups [age adjusted mean, 321.94 (1.3) in males and 316.93 (1.3) in females, respectively, P = 0.45]. All the subjects were below the age‐related upper limit of 560.0 mg L−1. Low‐serum caeruloplasmin (<240.0 mg L−1) was noted in 7% (n = 9) of males and 11% (n = 14) of females (P = 0.23).
The levels of serum Zn and folate are illustrated in Table 1. There were no differences in age‐adjusted mean levels of both these parameters. Zn deficiency was seen in 57% (n = 70) of males and 49% (n = 62) of females (P = 0.21) when a cut‐off of 9.945 µmol L−1 was used. Folate deficiency was found in 41% of males (n = 50) and 32% (n = 40) of females (P = 0.08). Serum retinol and vitamin D status are shown in Table 1. Over one‐fourth of the sample was deficient in vitamin D (26% male and 25% female children, respectively, P = 0.65).
Hb level was seen positively correlated with serum retinol (r = 0.20, P < 0.001) and SF (r = 0.20, P = 0.02), and negatively with vitamin D (r = −0.26, P = 0.02), weight (r = −0.15, P = 0.03) and height (r = −0.14, P = 0.04).
Figure 1 shows the prevalence of multiple micronutrient deficiencies in the sample studied. It is seen that 62% (n = 154) of the pre‐school children had two or more coexisting micronutrient deficiencies. Six per cent (n = 15) of children had coexisting deficiencies with four or more micronutrients. Furthermore, only 7.3% (n = 18) were free from these deficiencies. A logistic regression was conducted in order to examine the risk factors associated with anaemia and deficiencies of micronutrients (Table 2). Anaemic boys had a 3.0‐fold (95% CI 1.1–8.3, P = 0.03) and 2.3‐fold (0.8–6.6, P = 0.15) greater risk of being underweight and thin, respectively, whereas the risk among anaemic girls being underweight and thin was 0.7‐fold (0.3–1.8, P = 0.32) and 0.9‐fold (0.3–2.6, P = 0.52), respectively (Table 2). The risk of being folate deficient was 2.2 (1.8–6.0, P = 0.02) among anaemic boys and 1.5 (1.1–4.3, P = 0.02) among anaemic girls. It was evident that female anaemic children will carry more risk to have deficiencies in other micronutrient deficiencies, i.e. folate, caeruloplasmin and retinol (Table 2).
Figure 1.
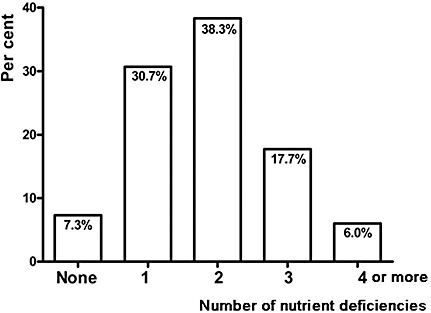
Percentage of subjects and prevalence of either none or single or multiple micronutrient deficiencies among study subjects.
Table 2.
Risk of anaemic children of having deficiencies in growth and micronutrients*
| Indicator | Males (n = 42) | P value | Females (n = 41) | P value |
|---|---|---|---|---|
| Underweight | 3.0 (1.1, 8.3) | 0.03 | 0.7 (0.3, 1.8) | 0.32 |
| Thinness | 2.3 (0.8, 6.6) | 0.15 | 0.9 (0.3, 2.6) | 0.52 |
| Iron deficiency | 1.1 (0.5, 2.4) | 0.53 | 2.4 (1.0, 5.5) | 0.03 |
| Folate deficieny | 2.2 (1.8, 6.0) | 0.02 | 1.5 (1.1, 4.3) | 0.02 |
| Vitamin D deficiency | 1.1 (0.9, 1.2) | 0.53 | 0.8 (0.1, 10.0) | 0.70 |
| Caeruloplasmin deficiency | 1.9 (0.5, 7.5) | 0.48 | 1.8 (1.1, 2.7) | 0.03 |
| Calcium deficiency | 0.44 (0.1, 2.3) | 0.47 | 2.4 (1.2, 15.3) | 0.001 |
| Zinc deficiency | 0.78 (0.3, 2.2) | 0.63 | 1.2 (0.7, 2.2) | 0.24 |
| Retinol deficiency | 2.0 (0.9, 4.4) | 0.15 | 3.8 (1.5, 9.2) | 0.003 |
| Iron and folate deficiency | 1.1 (0.3, 5.0) | 0.59 | 2.3 (1.8, 7.5) | 0.02 |
| Iron and zinc deficiency | 1.5 (0.6, 4.0) | 0.27 | 1.7 (0.8, 3.5) | 0.10 |
| Iron and vitamin D deficiency † | 1.0 (0.9, 1.0) | 0.58 | – | |
| Iron and retinol deficiency | 1.1 (0.3, 3.2) | 0.57 | 0.2 (0.05, 1.0) | 0.05 |
| Folate and zinc deficiency | 0.5 (0.1, 1.7) | 0.21 | 4.6 (1.1, 20.9) | 0.03 |
Age adjusted odds ratios; 95% confidence interval in parentheses; for the definition of each deficiency parameter, refer to the text.
† None of the anaemic female children was vitamin D deficient.
Discussion
This report is a part of a comprehensive study on the assessment of the overall nutritional status of pre‐school children in Sri Lanka. The aetiology of multiple micronutrient deficiencies is multifactorial; inadequate intake, genetic and infectious diseases may all play a role (Fishman et al. 2000; Stolzfus 2001). Our previous studies confirmed that micronutrient deficiencies are highly prevalent in this region (Hettiarachchi et al. 2006).
The present study demonstrated that micronutrient deficiencies were very common among the pre‐school children studied. Our findings showed that the prevalence of anaemia was as high as 33%. Of the anaemics, only a lesser number of cases were found with either storage iron depletion or IDA. This finding was unexpected in light of the assumed role of nutritional iron deficiency in the aetiology of anaemia but was nevertheless consistent with previous reports from Vietnamese (Nhien et al. 2008) and Thai (Thurlow et al. 2005) children as well as adolescents from same settings (Hettiarachchi et al. 2006).
Serum retinol levels are positively associated with the Hb concentration in the present study. This finding is in agreement with the results obtained from other parts of Asia (Semba & Bloem 2002; Palafox et al. 2003; Nhien et al. 2008). Vitamin A deficiency definitely impairs Hb synthesis (Hodges et al. 1978). It has been reported that vitamin A supplementation improved Hb response to iron supplements in Malawian infants (Kumwend et al. 2002) and Tanzanian school children (Mwanri et al. 2000).
Though the prevalence of vitamin A deficiency was 5.0% in the sample studied, a marginal vitamin A status (0.70–1.04 µmol L−1) was observed in 72% of the population, which may be vulnerable to vitamin A deficiency. This indicates that vitamin A deficiency is going to be a public health problem in school‐age children. Vitamin A capsule distribution programmes are the main strategy for reducing vitamin A deficiency in many developing countries. We have reported that the consumption of vitamin A‐rich food was low in this population (Hettiarachchi & Liyanage 2010). We suggest that the strategy for reducing the prevalence of vitamin A deficiency and improving vitamin A status of pre‐school children in Sri Lanka should be based on vitamin A capsule distribution programmes, dietary improvement through the promotion of food production and consumption at the family level, and the development of nutrition education activities for the community.
The present study also reports that nearly 50% of the subjects were deficient in Zn, indicating that the storage of Zn was much less than the normal. Information on expected prevalence of Zn deficiency in high‐risk populations is still limited in Sri Lanka. However, we have reported 55% deficiency among school children aged 11–16 years in 2006 from the similar settings (Hettiarachchi et al. 2006) and this is a higher figure in comparison with the 20% prevalence set by the International Zinc Nutrition Consultative Group as an indicator for the need of a national intervention programme (Hotz & Brown 2006). It has been found recently that 87% of the Vietnamese pre‐schoolers (Nhien et al. 2008) and 57% of Thai school children aged 6–13 years (Thurlow et al. 2006) had Zn deficiency based on the same cut‐off values used in the present study.
The global prevalence of folic acid deficiency is unknown. We were unable to trace any published data on folate status in this age group. However, we report a folate deficiency of 41% in males and 32% in females in the present study. We also measured serum‐free thyroxine and caeruloplasmin levels as a surrogate marker for iodine and copper levels, respectively. Both these levels were found to be adequate and none of the children had low thyroxine level. Volzke et al. (2006) reported that there was no association between thyroid function and SF levels after age‐adjusted and gender‐stratified analyses in adults aged 20–79 years. Similarly, we did not observe any significant correlation between SF and free thyroxin levels (r = −0.02; P = 0.79).
The prevalence figures of vitamin D deficiency in children are sparse or incomplete in most countries. A comparison of our data on serum vitamin D with other studies may not be entirely appropriate given the fact that different studies have been conducted in different seasons and using different assays. Nonetheless, according to the Lips classification (Lips 2001), severe hypovitaminosis D (<12.5 nmol L−1) was not seen in our study population, whereas it was found in 8.6% in India (Marwaha et al. 2005), 23.5% among Finnish children (Ala‐Houhala et al. 1984) and 45.2% among Chinese girls (Du et al. 2001) during winter. In the latter study, the prevalence was 6.7% in the same cohort when evaluated in summer.
It appears from this investigation that more than 60% of Sri Lankan pre‐schoolers are suffering from two or more coexisting micronutrient deficiencies. In contrast, nearly 80% of Vietnamese young children (Nhien et al. 2008) had two or more deficiencies out of the six micronutrients studied (i.e. iron, Zn, copper, magnesium, selenium and vitamin A). It is also evident in our study that the female anaemic pre‐school children suffer from other micronutrient deficiencies as well more than their male counterparts; as such, it is important to assess the trend in the future. Further, the micronutrient deficiencies often coexist and concern on the interactions between micronutrients also become important, not only at the site of absorption, such as for iron and Zn, but also in functional terms as well.
This is the first study to demonstrate the distribution of iron, Zn, calcium, folate, caeruloplsmin, iodine, vitamin A and vitamin D among pre‐school children in Sri Lanka. To our knowledge, there are few studies on the concentrations of serum trace elements in this age group (Gurgoze et al. 2006; Thurlow et al. 2006; Nhien et al. 2008). All these studies have shown coexistence of micronutrient deficiencies in about two‐third (sometimes even more) of the children studied, indicating the widespread nature of the issue. These findings also explain why some interventions based on single micronutrients have had limited success in developing countries (Allen et al. 2000). In this context, it is of interest to note that the aetiology for some disorders, such as anaemia, is not specific to the deficiency of a single micronutrient. Therefore, strategies for the prevention and control of micronutrient deficiencies, for improving public health nutrition, should be carried out with varying methods for comprehensive achievement.
A limitation of the present study is that no information on the socio‐economic status is available. We have reported dietary intakes and anthropometry of the same study subjects in a separate report (Hettiarachchi & Liyanage 2010). Such data may provide useful information to explain the situation of trace element status in the population studied.
In conclusion, this study shows that micronutrient deficiency is a public health problem among pre‐school children in Sri Lanka. The findings highlight that majority of these children suffer from at least two micronutrient deficiencies. This study has identified important nutritional deficiencies in pre‐school age and established baseline data for future studies. Most importantly, the results presented here should raise a note of caution for public and private organizations serving underprivileged populations.
Source of funding
This study was done with financial assistance from the International Atomic Energy Agency (IAEA‐SRl‐11958).
Conflicts of interest
The authors declare that they have no conflicts of interest.
Contributions
Both authors were responsible for the conception and design of the study; doing the field and experimental data collection; data analysis and interpretation; preparation of draft manuscript and doing revisions; with overall scientific management.
Acknowledgements
We thank the technical officers of the Nuclear Medicine Unit (Mr PH Nadun Suranga, Mr LAS Dharmapriya and Ms RD Basnayake) for the analysis of serum samples and the Industrial Technology Institute, Colombo (Ms. SC Hatharasinghe and Mr MNA Mubarak) for the analysis of serum samples for vitamin A.
References
- Ala‐Houhala M., Parviainen M.T., Pyykko K. & Visakorpi J.K. (1984) Serum 25‐hydroxyvitamin D levels in Finnish children aged 2 to 17 years. Acta Pediatrica Scandenavia 73, 232–236. [DOI] [PubMed] [Google Scholar]
- Allen L.H., Rosado J.L., Casterline J.E., Lopez P., Munoz E., Garcia O.P. et al (2000) Lack of hemoglobin response to iron supplementation in anemic Mexican preschoolers with multiple micronutrient deficiencies. American Journal of Clinical Nutrition 71, 1485–1494. [DOI] [PubMed] [Google Scholar]
- Bhan M.K., Sommerfelt H. & Strand T. (2001) Micronutrient deficiency in children. British Journal of Nutrition. 85, S199–S203. [DOI] [PubMed] [Google Scholar]
- Dallman P.R., Looker A.C., Johnson C.L. & Carroll M. (1996) Influence of age on laboratory criteria for the diagnosis of iron deficiency anemia and iron deficiency in infants and children In Iron Nutrition in Health and Disease (eds Hallberg L. & Asp N.G.), pp. 65–74. John Libbey & Company: London. [Google Scholar]
- Du X., Greenfield H., Fraser D.R., Ge K., Trube K. & Wang Y. (2001) Vitamin D deficiency and associated factors in adolescent girls in Beijing. American Journal of Clinical Nutrition 74, 494–500. [DOI] [PubMed] [Google Scholar]
- Fishman S.M., Christian P. & West K.P. (2000) The role of vitamins in prevention and control of anemia. Public Health Nutrition 3, 125–150. [DOI] [PubMed] [Google Scholar]
- Gurgoze M.K., Olcucu A., Aygun A.D., Taskin E. & Kilic M. (2006) Serum and hair levels of zinc, selenium, iron and copper in children with iron deficiency anaemia. Biological Trace Element Research 111, 23–29. [DOI] [PubMed] [Google Scholar]
- Harahap H., Jahari A.B., Husaini M.A., Saco‐Pollitt C. & Pollitt E. (2000) Effects of an energy and micronutrient supplement on iron deficiency anemia, physical activity and motor and mental development in undernourished children in Indonesia. European Journal of Clinical Nutrition 54, S114–S119. [DOI] [PubMed] [Google Scholar]
- Hettiarachchi M. & Liyanage C. (2010) Dietary macro and micronutrient intake among a cohort of pre‐school children from Southern Sri Lanka. Ceylon Medical Journal 55, 47–52. [DOI] [PubMed] [Google Scholar]
- Hettiarachchi M., Liyanage C., Wickremasinghe R., Hilmers D.C. & Abrams S.A. (2006) Prevalence and severity of micronutrient deficiency: a cross‐sectional study among adolescents in Sri Lanka. Asia Pacific Journal of Clinical Nutrition. 15, 56–63. [PubMed] [Google Scholar]
- Hodges R.E., Sauberlich H.E. & Mohanram M. (1978) Hematopoietic studies in vitamin A deficiency. American Journal of Clinical Nutrition 31, 876–885. [DOI] [PubMed] [Google Scholar]
- Hotz C. & Brown K.H. (2006) Assessment of the risk of zinc deficiency in populations and options for its control. Food and Nutrition Bulletin 25, 99S–199S. [PubMed] [Google Scholar]
- Kumwend N., Miotti P.G., Taha T.E., Broadhead R., Biggar R.J., Jackson J.B. et al (2002) Antenatal vitamin A supplementation increases birth weight and decreases anemia among infants born to human immunodeficiency virus infected women in Malawi. Clinical Infectious Diseases 35, 618–624. [DOI] [PubMed] [Google Scholar]
- Lips P. (2001) Vitamin D deficiency and secondary hyperparathyroidism in the elderly: consequences for bone loss and fractures and therapeutic implications. Endocrine Review 22, 477–501. [DOI] [PubMed] [Google Scholar]
- Marwaha R.K., Tandon N., Reddy D.H.K., Agarwal R., Singh R., Sawhney R.C. et al (2005) Vitamin D and bone mineral density status of healthy schoolchildren in northern India. American Journal of Clinical Nutrition 82, 477–482. [DOI] [PubMed] [Google Scholar]
- Murphy S.P. & Allen L.H. (2003) Nutritional importance of animal source foods. Journal of Nutrition 133, 3932S–3935S. [DOI] [PubMed] [Google Scholar]
- Mwanri L., Worsley A., Ryan P. & Masika J. (2000) Supplemental vitamin A improves anemia and growth in anemic school children in Tanzania. Journal of Nutrition 130, 2691–2696. [DOI] [PubMed] [Google Scholar]
- Nhien N.V., Khan N.C., Ninh N.X., Huan P.V., Hop L.T., Lam N.T. et al (2008) Micronutrient deficiencies and anemia among preschool children in rural Vietnam. Asia Pacific Journal of Clinical Nutrition 17, 48–55. [PubMed] [Google Scholar]
- Palafox N.A., Gamble M.V., Dancheck B., Ricks M.O. & Semba R.D. (2003) Vitamin A deficiency, iron deficiency and anemia among preschool children in the Republic of the Marshell Islands. Nutrition 19, 405–408. [DOI] [PubMed] [Google Scholar]
- Pesce M.A. (2007) Reference ranges for laboratory tests and procedures In Nelson's Textbook of Pediatrics (eds Klegman R.M., Behrman R.E., Jensen H.B. & Stanton B.M.D.), 18th edn, pp. 2943–2949. Elsevier Saunders: Philadelphia. [Google Scholar]
- Ramakrishnan U. (2002) Prevalence of micronutrient malnutrition worldwide. Nutrition Review 60, 46S–52S. [DOI] [PubMed] [Google Scholar]
- Rivera J.A., Hotz C., Gonzalez‐Cossio T., Neufeld L. & Garcia‐Guerra A. (2003) The effect of micronutrient deficiencies on child growth: a review of results from community‐based supplementation trials. Journal of Nutrition 133, 4010S–4020S. [DOI] [PubMed] [Google Scholar]
- Sandstead H.H., Penland J.G., Alcock N.W., Dayal H.H., Chen X.C., Li J.S. et al (1998) Effects of repletion with zinc and other micronutrients on neuro‐psychologic performance and growth of Chinese children. American Journal of Clinical Nutrition 68, S470–S475. [DOI] [PubMed] [Google Scholar]
- Sarma K.V.R. (2009) Micronutrients – an essential aid to daily growth in children. Indian Pediatrics 46, 12S–19S. [PubMed] [Google Scholar]
- Semba R.D. & Bloem M.W. (2002) The anemia of vitamin A deficiency: epidemiology and pathogenesis. European Journal of Clinical Nutrition 56, 271–281. [DOI] [PubMed] [Google Scholar]
- Stolzfus R.J. (2001) Defining iron‐deficiency anemia in public health terms: a time for reflection. Journal of Nutrition 31, 565S–567S. [DOI] [PubMed] [Google Scholar]
- Thurlow R.A., Winichagon P., Green T., Wasantwisut E., Pongcharoen T., Bailey K.B. & Gibson R.S. (2005) Only a small proportion of anemia in northeast Thai schoolchildren is associated with iron deficiency. American Journal of Clinical Nutrition 82, 380–387. [DOI] [PubMed] [Google Scholar]
- Thurlow R.A., Winichagon P., Pongcharoen T., Gowachirapant S., Boonpraderm A., Manger M.S. et al (2006) Risk of zinc, iodine and other micronutrient deficiencies among school children in North East Thailand. European Journal of Clinical Nutrition. 60, 623–632. [DOI] [PubMed] [Google Scholar]
- Volzke H., Wallaschofski H., Wolff B., Berger K., John U., Dörr M. et al (2006) Thyroid function and serum ferritin levels: the study of health in Pomerania. Thyroid 16, 681–686. [DOI] [PubMed] [Google Scholar]