

Abstract
This paper outlines the economic rationale for investments that reduce stunting. We present a framework that illustrates the functional consequences of stunting in the 1000 days after conception throughout the life cycle: from childhood through to old age. We summarize the key empirical literature around each of the links in the life cycle, highlighting gaps in knowledge where they exist. We construct credible estimates of benefit–cost ratios for a plausible set of nutritional interventions to reduce stunting. There are considerable challenges in doing so that we document. We assume an uplift in income of 11% due to the prevention of one fifth of stunting and a 5% discount rate of future benefit streams. Our estimates of the country‐specific benefit‐cost ratios for investments that reduce stunting in 17 high‐burden countries range from 3.6 (DRC) to 48 (Indonesia) with a median value of 18 (Bangladesh). Mindful that these results hinge on a number of assumptions, they compare favourably with other investments for which public funds compete.
Keywords: stunting, economic productivity, benefitstunting, economic productivity, benefit–cost ratios
Introduction
Stunting, defined as having a height‐for‐age z‐score (HAZ) that is more than two standard deviations below the age–sex median for a well‐nourished reference population, remains widespread in low‐ and middle‐income countries. Black et al. (2013) estimated that in 2011, 165 million children in low‐ and middle‐income countries were stunted. There has been a dramatic reduction in the prevalence of stunting in Asia, from 49% in 1990 to 28% in 2010, nearly halving the number of stunted children from 190 million to 100 million. Nevertheless, the majority of those stunted remain in Asia. The stunting prevalence in Africa has stagnated at about 40% since 1990 and accounts for the second largest regional share of world stunting, a share that is increasing (de Onis et al. 2010).1
Undernutrition has been described as ‘a scourge in our world’ (DFID 2011). But in a world characterised by limited public resources and many global scourges, while there is a clear intrinsic rationale for investing in reducing stunting, the rationale for public investments that reduce stunting is strengthened if it can be shown that these have substantive economic returns.2 This paper, building on our earlier work (Behrman et al. 2004; Horton et al. 2010; Hoddinott et al. 2013), seeks to do so. The rest of this paper is organised as follows. The second section presents a framework for understanding the economic rationale for investments to reduce stunting. The third section discusses the pathways through which stunting might have economic losses. The fourth section presents and discusses estimates of the benefits and costs of investments in stunting reduction. The fifth section presents and discusses benefit–cost ratios for investments to reduce stunting in high‐burden countries. The final section presents discussion and conclusions.
Key messages
There are significant, lifelong economic benefits from averting stunting.
For the set of nutrition‐specific interventions that we consider, there is a consensus on their effectiveness and their costs.
The benefit–cost ratios associated with implementing these interventions exceed one in all countries considered in our study. They are larger than many other development interventions.
Thus, countries that want to generate and sustain broad‐based wealth are likely to find that scaling‐up these nutritional interventions to be some of the best investments they can make.
A framework for understanding the economic rationale for investments to reduce stunting
Although they use somewhat different language, nutritionists and economists share a common understanding of the causes of stunting in early life. In the widely used UNICEF conceptual framework, for example, early life child undernutrition is directly caused by disease or inadequate dietary intake. In turn, these reflect four underlying causes: household food insecurity, inadequate care, unhealthy conditions and absence of access to health services (UNICEF 1990). To understand the economic rationale for investments that reduce stunting, a life‐cycle framework is important because investments to reduce stunting in early life may have impacts in terms of adult productivities and chronic diseases decades later.3
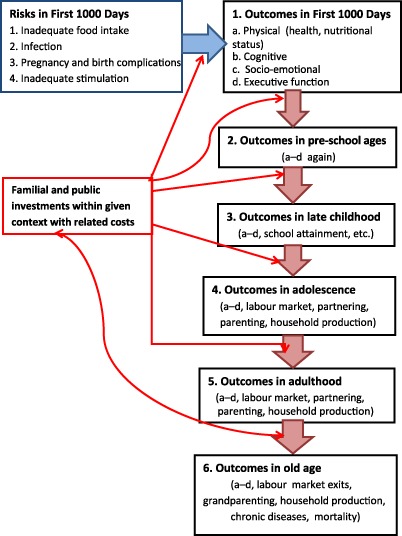
We consider such a framework with six life‐cycle stages: (1) the First 1000 Days;4 (2) subsequent early childhood (i.e. from the end of the First 1000 Days of life to the normal school entry age ∼5 or 6 years); (3) late childhood; (4) adolescence; (5) adulthood (including fertility and parenting and therefore intergenerational effects); and (6) old age. Children start life with a given set of genetic and environmental endowments. Conditional on these endowments, stunting and other dimensions of early childhood development are affected by investments that mitigate four risk factors: inadequate food intake in terms of both macronutrients and micronutrients, infection, complications during pregnancy and birth, and inadequate stimulation and nurturing. These investments emanate from two sources: familial or private sources such as family‐provided food and care, and public investments (public in the sense that their supplies are the results of policy decisions) such as the accessibility and quality of health care, publicly provided sanitation and the public provision of macronutrients and micronutrients. An important feature of this framework is that, in contrast to the UNICEF conceptual framework, it explicitly separates the underlying causes of stunting into those that reflect private/familial decisions and those that reflect public policy decisions to undertake, or not undertake, investments that mitigate the risk factors for stunting described above.
Figure 1 presents a simplified overview of such a framework. The four risk factors are indicated in the box to the upper left. They affect outcomes in the First 1000 Days such as (1) physical (health and nutritional) status but also (2) cognitive skills, (3) socio‐emotional skills and (4) executive function/self‐regulation (in the box at the upper right), which, in turn, affect outcomes in the subsequent sequential life‐cycle stages. Stunting is the most common measure of the long‐run nutritional status component of the physical status outcome. Familial investments and public investments, in the centre left of the figure in the box, may moderate not only the four risk factors and their impacts on outcomes such as stunting in the First 1000 Days of life but also how the outcomes of the First 1000 Days have impacts over the life cycle. As noted in the box, these investments occur within a particular context and have resource costs associated with them. Across contexts, the effects of these investments and their resource costs are likely to vary.
Figure 1.
A life‐cycle approach to investments in the First 1000 Days.
Within this framework, parents make decisions that affect child developmental outcomes, including stunting, during the First 1000 Days. Outcomes in the next (pre‐school) life‐cycle stage reflect the outcomes of the First 1000 Days, familial and public investments at the pre‐school life‐cycle stage and random factors such as variations in the disease/nutrition/cognitive and socio‐emotional stimulation environment in which the family lives. Note that the outcomes at the end of the First 1000 Days stage may complement or substitute investments in the next pre‐school life‐cycle stage. Familial and public investments also may compensate or reinforce each other. To illustrate, public investments that reduce the occurrence of dehydration stemming from diarrhoea may lead parents to provide children with more cognitive and socio‐emotional stimulation (complementarity). For another example, when the quality of public day care services is low, parents may spend more resources on private alternatives (substitution). The outcomes of the pre‐school ages (stage 2), thus, are produced by the outcomes of the First 1000 Days (stage 1) plus familial and public investments in the second life‐cycle stage and by a random term. Similarly, the outcomes of the late childhood ages (stage 3) are produced by the outcomes of the pre‐school ages (stage 2) plus familial and public investments in the third life‐cycle stage and by a random term – and so on through the six life‐cycle stages.
The outcomes for the adult and old‐age life stages include not only the four noted above but also outcomes such as labour force participation, wage earnings, marriage market outcomes, involvement in crime and violence, adult health and nutritional status, and fertility and parenting of the next generation. Therefore, it is possible to examine the impact on outcomes through the life cycle of whether a child experienced the four risk factors of interest and of polices and other behaviours that mitigate the impact of the risk factors on outcomes such as stunting in the First 1000 Days. In the context of Fig. 1, we can think of there being direct arrows from one of the top two boxes for the First 1000 Days to the box for adult outcomes with the sequence of factors exogenous to the household, including public investments during the intervening period, modifying those arrows. An example of this approach is found in the study of Maluccio et al. (2009) who assessed the impact of publicly provided supplementary feeding during the First 1000 Days on cognitive skills in adulthood.
Understanding the pathways through which stunting generates economic losses
This framework points to a number of potential positive impacts over the life cycle of investments that reduce stunting. We now review the evidence on some of these pathways that are thought to be central.
Loss of physical growth potential
Stein et al. (2010) drew on the COHORTS data from five countries (Brazil, Guatemala, India, the Philippines, South Africa) and showed that growth failure in the first 24 months of life is associated with reduced stature in adulthood. Using different methods, Coly et al. (2006) and Alderman et al. (2006) obtained similar findings in Senegal and Zimbabwe. The magnitudes of this loss of growth are large. For example, in their Senegalese study, Coly et al. (2006) found that the age‐adjusted height deficit between stunted and non‐stunted children was 6.6 cm for women and 9.0 cm for men.
There is a body of evidence that shows associations between height and outcomes in the labour market in developing countries (Immink & Viteri 1981; Deolalikar 1988; Behrman & Deolalikar 1989; Haddad & Bouis 1991; Strauss & Thomas 1996; Thomas & Strauss 1997; Schultz 2002, 2003). For example, Thomas and Strauss found that in Brazil, a 1.0% increase in height leads to a 2.4% increase in adult male earnings in a regression of log hourly wages on height and completed grades of schooling, controlling for selectivity into employment (Thomas & Strauss 1997). Moreover, height is also associated with increased earnings in developed economies (Persico et al. 2004; Case & Paxson 2008) where for the vast majority of occupations, there is no obvious link between physical stature and productivity. Consequently, interpretation of the observed correlations has focused on possible dimensions of human capital for which attained height might be a proxy measure, such as social skills attained in adolescence (Persico et al. 2004), cognitive ability (Case & Paxson 2008), social class (Steckel 2009) or general healthiness (Lundborg et al. 2009).
Cognitive impairments
Chronic undernutrition has neurological consequences that lead to cognitive impairments. In a review of early evidence, Levitsky & Strupp (1995) noted that the prefrontal cortex may be especially vulnerable to undernutrition. Evidence that undernourished children score poorly on tests of attention, fluency and working memory are consistent with this (Kar et al. 2008). Undernutrition adversely affects the hippocampus by reducing dendrite density (Blatt et al. 1994; Mazer et al. 1997; Ranade et al. 2008) and by damaging the chemical processes associated with spatial navigation, memory formation (Huang et al. 2003) and memory consolidation (Valadares & de Sousa Almeida 2005). Chronic undernutrition results in reduced myelination of axon fibres, thus reducing the speed at which signals are transmitted (Levitsky & Strupp 1995). Chronic undernutrition damages the occipital lobe and the motor cortex (Benítez‐Bribiesca et al. 1999), leading to delays in the evolution of locomotor skills (Barros et al. 2006). Brown & Pollitt (1996) posit that these damaging effects are exacerbated by the interactions that occur, or do not occur, between children and their caregivers. For example, delayed development of motor skills such as crawling and walking, together with lethargy and increased incidence of illness in undernourished infants, reduces their interactions with adults and with their environment.
Cognitive impairments experienced in early life have long‐term consequences (Victora et al. 2008). Kar et al. (2008) found that in Indian children 5–7 and 8–10 years, stunting affects the development of higher cognitive processes such as tests of attention, working memory, learning and memory and visuospatial ability. Victora et al. (2008), summarising evidence found in the Philippines (Mendez & Adair 1999), Guatemala (Maluccio et al. 2009) and Zimbabwe (Alderman et al. 2006), showed that stunting or other measures of lost growth potential is associated with reduced grade attainment (Victora et al. 2008). Hoddinott et al. (2011) showed that Guatemalan adults who had been stunted at age 36 months had lower scores on tests of vocabulary and non‐verbal cognitive ability than comparable individuals who had not been stunted.
There are numerous studies that examine the relationship between schooling, cognitive skills and earnings and income in adulthood. A summary by Hanushek and Wößmann (2008) indicates that across a range of countries, being literate raises earnings by 10%, and that an additional grade of schooling, controlling for literacy, raises earnings by an addition 5%. Hanushek and Wößmann, however, stress that learning, not years of schooling, is the driving force for this increase in productivity. In Guatemala, Behrman et al. (2010) found that an additional grade of schooling raises wages by 9% and that an increase of one standard deviation in tests of reading and vocabulary raises wages by 35%.
Increased risk of chronic disease
Separating the concept of malnutrition into undernutrition and overnutrition is a false dichotomy; early malnutrition may be a risk factor for obesity as well as some types of chronic diseases in adults.
In a seminal paper, Barker & Osmond (1986) traced adult illness in England and Wales to birthweight records and from this developed the fetal origins hypothesis. While the so‐called Barker hypothesis remains controversial, the evidence for it is stronger than when originally proposed.
One source of evidence on the links between early life undernutrition has been famine survivors. For example, given the short duration of the Dutch famine and the rapid return to relative food abundance, this event has facilitated a nuanced assessment of critical periods during pregnancy. As the children born during and immediately after the Dutch famine enter into their middle age, it is apparent that they have increased risk of some chronic diseases and mental illnesses. For example, glucose metabolism is impaired in adults who were in utero at any time during the famine. However, only those adults whose mothers were in their first trimester were found to be at increased risk of obesity and heart disease as well as breast cancer.5 Similarly, children born in the disastrous Chinese Great Leap in the 1950s (Huang et al. 2010) and in the Biafra famine of 1967–1970 have increased risk of chronic disease as adults. In the latter example, Hult et al. (2010) reported increased risk of diabetes and hypertension among children with fetal exposure to the famine compared with the cohorts immediately preceding and immediately following the famine.
While famines are extreme events, the patterns identified by these temporally circumscribed events are reinforced by cohort studies. For example, a longitudinal study of a cohort of births in New Delhi followed up to age 32 found that those children who were thinner in infancy [with a body mass index (BMI) less than 15] had an accelerated increase of BMI until adulthood. Although none were classified as obese by age 12, those with the greatest increase in BMI by this age had impaired glucose tolerance or diabetes by the age of 32 (Bhargava et al. 2004). In their multi‐country study using the COHORTS data (Brazil, Guatemala, India, the Philippines, South Africa) Victora et al. (2008) reported that lower birthweight and greater undernutrition in childhood were risk factors for high glucose concentrations, blood pressure and harmful lipid profiles after controlling for BMI and height.
Chronic diseases have direct resource costs including the costs of medication and the costs associated with accessing and using health care services. There also are costs associated with lost employment as a result of illness, medical treatment or premature death. Costs may also be incurred by other household or family members who forgo time spent working or at school in order to care for someone who is ill. Simulation estimates of the costs of chronic diseases suggest that these costs are high with one study reporting that cardiovascular disease, chronic respiratory disease, cancer, diabetes and mental health will generate a global output loss of $47 trillion over the next 20 years (Bloom et al. 2011), with nearly half of this coming from cardiovascular disease. An alternative approach, estimating the value of a statistical life, produces a very wide range of estimates, $6.7 to $43.4 trillion per year (Jha et al. 2013). More generally, the literature on the economic impact of chronic disease tends to be highly sensitive to assumptions made about the lost labour productivity, the value of averted mortality and the costs of treatment, with all these differing according to the medical system, markets and policies of a country. However, given that these costs occur decades after the intervention to prevent low birthweight or stunting, they contribute very little to benefit–cost estimates due to discounting (Alderman 2013).
Estimating the benefits and costs of investments in stunting reduction: general issues
Assessing the economic benefits and costs of investments in stunting reduction is far from straightforward. Guided by our framework, which links factors that affect child height in utero and during the first 2 years of life, we briefly outline a number of salient issues. Behrman et al. (2004) and Alderman (2010) discuss them in depth.
Benefits of interventions
Where stunting leads to illness or premature death, and if we aim to account for all economic benefits of reduced stunting, there is the non‐trivial issue of how to value in monetary terms a human life. As Alderman notes, one common approach is to use the expected earnings over the individual's lifetime (Alderman 2010).6 This approach implies that there will be higher economic benefits to reducing stunting in well off countries than in low‐ and middle‐income countries and within countries, to individuals expected to have the highest levels of earnings. Ranking the value of life as a function of wages within and across countries is ethically fraught. But alternative approaches, such as estimates based on the cheapest available alternative means of reducing mortality (e.g. Summers 1992) or estimates based on compensating differentials for risks in different occupations (Viscusi & Aldy 2003), are also problematic (Behrman et al. 2004).
Some impacts of reduced stunting in the First 1000 Days happen fairly quickly, such as reduced infant and child morbidity in the first or second life‐cycle stages of Fig. 1. Others may happen only with considerable lags, such as the increased productivity in adulthood or reduced morbidity in old age in the fifth and sixth life‐cycle stages in the figure. To account for the timing of different impacts, it is necessary to discount the economic costs and benefits to the same point of time. Calculations of economic benefits are highly sensitive to the discount rate used as is the share of benefits derived from different sources. For example, Alderman (2010) showed that the economic benefit from averting low birthweights is 357% higher when using a 1% rather than a 5% discount rate. In his example, the reductions in costs associated with chronic diseases represent 20% of the total economic benefits when the discount rate is 1%, but less than 1% when the discount rate is set at 10%. Discounting also has implications for our treatment of the gains from reduced stunting that accrue to subsequent generations. While these gains may exist, the mechanics of discounting these back to the present imply that they are unlikely to play a major part in our benefit–cost calculations. As there is no consensus on discount rates, it is necessary that estimates of economic returns be explicit about the rate used and advisable to indicate sensitivity to reasonable alternatives.
Most of the resource costs for investments to reduce stunting in the First 1000 Days are likely to occur in the first life‐cycle stage so neither discounting nor adjusting for survival is a big concern. However, there are likely to be some resource costs that are incurred in later life‐cycle stages as a result of reduced stunting. For example, if reduced stunting causes extended school attendance, additional real resource costs in the form of additional teaching, educational material and space may be incurred.
There is an important distinction between private and social benefits. Private benefits are those that accrue to individuals and possibly their households and families. But there may be societal benefits beyond the private benefits because of spillover effects. For example, Hanushek & Wößmann (2008) note that there are studies that show that investments in schooling reduce crime and increase civic participation. Given that investments that reduce stunting increase schooling, this suggests an indirect link from stunting reduction to a societal benefit in terms of reduced crime and greater civic engagement. For another example, more educated workers may make their co‐workers more productive, although the empirical evidence supporting this is less clear‐cut. Such spillover effects are not captured in estimates of private benefits from stunting reduction. Another social benefit that is difficult to quantify is the value that society places on equity achieved through increasing the earnings of children from poor households.
Costs of interventions
Bhutta et al. (2008) and Bhutta et al. (2013) provided systematic reviews that identify interventions for which there is compelling evidence of their impact on stunting between birth and 36 months. They argued that there exists rigorous evidence to support the large‐scale implementation of the following interventions:
Interventions that improve the health and nutrition of mothers: universal salt iodisation, micronutrient supplementation and calcium supplementation. In Bhutta et al. (2013), balanced energy protein supplementation was included in the list of interventions to be scaled up. Bhutta et al. (2008, 2013) also noted that folate and iron fortification of staples, maternal iron–folic acid supplementation for mothers during pregnancy and interventions to reduce tobacco consumption conveyed important health and nutrition benefits.
Interventions aimed at improving care behaviours: community‐based nutritional programmes that provide information on breastfeeding and complementary feeding.
Interventions that address health‐related causes of undernutrition: therapeutic zinc supplementation and vitamin A supplementation given its impacts on reducing mortality in children 6–59 months, although there is limited evidence on a link to stunting reduction.
Interventions that improve the quantity and quality of a child's diet: community‐based management of severe acute malnutrition and limited use of supplementary foods.
Bhutta et al. (2013) constructed a cohort model that assesses the cumulative impact of these interventions in 36 countries that collectively account for 90% of the moderately or severely stunted children worldwide. They found that these interventions in these 36 countries would reduce stunting at age 36 months by 20%.
Horton et al. (2010) and Bhutta et al. (2013) estimated the budgetary costs of scaling‐up these nutritional interventions in these high‐burden countries.7 Horton et al. based the costs on programme experience, and Bhutta et al. extended this by using the OneHealth costing approach (i.e. breaking costs into components such as labour costs, drugs, foods). The context from which these have been taken – whether they are part of outreach programmes, stand‐alone interventions or components of primary health services – is considered as is the collective packaging of these interventions. This approach is attractive because unlike other budgetary costing methods, it takes into account the fact that interventions may well not operate at maximum efficiency. Results from Hoddinott et al. (2013) have been used in previous work on estimating benefit–cost ratios, and so it is instructive to compare results from the Horton et al. cost data with the newer data from Bhutta et al. that incorporate regional differences in costs.8 Per child costs of these interventions are given on Table 1.
Table 1.
Per child costs of interventions to reduce stunting in children under 24 months
| Intervention based on Bhutta et al. (2008) and Horton et al. (2010) | Cost per child ($) | Intervention based on Bhutta et al. (2013) | Cost per child by country ($) | |||
|---|---|---|---|---|---|---|
| Madagascar, Nigeria | DRC, Ethiopia, Uganda, Tanzania, Kenya, Sudan | Bangladesh, Burma, India, Nepal, Pakistan, Yemen | Indonesia, Philippines, Vietnam | |||
| Universal salt iodisation | 0.05 | Universal salt iodisation | 0.06 | 0.06 | 0.06 | 0.06 |
| Iron fortification of staples | 0.80 | |||||
| Iron–folic acid supplementation for mothers during pregnancy | 2.00 | Multiple micronutrient supplements | 6.15 | 6.13 | 5.84 | 6.15 |
| Community‐based nutrition programmes providing information on breastfeeding, complementary feeding, hand washing; distribution of micronutrient powders, iron–folate supplements | 15.00 | Community‐based nutrition programmes that provide information on breastfeeding ($14.32); complementary feeding education ($5.27) | 19.59 | 19.40 | 17.03 | 19.59 |
| Providing complementary foods 1 | 50.00 | Provision of complementary foods 2 | 50.00 | 50.00 | 50.00 | 50.00 |
| Community‐based management of severe acute malnutrition | 8.13 | Community‐based management of severe acute malnutrition | 10.46 3 | 10.23 3 | 9.99 3 | 10.46 3 |
| Vitamin A supplementation | 4.80 | Vitamin A supplementation | 2.85 | 2.82 | 1.58 | 2.85 |
| Multiple micronutrient powders | 10.80 | Multiple micronutrients | 7.98 | 7.98 | 7.98 | 7.98 |
| Therapeutic zinc supplementation for management of diarrhoea | 4.00 | Zinc supplementation | 5.90 | 5.88 | 4.63 | 5.90 |
| Deworming | 1.00 | |||||
| Total 4 | 96.58 | Total | 102.99 | 102.50 | 97.11 | 102.99 |
1Provided to 80% of children in South Asia, 50% in Africa and East Asia, 10% elsewhere. 2Provided to children in households under $1 per day. 3This is calculated by taking the per child cost of community management of severe acute malnutrition and multiplying it by twice the prevalence of severe acute malnutrition. 4Total, assuming all children under 2 receive additional complementary food (conservative estimate); in practice only a proportion need additional complementary food. Source: Authors' calculations based on Bhutta et al. (2008, 2013) and Horton et al. (2010).
DRC, Democratic Republic of Congo.
Benefit–cost ratios for investments to reduce stunting in high‐burden countries
The previous section considered the benefits and budgetary costs associated with stunting separately. In this section, we bring these together in order to calculate benefit–cost ratios for investments to reduce stunting in selected high‐burden countries.9, 10 In earlier work, we did so by calculating the economic benefits associated with increased stature, improved cognitive outcomes, averted illness and inter‐generational impacts (see Behrman et al. 2004). Specifically, we used the estimates of the impact of linear growth failure on attained height and monetised the impacts by applying estimates of the impact of height on earnings derived from wage regressions where height appears as an argument, and on grade attainment and cognitive skills, again monetising this impact by applying estimates of the impact of schooling or cognitive skills on earnings derived from wage regressions where these education‐related outcomes appear as arguments.
In this paper, we take a more direct approach. Hoddinott et al. (2011) provided direct estimates of the impact of stunting in early life on later life outcomes. Specifically, they followed up on a group of approximately 1450 individuals who participated in a nutritional supplementation trial in Guatemala in the late 1960s and early mid‐1970s. These persons were traced as adults aged somewhere between 25 and 42 years of age at the time of interview, and data obtained inter alia on their schooling, marriage and fertility histories, earnings, health and consumption levels. Treating stunting as endogenous, Hoddinott et al. found that an individual stunted at age 36 months was predicted, as an adult, to have 66% lower per capita consumption. This represents a direct measure of the economic cost of stunting.
Expanding on work found in Hoddinott et al. (2013), we use this information as follows. Suppose starting in 2015, the full package of interventions described above is implemented for all children. This benefits a cohort of individuals born in 2015 whom we assume enters the labour market at age 21. We treat an increase in per capita consumption due to moving one of these individuals from being stunted to not stunted as equivalent to an increase in per capita permanent income. We multiply the point estimate of the increase in per capita permanent income, 0.66, by 0.20 in recognition of Bhutta et al.'s (2013) estimate that this package of interventions will reduce stunting by 20%. Further, to be conservative, we assume that only 90% of these income gains are realised. We apply this predicted increase in income, 11.3%, to predicted per capita incomes of those stunted in infancy (based on current income levels and projected growth rates) in selected high‐burden countries where stunting is widespread and that represent a range of income levels, for the period 2036–2050, that is the first 15 years of their working lives.11 Using a 5% discount rate, we construct the net present value of this increased consumption.12
The results are reported in Table 2 using both the Horton et al. (2010) and Bhutta et al. (2013) cost data.13 Under these assumptions, the benefit–cost ratios are greater than one for all 17 countries. The median ratio (Bangladesh) is 18.4 using the Horton et al. cost data and 17.9 using the Bhutta et al. cost data. This means that in Bangladesh, every dollar invested in reducing stunting through programmes is estimated to generate $17.9 to $18.4 in economic returns. The benefit–cost ratios vary across countries because of differences in stunting rates, pre‐existing income levels and the cost of the package of interventions, and because of different predicted growth rates. There does not however appear to be much difference in the benefit–cost ratios obtained from using the newer cost data found in Bhutta et al. (2013). As is the case with all calculations of benefit–cost ratios, these rise when we use a lower discount rate and fall when we assume a smaller percentage increase in income. Table 3 provides sensitivity analysis for our median country, Bangladesh, showing benefit–cost estimates for the interventions described in Bhutta et al. (2013) under different assumptions of income growth and discount rates (Table 3). Even in cases where we are pessimistic about the effect of stunting reduction on incomes and where we assume a relatively high discount rate, 8%, we still obtain benefit–cost ratios that exceed one by a comfortable margin. Note that some of these interventions, such as salt iodisation, convey benefits to all, not just pregnant women and young children. Also note that these estimates do not account for the reduction in child mortality, which we know to be substantial. As noted above, ascribing a monetary benefit to a lost life is difficult. Given these significant challenges, we do not calculate such a benefit stream. Set against these considerations, which suggest that our benefit–cost ratios are underestimates, are two additional points. Firstly, these benefit–cost ratios capture public costs but not private costs associated with reducing stunting. So, for example, if caregivers must spend more time providing their children food more frequently, there is a cost to the caregiver that is not captured in our estimates. Secondly, the literature suggests that the marginal benefits of increased height diminish as height increases. The returns in Guatemala are very high, but Guatemala has a very low attained adult male height. The estimates for Guatemala may be informative for other parts of the world with similar high rates of stunting in which live hundreds of millions of children, primarily South Asia and parts of sub‐Saharan Africa. But the returns to reducing stunting are likely to be considerably lower in most of Latin American and in developed countries in which the prevalence of stunting is much lower.
Table 2.
Benefit–cost ratios for investments to reduce stunting in selected high‐burden countries
| Region | Country | Benefit–cost ratios calculated using interventions and cost data from | |
|---|---|---|---|
| Bhutta et al. (2008) and Horton et al. (2010) | Bhutta et al. (2013) | ||
| Sub‐Saharan Africa | Democratic Republic of Congo | 3.8 | 3.5 |
| Madagascar | 10.7 | 9.8 | |
| Ethiopia | 11.5 | 10.6 | |
| Uganda | 14.1 | 13.0 | |
| Tanzania | 15.9 | 14.6 | |
| Kenya | 18.7 | 15.2 | |
| Sudan | 25.0 | 23.0 | |
| Nigeria | 26.6 | 24.4 | |
| Middle East and North Africa | Yemen | 13.4 | 28.6 |
| South Asia | Nepal | 13.3 | 12.9 |
| Burma | 17.7 | 17.2 | |
| Bangladesh | 18.4 | 17.9 | |
| Pakistan | 29.8 | 28.9 | |
| India | 34.1 | 38.6 | |
| East Asia | Vietnam | 35.5 | 35.3 |
| Philippines | 43.9 | 43.8 | |
| Indonesia | 47.9 | 47.7 | |
Source: Authors' calculations.
Table 3.
Sensitivity of benefit–cost ratio estimates to assumption of impact of stunting reduction on income growth and on the discount rate used, Bangladesh
| Income growth due to reductions in stunting (%) | Discount rate | ||
|---|---|---|---|
| 3% | 5% | 8% | |
| 11.3 | 35.1 | 17.9 | 6.7 |
| 8.5 | 26.4 | 13.4 | 5.0 |
| 5.75 | 17.5 | 8.9 | 3.3 |
Source: Authors' calculations.
Discussion and conclusions
This paper has outlined the economic rationale for investments that reduce stunting. We have presented a framework that illustrates the functional consequences of stunting in the 1000 days after conception throughout the life cycle: from childhood to old age. We have summarised the key empirical literature around each of the links in the life cycle, highlighting gaps where they exist.
Our overall goal in the paper was to generate credible estimates of benefit–cost ratios for a plausible set of nutritional interventions. The considerable challenges of doing have been outlined, and our assumptions have been clearly presented and justified. Using assumptions on the uplift in income (11%) due to the prevention of one‐third of stunting and on the discount rate of future benefit streams (5%), we find average benefit–cost estimates of between 3.8 (Democratic Republic of Congo) and 34.1 (India). The median benefit–cost ratio is 18 (Bangladesh). While we stress that these results hinge on a number of assumptions, we note that they compare favourably with the other investments, such as schooling for which public funds will compete (Lomborg 2013).
For the set of nutrition‐specific interventions we have reviewed here, there is a consensus on their effectiveness and their costs. Countries that want to generate and sustain broad‐based wealth are likely to find that scaling‐up these nutritional interventions to be some of the best investments they can make. It is important to note that our arguments are based solely on economic calculations. We believe this is important because this is precisely the type of calculation that the Ministry of Finance and Planning Commission officials make. The nutritional community needs to be similarly hard headed and be prepared to discussing nutritional interventions in terms of the economic benefits and costs if it wants to convince these policy‐makers.
But we know that the value of preventing stunting goes far beyond what can be captured in economic statistics. The value of preventing pain, emotional suffering and loss is very difficult to estimate but possibly very large. Such potential gains go beyond the economic benefits and costs presented above. Politicians and policy‐makers who want to promote broad‐based growth and prevent human suffering should place investments in scaling‐up nutrition‐specific interventions among their top priorities.
Source of funding
Hoddinott's, Alderman's, Behrman's and Horton's work on this paper was supported in part by the project ‘Team 1000+ Saving Brains: Economic Impacts of Poverty‐Related Risk Factors During the First 1000 Days for Cognitive Development and Human Capital’ funded by Grand Challenges Canada Grant No. 0072‐03. Hoddinott is also pleased to acknowledge support received through the Transform Nutrition consortium funded by the Department for International Development and from the Consultative Group on International Agricultural Research Program on Policies, Institutions and Markets, led by the International Food Policy Research Institute.
Conflicts of interest
The authors have no financial relationships or conflicts of interest to disclose.
Contributions
JH prepared the first draft of the manuscript. JRB, HA, LH and SH all provided revisions and additional texts to this first draft. JH prepared the final version. All authors read and approved the final manuscript.
Supporting information
Appendix S1. Technical details for framework in Section 2.
Footnotes
Although beyond the scope of this paper, we note that overweight/obesity among children has become an increasing problem. Global prevalence of childhood overweight and obesity has increased from 4.2% in 1990 to 6.7% in 2010 and is expected to reach 9.1% or 60 million in 2020 (de Onis et al. 2010).
Examples include major policy initiatives related to undernutrition among children that appeal to these economic considerations include the 1000 days initiative (http://www.thousanddays.org/), Scaling Up Nutrition (http://www.scalingupnutrition.org/) and Grand Challenges, Canada's programme on ‘Economic Impacts of Poverty‐Related Risk Factors During the First 1000 Days for Cognitive Development and Human Capital’.
Supporting Information Appendix S1 provides a formal exposition of these ideas.
Our identification of the first stage being the First 1000 Days (conception through 24 months) follows from an analysis by Victora et al. (2010) Using the World Health Organization (WHO) Global Database on Child Growth and Malnutrition, comprising data from national anthropometric surveys from 54 countries, with sample sizes ranging from 1000 to 47 000 children, they report that length/height for age starts at birth close to the WHO standard and falters dramatically until 24 months and then increases slightly after 24 months. They conclude that their comparison of child growth patterns with WHO standards shows that growth faltering in early childhood is more pronounced than earlier analyses based on the US National Center for Health Statistics reference (Victora et al. 2010). See also the paper by Stewart et al. (2013) for a discussion of the contextual and causal factors leading to stunted growth and development.
Personal correspondence with T.J. Roseboom based on a presentation in Santiago, Chile, November 2009, cited with permission.
Within standard models of economic behaviour, labour market earnings equal marginal productivity and individuals who work in labour markets equate their marginal productivity or earning per last hour worked in the labour market and non‐labour market activities, where the latter include home production of health and nutritional status, upbringing of children and care of those family members who are sick and ageing, etc. Under these assumptions, thus, the use of labour market earnings per unit time for marginal productivity also captures marginal productivity in other activities.
It is important to be clear about what we mean by budgetary costs. These are the financial costs of intervention providers in terms of time, material and transfers to provide an intervention. They exclude private costs (e.g. time of mothers that is necessary for an intervention, private transportation costs for the intervention) and the distortion costs of raising funds for public expenditures (Harberger 1997). They include transfers that are not a resource cost but just a redistribution of purchasing power.
Note that these cost estimates exclude the cost of calcium and energy protein supplements for mothers.
These are found in sub‐Saharan Africa (Democratic Republic of Congo, Ethiopia, Kenya, Madagascar, Nigeria, Sudan, Uganda, Tanzania), Middle East and North Africa (Yemen), South Asia (Bangladesh, India, Burma, Nepal, Pakistan) and East Asia (Indonesia, Vietnam, the Philippines) (Bryce et al. 2008).
We focus on stunting because the nutrition policy literature focuses heavily on the importance of reducing stunting as opposed to say increasing HAZ more generally. Also, the Bhutta et al. (2013) cost estimates are framed in terms of reducing stunting, not HAZ.
Alternatively, if we used Bhutta et al.'s (2008) estimate that this package reduces stunting by 36% and assumed that half these income gains were realised, we would obtain a similar predicted increase in income.
Under this approach, we omit any monetary value associated with the intergenerational transmission of the benefits of reduced stunting.
We do not report results for Guatemala. Our approach implicitly assumes that the benefit stream, in terms of income, is one where, on average, averting stunting increases mean incomes. For the countries we consider here, this is a reasonable assumption. For example, income in India is reasonably equally distributed (the Gini coefficient is around 0.38) and there are not massive differences in undernutrition across income quintiles. By contrast, income in Guatemala is highly unequally distributed and stunting is heavily concentrated in indigenous communities that have incomes well below mean income. That said, if we base our calculations on income levels of the poorest quintile of Guatemalan households and use a 5% discount rate, we obtain a benefit–cost ratio for Guatemala of 8.2.
References
- Alderman H. (2010) The economic cost of a poor start to life. Journal of Developmental Origins of Health and Disease 1, 19–25. [DOI] [PubMed] [Google Scholar]
- Alderman H. (2013) Economic drivers and consequences of stunting In: Recent Advances in Growth Research: Nutritional, Molecular and Endocrine Perspectives (eds Gillman M.W., Gluckman P.D. & Rosenfeld R.G.) Nestle Nutrition Institute Workshops Series 71, pp 127–130. Karger: Basel, Switzerland. [DOI] [PubMed] [Google Scholar]
- Alderman H., Hoddinott J. & Kinsey B. (2006) Long term consequences of early childhood malnutrition. Oxford Economic Papers 58, 450–474. [Google Scholar]
- Barker J.P. & Osmond C. (1986) Infant mortality, childhood nutrition, and ischaemic heart disease in England and Wales. Lancet 1, 1077–1081. [DOI] [PubMed] [Google Scholar]
- Barros K.M., Manhães‐De‐Castro R., Lopes‐De‐Souza S., Matos R.J., Deiró T.C., Cabral‐Filho J.E. et al (2006) A regional model (Northeastern Brazil) of induced mal‐nutrition delays ontogeny of reflexes and locomotor activity in rats. Nutritional Neuroscience 9, 99–104. [DOI] [PubMed] [Google Scholar]
- Behrman J., Alderman H. & Hoddinott J. (2004) Hunger and malnutrition In: Global Crisis, Global Solutions (ed. Lomborg B.), pp 363–442. Cambridge University Press: Cambridge, UK. [Google Scholar]
- Behrman J., Hoddinott J., Maluccio J.A. & Martorell R. (2010) Brains versus Brawn: Labor Market Returns to Intellectual and Physical Health Human Capital in a Developing Country. Mimeo, International Food Policy Research Institute: Washington, DC. [Google Scholar]
- Behrman J.R. & Deolalikar A.B. (1989) Wages and labor supply in rural India: the role of health, nutrition and seasonality In: Causes and Implications of Seasonal Variability in Household Food Security (ed. Sahn D.E.), pp 107–108. The Johns Hopkins University Press: Baltimore, MD. [Google Scholar]
- Benítez‐Bribiesca L., De La Rosa‐Alvarez I. & Mansilla‐Olivares A. (1999) Dendritic spine pathology in infants with severe protein‐calorie malnutrition. Pediatrics 104, e21–e27. [DOI] [PubMed] [Google Scholar]
- Bhargava S.‐K., Sachdev H.S., Fall C.H.D., Osmond C., Lakshmy R., Barker D.J.P. et al (2004) Relation of serial changes in childhood body‐mass index to impaired glucose tolerance in young adulthood. New England Journal of Medicine 350, 865–875. [DOI] [PMC free article] [PubMed] [Google Scholar]
- Bhutta Z.A., Ahmed T., Black R.E., Cousens S., Dewey K., Giugliani E. et al (2008) Maternal and child undernutrition 3: what works? Interventions for maternal and child undernutrition and survival. Lancet 371, 417–440. [DOI] [PubMed] [Google Scholar]
- Bhutta Z.A., Das J.K., Rizvi A., Gaffey M.F., Walker N., Horton S. et al (2013) Evidence‐based interventions for improvement of maternal and child nutrition: what can be done and at what cost? Lancet 382, 452–477. [DOI] [PubMed] [Google Scholar]
- Black R.E., Victora C.G., Walker S.P., Bhutta Z.A., Christian P., de Onis M. et al (2013) Maternal and child undernutrition and overweight in low‐income and middle‐income countries. Lancet 382, 427–451. [DOI] [PubMed] [Google Scholar]
- Blatt G.L., Chung C.J., Rosene D.L., Volicer L. & Galler J.R. (1994) Prenatal protein malnutrition effects on the serotonergic system in the hippocampal formation: an immunocytochemical, ligand binding, and neurochemical study. Brain Research Bulletin 34, 507–518. [DOI] [PubMed] [Google Scholar]
- Bloom D.E., Cafiero E.T., Jané‐Llopis E., Abrahams‐Gessel S., Bloom L.R., Fathima S. et al (2011) The Global Economic Burden of Noncommunicable Diseases. World Economic Forum: Geneva, Switzerland. [Google Scholar]
- Brown L. & Pollitt E. (1996) Malnutrition, poverty and intellectual development. Scientific American 269, 38–43. [DOI] [PubMed] [Google Scholar]
- Bryce J., Coitinho D., Darnton‐Hill I., Pelletier D. & Pinstrup‐Andersen P. (2008) Maternal and child undernutrition: effective action at national level. Lancet 371, 510–526. [DOI] [PubMed] [Google Scholar]
- Case A. & Paxson C. (2008) Stature and status: height, ability, and labor market outcomes. Journal of Political Economy 116, 499–532. [DOI] [PMC free article] [PubMed] [Google Scholar]
- Coly A.N., Milet J., Diallo A., Ndiaye T., Benefice E., Simondon F. et al (2006) Preschool stunting, adolescent migration, catch‐up growth, and adult height in young Senegalese men and women of rural origin. Journal of Nutrition 136, 2412–2420. [DOI] [PubMed] [Google Scholar]
- Deolalikar A.B. (1988) Nutrition and labor productivity in agriculture: estimates for rural south India. Review of Economics and Statistics 70, 406–413. [Google Scholar]
- DFID (2011) Scaling Up Nutrition: The UK's Position Paper on Undernutrition. Department for International Development: London. [Google Scholar]
- Haddad L. & Bouis H. (1991) The impact of nutritional status on agricultural productivity: wage evidence from the Philippines. Oxford Bulletin of Economics and Statistics 53, 45–68. [Google Scholar]
- Hanushek E.A. & Wößmann L. (2008) The role of cognitive skills in economic development. Journal of Economic Literature 46, 607–668. [Google Scholar]
- Harberger A.C. (1997) New frontiers in project evaluation? A comment on Devarajan, Squire, and Suthiwart‐Narueput. The World Bank Research Observer 12, 73–79. [Google Scholar]
- Heckman J.J., Urzua S. & Vytlacil E. (2006) Understanding instrumental variables in models with essential heterogeneity. Review of Economics and Statistics 88, 389–432. [Google Scholar]
- Hoddinott J., Rosegrant M. & Torero M. (2013) Investments to reduce hunger and undernutrition In: Global Problems, Smart Solutions: Costs and Benefits. (ed. Lomborg B.). Cambridge University Press: Cambridge, UK. [Google Scholar]
- Hoddinott J.J., Maluccio J., Behrman R., Martorell P., Melgar A.R., Quisumbing M. et al (2011) The consequences of early childhood growth failure over the life course . Discussion Paper 1073, International Food Policy Research Institute: Washington, DC.
- Horton S., Shekar M., McDonald C., Mahal A. & Brooks J. (2010) Scaling Up Nutrition: What Will It Cost? World Bank: Washington, DC. [Google Scholar]
- Huang C., Li Z., Wang M. & Martorell R. (2010) Early life exposure to the 1959–61 Chinese famine has long‐term health consequences. Journal of Nutrition 140, 1874–1878. [DOI] [PubMed] [Google Scholar]
- Huang L.T., Lai M.C., Wang C.L., Wang C.A., Yang C.H., Hsieh C.S. et al (2003) Long‐term effects of early‐life malnutrition and status epilepticus: assessment by spatial navigation and CREB (Serine‐133) phosphorylation. Developmental Brain Research 145, 213–218. [DOI] [PubMed] [Google Scholar]
- Hult M., Tornhammar P., Ueda P., Chima C., Edstedt Bonamy A.‐K.E., Ozumba B. et al (2010) Hypertension, diabetes and overweight: looming legacies of the Biafran famine. PLoS ONE 5, e13582. [DOI] [PMC free article] [PubMed] [Google Scholar]
- Immink M. & Viteri F.E. (1981) Energy intake and productivity of Guatemalan sugarcane cutters: an empirical test of the efficiency wages hypothesis, Parts I and II. Journal of Development Economics 92, 251–287. [Google Scholar]
- Jha P., Nugent R., Verguet S., Bloom D. & Hum R. (2013) Chronic disease prevention and control In: Global Problems, Smart Solutions: Costs and Benefits. (ed. Lomborg B.). Cambridge University Press: Cambridge, UK. [Google Scholar]
- Kar B.R., Rao S.L. & Chandramouli B.A. (2008) Cognitive development in children with chronic protein energy malnutrition. Behavioral and Brain Functions 4, 1–31. [DOI] [PMC free article] [PubMed] [Google Scholar]
- Levitsky D. & Strupp B. (1995) Malnutrition and the brain: changing concepts, changing concerns. Journal of Nutrition 125 (Suppl. 8), 2212S–2220S. [DOI] [PubMed] [Google Scholar]
- Lomborg B. (ed.) (2013) Global Problems, Smart Solutions. About Copenhagen Consensus 2012 Conference Results. Cambridge University Press: Cambridge, UK. [Google Scholar]
- Lundborg P., Nystedt P. & Rooth D. (2009) The height premium in earnings: the role of physical capacity and cognitive and non‐cognitive skills . IDA Discussion Paper 4266 IZA: Bonn, Germany.
- Maluccio J., Hoddinott J., Behrman J., Martorell R., Quisumbing A. & Stein A. (2009) The impact of nutrition during early childhood on education among Guatemalan adults. Economic Journal 119, 734–763. [Google Scholar]
- Mazer C., Muneyyirci J., Taheny K., Raio N., Borella A. & Whitaker‐Azmitia P. (1997) Serotonin depletion during synaptogenesis leads to decreased synaptic density and learning deficits in the adult rat: a possible model of neurodevelopmental disorders with cognitive deficits. Brain Research 760, 68–73. [DOI] [PubMed] [Google Scholar]
- Mendez M. & Adair L.S. (1999) Severity and timing of stunting affects performance on IQ and school achievement tests in late childhood. Journal of Nutrition 129, 1555–1562. [DOI] [PubMed] [Google Scholar]
- de Onis M., Blössner M. & Borghi E. (2010) Global prevalence and trends of overweight and obesity among preschool children. American Journal of Clinical Nutrition 92, 1257–1264. [DOI] [PubMed] [Google Scholar]
- Persico N., Postlewaite A. & Silverman D. (2004) The effect of adolescent experience on labor market outcomes: the case of height. Journal of Political Economy 112, 1019–1053. [Google Scholar]
- Ranade S.C., Rose A., Rao M., Gallego J., Gressens P. & Mani S. (2008) Different types of nutritional deficiencies affect different domains of spatial memory function checked in a radial arm maze. Neuroscience 152, 859–866. [DOI] [PubMed] [Google Scholar]
- Rosenzweig M.R. & Wolpin K.J. (1986) Evaluating the effects of optimally distributed public programs. American Economic Review 76, 470–487. [Google Scholar]
- Schultz T.P. (2002) Wage gains associated with height as a form of health human capital. The American Economic Review 92, 349–353. [Google Scholar]
- Schultz T.P. (2003) Wage rentals for reproducible human capital: evidence from Ghana and the Ivory Coast. Economics & Human Biology 1, 331–366. [DOI] [PubMed] [Google Scholar]
- Steckel R.H. (2009) Heights and human welfare: recent developments and new directions. Explorations in Economic History 46, 1–23. [Google Scholar]
- Stein A.D., Wang M., Martorell R., Norris S.A., Adair L.S., Bas I. et al (2010) Growth patterns in early childhood and final attained stature: data from vive birth cohorts from low‐ and middle‐income countries. American Journal of Human Biology 22, 353–359. [DOI] [PMC free article] [PubMed] [Google Scholar]
- Stewart C.P., Iannotti L., Dewey K.G., Michaelsen K.F. & Onyango A.W. (2013) Contextualizing complementary feeding in a broader framework for stunting prevention. Maternal & Child Nutrition 9 (Suppl. 2), 27–45. [DOI] [PMC free article] [PubMed] [Google Scholar]
- Strauss J. & Thomas D. (1996) Wages, schooling and background: investments in men and women in urban Brazil In: Opportunity Foregone: Education in Brazil (eds Birdsall N. & Sabot R.), pp 147–191. The Johns Hopkins University Press for the Inter‐American Development Bank: Baltimore, MD. [Google Scholar]
- Summers L.H. (1992) Investing in all the people. Pakistan Development Review 31, 367–406. [PubMed] [Google Scholar]
- Thomas D. & Strauss J. (1997) Health and wages: evidence on men and women in urban Brazil. Journal of Econometrics 77, 159–187. [DOI] [PubMed] [Google Scholar]
- UNICEF (1990) A UNICEF Policy Review: Strategy for Improved Nutrition of Children and Women in Developing Countries. UNICEF: New York. [Google Scholar]
- Valadares C.T. & de Sousa Almeida S. (2005) Early protein malnutrition changes learning and memory in spaced but not in condensed trials in the Morris water‐maze. Nutritional Neuroscience 8, 39–47. [DOI] [PubMed] [Google Scholar]
- Victora C.G., Adair L., Fall C., Hallal P.C., Martorell R., Richter L. et al (2008) Maternal and child undernutrition: consequences for adult health and human capital. Lancet 371, 340–357. [DOI] [PMC free article] [PubMed] [Google Scholar]
- Victora C.G., de Onis M., Curi Hallal P., Blössner M. & Shrimpton R. (2010) Worldwide timing of growth faltering: revisiting implications for interventions. Pediatrics 125, e473–e480. [DOI] [PubMed] [Google Scholar]
- Viscusi W.K. & Aldy J.E. (2003) The value of a statistical life: a critical review of market estimates throughout the world. Journal of Risk and Uncertainty 27, 15–76. [Google Scholar]
Associated Data
This section collects any data citations, data availability statements, or supplementary materials included in this article.
Supplementary Materials
Appendix S1. Technical details for framework in Section 2.