

Abstract
This study aimed to evaluate the validity and reproducibility of a semi‐quantitative food frequency questionnaire (FFQ) to estimate nutrient intake among Portuguese pregnant women. A sample of 101 pregnant women completed a 3‐day food diary (FD) in each pregnancy trimester (reference method) and an interviewer‐administered FFQ in the immediate post‐partum period. Ranking women according to their usual intake showed that, on average, 65% were classified into the same ±1 quintile and 2.4% into opposite quintiles by the two methods. Energy‐adjusted and de‐attenuated correlation coefficients ranged from 0.20 (protein) to 0.58 (riboflavin). Similar results were obtained when the FFQ was compared to each trimester‐specific FD. To assess the FFQ reproducibility, 70 women in their third pregnancy trimester were interviewed twice within a 2‐week interval. The level of agreement was high, with ≥75% of the participants being classified into the same ±1 quintile by the two administrations for 13 of the 15 nutrients examined. A review of the published literature revealed that this is the first FFQ to take the whole pregnancy as its reference time window. Our findings showed that a single administration of this FFQ in the immediate post‐partum period is a valid tool to rank Portuguese pregnant women according to their intakes.
Keywords: birth cohort, diet, dietary assessment tools, food frequency questionnaire, nutrition, pregnancy
Maternal diet during the periconceptional period and during pregnancy influences birth outcomes (Lind 1984; Simmer et al. 1987; Martinez‐Frias & Salvador 1990; Olsen et al. 1990; Czeizel & Dudas 1992; Wynn et al. 1994; Kuehl & Loffredo 2005; Pitkin 2007). The role of folate and vitamin A in the occurrence of congenital defects is well established (Martinez‐Frias & Salvador 1990; Czeizel & Dudas 1992; Kuehl & Loffredo 2005; Pitkin 2007). The siege of Leningrad (in 1941–1943) and the Dutch famine (in the winter of 1944–1945) showed that severe maternal protein and energy restriction results in birthweight reduction, especially if the restriction occurs during the third trimester of pregnancy (Lind 1984). Levels of intake of vitamins, minerals (Simmer et al. 1987; Wynn et al. 1994) and n‐3 fatty acids (Olsen et al. 1990) may influence birthweight even when energy and protein intakes are adequate. Both extremes of birthweight are associated with increased neonatal morbidity and mortality (Ashdown‐Lambert 2005), and higher morbidity in adult life (Barker & Martyn 1992; Phillips 1998; Barker 1999; Barker et al. 2002).
Identification of associations between maternal diet and health outcomes in the offspring requires a valid tool to accurately measure diet during pregnancy (Fawzi et al. 2004). A single dietary intake evaluation with a food frequency questionnaire (FFQ) is the most commonly used tool to measure diet in large epidemiological studies (Willett & Lenart 1998), including those conducted among pregnant women (Suitor et al. 1989; Brown et al. 1996; Robinson et al. 1996; De Vriese et al. 2001; Erkkola et al. 2001; Fawzi et al. 2004; Baer et al. 2005). Diet often changes throughout pregnancy in response to mood and appetite alterations, myths and beliefs, and complications such as nausea and vomiting (Quinlan & Hill 2003; Pinheiro & Seabra 2008). This large intra‐individual variability in intake makes it more difficult for a single FFQ to accurately estimate usual intake. Thus, it is crucial that any FFQ for use among pregnant women is validated in this specific population even if its validity in adult non‐pregnant populations has already been demonstrated. A semi‐quantitative FFQ to rank Portuguese adult non‐pregnant subjects according to their usual dietary intake has been developed and validated (Lopes et al. 2007), but its performance among pregnant women has never been evaluated. To assess the value of this FFQ in future investigations of the potential role of maternal diet during pregnancy on health outcomes in the offspring, we examined its reproducibility and relative validity [measured against multiple food diaries (FDs)] among pregnant women.
Key messages
-
•
The FFQ is a reproducible and valid tool to rank Portuguese women according to their dietary intake.
-
•
A single administration of the FFQ around the time of delivery was able to capture dietary intake throughout the whole pregnancy among Portuguese pregnant women.
-
•
The performance of the FFQ was not modified by the presence of nausea and/ or vomiting, daily number of meals and weekly weight gain.
Materials and methods
Subjects and study design
This study was nested within a population‐based cohort of 8654 babies born in the maternity clinics of the five public hospitals in Porto, Portugal. Almost all mothers were recruited at the time of the delivery, but a subsample was followed up throughout pregnancy. This study is based in this subgroup (Pinto et al. 2009).
Validation study
All pregnant women who attended their first ante‐natal visit at Maternidade Júlio Dinis or Hospital S. João were invited to participate if they reported a gestational age below 13 weeks. The invitations for this subsample were made consecutively between 1 December 2004 and 31 December 2005. Those who agreed to participate were interviewed in each trimester of pregnancy and in the immediate post‐partum period (i.e. 24 to 72 h after delivery) (Fig. 1). Assuming a true correlation coefficient of about 0.60 between the levels of dietary intake estimated by the FDs and those estimated by the FFQ, 80% power and 5% significance level, a sample of about 100 women would be required to ensure that the lower limit of the 95% confidence interval of the observed correlation coefficient was at least 0.40 (Willett & Lenart 1998).
Figure 1.
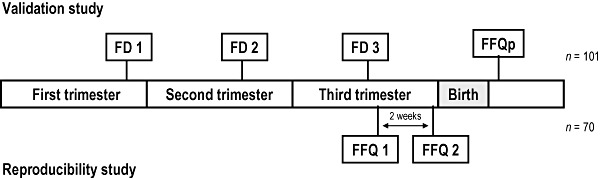
Flow chart illustrating the design of the validation and reproducibility studies. FFQ, food frequency questionnaire, applied in the immediate post‐partum; FD, average of three 3‐day food diaries, one in each trimester of pregnancy.
A total of 430 pregnant women agreed to take part in the study (participation rate 96.2%), 300 at Maternidade Júlio Dinis and 130 at Hospital S. João, completing a total of 248 FDs in the first, 196 in the second and 167 in the third trimesters of the pregnancy. Forty‐eight (11.2%) pregnant women were subsequently excluded because of misreporting of gestational age (as assessed by ultrasound examination) and 31 (7.2%) because of miscarriage, fetal death, stillbirth or very preterm delivery (gestational age <32 weeks). A further 250 (58.1%) were also excluded because they did not provide all the necessary dietary data. Thus, the final sample of the validation study was composed of the 101 participants who provided a 3‐day FD in each trimester of pregnancy and also completed the FFQ in the immediate post‐partum period.
Reproducibility study
Reproducibility was tested in a different sample of pregnant women followed at Hospital S. João and enrolled in the study during their third trimester ante‐natal visits. The first FFQ administration was scheduled for the visit taking place around the 36th to 37th gestational weeks and the second administration for the following visit two weeks later (Fig. 1). In both FFQ administrations, women were asked to recall their usual dietary intake during the whole pregnancy up to that time. Assuming that the true underlying level of reliability between the two FFQ administrations is >0.70, 80% power and 5% significance level, a sample size of 70 would be required to detect a minimally acceptable level of reliability of 0.50 and smaller sample sizes to detect levels of reliability higher than this (Walter et al. 1998).
A total of 148 women completed the first FFQ, but 76 delivered before the scheduled second appointment and one refused to complete the second FFQ. Thus, 71 women completed the reproducibility study. One woman was subsequently excluded from the analysis because of unreliable dietary reporting [self‐reported energy intake higher than three SDs above the sample mean].
Approval for these two studies was obtained from all relevant institutional and ethics committees. All participants provided written informed consent.
Data collection
Data were collected by trained interviewers using a structured questionnaire. In each trimester of pregnancy, information was obtained on demographic and lifestyle variables, including alcohol intake and smoking habits, medical history and health status. Educational level was recorded as number of completed schooling years and categorized as ≤6, 7–9, 10–12 and >12 years. Height and weight were measured at each follow‐up visit. Pre‐pregnancy body mass index (BMI) was estimated from self‐reported pre‐pregnancy weight and height measured at the first visit. Women were classified according to the World Health Organization as being underweight (BMI < 18.5 kg m−2), normal weight (BMI = 18.5–24.9 kg m−2), overweight (BMI = 25.0–29.9 kg m−2) or obese (BMI > 30.0 kg m−2) (WHO 1995).
FFQ and FDs
Dietary intake was assessed using a semi‐quantitative FFQ developed and validated for the Portuguese adult population (Lopes et al. 2007). The FFQ consists of 86 food or food group items (Portuguese version available at: http://higiene.med.up.pt/freq.php). Frequency of consumption was recorded in nine pre‐specified categories from ‘never or less than once per month’ to ‘six or more times per day’. Each food item was allocated a pre‐specified portion size. Usual dietary intake of any given food was estimated by multiplying its frequency of intake by its portion size (in grams) and, if appropriate, by a seasonal variation factor (i.e. equivalent to consumption during a 3‐month period). FFQ was administered in the immediate post‐partum period to estimate the dietary intake during the whole pregnancy.
Participants were also asked to complete three 3‐day FDs, one in each trimester of pregnancy. Each FD included two weekdays and one weekend day. Women were given instructions on how to complete the FDs and pictures of different portion sizes, and asked to record every food or beverage consumed as well as the time and place (e.g. home or outside home) of their consumption. A trained nutritionist checked all FDs for completeness and accuracy and then coded them.
Data from both the FFQ and the FDs were stored in food processor software, version SQL 9.3.0 (ESHA Research, Salem, OR, USA). A comprehensive and detailed comparison between the nutritional composition of foods consumed in Portugal and that of foods contained in the food processor was performed by a group of nutritionists in our department to select the most appropriate code for each food item. Furthermore, this nutritional database was supplemented with data on the nutritional composition of Portuguese foods and recipes obtained from national food composition databases (Ferreira & Graça 1985; Centro de Segurança Alimentar e Nutrição 2006), and national and international publications on the composition of Portuguese foods (1993a, 1993b; Batista & Bandarra 1993; 1998a, 1998b, 1998c) as described in Lopes et al. (2007). If the nutritional composition of a dish was not available in any of the above sources, it was estimated indirectly from its culinary recipe and the nutritional composition of its ingredients. This work was conducted as part of the initial development and validation of our FFQ among (non‐pregnant) adults. A comprehensive code manual was then developed; only a few extra codes were added to the manual during the present study.
Statistical methods
Independent‐samples t‐test or χ
2‐test, as appropriate, were used to compare the baseline characteristics of the participants in the validation study with the characteristics of those who were eligible but did not complete all the necessary dietary evaluations, and with the characteristics of those who took part in the reliability study. Mean (with SD) of the absolute daily nutrient intakes estimated by the two dietary methods in the validation study, or by the two FFQ administrations in the reliability study, were compared using paired‐samples t‐test. The Kolmogorov–Smirnov test was used to check normality and, if necessary, an adequate Box–Cox transformation performed. Pearson correlation coefficients were calculated to measure the strength of the linear association between the FFQ estimates and the average of the three 3‐day FD estimates, or between the two FFQ estimates. Although Spearman coefficients would have been more appropriate, as the aim is to assess the ability of the FFQ to accurately rank women in terms of their nutrient intake, Pearson coefficients were chosen to allow calculation of de‐attenuated coefficients. Nevertheless, the magnitude of the Pearson coefficients was similar to the corresponding Spearman ones. Adjustment for total energy intake was performed using the residual method, in which residuals were computed from a regression model of the nutrient on total energy intake (Willett & Lenart 1998). To adjust for random within‐person day‐to‐day intake variation in FDs, de‐attenuated Pearson correlation coefficients were calculated according to the following equation: 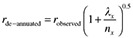 , in which λx is the ratio of the within‐ and between‐person variances for x, and nx is the number of replicates for the x variable (Willett & Lenart 1998). In this study, n is equal to the number of completed FDs (i.e. n = 9).
Ranking agreement between the FFQ and the FDs, or between the two FFQ administrations, was quantified as the percentage of subjects who were categorized by the two methods, or administrations, in the same (complete agreement), the same and adjacent (fair agreement), and opposite nutrient quintiles (extreme disagreement). Additionally, Bland–Altman plots (Bland & Altman 1986) were examined separately for each nutrient.
Statistical analyses were performed using SPSS package, version 14.0 (SPSS Inc., Chicago, IL, USA), and R software, version 2.6.0 (R Foundation for Statistical Computing, Vienna, Austria).
Results
The baseline characteristics of the study subjects are shown in Table 1. The mean age of the participants in the validation study was 29.8 years (SD = 4.9). The median number of completed schooling years was 9 (interquartile range: 6, 12), and 92.1% of women were married. Sixty per cent were at normal weight prior to becoming pregnant. The current pregnancy was planned for 66.3% of women, and 72.3% were nulliparous. About 10% of the participants reported having ever smoked in each trimester of pregnancy. The proportion of women that reported having ever consumed alcohol during the third trimester of pregnancy was twice the proportion in the first trimester (15.8% vs. 7.9%). Compared with those who were eligible but failed to provide complete dietary data (n = 250), the 101 participants in the validation study were more likely to be older [mean (SD) age: 29.8 (4.9) vs. 28.7 (6.5) years, respectively, P < 0.001], married (92.1% vs. 84.0%, P = 0.043) and nulliparous (72.3% vs. 54.2%, P = 0.001). However, the two groups had similar educational levels [mean (SD) completed schooling years: 9.6 (3.5) vs. 9.2 (3.9), P = 0.331].
Table 1.
Characteristics of the participants in the validation study (n = 101), Porto, Portugal, 2005–2006
| Validation study n (%) | |
|---|---|
| Age (years) at entry into the study | |
| ≤20 | 5 (5.0) |
| 21–30 | 52 (51.5) |
| 31–40 | 44 (43.5) |
| Education (schooling years) | |
| ≤6 | 28 (27.7) |
| 7–9 | 31 (30.7) |
| 10–12 | 30 (29.7) |
| >12 | 12 (11.9) |
| Pre‐pregnancy BMI (kg m−2) | |
| <18.5 | 2 (2.0) |
| 18.5–24.9 | 61 (60.4) |
| 25.0–29.9 | 27 (26.7) |
| >30.0 | 11 (10.9) |
| Previous number of births | |
| 0 | 73 (72.3) |
| ≥1 | 28 (27.7) |
| Current pregnancy planned | |
| Yes | 67 (66.3) |
| No | 34 (33.7) |
| Current marital status | |
| Married | 93 (92.1) |
| Not married | 8 (7.9) |
| Ever smoked during pregnancy | |
| First trimester (Yes) | 11 (10.9) |
| Second trimester (Yes) | 10 (9.9) |
| Third trimester (Yes) | 10 (9.9) |
| Ever consumed alcohol during pregnancy | |
| First trimester (Yes) | 8 (7.9) |
| Second trimester (Yes) | 9 (8.9) |
| Third trimester (Yes) | 16 (15.8) |
| Nausea or vomiting during pregnancy | |
| First trimester (Yes) | 50 (49.5) |
| Second trimester (Yes) | 31 (30.7) |
| Third trimester (Yes) | 17 (16.8) |
| Number of meals per day during pregnancy | |
| ≤5 | 46 (45.5) |
| ≥6 | 55 (54.5) |
| Mean (SD) weekly weight gain during pregnancy* (kg) | |
| Second trimester | 0.48 (0.35) |
| Third trimester | 0.60 (0.42) |
Data available for n = 80.
The participants in the reproducibility study were slightly younger than the participants in the validation study [27.7 (5.4) vs. 29.8 (4.9) years, respectively, P = 0.01], but were similar in relation to number of completed schooling years [9.5 (3.9) vs. 9.6 (3.5) years, P = 0.92], pre‐pregnancy BMI [24.4 (3.4) vs. 24.3 (4.0), P = 0.89] and marital status (proportion of married 91.4% vs. 92.1%, P = 0.88) (Table 1). The median gestational ages at the time of the first and second FFQ administrations were, respectively, 37 (range: 32–39) and 39 (range: 34–41) weeks.
Validation study
Table 2 shows the mean daily intakes of total energy and nutrients as assessed by the FFQ and the average of the three 3‐day FDs. The FFQ produced higher mean estimates of absolute intake than the FDs, except for riboflavin and folate, for which the two methods produced rather similar estimates. The unadjusted correlation of absolute intake estimates between the two dietary methods ranged from 0.29 (for vitamin E) to 0.55 (for riboflavin), with coefficients ≥0.40 for 10 of the 15 nutrients examined. Adjustment for total energy and correction for attenuation due to random within‐person variation improved the magnitude of most coefficients, with values ranging from 0.20 (for protein) to 0.58 (for riboflavin).
Table 2.
Validation study: absolute daily nutrient intakes as estimated by the food frequency questionnaire (FFQ) and the food diaries (FDs); Pearson correlation coefficients and level of agreement (n = 101)
| Nutrient | FFQp Mean (SD) | FD Mean (SD) † | P‐values* | Pearson correlation coefficients | Agreement in the same quintile (%) | Agreement in the same or adjacent quintile (%) | Extreme disagreement (%) | |||
|---|---|---|---|---|---|---|---|---|---|---|
| Unadjusted | De‐attenuated | Energy adjusted | Energy adjusted and de‐attenuated | |||||||
| Energy (kcal) | 2515 (640) | 2171 (388) | <0.01 | 0.44 | 0.49 | – | – | 27.7 | 60.4 | 1.0 |
| Protein (g) | 113.1 (27.2) | 99.9 (15.6) | <0.01 | 0.31 | 0.36 | 0.16 | 0.20 | 27.7 | 60.4 | 5.0 |
| Carbohydrates (g) | 323.5 (97.1) | 261.7 (51.6) | <0.01 | 0.51 | 0.58 | 0.21 | 0.28 | 29.7 | 58.4 | 1.0 |
| Total fat (g) | 89.6 (24.8) | 82.3 (18.1) | <0.01 | 0.31 | 0.35 | 0.19 | 0.25 | 26.7 | 54.5 | 1.0 |
| SFA (g) | 30.6 (9.7) | 27.8 (7.0) | <0.01 | 0.38 | 0.43 | 0.36 | 0.46 | 33.7 | 63.4 | 0.0 |
| Vitamin A (µg) ‡ | 1943.8 (1004.8) | 1048.3 (437.9) | <0.01 | 0.40 | 0.50 | 0.37 | 0.47 | 31.7 | 71.3 | 4.0 |
| Vitamin E (mg) | 10.2 (3.6) | 9.0 (2.3) | <0.01 | 0.29 | 0.41 | 0.20 | 0.40 | 25.7 | 60.4 | 4.0 |
| Vitamin C (mg) | 154.7 (65.4) | 101.8 (43.5) | <0.01 | 0.43 | 0.50 | 0.44 | 0.52 | 22.8 | 62.4 | 2.0 |
| Thiamin (mg) | 2.0 (0.6) | 1.9 (0.4) | 0.02 | 0.43 | 0.53 | 0.31 | 0.40 | 31.7 | 71.3 | 3.0 |
| Riboflavin (mg) ‡ | 2.8 (0.9) | 2.0 (0.6) | 0.97 | 0.55 | 0.63 | 0.47 | 0.58 | 29.7 | 75.2 | 3.0 |
| Vitamin B12 (µg) ‡ | 9.7 (3.8) | 8.6 (4.8) | 0.03 | 0.33 | 0.49 | 0.26 | 0.42 | 24.8 | 58.4 | 4.0 |
| Folate (µg) | 339.1 (123.3) | 338.5 (126.1) | 0.96 | 0.40 | 0.52 | 0.39 | 0.52 | 36.6 | 66.3 | 3.0 |
| Calcium (mg) | 1444.8 (484.1) | 1013.2 (284.6) | <0.01 | 0.43 | 0.49 | 0.33 | 0.38 | 30.7 | 68.3 | 1.0 |
| Magnesium (mg) | 377.0 (103.4) | 296.8 (57.9) | <0.01 | 0.42 | 0.47 | 0.36 | 0.41 | 33.7 | 69.3 | 2.0 |
| Iron (mg) | 16.8 (5.4) | 14.4 (3.7) | <0.01 | 0.43 | 0.52 | 0.41 | 0.54 | 23.8 | 73.3 | 2.0 |
FFQp, FFQ applied in immediate post‐partum period; *P‐values calculated using the paired‐sample t‐test; †Average of three 3‐day food diaries; ‡correlation coefficients calculated after Box–Cox transformation.
Cross‐classification into quintiles of unadjusted nutrient intake ranks showed that, on average, 29.1% (range: 22.8% for vitamin C to 36.6% for folate) of women were classified into the same quintile, and 64.9% (range: 54.5% for total fat to 75.2% for riboflavin) into the same ±1 quintile, by the FFQ and the FDs. Extreme disagreement was very infrequent (average = 2.4%), being highest for protein (5.0%) (Table 2).
Bland–Altman diagrams were plotted for all nutrients examined, and the discrepancies between the two methods were equally likely in either direction. The exception was total energy for which the difference in absolute intakes increased with increasing average intake, with the FFQ producing systematically higher estimates than the FDs. These findings are illustrated in 2, 3, 4, 5 for energy and selected nutrients.
Figure 2.
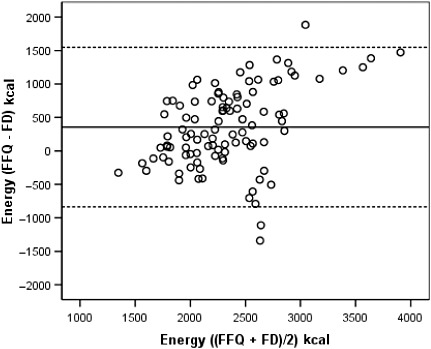
Bland–Altman plot between the food frequency questionnaire and the food diary methods to estimate total energy intake during the whole pregnancy. The solid line represents the mean difference in absolute intake between the two methods and the dashed lines represent the 95% limits of agreement (±1.96 SD of the difference). FFQ, food frequency questionnaire, applied in the immediate post‐partum; FD, average of three 3‐day food diaries, one in each trimester of pregnancy.
Figure 3.
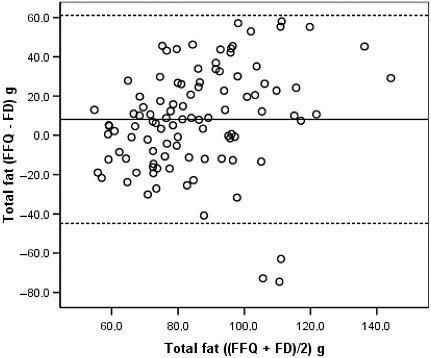
Bland–Altman plot between the food frequency questionnaire and the food diary estimates of total fat intake during the whole pregnancy. See legend of Fig. 2. FFQ, food frequency questionnaire, applied in the immediate post‐partum; FD, average of three 3‐day food diaries, one in each trimester of pregnancy.
Figure 4.
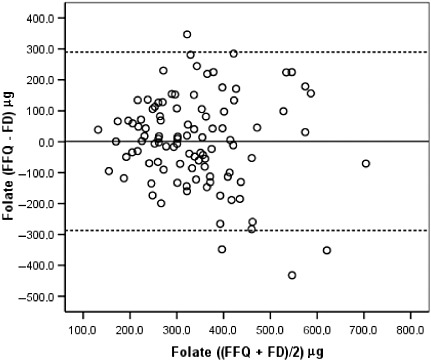
Bland–Altman plot between the food frequency questionnaire and the food diary estimates of folate intake during the whole pregnancy. See legend of Fig. 2. FFQ, food frequency questionnaire, applied in the immediate post‐partum; FD, average of three 3‐day food diaries, one in each trimester of pregnancy.
Figure 5.
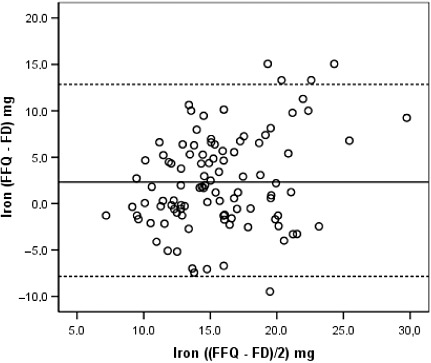
Bland–Altman plot between the food frequency questionnaire and the food diary estimates of iron intake during the whole pregnancy. See legend of Fig. 2. FFQ, food frequency questionnaire, applied in the immediate post‐partum; FD, average of three 3‐day food diaries, one in each trimester of pregnancy.
As a 3‐day FD was completed in each pregnancy trimester, it was possible to compare the post‐partum FFQ with each trimester‐specific FDs separately. The crude Pearson correlation coefficients between the FFQ and each one of the trimester‐specific FDs tended to be slightly lower, and with wider 95% confidence intervals, than those between the FFQ and the mean of the three 3‐day FDs (Table 3).
Table 3.
Validation study: trimester‐specific absolute daily nutrient intakes as estimated by the three 3‐day food diaries (FDs) and their correlations with the estimates produced by the food frequency questionnaire administered in the immediate post‐partum period (FFQp) (n = 101)
| Nutrient | Mean (SD) or Median (P25; P75) | Crude Pearson correlation coefficients and 95% confidence intervals (CI) | |||||||||
|---|---|---|---|---|---|---|---|---|---|---|---|
| FD1* | FD2 † | FD3 ‡ | FFQp and 3 FD § | FFQp and FD1* | FFQp and FD2 † | FFQp and FD3 ‡ | |||||
| Energy (kcal) | 2137 (430) | 2175 (500) | 2133 (496) | 0.44 | 0.27, 0.59 | 0.38 | 0.20, 0.54 | 0.41 | 0.23, 0.56 | 0.33 | 0.14, 0.49 |
| Protein (g) | 99.3 (19.3) | 100.0 (17.9) | 98.5 (22.1) | 0.31 | 0.12, 0.48 | 0.22 | 0.03, 0.40 | 0.27 | 0.08, 0.44 | 0.26 | 0.07, 0.43 |
| Carbohydrates (g) | 256.7 (60.2) | 258.7 (69.1) | 261.9 (66.1) | 0.51 | 0.35, 0.64 | 0.43 | 0.26, 0.58 | 0.49 | 0.33, 0.63 | 0.33 | 0.14, 0.49 |
| Total fat (g) | 81.0 (20.6) | 83.8 (23.7) | 78.9 (23.9) | 0.31 | 0.12, 0.48 | 0.21 | 0.02, 0.39 | 0.25 | 0.06, 0.42 | 0.29 | 0.10, 0.46 |
| Vitamin A (µg) | 951.6 (609.4; 1353.4) | 940.0 (606.1; 1285.1) | 928.3 (679.2; 1283.1) | 0.40 ¶ | 0.22, 0.55 | 0.30 ¶ | 0.11, 0.47 | 0.26 ¶ | 0.07, 0.43 | 0.36 ¶ | 0.18, 0.52 |
| Vitamin E (mg) | 8.3 (7.0; 10.2) | 8.9 (7.2; 11.5) | 8.2 (6.5; 10.1) | 0.29 | 0.10, 0.46 | 0.13 ¶ | −0.06, 0.32 | 0.27 ¶ | 0.08, 0.44 | 0.31 ¶ | 0.12, 0.48 |
| Vitamin C (mg) | 101.2 (53.2) | 94.4 (49.3) | 102.0 (62.4) | 0.43 | 0.26, 0.58 | 0.31 | 0.12, 0.48 | 0.35 | 0.17, 0.51 | 0.38 | 0.20, 0.54 |
| Thiamin (mg) | 1.9 (0.5) | 1.9 (0.5) | 1.9 (0.5) | 0.43 | 0.26, 0.58 | 0.29 | 0.10, 0.46 | 0.33 | 0.14, 0.49 | 0.37 | 0.19, 0.53 |
| Riboflavin (mg) | 2.2 (1.7; 2.7) | 2.2 (1.8; 2.7) | 2.3 (1.7; 2.7) | 0.55 ¶ | 0.40, 0.67 | 0.31 ¶ | 0.12, 0.48 | 0.54 ¶ | 0.39, 0.67 | 0.52 ¶ | 0.36, 0.65 |
| Vitamin B12 (µg) | 6.2 (4.3; 10.1) | 6.6 (4.6; 9.6) | 6.4 (4.6; 9.3) | 0.33 ¶ | 0.14, 0.49 | 0.27 ¶ | 0.08, 0.44 | 0.12 ¶ | −0.08, 0.31 | 0.36 ¶ | 0.18, 0.52 |
| Folate (µg) | 271.2 (207.0; 365.4) | 286.3 (205.6; 395.1) | 316.8 (229.1; 446.7) | 0.40 | 0.22, 0.55 | 0.31 ¶ | 0.12, 0.48 | 0.41 ¶ | 0.23, 0.56 | 0.31 ¶ | 0.12, 0.48 |
| Calcium (mg) | 989.3 (301.7) | 1033.3 (382.4) | 994.0 (349.8) | 0.43 | 0.26, 0.58 | 0.27 | 0.08, 0.44 | 0.39 | 0.21, 0.54 | 0.42 | 0.24, 0.57 |
| Magnesium (mg) | 295.1 (63.5) | 293.2 (74.0) | 294.6 (74.9) | 0.42 | 0.24, 0.57 | 0.25 | 0.06, 0.42 | 0.37 | 0.19, 0.53 | 0.41 | 0.23, 0.56 |
| Iron (mg) | 14.4 (4.8) | 14.3 (4.9) | 14.3 (5.0) | 0.43 | 0.26, 0.58 | 0.32 | 0.12, 0.49 | 0.36 | 0.18, 0.52 | 0.33 | 0.14, 0.49 |
P25, 25th percentile; P75, 75th percentile; *Three‐day FDs completed in the first trimester; †Three‐day FDs completed in the second trimester; ‡Three‐day FDs completed in the third trimesters; §Nutrient intakes as estimated by the average of the three 3‐day FDs; ¶Correlation coefficients calculated after Box–Cox transformation.
Sensitivity analyses showed no evidence that the FFQ–FD correlations for energy and other nutrients differed significantly according to whether women reported nausea and/or vomiting during pregnancy, number of meals per day (≥6 vs. <6 meals per day), and average weekly weight gain between the first and third trimesters (≤0.5 kg vs. >0.5 kg).
Reproducibility study
There were no significant differences in the mean nutrient intakes estimated by the two FFQ administrations (Table 4). Crude Pearson correlation coefficients ranged from 0.50 for protein to 0.69 for carbohydrates, being ≥0.60 for six of the 15 nutrients evaluated. Adjustment for total energy intake reduced slightly the magnitude of these coefficients (range: 0.19 for vitamin E and thiamine to 0.62 for riboflavin).
Table 4.
Reproducibility study: absolute daily nutrient intakes as estimated by the two separate administrations of the food frequency questionnaire (FFQ); Pearson correlation coefficients and level of agreement (n = 70)
| FFQ 1 † Mean (SD) | FFQ 2 Mean (SD) | P‐values* | Pearson correlation coefficients | Agreement in the same quintile (%) | Agreement in the same or adjacent quintile (%) | Extreme disagreement (%) | ||
|---|---|---|---|---|---|---|---|---|
| Unadjusted | Energy adjusted | |||||||
| Energy (kcal) | 2502 (727) | 2431 (681) | 0.32 | 0.64 | 27.1 | 75.7 | 1.4 | |
| Protein (g) | 111.9 (30.9) | 109.7 (27.9) | 0.54 | 0.50 | 0.55 | 27.1 | 80.0 | 0.0 |
| Carbohydrates (g) | 328.5 (102.0) | 311.2 (102.8) | 0.08 | 0.69 | 0.53 | 38.6 | 84.3 | 0.0 |
| Total fat (g) | 86.6 (29.9) | 86.7 (29.1) | 0.96 | 0.56 | 0.44 | 37.1 | 81.4 | 1.4 |
| SFA (g) | 29.9 (11.9) | 29.7 (10.4) | 0.87 | 0.57 | 0.36 | 40.0 | 77.1 | 0.0 |
| Vitamin A (µg) | 1910.8 (1148.7) | 1971.8 (1290.1) | 0.67 | 0.63 | 0.58 | 31.4 | 74.3 | 0.0 |
| Vitamin E (mg) | 9.6 (3.9) | 9.5 (4.2) | 0.84 | 0.58 | 0.19 | 35.7 | 75.7 | 1.4 |
| Vitamin C (mg) | 169.4 (99.4) | 160.3 (94.9) | 0.43 | 0.51 | 0.44 | 34.3 | 78.6 | 4.3 |
| Thiamin (mg) | 2.0 (0.6) | 2.0 (0.6) | 0.58 | 0.57 | 0.41 | 35.7 | 81.4 | 4.3 |
| Riboflavin (mg) | 2.8 (1.0) | 2.8 (0.9) | 0.58 | 0.60 | 0.62 | 37.1 | 78.6 | 1.4 |
| Vitamin B12 (µg) | 9.6 (5.5) | 10.0 (5.9) | 0.46 | 0.54 | 0.61 | 28.6 | 68.6 | 1.4 |
| Folate (µg) | 343.7 (147.1) | 343.4 (164.5) | 0.98 | 0.66 | 0.57 | 44.3 | 81.4 | 0.0 |
| Calcium (mg) | 1449.5 (598.5) | 1392.7 (572.4) | 0.39 | 0.57 | 0.56 | 37.1 | 77.1 | 1.4 |
| Magnesium (mg) | 372.5 (120.1) | 358.9 (110.9) | 0.28 | 0.59 | 0.48 | 37.1 | 78.6 | 1.4 |
| Iron (mg) | 16.3 (5.6) | 16.0 (5.5) | 0.59 | 0.60 | 0.50 | 41.4 | 80.0 | 2.9 |
* P‐values calculated using the paired‐sample t‐test; † First application of the FFQ; ‡Second application of the FFQ.
On average, 35.5% (range: 27.1% for energy and protein to 44.3% for folate) women were classified in the same quintile. The percentage of participants classified in the same or adjacent quintiles was higher than 75% for 13 of the 15 nutrients examined. Extreme disagreement was lower than 5% for all nutrients analysed (Table 4).
Discussion
There has been an increasing interest in researching the association between maternal diet during pregnancy and birth outcomes (Fowles 2004; Giroux et al. 2006). The FFQ is the most frequently used tool in such investigations. However, few studies have attempted to assess the performance of this tool among pregnant women. A review of studies published in English, French, Spanish or Portuguese and indexed in PubMed resulted in the identification of 15 original papers, the large majority published after 2000 (Table 5).
Table 5.
Literature review on the validation of food‐frequency questionnaire (FFQ) among pregnant women: characteristics of the published studies along with those of the new Portuguese study
| First author Year of publication* | Country of study | Reference method | n | Age | Characteristics of the FFQ | Validation studies Range of correlations (energy adjusted) | Reproducibility assessment | ||||
|---|---|---|---|---|---|---|---|---|---|---|---|
| Type of FFQ | Number of food items | Application method | Timing of application | Reference time period | |||||||
| Suitor et al. (1989) | USA | 3 × 24 h recall | 95 | 14–43 years | Sqt. | 111 | Self | Different gestational ages | 1 month | 0.12 † vitamin A; 0.60 † calcium | Yes |
| Greeley et al. (1992) | USA | 2 × 24 h recall | 50 | 20–35 years | Sqt. | 116 | Self | 21–35 weeks | 2 months | 0.12 [Link] , [Link] protein; 0.46 [Link] , [Link] calcium | No |
| Robinson et al. (1996) | UK | 4 days food diary Biomarker (serum vitamin C) | 569 | >16 years | Sqt. | 100 | Interviewer | 15 weeks | 3 months | 0.27 § starch; 0.55 § riboflavin | No |
| Brown et al. (1996) | USA | 4 days weighed food diary | 56 | Mean = 31.9 years (SD = 3.4) | Sqt. | 64 | Self | Mid‐pregnancy | N/A | 0.21 § saturated fat; 0.67 § iron | No |
| Wei et al. (1999) | USA | 3 × 24 h‐recall | 101 | N/A | Ql. | N/A | Interviewer | Different gestational ages | 1 month | 0.03 † vitamin B12; 0.46 † folate | No |
| Erkkola et al. (2001) | Finland | 2 × 5 days food diary | 113 | Mean = 29.6 years (SD = 5.1) | Sqt. | 181 | Self | 8th month | 1 month | 0.19 † vitamin E; 0.68 † total retinol | Yes |
| De Vriese et al. (2001) | Belgium | 2 × 7 days food diary | 26 | N/A | Sqt. | 180 | Interviewer | 6–22 weeks; 32–40 weeks | 1 month | 0.62 † monounsaturated FA; 0.68 † polyunsaturated FA | No |
| Parra et al. (2002) | Mexico | Biomarkers (erythrocyte FA) | 146 | 18–42 years | Sqt. | 104 | Interviewer | N/A | Recent intake | 0.30 † docosahexaenoic acid; 0.52 † alpha‐linolenic acid | No |
| Saldana et al. (2004) | USA | 3 × 24 h recall | 99 | Mean = 26 years (SD = 6.2) | Sqt. | N/A | Self | Between 24 and 29 weeks | 3 months | 0.26 † carbohydrates; 0.44 † protein | No |
| Fawzi et al. (2004) | USA | Biomarkers (alfa‐carotene, lycopene, lutein and zeaxanthin, gama‐tocoferol, long chain n‐3 FA, alpha‐ linolenic FA, trans‐FA) | 204 | Mean = 31.6 years (SD = N/A) | Sqt. | 179 | Self | <14 weeks | First trimester | N/A | No |
| Baer et al. (2005) | USA | 6 × 24 h recall | 521 | 16–40 years | Ql. | 100 | Self | 12 weeks, 16–17 weeks and 28 weeks | 1 month | 0.03 † Polyunsaturated FA; 0.51 † riboflavin | Yes |
| Venter et al. (2006) | UK | 4 × 7 days food diary | 57 | 20–44 years | Ql. | N/A | Interviewer | 12–13 weeks | N/A | N/A | Yes |
| Mouratidou et al. (2006) | UK | 2 × 24 h recall | 123 | Mean = 29.0 years (SD = 6.4) | Sqt. | 62 | Interviewer | 14–18 weeks | 1 month | −0.16 † niacin; 0.47 † englyst fibre | No |
| Mikkelsen et al. (2006) | Denmark | 7 days weighed food diary Biomarkers (urinary nitrogen excretion, retinol in plasma, erythrocyte folic acid, erythrocyte EPA) | 88 | Median = 28 years (IQR = 25–31.5) | Sqt. | 360 | Self | 30–31 weeks | 1 month | 0.30 § urinary flavenoids; 0.32 § plasma carotene | No |
| Brantsaeter et al. (2008) | Norway | 4 days weighed food diary Biomarkers (urinary nitrogen and iodine excretion, 25‐hydroxi‐vitamin D in plasma, serum folic acid) | 119 | Mean = 31.2 years (SD = 4.1) | Sqt. | 255 | Self | 16–18 weeks | 4 months | 0.25 § retinol total; iron total 0.54 § fibre | No |
| Present study (2008) | Portugal | 3 × 3 days food diary | 101 | Mean = 29.8 years (SD = 4.9) | Sqt. | 86 | Interviewer | Puerperium | Whole pregnancy | 0.16 † protein; 0.47 † riboflavin | Yes |
FA, fatty acids; EPA, eicosapentaenoic acid; IQR, interquartile range; Sqt., semi‐quantitative; Ql., qualitative; N/A, not given in publication; *Search terms used to identify relevant articles published in English, French, Spanish and Portuguese and indexed in PubMed: (‘pregnant’ or ‘pregnancy’) and (‘food’ or ‘diet’) and ‘food frequency’ and (‘validation’ or ‘validity’) until December, 2007. A total of 21 papers were identified through electronic search and four through additional manual searches. Ten were excluded after review of the abstract or full article because they were reviews, did not assess diet during pregnancy or were duplicate publications (only the most complete evaluation was included). Thus, a total of 15 articles were included in the review; †Pearson correlation coefficients; ‡Only unadjusted correlation coefficients available; §Spearman correlation coefficients.
Validation study
We reported here findings from the first FFQ validation study to have been conducted among Portuguese pregnant women. The FFQ estimates of nutrient intakes observed in our study were higher than those obtained by the FDs; these findings are consistent with those reported by other studies conducted among pregnant (Suitor et al. 1989; Robinson et al. 1996; Erkkola et al. 2001; Brantsaeter et al. 2008) and non‐pregnant (Cade et al. 2002) women. The FFQ overestimation of intakes is not a major problem in studies aimed at identifying diet–disease associations, provided the ranking of individuals by intake levels is valid (Robinson et al. 1996; Shatenstein et al. 2005). A possible explanation for the overestimation of intakes is the difficulty in comparing the portion size offered as standard with the portion that is actually consumed. However, a previous investigation among non‐pregnant adults showed that the use of this FFQ, together with photographs depicting a range of portion sizes, did not perform better than simply using average portions sizes (Paiva et al. 2004).
The unadjusted correlation coefficients between the two methods ranged from 0.29 for vitamin E to 0.55 for riboflavin, and were ≥0.40 for 10 of the 15 nutrients assessed. The magnitude of these unadjusted correlation coefficients is similar to that reported by the only two previous validation studies among pregnant women, which, like this study, examined a large range of nutrients using non‐weighed FDs as the reference method (Robinson et al. 1996; Erkkola et al. 2001) (Table 5). Energy adjustment and correction for random within‐person variation tend to increase the magnitude of the correlation coefficients (Erkkola et al. 2001; Mouratidou et al. 2006; Brantsaeter et al. 2008). In our study, the increases in magnitude with these adjustments were modest and restricted to the micronutrients.
It is conceivable that the completion of the three FDs prior to the FFQ administration might have increased the participants' attention to their diet, thus, improving the ability of the FFQ to rank women according to their intake. This problem is unavoidable in studies conducted among pregnant women aimed at assessing usual intake throughout the whole pregnancy. However, the skills required to complete FDs are different from those required to complete an FFQ, and so their errors are likely to be uncorrelated.
Although a common approach, the use of correlation coefficients is controversial in validation studies (Bland & Altman 1986). We reported them mainly to allow comparison with other published studies. Level of agreement, as assessed by cross‐classification into quantiles of their intake ranks and Bland–Altman diagrams, is a more appropriate measure of the performance of the FFQ relative to the FDs. These two approaches were used in our analysis and we obtained a satisfactory level of agreement in intake ranking between the two dietary methods, with higher percentages of women being classified into the same or adjacent quintiles by the FFQ and the FDs for most nutrients, and very few being incorrectly classified into opposite quintiles. The Bland–Altman diagrams showed no evidence of bias for any of the 15 nutrients examined, except for energy, where there was some evidence that the FFQ overestimated intake compared with the FDs and that this overestimation increased with increasing average intake. Bland–Altman plots and cross‐classification into quantiles have been reported in previous validations among pregnant women (Robinson et al. 1996; Erkkola et al. 2001; Baer et al. 2005; Mouratidou et al. 2006; Brantsaeter et al. 2008), but it is difficult to compare the findings from such analyses across different studies. The Bland–Altman diagrams only allow a graphical interpretation, and cross‐classification is hampered by the use of different quantiles. Three studies cross‐classified their nutrient intake estimates according to quintiles of their distributions (Erkkola et al. 2001; Mouratidou et al. 2006; Brantsaeter et al. 2008), but only one (Erkkola et al. 2001) provided data for foods. Of the remaining two studies, levels of complete agreement were very similar to those reported here in one study (Brantsaeter et al. 2008) but much higher in the other (Mouratidou et al. 2006) with 50% or more of its study subjects being classified in the same quintile by the two methods for most nutrients.
Reproducibility study
Overall, the FFQ was shown to be a reliable tool among Portuguese pregnant women. The literature review showed that four of the 15 previously published studies presented data on the reproducibility of their FFQs. In our study, unadjusted correlation coefficients between the two FFQ ranged between 0.51 for vitamin C and 0.69 for carbohydrates. In a Finnish study (Erkkola et al. 2001), the coefficients were slightly higher, being higher than 0.62 for all nutrients considered in our study. Suitor et al. (1989) described very similar results, except for a stronger vitamin A correlation. Some reproducibility studies reported higher nutrient intake estimates with the first FFQ administration (Suitor et al. 1989; Erkkola et al. 2001), but we found no such differences in the present study. The interval between the two FFQ administrations is usually one month (Erkkola et al. 2001; Baer et al. 2005), longer than the 2‐week period considered in the present study to minimize answer memorization from one administration to the other. But a North American study among pregnant women also used a 2‐week interval (Suitor et al. 1989). Memorization is unlikely to have been a problem in the present study given the large number of items included in the FFQ. Moreover, as diet during pregnancy may not be as stable as among non‐pregnant women, a longer interval between the FFQ administrations could reflect real changes in dietary intake rather than measurement error.
FFQ validation studies require a large cooperation from the subjects, and therefore, those who volunteer and comply with the study may not be representative of the general population (Cade et al. 2002), as they may have different dietary patterns and are more likely to provide more accurate responses (Cade et al. 2002). Our final validation sample differed slightly from the eligible population in terms of age, marital status and parity, but it had a similar educational level. The latter is an important determinant of the accuracy and completeness of self‐reported dietary information, particularly regarding the completion of FDs (Cade et al. 2002). The cultural adequacy of our FFQ was assured because it had been specifically designed, and previously validated, in the adult non‐pregnant Portuguese population (Lopes et al. 2007). Although the choice of the FFQ food items did not particularly target nutrients of special relevance to pregnant women, the findings show nevertheless that the FFQ was able to rank appropriately pregnant women according to their folate and iron intakes.
Literature review on the validation of the FFQ among pregnant women
The literature review (Table 5) showed that our FFQ was unique in several respects. It is the only one to have been administered in the immediate post‐partum period and to have taken the whole pregnancy as its reference time window. The most widely used reference time period in FFQ validation studies among pregnant women was 1 month (Table 5), although many aimed to use the estimates obtained from a short reference period as measures of usual dietary intake throughout the whole pregnancy. In theory, the dietary intake should increase during pregnancy (Kaiser & Allen 2002). However, common fluctuations in appetite, nausea and vomiting, and other behaviours may affect this (Suitor et al. 1989; Robinson et al. 1996). Thus, a specific period of pregnancy may not be representative of the whole gestation. Short‐reference time periods may be more appropriate to study acute exposures or the effects of diet at a specific gestational period, while longer periods are more appropriate to study cumulative effects. Robinson et al. (Robinson et al. 1996) considered the changes occurring in food intakes between early and mid‐pregnancy as potential attenuators of the strength of the associations in their validation study. However, and similar to data shown by Baer et al. (Baer et al. 2005), the trimester‐specific FDs in the present study provided no evidence of any major dietary changes during pregnancy. Thus, a single FFQ was able to capture dietary intake throughout the whole pregnancy among Portuguese pregnant women, thus minimizing the logistic challenges and compliance demands posed by multiple assessments.
In summary, the findings from this study show that a single administration of our FFQ is a valid tool to accurately rank Portuguese pregnant women in terms of their nutrient intakes throughout the whole pregnancy.
Source of funding
The study was funded by Programa Operacional de Saúde – Saúde XXI, Quadro Comunitário de Apoio III and by Administração Regional de Saúde Norte. EP was funded by Fundação para a Ciência e a Tecnologia (SFRH/BD/19803/2004).
Conflicts of interest
No conflicts of interest have been declared.
Acknowledgements
We are grateful to the families enrolled in the Geração XXI study for their kindness, to all members of the research team for their enthusiasm and perseverance and to the participating hospitals and their staff for their help and support. In particular,we would like to thank P Sarmento, AC Cunha, A Gouveia, E Fernandes and L Fernandes from Júlio Dinis Maternity, and N Montenegro, M Moucho, T Rodrigues and L Francisco from S. João Hospital.
References
- Amaral C.C.F., Sequeira C.D. & Camacho M.A. (1993a) Yoghurt – composition and nutritional value of varieties marketed in Portugal. Allowance for the Portuguese food composition table. Revista Portuguesa de Nutrição 3, 35–52. [Google Scholar]
- Amaral T.F., Nogueira C., Paiva I., Lopes C., Cabral S. & Fernandes P. (1993b) Food weights and portions. Revista Portuguesa de Nutrição 2, 13–23. [Google Scholar]
- Aro A., Amaral E., Kesteloot H., Rimestad A., Thamm M. & Van Poppel G. (1998a) Trans fatty acids in French fries, soups, and snacks from 14 European countries: the Transfair Study. Journal of Food Composition and Analysis 11, 170–177. [Google Scholar]
- Aro A., Antoine J.M., Pizzoferrato L., Reykdal O. & Van Poppel G. (1998b) Trans fatty acids in dairy and meat products from 14 European countries: the TransFair Study. Journal of Food Composition and Analysis 11, 150–160. [Google Scholar]
- Aro A., Van Amelsvoort J., Becker W., Van Erp‐baart M.A., Kafatos A., Leth T. et al. (1998c) Trans fatty acids in dietary fats and oils from 14 European countries: the TransFair Study. Journal of Food Composition and Analysis 11, 137–149. [Google Scholar]
- Ashdown‐Lambert J. (2005) A review of low birth weight: predictors, precursors and morbidity outcomes. Journal of the Royal Society of Health 125, 76–83. [DOI] [PubMed] [Google Scholar]
- Baer H.J., Blum R.E., Rockett H.R., Leppert J., Gardner J.D., Suitor C.W. et al. (2005) Use of a food frequency questionnaire in American Indian and Caucasian pregnant women: a validation study. BMC Public Health 5, 135. [DOI] [PMC free article] [PubMed] [Google Scholar]
- Barker D. (1999) The intra‐uterine origins of disturbed cholesterol homeostasis. Acta Paediatrica 88, 483–484. [DOI] [PubMed] [Google Scholar]
- Barker D. & Martyn C. (1992) The maternal and fetal origins of cardiovascular disease. Journal of Epidemiology and Community Health 46, 8–11. [DOI] [PMC free article] [PubMed] [Google Scholar]
- Barker D.J., Eriksson J.G., Forsén T. & Osmond C. (2002) Fetal origins of adult disease: strength of effects and biological basis. International Journal of Epidemiology 31, 1235–1239. [DOI] [PubMed] [Google Scholar]
- Batista I. & Bandarra N. (1993) Influence of four cooking methods on the chemical composition of different fish species. Revista Portuguesa de Nutrição 3, 5–14. [Google Scholar]
- Bland J. & Altman D. (1986) Statistical methods for assessing agreement between two methods of clinical measurement. Lancet 1, 307–310. [PubMed] [Google Scholar]
- Brantsaeter A.L., Haugen M., Alexander J. & Meltzer H.M. (2008) Validity of a new food frequency questionnaire for pregnant women in the Norwegian Mother and Child Cohort Study (MoBa). Maternal & Child Nutrition 4, 28–43. [DOI] [PMC free article] [PubMed] [Google Scholar]
- Brown J.E., Buzzard I.M., Jacobs D.R. Jr, Hannan P.J., Kushi L.H., Barosso G.M. et al. (1996) A food frequency questionnaire can detect pregnancy‐related changes in diet. Journal of the American Dietetic Association 96, 262–266. [DOI] [PubMed] [Google Scholar]
- Cade J., Thompson R., Burley V. & Warm D. (2002) Development, validation and utilisation of food‐frequency questionnaires – a review. Public Health Nutrition 5, 567–587. [DOI] [PubMed] [Google Scholar]
- Centro de Segurança Alimentar e Nutrição (2006) Food Composition Table. Instituto Nacional de Saúde Dr. Ricardo Jorge: Lisbon. [Google Scholar]
- Czeizel A.E. & Dudas I. (1992) Prevention of the first occurrence of neural‐tube defects by periconceptional vitamin supplementation. The New England Journal of Medicine 327, 1832–1835. [DOI] [PubMed] [Google Scholar]
- De Vriese S.R., De Henauw S., De Backer G., Dhont M. & Christophe A.B. (2001) Estimation of dietary fat intake of Belgian pregnant women. Comparison of two methods. Annals of Nutrition & Metabolism 45, 273–278. [DOI] [PubMed] [Google Scholar]
- Erkkola M., Karppinen M., Javanainen J., Rasanen L., Knip M. & Virtanen S.M. (2001) Validity and reproducibility of a food frequency questionnaire for pregnant Finnish women. American Journal of Epidemiology 154, 466–476. [DOI] [PubMed] [Google Scholar]
- Fawzi W.W., Rifas‐Shiman S.L., Rich‐Edwards J.W., Willett W.C. & Gillman M.W. (2004) Calibration of a semi‐quantitative food frequency questionnaire in early pregnancy. Annals of Epidemiology 14, 754–762. [DOI] [PubMed] [Google Scholar]
- Ferreira F. & Graça M. (1985) Portuguese Food Composition Table, 2nd edn. Instituto Nacional de Saúde Dr. Ricardo Jorge: Lisbon. [Google Scholar]
- Fowles E. (2004) Prenatal nutrition and birth outcomes. Journal of Obstetric, Gynecologic, and Neonatal Nursing 33, 809–822. [DOI] [PubMed] [Google Scholar]
- Giroux I., Inglis S.D., Lander S., Gerrie S. & Mottola M.F. (2006) Dietary intake, weight gain, and birth outcomes of physically active pregnant women: a pilot study. Applied Physiology, Nutrition, and Metabolism 31, 483–489. [DOI] [PubMed] [Google Scholar]
- Greeley S., Storbakken L. & Magel R. (1992) Use of a modified food frequency questionnaire during pregnancy. Journal of the American College of Nutrition 11, 728–734. [DOI] [PubMed] [Google Scholar]
- Kaiser L.L. & Allen L. (2002) Position of the American Dietetic Association: nutrition and lifestyle for a healthy pregnancy outcome. Journal of the American Dietetic Association 102, 1479–1490. [DOI] [PubMed] [Google Scholar]
- Kuehl K. & Loffredo C. (2005) Genetic and environmental influences on malformations of the cardiac outflow tract. Expert Review of Cardiovascular Therapy 3, 1125–1130. [DOI] [PubMed] [Google Scholar]
- Lind T. (1984) Would more calories per day keep low birthweight at bay? Lancet 1, 501–502. [DOI] [PubMed] [Google Scholar]
- Lopes C., Aro A., Azevedo A., Ramos E. & Barros H. (2007) Intake and adipose tissue composition of fatty acids and risk of myocardial infarction in a male Portuguese community sample. Journal of the American Dietetic Association 107, 276–286. [DOI] [PubMed] [Google Scholar]
- Martinez‐Frias M. & Salvador J. (1990) Epidemiological aspects of prenatal exposure to high doses of vitamin A in Spain. European Journal of Epidemiology 6, 118–123. [DOI] [PubMed] [Google Scholar]
- Mikkelsen T.B., Osler M. & Olsen S.F. (2006) Validity of protein, retinol, folic acid and n‐3 fatty acid intakes estimated from the food‐frequency questionnaire used in the Danish National Birth Cohort. Public Health Nutrition 9, 771–778. [DOI] [PubMed] [Google Scholar]
- Mouratidou T., Ford F. & Fraser R.B. (2006) Validation of a food‐frequency questionnaire for use in pregnancy. Public Health Nutrition 9, 515–522. [DOI] [PubMed] [Google Scholar]
- Olsen S.F., Olsen J. & Frische G. (1990) Does fish consumption during pregnancy increase fetal growth? A study of the size of the newborn, placental weight and gestational age in relation to fish consumption during pregnancy. International Journal of Epidemiology 19, 971–977. [DOI] [PubMed] [Google Scholar]
- Paiva I., Amaral T. & Barros H. (2004) Influence of individually estimated portion size on the assessment of nutritional risk in colorectal cancer in Portugal. Journal of Human Nutrition and Dietetics 17, 529–536. [DOI] [PubMed] [Google Scholar]
- Parra M.S., Schnaas L., Meydani M., Perronl E., Martinez S. & Romleu I. (2002) Erythrocyte cell membrane phospholipid levels compared against reported dietary intakes of polyunsaturated fatty acids in pregnant Mexican women. Public Health Nutrition 5, 931–937. [DOI] [PubMed] [Google Scholar]
- Phillips D. (1998) Birth weight and the future development of diabetes. A review of the evidence. Diabetes Care 21 (Suppl. 2), B150–B155. [PubMed] [Google Scholar]
- Pinheiro J. & Seabra D. (2008) Changes of food habits during pregnancy and breast‐feeding. Acta Medica Portuguesa 21, 149–160. [PubMed] [Google Scholar]
- Pinto E., Barros H. & Santos‐Silva I. (2009) Dietary intake and nutritional adequacy prior to conception and during pregnancy: a follow‐up study in the north of Portugal. Public Health Nutrition 12, 922–931. [DOI] [PubMed] [Google Scholar]
- Pitkin R. (2007) Folate and neural tube defects. The American Journal of Clinical Nutrition 85, 285S–288S. [DOI] [PubMed] [Google Scholar]
- Quinlan J. & Hill D. (2003) Nausea and vomiting of pregnancy. American Family Physician 68, 121–128. [PubMed] [Google Scholar]
- Robinson S., Godfrey K., Osmond C., Cox V. & Barker D. (1996) Evaluation of a food frequency questionnaire used to assess nutrient intakes in pregnant women. European Journal of Clinical Nutrition 50, 302–308. [PubMed] [Google Scholar]
- Saldana T.M., Siega‐Riz A.M. & Adair L.S. (2004) Effect of macronutrient intake on the development of glucose intolerance during pregnancy. American Journal of Clinical Nutrition 79, 479–486. [DOI] [PubMed] [Google Scholar]
- Shatenstein B., Nadon S., Godin C. & Ferland G. (2005) Development and validation of a food frequency questionnaire. Canadian Journal of Dietetic Practice and Research 66, 67–75. [DOI] [PubMed] [Google Scholar]
- Simmer K., Iles C.A., Slavin B., Keeling P.W. & Thompson R.P. (1987) Maternal nutrition and intrauterine growth retardation. Human Nutrition. Clinical Nutrition 41, 193–197. [PubMed] [Google Scholar]
- Suitor C.J., Gardner J. & Willett W.C. (1989) A comparison of food frequency and diet recall methods in studies of nutrient intake of low‐income pregnant women. Journal of the American Dietetic Association 89, 1786–1794. [PubMed] [Google Scholar]
- Venter C., Higgins B., Grundy J., Clayton C.B., Gant C. & Dean T. (2006) Reliability and validity of a maternal food frequency questionnaire designed to estimate consumption of common food allergens. Journal of Human Nutrition & Dietetics 19, 129–138. [DOI] [PubMed] [Google Scholar]
- Walter S.D., Eliasziw M. & Donner A. (1998) Sample size and optimal designs for reliability studies. Statistics in Medicine 17, 101–110. [DOI] [PubMed] [Google Scholar]
- Wei E.K., Gardner J., Field A.E., Rosner B.A., Colditz G.A. & Sultor C.W. (1999) Validity of a food frequency questionnaire in assessing nutrient intakes of low‐income pregnant women. Maternal and Child Health 3, 241–246. [DOI] [PubMed] [Google Scholar]
- WHO (World Health Organization) (1995) Physical status: the use and interpretation of anthropometry. Report of a WHO Expert Committee. World Health Organization Technical Report Series 854, 1–452. [PubMed] [Google Scholar]
- Willett W. & Lenart E. (1998) Reproducibility and validity of food‐frequency questionnaires In: Nutritional Epidemiology (eds Kelsey J., Manmot M., Stoppey P. & Vessey M.), pp. 101–147. Oxford University Press, New York. [Google Scholar]
- Wynn S.W., Wynn A.H., Doyle W. & Crawford M.A. (1994) The association of maternal social class with maternal diet and the dimensions of babies in a population of London women. Nutrition and Health 9, 303–315. [DOI] [PubMed] [Google Scholar]