

Abstract
| Table of Contents | |
|---|---|
| Summary | 25 |
| 1. Introduction | 33 |
| 1.1 Importance of complementary feeding for child health | 33 |
| 1.2 Guiding principles for complementary feeding | 34 |
| 1.3 Scope and organization of this report | 34 |
| 2. Energy and nutrients needed from complementary foods | 35 |
| 2.1 Energy, protein and lipids | 35 |
| 2.2 Micronutrients | 35 |
| 3. Methods | 36 |
| 3.1 Sources searched and search strategy | 36 |
| 3.2 Measurement of the treatment effect of interventions | 36 |
| 3.3 Evaluation of methodological quality and level of evidence | 37 |
| 3.4 Number of relevant studies identified | 38 |
| 4. Findings of the systematic review | 38 |
| 4.1 Types of intervention strategies | 38 |
| 4.1.1 Educational interventions | 38 |
| 4.1.2 Provision of food offering extra energy (with or without micronutrient fortification) | 43 |
| 4.1.3 Micronutrient fortification of complementary foods | 43 |
| 4.1.4 Increasing energy density of complementary foods through simple technology | 46 |
| 4.1.5 Categorization of results by intervention strategy | 46 |
| 4.2 Growth outcomes | 46 |
| 4.2.1 Interventions using educational approaches | 46 |
| 4.2.2 Interventions in which provision of complementary food was the only treatment | 49 |
| 4.2.3 Interventions in which provision of complementary food was combined with another strategy, usually education for mothers | 51 |
| 4.2.4 Interventions in which complementary foods were fortified with additional micronutrients | 53 |
| 4.2.5 Interventions to increase energy density of complementary foods | 55 |
| 4.3 Morbidity outcomes | 55 |
| 4.3.1 Interventions using educational approaches | 55 |
| 4.3.2 Interventions in which provision of complementary food was the only treatment | 57 |
| 4.3.3 Interventions in which provision of complementary food was combined with another strategy, usually education for mothers | 57 |
| 4.3.4 Interventions in which complementary foods were fortified with additional micronutrients | 58 |
| 4.3.5 Interventions to increase energy density of complementary foods | 59 |
| 4.4 Child development | 61 |
| 4.4.1 Interventions in which provision of complementary food was the only treatment | 61 |
| 4.4.2 Interventions in which complementary foods were fortified with additional micronutrients | 62 |
| 4.5 Micronutrient intake | 63 |
| 4.5.1 Intervention studies using educational approaches | 63 |
| 4.5.2 Interventions in which provision of complementary food was the only treatment | 64 |
| 4.5.3 Interventions in which provision of complementary food was combined with another strategy, usually education for mothers | 64 |
| 4.5.4 Interventions in which complementary foods were fortified with additional micronutrients | 65 |
| 4.5.5 Interventions to increase energy density of complementary foods | 66 |
| 4.6 Iron status | 66 |
| 4.6.1 Intervention studies using educational approaches | 66 |
| 4.6.2 Interventions in which complementary food was provided, with or without another strategy such as education for mothers | 68 |
| 4.6.3 Interventions in which commercially processed complementary foods were fortified with iron or multiple micronutrients | 68 |
| 4.6.4 Interventions in which home fortification of complementary foods was the primary intervention | 68 |
| 4.7 Zinc status | 72 |
| 4.7.1 Interventions in which complementary foods were fortified with additional micronutrients, either commercially or with home fortification | 72 |
| 4.8 Vitamin A status | 72 |
| 4.8.1 Interventions in which complementary foods were fortified with additional micronutrients, either commercially or with home fortification | 72 |
| 5. Discussion | 75 |
| 5.1 Impact of complementary feeding interventions on growth | 75 |
| 5.2 Impact of complementary feeding interventions on morbidity | 77 |
| 5.3 Impact of complementary feeding interventions on child development | 78 |
| 5.4 Impact of complementary feeding interventions on micronutrient intake | 78 |
| 5.5 Impact of complementary feeding interventions on micronutrient status | 78 |
| 5.6 Conclusions | 79 |
| Acknowledgments | 82 |
| References | 82 |
Summary
Introduction
Complementary feeding interventions are usually targeted at the age range of 6–24 months, which is the time of peak incidence of growth faltering, micronutrient deficiencies and infectious illnesses in developing countries. After 2 years of age, it is much more difficult to reverse the effects of malnutrition on stunting, and some of the functional deficits may be permanent. Therefore, interventions that are effective at reducing malnutrition during this vulnerable period should be a high priority. Although several types of interventions can be targeted to this age range (e.g. micronutrient supplementation), a food‐based, comprehensive approach may be more effective and sustainable than programmes targeting individual nutrient deficiencies. For this review, a broad definition of ‘complementary feeding interventions’ is used so as to capture the full range of strategies that can be used.
Scope and methods of the review
The interventions described in this review generally include one or more components related to the Guiding Principles for Complementary Feeding of the Breastfed Child (PAHO/WHO 2003). The 10 guiding principles cover: (1) duration of exclusive breastfeeding and age of introduction of complementary foods; (2) maintenance of breastfeeding; (3) responsive feeding; (4) safe preparation and storage of complementary foods; (5) amount of complementary food needed; (6) food consistency; (7) meal frequency and energy density; (8) nutrient content of complementary foods; (9) use of vitamin‐mineral supplements or fortified products for infant and mother; and (10) feeding during and after illness. This review includes any relevant intervention that targeted children within the age range of 6–24 months. In some cases, the intervention may have included children older than 24 months, but in all studies at least some of the children were between 6 and 24 months. The assumption is that many of the children in these studies were breastfed, although a certain proportion will have terminated breastfeeding before 24 months. Although strategies for optimizing the duration of exclusive breastfeeding or increasing the total duration of breastfeeding may have a direct influence on several of the outcomes of interest, this review will not cover those strategies because another report will review those results.
The primary outcomes of interest for this review include growth, morbidity and child development. Micronutrient intake and micronutrient status were also included as outcomes because of their link to these key functional outcomes. Studies that assessed the impact of complementary feeding interventions on feeding practices only were not included because of time constraints and because it has been demonstrated previously that appropriately designed interventions can have a positive impact on feeding practices (Caulfield et al. 1999). For most intervention strategies and outcomes, the literature search was focused on the period from 1996 to 2006, as the previous review by Caulfield et al. (1999) covered the period from 1970 to 1997. For certain interventions not covered in the previous review (i.e. using amylase to increase energy density and interventions focused on iron status outcomes), studies dating back to 1990 were included. Only studies conducted in developing countries were included. The search was conducted using electronic methods, inspection of websites of key private voluntary organizations and the bibliographies of published papers, and personal contacts. The two authors of this review independently assessed the quality of each of the reviewed studies, and those scored as 2– (non‐randomized studies with a high risk of bias) were not included in the tabulation of results.
In total, 42 papers were included in the review. These papers report results from 29 efficacy trials and 13 effectiveness studies or programme reports from 25 developing countries. Interventions were considered efficacy trials if there was a high degree of assurance of delivery of the ‘treatment’, generally under carefully controlled research conditions (e.g. provision of a fortified complementary food with frequent follow‐up to assess adherence). Evaluations of interventions carried out in a programme setting, generally with less ability to control delivery of and adherence to ‘treatment’, were considered effectiveness studies.
To compare growth (weight and length) results across studies (when these results were reported as means ± SD), we calculated the treatment effect size for each outcome of interest using the formula:
 |
When possible, the effect sizes for each outcome were averaged across interventions to obtain a rough estimate of overall impact. Effect size can be categorized as small (∼0.2), medium (∼0.5) or large (∼0.8).
Interventions were grouped into five categories depending on the main strategy used:
-
1
education about complementary feeding as the main treatment,
-
2
complementary food or a food product offering extra energy (with or without added micronutrients) provided as the only treatment,
-
3
provision of food combined with some other strategy, usually education for mothers,
-
4
fortification of complementary foods (centrally processed fortified foods or home‐fortification products) with micronutrients (with no difference in energy provided to intervention vs. control groups), and
-
5
increased energy density and/or nutrient bioavailability of complementary foods through the use of simple technologies.
Some studies had more than one intervention group and may thus be included in more than one of the categories. In these situations, only the results for the intervention groups that are relevant to the comparison in question are included in that section. Some of the interventions targeted only malnourished children, but most were aimed at all children in the target age range.
Results
Growth
Nearly all of the studies assessed growth as an outcome. There were six efficacy trials and five effectiveness studies in which the main intervention strategy was education about complementary feeding. Taking these 11 studies together, educational interventions had a modest effect on weight (mean effect size = 0.28; range −0.06, 0.96) and linear growth (mean effect size 0.20, range 0.04, 0.64). The two educational interventions with the greatest impact on both weight and length gain (effect sizes of 0.34–0.96) were the projects in Peru (Penny et al. 2005) and China (Guldan et al. 2000). In both of these, a key message was to regularly provide an animal‐source food to the infant (chicken liver, egg or fish in Peru; egg in China). The other educational intervention with a relatively large impact on weight (though not on length) was a study in Bangladesh that targeted children with low weight‐for‐age at baseline (Roy et al. 2005). That intervention also promoted the home preparation of a complementary food mixture that included egg, meat or fish.
There were seven efficacy trials and one effectiveness study in which the only intervention strategy was provision of complementary food (often fortified). The results were somewhat inconsistent: there was a positive impact in Ghana and Malawi but no impact in South Africa, Indonesia or Brazil. The overall mean effect size was 0.60 (range −0.02, 2.99) for weight and 0.47 (range −0.04, 1.81) for linear growth, but these effects are inflated by the results from Nigeria (Obatolu 2003) (effect sizes: weight = 2.99, length = 1.81). Excluding that study, the mean effect size was 0.26 (range −0.02, 0.57) for weight and 0.28 (range −0.04, 0.69) for length. For the combination of provision of complementary food with some other strategy (usually education), there were two efficacy trials and six effectiveness studies. With these eight studies combined, the average effect size for weight was 0.35 (range 0.18, 0.66) and that for linear growth was 0.17 (range 0, 0.32). Two studies specifically evaluated whether provision of food plus education was more effective than education alone (Bhandari et al. 2001; Roy et al. 2005). In India (Bhandari et al. 2001), the food plus education group gained 250 g more weight and 0.4 cm more than the control group during the 8‐month intervention, whereas the education‐only group gained only 90 g more than the control group and did not have any advantage in length gain. In Bangladesh (Roy et al. 2005), results for the education‐only group were intermediate between those of the food plus education and control groups. Thus, in these two settings the inclusion of a food supplement was more effective than education alone.
The effect of fortification of complementary foods (with no difference in the amount of energy provided to intervention and control groups) on growth was evaluated in six efficacy trials, three of which involved home fortification using micronutrient supplements (powders or crushable tablets). The other three studies used cereal/legumes mixes or a milk formulation to which the micronutrients were added during processing. Only in the fortified‐milk study (conducted in India) was there a significant impact on growth. The average effect size for all six studies was 0.11 (range −0.22, 0.37) for weight and 0.12 (range −0.02, 0.45) for length. There were no effectiveness studies identified within this category.
There were five efficacy trials in which the main strategy was aimed at increasing the energy density of the usual complementary food. Only two of these trials had a significant impact on growth (John & Gopaldas 1993; Moursi et al. 2003). In the other three (Mamiro et al. 2004; Hossain et al. 2005a; Owino et al. 2007), there was no increase in energy intake, so the lack of impact on growth is not surprising. The average effect size across all trials was 0.35 (range −0.13, 1.37) for weight and 0.23 (range −0.25, 0.71) for linear growth.
1, 2 compare the effect sizes for growth across each category of intervention. The average effect sizes are in the small to medium range, which is in agreement with estimates from the previous review of interventions completed between 1970 and 1997 [effect size generally 0.10–0.50 (Caulfield et al. 1999)].
Morbidity
Only 10 of the intervention studies included data on morbidity outcomes. In most of these, there were no significant effects on morbidity. Most studies included morbidity as a secondary outcome and were not designed or powered to detect differences in morbidity. Two of the educational interventions showed a beneficial effect: a reduction in diarrhoea in Brazil (Vitolo et al. 2005) and a reduction in upper respiratory infection in Vietnam (Schroeder et al. 2002). The fortified‐milk study in India demonstrated a significant reduction in both diarrhoea and acute lower respiratory illness (Sazawal et al. 2007), and a study evaluating home fortification with a micronutrient powder (‘Sprinkles™’) in Pakistan showed beneficial effects on diarrhoea and fever (Sharieff et al. 2006). However, in three studies the interventions were associated with increased symptoms of morbidity. This was evident in food supplementation interventions in Bangladesh [during the first 2 months of the intervention (Roy et al. 2005)] and in India (Bhandari et al. 2001) and in an energy‐density intervention in Congo (Moursi et al. 2003). In India, the adverse effects on fever and dysentery could have been due to the reduction in breastfeeding that occurred in the intervention group. Unhygienic preparation and storage of complementary foods is another possible explanation for adverse effects of these interventions on morbidity.
Behavioural development
Only four studies, all efficacy trials, included data on behavioural development. The provision of a fat‐based fortified food product or micronutrients alone improved gross motor development in Ghana (Adu‐Afarwuah et al. 2007) but these types of interventions did not have any significant effect on developmental outcomes in South Africa (Oelofse et al. 2003) or India (Dhingra et al. 2004). Positive results of supplementation with extra energy in Indonesia were seen only in a subgroup (Pollitt et al. 2002).
Micronutrient intake
Only a few studies reported data on iron, zinc and vitamin A intakes. Education for mothers significantly increased child iron intake in Malawi, India and Peru, but did not have any significant effect on intakes in Brazil. Taking those four studies together, the intervention increased iron intake from complementary foods by 24% (range −7%, 60%) and zinc intake by 26% (range 9%, 53%). Despite those increases, mean iron and zinc intake from complementary foods was still well below recommended intakes in some sites. In Brazil (Santos et al. 2005) a large‐scale food supplementation programme failed to have an impact on intakes of these three micronutrients. There was also no impact of traditional processing of complementary foods in Tanzania (Mamiro et al. 2004). The largest impact on micronutrient intakes resulted from fortification strategies, which increased iron intake by 145–207% in Mexico and Ghana, zinc intake by 201–271% in Ecuador and Ghana, and vitamin A intake by 107% to more than 2300% in Ecuador and Ghana.
Anaemia and iron status
Four studies of educational interventions included data on anaemia and/or iron status. In India and China there was an increase in mean haemoglobin but in Nicaragua and Brazil there was no significant effect. The difference in impact across studies could be due to the specificity of the messages regarding enhancement of iron intake in the two former studies, compared with the latter two projects. Overall, for these four studies the average impact was an increase of 4 g L−1 in mean haemoglobin and a reduction in the prevalence of anaemia of 5 percentage points.
In 12 studies, the target group was provided with a complementary food that was fortified with iron (and sometimes other micronutrients as well). The comparison group received either no additional food (five studies: two efficacy trials and three programme evaluations), or an unfortified complementary food (seven efficacy trials). For the former group of five studies, the average impact was an increase of 4 g L−1 in mean haemoglobin and a reduction in the prevalence of anaemia of 13 percentage points. For the latter group of seven studies, the average effect was an increase of 6 g L−1 in mean haemoglobin and a reduction in the prevalence of anaemia of 17 percentage points.
Another seven studies (five efficacy trials, two programme evaluations) evaluated the effect of home fortification of complementary foods using powders, crushable tablets or fat‐based products. Taking these seven studies together, the average impact was an increase of 8 g L−1 in mean haemoglobin and a reduction in the prevalence of anaemia of 21 percentage points.
Some of the above studies included direct assessments of iron status, such as ferritin values. In most cases, the impact on the prevalence of iron deficiency was greater than the impact on anaemia, indicating that other factors such as malaria contribute to the persistently high rates of anaemia in certain populations.
Zinc status
Only five studies reported plasma zinc concentrations, all of which involved evaluation of a fortified complementary food (three efficacy trials, one programme evaluation), or a home‐fortification product (efficacy trial). The fortified foods provided 3–6.5 mg day−1 zinc, and the daily home‐fortification ‘foodlet’ (crushable tablet) provided 10 mg day−1. In the four studies using fortified foods, none demonstrated a significant difference between intervention and control groups in mean plasma zinc concentration or the percentage of children with low plasma Zn. In the foodlet intervention trial in South Africa, the group receiving daily micronutrients had significantly higher plasma zinc than the placebo group (Smuts et al. 2005). Overall, these results indicate that complementary foods fortified with multiple micronutrients, including zinc, have little impact on plasma zinc concentration, perhaps because of the relatively low bioavailability of zinc when consumed with cereal‐based or cereal/legume blend foods.
Vitamin A status
Seven intervention studies to evaluate the impact of a fortified complementary food (three efficacy trials, two programme evaluations) or home‐fortification products (two efficacy trials) included data on vitamin A status. There was a significant impact on mean serum vitamin A concentration in four of the five interventions using fortified complementary foods, and a reduction in the incidence of vitamin A deficiency in the two studies (of these five) that evaluated this outcome. There was no significant impact on serum vitamin A concentration in the two studies using home‐fortification products, which the investigators attributed to widespread participation in vitamin A supplementation programmes that occurred during the study time period. Taken together, these seven studies indicate that complementary foods fortified with vitamin A can reduce the incidence of vitamin A deficiency (by an average of ∼−13 percentage points in the two studies that reported this), although this impact may be obscured by concurrent vitamin A supplementation programmes.
Conclusions
The results of this review indicate that there is no single universal ‘best’ package of components in complementary feeding interventions because the needs of the target population vary greatly. The impact of such interventions is thus context specific, and depends on factors such as the initial prevalence of malnutrition, the degree of household food insecurity, the energy density of traditional complementary foods and the availability of micronutrient‐rich local foods.
Child growth was the most common outcome measured, but it may not be the most sensitive indicator of benefit because of other constraints that limit the extent to which a child's growth (particularly height) can respond to post‐natal interventions. The impact of these interventions on child growth was mixed. When the primary approach was education about child feeding, interventions that included a strong emphasis on feeding nutrient‐rich animal‐source foods were more likely to show an effect. When a complementary food was provided, with or without concurrent strategies such as nutrition education, the studies in Africa and South Asia generally showed positive effects, while those in other regions were more variable. This may be related to the relatively high prevalence of food insecurity in Africa and South Asia. In such contexts, providing additional food – not just education – may facilitate the ability of families to follow complementary feeding guidelines.
In several studies, the impact of providing a complementary food, in combination with nutrition education, was evident only in the younger children. This underscores the importance of beginning complementary feeding programmes during infancy, when nutrient needs relative to energy intake are the highest and the ability of the child to respond to a nutritional intervention is the greatest.
Because most interventions in which a complementary food was provided used fortified foods, it is not possible to determine whether the positive effects on growth are due to greater energy/protein/fat intake, greater micronutrient intake, or the combination. It is noteworthy that the interventions in which micronutrient fortification was the sole component (i.e. comparisons of fortified vs. unfortified complementary foods, or evaluations of home fortification) generally had little or no effect on growth. Further research on the biological mechanisms underlying growth effects, including the potential roles of milk protein and essential fatty acids, is needed.
Increasing the energy density of complementary foods may have a positive effect on growth when the traditional complementary food has a low energy density and infants are unable to adequately compensate by consuming a higher volume or being fed more frequently. However, before including this strategy in a complementary feeding programme, it is advisable to first demonstrate that increasing energy density of the traditional food will actually result in increased total daily energy intake (including energy intake from breastmilk). It should be noted that increasing energy density will not necessarily result in adequate micronutrient intake, so this strategy should be accompanied by other efforts to improve dietary adequacy.
The potential for an impact on growth appears to be greater with interventions using key educational messages, provision of complementary food with or without fortification, or increased energy density of complementary foods than with interventions based on fortification alone. Although the effect sizes for growth were generally modest (0.1–0.5), the potential impact is larger (0.5–0.6) if programmes are optimally designed and implemented. Furthermore, the impact on the lower tail of the distribution – that is, on stunting rates – could be considerably larger than the effect on the mean height z‐score. In general, effect sizes for growth of interventions providing complementary foods were greater for efficacy trials than for programmes. This is not surprising, given the logistical challenges of ensuring consistent delivery of food (and education) in large‐scale programmes.
Some of the complementary feeding interventions reviewed had a beneficial impact on morbidity rates, but there is the potential for adverse effects of strategies such as food supplementation and increased energy density. This may be due to excessive displacement of breastmilk and/or unhygienic preparation and storage of complementary foods. This highlights the need to couple complementary feeding interventions with counselling regarding continued breastfeeding, responsive feeding and hygienic practices.
There is very little information on the impact of complementary feeding interventions on behavioural development, but recent studies in infants have yielded promising results. It is important to include assessments of behavioural development in such evaluations, as these outcomes may be more sensitive to improvements in child nutrition than outcomes such as growth and morbidity.
With regard to micronutrient intake, the results of educational interventions indicate that it is difficult to achieve adequate iron intake from unfortified local foods at 6–12 months of age. Fortification (either processed complementary foods or home fortification) is the most feasible option in most circumstances given the cost of iron‐rich foods (such as liver or meat). Adequate zinc and vitamin A intakes can be achieved from local foods, but this requires very careful attention to dietary choices. Fortification can help ensure zinc and vitamin A intakes when nutrient‐rich local foods are costly or unavailable (e.g. seasonally).
The results also indicate that fortification can be highly effective at improving iron and vitamin A status. Although this could be accomplished by other strategies, such as iron or vitamin A supplementation, using complementary foods as the vehicle may be less risky [given recent concerns about adverse effects of iron supplements in certain situations (WHO & UNICEF 2007)] and more acceptable to caregivers. Further research is needed to understand why zinc‐fortified foods have generally little effect on plasma zinc concentrations.
Complementary feeding interventions, by themselves, cannot change the underlying conditions of poverty and poor sanitation that contribute to child malnutrition. They need to be implemented in conjunction with a larger strategy that includes improved water and sanitation, better health care and adequate housing. Nonetheless, the results of this review indicate that carefully designed programmes that include pre‐tested educational messages provided through multiple channels, with fortified foods or home‐fortification products made available depending on the needs of the target population, can substantially improve growth and micronutrient status and may also reduce morbidity and enhance behavioural development. The key challenge is how to implement high‐quality programmes that are sustainable when delivered on a large scale.
Keywords: child growth, child nutrition, infant feeding, iron status, micronutrients
1. Introduction
1.1 Importance of complementary feeding for child health
It is well recognized that the period of complementary feeding, from 6 to 24 months of age, is one of the most critical times for preventing malnutrition (World Bank 2005). Growth faltering is most evident during this time period (Shrimpton et al. 2001) particularly during the first phase of complementary feeding (6–12 months) when foods of low nutrient density begin to replace breastmilk and rates of diarrhoeal illness caused by food contamination are at their highest. After about 2 years of age, it is very difficult to reverse stunting that occurred at earlier ages (Martorell et al. 1994), suggesting a ‘critical window’ for prevention of growth faltering. This is consistent with results of intervention trials showing that the greatest impact of food supplementation is seen among children under 2 years of age (Lutter et al. 1990; Schroeder et al. 1995). Micronutrient deficiencies are also highly prevalent among infants and young children because of their high nutrient needs relative to energy intake and the effects of frequent infection (including subclinical infection) on appetite, nutrient absorption and nutrient losses. Deficiencies of certain nutrients, such as iron, are not limited to disadvantaged populations but are evident across all income groups. There may be irreversible sequelae from micronutrient deficiencies that affect brain development and other functional outcomes (Lozoff et al. 2006). Therefore, it is essential to evaluate which strategies for improving complementary feeding are most effective at preventing malnutrition and enhancing growth and development of infants and young children.
To be effective in reducing rates of stunting, not just underweight, complementary feeding interventions must ultimately have an impact on the proximal factors that influence linear growth. Figure 3 presents a conceptual model for how these proximal factors relate to one another. Both the quality and the quantity of complementary foods can positively influence linear growth, but simply increasing the quantity of food will not be effective if dietary quality is poor. Thus, dietary quality modifies the relationship between food quantity and linear growth. In addition, changes in breastmilk intake may modify the relationship between food quantity and linear growth, as breastmilk intake usually decreases when consumption of complementary foods increases. The other key proximal factor is morbidity, which has a negative effect on linear growth, as well as on intake of complementary foods. Morbidity rates can be reduced by sustaining breastmilk intake and by optimizing the quality (including good hygiene during preparation, storage and feeding) and quantity of complementary foods. Thus, complementary feeding interventions should ideally address all of these proximal factors.
Figure 3.
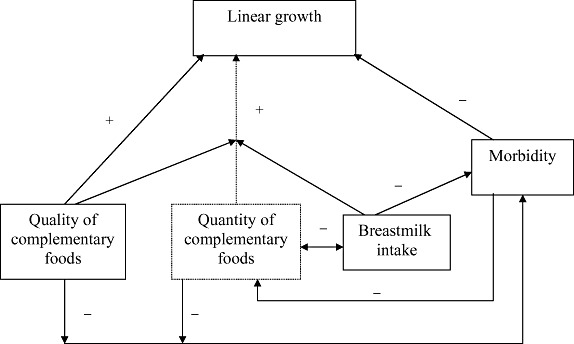
Conceptual model of proximal factors affecting linear growth during the period of complementary feeding. Quality and quantity of complementary foods can both positively influence linear growth, but the impact of food quantity is dependent on adequate dietary quality (signified by the arrow from dietary quality intersecting with the arrow from food quantity to linear growth). In addition, changes in breastmilk intake may modify the relationship between food quantity and linear growth, as breastmilk intake usually decreases when consumption of complementary foods increases. Morbidity has a negative effect on linear growth (and on intake of complementary foods), but morbidity rates can be reduced by sustaining breastmilk intake and by optimizing quality (including good hygiene during preparation, storage and feeding) and quantity of complementary foods.
1.2 Guiding principles for complementary feeding
In recognition of the need for greater consistency in child feeding guidelines, the Pan American Health Organization (PAHO) and the World Health Organization (WHO) published the Guiding Principles for Complementary Feeding of the Breastfed Child in 2003 (PAHO/WHO 2003). The 10 guiding principles cover: (1) duration of exclusive breastfeeding and age of introduction of complementary foods; (2) maintenance of breastfeeding; (3) responsive feeding; (4) safe preparation and storage of complementary foods; (5) amount of complementary food needed; (6) food consistency; (7) meal frequency and energy density; (8) nutrient content of complementary foods; (9) use of vitamin‐mineral supplements or fortified products for infant and mother; and (10) feeding during and after illness. The interventions described in this review generally included one or more components related to these guiding principles.
1.3 Scope and organization of this report
The purpose of this review is to assess the impact of interventions to improve complementary feeding of children 6–24 months of age in developing countries. Because not all such interventions have been labelled as ‘complementary feeding’ interventions, the review includes any relevant intervention that targeted children within the age range of 6–24 months. In some cases, the project may have included children older than 24 months, but in all studies at least some of the children were between 6 and 24 months. The assumption is that many of the children in these studies were breastfed, although a certain proportion will have terminated breastfeeding before 24 months. Although strategies for optimizing the duration of exclusive breastfeeding or increasing the total duration of breastfeeding may have a direct influence on several of the outcomes of interest, this review will not cover those strategies because another report will review those results. The primary outcomes of interest for this review include growth, morbidity and child development. Micronutrient intake and micronutrient status were also included as outcomes because of their link to these key functional outcomes. Studies that assessed the impact of complementary feeding interventions on feeding practices were not included because of time constraints and because it has been demonstrated previously that appropriately designed interventions can have a positive impact on feeding practices (Caulfield et al. 1999).
This report will first briefly review the energy and nutrients needed from complementary foods. This will be followed by a description of the methods and results of the systematic review, and finally a discussion of the findings.
2. Energy and nutrients needed from complementary foods
Breastmilk intake continues to make a substantial contribution to the energy and nutrient intakes of infants and young children in developing countries after the age of 6 months, but nutrient needs from complementary foods increase as breastmilk intake declines with age. Previous documents have reviewed the amounts of energy and other nutrients needed from complementary foods, taking into account the average breastmilk intake and its nutrient composition during each age interval among children in developing countries (Dewey & Brown 2003). These recommendations will be briefly reviewed below.
2.1 Energy, protein and lipids
Total daily average energy requirements for healthy children are 615 kcal at 6–8 months, 686 kcal at 9–11 months and 894 kcal at 12–23 months of age (Dewey & Brown 2003). In developing countries, the average expected energy intake from complementary foods is approximately 200 kcal at 6–8 months, 300 kcal at 9–11 months and 550 kcal to 12–23 months. These values represent 33%, 45% and 61% of total energy needs respectively. Achieving these energy intakes requires that both feeding frequency and energy density of complementary foods be adequate. An energy density of <0.6 kcal g−1 is generally considered low. When energy density is at least 0.8 kcal g−1, the recommended feeding frequency is two to three meals at 6–8 months and three to four meals at 9–24 months, with the option of including additional nutritious snacks once or twice per day, depending on the child's appetite and responding to the child's signs of hunger and satiety (PAHO/WHO 2003).
The amount of protein needed from complementary foods increases from about 2 g day−1 at 6–8 months to 5–6 g day−1 at 12–23 months, with the percentage from complementary foods increasing from 21% to about 50%. There is uncertainty about the optimal intake of fat during the first 2 years of life. Breastmilk is usually rich in fat (approximately 30–50% of energy), so little additional fat from complementary foods is needed while breastmilk intake is still high. However, the fat content of complementary foods becomes more important as breastmilk intake declines with age. To achieve at least 30% of energy from fat in the total diet, the amount of fat needed from complementary foods (assuming average breastmilk intake) is zero at 6–8 months, approximately 3 g day−1 at 9–11 months and 9–13 g day−1 at 12–23 months, or 0%, 5–8% and 15–20% of the energy from complementary foods respectively (Dewey 2005) (a range is given because of variability in breastmilk fat concentration). The quality of the fat may be even more important than the quantity. Infants and young children need good sources of essential fatty acids in their diet, such as fish, egg, liver, nut pastes and vegetable oils.
2.2 Micronutrients
Micronutrient needs are high during the first 2 years of life, to support the rapid rate of growth and development during this period. The percentage of the recommended nutrient intake needed from complementary foods varies widely, depending on the concentration of each nutrient in breastmilk. The nutrients that are most problematic – for which at least 75% must come from complementary foods – are iron (97–98%), zinc (80–87%) and vitamin B6 (80–90%) (Dewey 2005). Thus, complementary food diets need to contain foods rich in these nutrients (generally animal‐source foods), or be fortified in some way.
3. Methods
3.1 Sources searched and search strategy
We first searched ‘PubMed’ on 7 August 2006, and examined the titles and abstracts of all the retrieved citations for relevance to complementary feeding and growth, micronutrient intake, micronutrient status, morbidity and child development. The search strategy used is shown in Appendix 1. For most intervention strategies and outcomes, we focused our search primarily on the period from 1996 to 2006, as there had been a previous systematic literature review by Caulfield et al. (1999) covering the period from 1970 to 1997. For interventions using amylase to increase energy density and for those focused on iron status outcomes, however, we searched for studies dating back to 1990 because the review by Caulfield et al. did not cover those topics. Only studies conducted in developing countries were included. Papers written in English, Spanish or Portuguese were reviewed.
In addition to PubMed, we searched Google and Alltheweb, as well as the official websites of various private voluntary organizations for non‐peer‐reviewed papers and programme reports not listed in PubMed. After combining the PubMed, Google and Alltheweb searches, further searches in other services such as ‘Popline’ and the Food and Nutrition Library using similar keywords as above did not yield any additional relevant citations and were considered redundant.
Using the ‘snowball’ technique, we also discovered other papers by manually reviewing the bibliographies of published articles and reviews related to the relevant topics. Finally we obtained some reports and yet‐to‐be‐published papers through personal contacts with other experts.
3.2 Measurement of the treatment effect of interventions
For the various outcomes of interest (growth, morbidity, motor development, micronutrient intake and micronutrient status), we used three strategies [effect size calculation, percentage point (PP) difference calculation and percentage difference calculation] to measure the magnitude of the treatment effect of interventions, based on how the results for those outcomes were reported in the original papers.
a. Growth
In papers where the anthropometric results of intervention and control groups were reported as means (±SD), our strategy was to calculate effect size as a measure of treatment effect. For this, we used the formula:
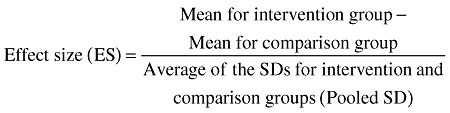 |
An effect size can be interpreted as the percent of non‐overlap of the intervention group's scores with those of the control group (Cohen 1988). According to Cohen's (1988) interpretation, an ES (Cohen's d) of 0.0 indicates that the distribution of scores for the intervention group overlaps completely with the distribution of scores for the control group, and there is 0% non‐overlap. An ES of 0.3 indicates a non‐overlap of 21.3% in the two distributions. Effect size can be categorized as small (∼0.2), medium (∼0.5) or large (∼0.8).
We were interested in two effect sizes: (1) the effect size for ponderal (weight) growth; and (2) the effect size for linear growth. However, different studies reported these outcomes in various ways. Weight outcomes included attained weight, weight‐for‐age z‐score (WAZ), and changes in weight and WAZ, and linear growth outcomes included attained length (or height), length‐for‐age z‐score (LAZ), and changes in length and LAZ. Whenever a study reported weight growth or length growth using two or more indices, we first calculated the effect size for each index, and then used the largest of these as representing the effect size for weight growth or linear growth. For example, in the Peru study in which growth was compared between children exposed to an educational intervention and a control group (Penny et al. 2005), we first calculated two effect sizes: for attained weight and WAZ. Then we used the largest of these as the effect size for weight growth.
Because the calculation of ES requires the mean and SD values for the intervention and control groups, in studies in which SD values were not reported (Obatolu 2003; Rivera et al. 2004), we estimated them based on results from similar studies in which subjects of comparable age were involved.
The effect size for weight or linear growth was simply averaged across interventions to obtain a rough estimate of overall impact. No attempt was made to weight the effect sizes based on the size or quality of the studies because, unlike more narrowly defined nutritional interventions (such as vitamin A or zinc supplementation trials), there was a large amount of heterogeneity in the components and objectives of the interventions. Thus, this was not a formal meta‐analysis.
In several studies, the growth of intervention and control groups was reported as percentages of children underweight and/or stunted. For these, we determined the magnitude of treatment effect by calculating the PP difference between the intervention and the control groups (i.e. % for intervention group – % for control group).
b. Morbidity
We found relatively less consistency across studies regarding the morbidity outcomes reported. For this report, we present results for the prevalence and incidence of diarrhoea, upper respiratory infection (URI) and fever. We selected these illnesses because they were the most commonly reported indicators of morbidity in the papers reviewed, and are also the most prevalent illnesses among infants and young children. In most studies, the prevalence of morbidity in intervention and control groups was reported as percentages, for example, the percentage of study days with illness (Lartey et al. 1999; Sharieff et al. 2006) or the percentage of children with illness (Schroeder et al. 2002; Smuts et al. 2005; Vitolo et al. 2005; Adu‐Afarwuah et al. 2007). In contrast, incidence of morbidity was reported as mean episodes (Lartey et al. 1999; Bhandari et al. 2001; Moursi et al. 2003; Roy et al. 2005) or odds ratio (RR) (Sazawal et al. 2007). To measure the magnitude of treatment effect on morbidity, we calculated the PP difference (% for intervention group – % for control group) between intervention and control groups for prevalence, and the percentage difference [({mean for intervention group – mean for control group} ÷ mean for control group) × 100] for incidence of morbidity.
c. Motor development
As with the morbidity outcomes, we calculated PP difference between intervention and control groups where the results of a motor development outcome were reported as percentages (Adu‐Afarwuah et al. 2007), and percentage difference where results were reported as means (Beckett et al. 2000; Oelofse et al. 2003).
d. Micronutrient intakes and status
For micronutrient intakes and status, we focused on Fe, Zn and vitamin A because these are considered key ‘problem’ nutrients in many developing countries (WHO 1998; Dewey & Brown 2003). For these outcomes, we calculated PP difference where results were reported as percentages (e.g. percentage of children with anaemia in intervention and control groups) and percentage difference where results were reported as means (±SD) for intervention and control groups [e.g. mean Fe intake or haemoglobin (Hb) concentration].
3.3 Evaluation of methodological quality and level of evidence
The two authors of this review independently assessed the quality of each of the reviewed studies based on the set of criteria presented in the original framework for the Global Review process, that is, studies were given scores for ‘level of evidence’ depending on design. Randomized controlled trials with ‘very low risk of bias’ were scored 1++, and those with ‘low risk of bias’ were scored 1+. Non‐randomized trials with ‘very low risk of confounding’ were scored 2++, and those with ‘low risk of confounding’ were scored 2+. Randomized and non‐randomized studies with ‘high risk of bias’ were scored 1− and 2− respectively. Discrepancies in scoring between the two reviewers were resolved by consensus. Studies scored as 2– were not included in the tabulation of results.
3.4 Number of relevant studies identified
In total, 277 citations were identified from PubMed, comprising 274 from the original search of 7 August 2006 and three more from later automatic updating of the saved search strategy by the PubMed service. Of these, 12 citations were selected as being relevant for possible inclusion in the review. We found 18 papers from the snowball technique, and 12 from personal contacts (Table 1). Thus, in total, 42 papers were included in the review. These papers report results from 29 efficacy trials and 13 effectiveness studies or programme reports from 25 developing countries. Interventions were considered efficacy trials if there was a high degree of assurance of delivery of the ‘treatment’, generally under carefully controlled research conditions (e.g. provision of a fortified complementary food with frequent follow‐up to assess adherence). Evaluations of interventions carried out in a programme setting, generally with less ability to control delivery of and adherence to ‘treatment’, were considered effectiveness studies.
Table 1.
Summary of the number of papers used in the review
| Source searched | No. of citations retrieved | No. not selected | No. selected for review | Selected papers | |
|---|---|---|---|---|---|
| Efficacy trials | Effectiveness/programme reports | ||||
| PubMed | 277 | 265 | 12 | 12 | 0 |
| Snowball technique | – | – | 18 | 11 | 7 |
| Personal contacts | – | – | 12 | 6 | 6 |
| Total | 42 | 29 | 13 | ||
These papers showed considerable variation in methodology, but 22 of them (19 efficacy trials and three effectiveness studies/programme reports) appeared to satisfy the criterion of having ‘low risk of bias’ (1+), while eight efficacy trials were considered to have ‘very low risk of bias’ (1++). The number of studies scored 1−, 2++ and 2+ was 2, 8 and 2 respectively.
4. Findings of the systematic review
4.1 Types of intervention strategies
Table 2 presents a summary of the studies reviewed and the nature of the interventions that were evaluated. We have categorized these into four general intervention strategies, although it should be noted that several interventions included more than one type of strategy. Some of the interventions targeted only malnourished children, but most were aimed at all children in the target age range.
Table 2.
Summary of intervention approaches used and the outcomes measured by studies included in the review
| Author | Type of study | Level of evidence | Site | Nature of intervention | Outcomes |
|---|---|---|---|---|---|
| Education | |||||
| Bhandari et al. (2004) | Efficacy | 1+ | India | Health and nutrition workers in intervention communities were trained to counsel mothers at home, clinics and hospitals. | Growth |
| Duration: 18 months | |||||
| Hotz & Gibson (2005) | Efficacy | 2++ | Malawi | Mothers received education on food preparation, food diversity and use of amylase rich flour. | Fe/Zn intake |
| Duration: 2 months | |||||
| Kapur et al. (2003) | Efficacy | 1+ | India | Trained health workers delivered nutrition education to mothers, and/or children received 20 mg of elemental Fe per week. | Fe status/intake |
| Duration: 4 months | |||||
| Penny et al. (2005) | Efficacy | 1+ | Peru | Health staff received education in counselling and anthropometry; high‐performing facilities were accredited. | Growth; Fe/Zn intake |
| Duration: 18 months | |||||
| Santos et al. (2001) | Efficacy | 1+ | Brazil | Health‐care providers were trained to deliver educational messages on food preparation and infant feeding to mothers. | Growth, Fe/Zn intake |
| Duration: 6 months | |||||
| Vitolo et al. (2005) | Efficacy | 1+ | Brazil | Mothers received educational guidelines for infant and child feeding from birth to 1 year post‐partum through home visits. | Growth, morbidity |
| Duration: 12 months | |||||
| Guldan et al. (2000) | Programme | 2+ | China | Trained nutrition educators provided growth monitoring and counselling in intervention areas. | Growth, Fe status |
| Duration: 4–12 months | |||||
| Guyon et al. (2006) | Programme | 2+ | Madagascar | The Essential Nutrition Action programme was implemented that had several components including Behavior Change Communication (BCC) for mothers, health staff and community workers. | Growth |
| Duration: Intervention was in operation for 5 years at the time of evaluation | |||||
| Kilaru et al. (2005) | Programme | 2+ | India | Trained field workers educated mothers on food preparation and infant feeding. | Growth |
| Duration: 7–12 months | |||||
| Maluccio & Flores (2004) | Programme | 1++ | Nicaragua | Mothers received education, health services and cash transfer in a government programme. | Growth, Fe status |
| Duration: 24 months | |||||
| Food alone | |||||
| Beckett et al. (2000) | Efficacy | 1+ | Indonesia | Children received milk product with different energy contents with or without micronutrients. | Growth, development |
| Duration: 6–12 months | |||||
| Kuusipalo et al. (2006) | Efficacy | 1+ | Malawi | Malnourished children received fortified food in the form of milk‐ or soy‐based spread. | Growth, Fe status |
| Duration: 3 months | |||||
| Obatolu (2003) | Efficacy | 1+ | Nigeria | Infants received extruded malted maize/malted cowpea/crayfish/corn oil blend. | Growth |
| Duration: 14 months | |||||
| Oelofse et al. (2003) | Efficacy | 1− | South Africa | Children received centrally processed, fortified CF. | Growth, Fe/Zn/vitamin A status, development |
| Duration: 6 months | |||||
| Santos et al. (2005) | Programme | 2+ | Brazil | Malnourished children received dry milk and cooking oil under government programme. | Growth, Fe/Zn/vitamin A intake |
| Duration: 6 months | |||||
| Food + education | |||||
| Bhandari et al. (2001) | Efficacy | 1+ | India | Subjects received nutrition education, or education plus fortified milk/cereal food. | Growth, morbidity |
| Duration: 8 months. | |||||
| Roy et al. (2005) | Efficacy | 1+ | Bangladesh | Subjects received nutrition education, or education plus supplemental feeding. | Growth, morbidity |
| Duration: 3 months. | |||||
| Gartner et al. (2007) | Programme | 2+ | Senegal | Peri‐urban children received flour mix from local ingredients; mothers received nutrition education. | Growth |
| Duration: 6 months | |||||
| Hossain et al. (2005b) | Programme | 2++ | Bangladesh | Mothers received education on infant feeding, malnourished children received food through government programme. | Growth |
| Duration: At the time of study, the project had been in operation for 6 years | |||||
| Lutter et al. (2006) | Programme | 2+ | Ecuador | Fortified food for children (Mi Papilla) and nutrition education for their families and health workers in intervention areas. | Growth, Fe/Zn/vitamin A intake and status |
| Duration: 11 months | |||||
| López de Romaña (2000) | Programme | 2+ | Peru | Fortified food (Ali Alimentu) for children, nutrition education for mothers. | Growth, Fe/vitamin A status |
| Duration: 12 months | |||||
| Rivera et al. (2004) | Programme | 1+ | Mexico | Children/mothers received fortified food and health services, family received cash transfers. | Growth, Fe status |
| Duration: 24 months | |||||
| Schroeder et al. (2002) | Programme | 1+ | Vietnam | Mothers received education on infant feeding, malnourished children received extra food. | Growth, morbidity |
| Duration: 6 months | |||||
| Fortification | |||||
| Adu‐Afarwuah et al. (2007); Adu‐Afarwuah et al. (in press) | Efficacy | 1++ | Ghana | Children received added micronutrients through home fortification; one group received extra energy through fortified fat‐based spread. | Growth, motor development, morbidity, Fe status |
| Duration: 6 months | |||||
| Dhingra et al. (2004); Sazawal et al. (2007) | Efficacy | 1++ | India | Children received added micronutrients in a milk supplement. | Growth, morbidity, Fe status, development |
| Duration: 12 months | |||||
| Faber et al. (2005) | Efficacy | 1+ | South Africa | Children received added micronutrients through centrally processed CF. | Growth; Fe/vitamin A/Zn status |
| Duration: 6 months | |||||
| Giovannini et al. (2006) | Efficacy | 1++ | Cambodia | Children received added micronutrients through home fortification with Sprinkles™. | Growth, Fe status |
| Duration: 12 months | |||||
| Javaid et al. (1991) | Efficacy | 1+ | Pakistan | Children received milk cereal fortified with Fe using Fe fumarate or Fe pyrophosphate. | Growth, Fe status, morbidity |
| Duration: 8 months | |||||
| Lartey et al. (1999) | Efficacy | 1++ | Ghana | Children received various blends of cereal, legume and/or fish with or without added micronutrients. | Growth, Fe/Zn/vitamin A intake and status, morbidity |
| Duration: 6 months | |||||
| Schumann et al. (2005) | Efficacy | 1++ | Guatemala | Children received black beans fortified with haem from bovine blood or inorganic FeSO4 5 days week−1. | Fe status |
| Duration: 2.5 months | |||||
| Sharieff et al. (2006) | Efficacy | 1+ | Pakistan | Infants received Sprinkles™ added to complementary foods daily. | Fe status, morbidity |
| Duration: 2 months | |||||
| Smuts et al. (2005) | Efficacy | 1++ | South Africa | Children received added micronutrients through home fortification with foodlet. | Growth, Fe/Zn/vitamin A status, morbidity |
| Duration: 6 months | |||||
| Villalpando et al. (2006) | Efficacy | 1++ | Mexico | Children received added micronutrients in milk product. | Fe intake, Fe/Zn status |
| Duration: 6 months | |||||
| Walter et al. (1993) | Efficacy | 1+ | Chile | Children received fortified (electrolytic Fe 55 mg per 100 g of dry power) rice cereal daily. | Fe status |
| Duration: 11 months | |||||
| Zlotkin et al. (2003) | Efficacy | 1+ | Ghana | Children received Sprinkles™ containing Fe (microencapsulated Fe fumarate) alone or Fe + vitamin A. | Fe status |
| Duration: 6 months | |||||
| Menon et al. (2007) | Programme | 1+ | Haiti | Children receiving food assistance (fortified wheat/soy blend) were given Sprinkles™. | Fe status |
| Duration: 2 months | |||||
| World Vision Mongolia (2005) | Programme | 2+ | Mongolia | Children 6–35 months of age received Sprinkles™ with Fe and vitamin D. Other components of the Nutrition Program included the promotion of breastfeeding and consumption of nutrient (Fe)‐rich foods, and increasing nutrition knowledge and capacity in health facilities and communities. | Fe status |
| Duration: Average of 13 months | |||||
| Increased energy density | |||||
| Hossain et al. (2005a) | Efficacy | 1− | Bangladesh | Children received CF with amylase (ARF). | Growth |
| Duration: 1.5 months | |||||
| John & Gopaldas (1993) | Efficacy | 1+ | India | Children received wheat gruel with amylase. | Growth |
| Duration: 6 months | |||||
| Mamiro et al. (2004) | Efficacy | 1+ | Tanzania | Cereal & legume in CF were processed (soak/germinate/roast) to increase energy density & Fe solubility and reduce phytate. | Growth, Fe status/intake |
| Duration: 6 months | |||||
| Moursi et al. (2003) | Efficacy | 1+ | Congo | Children received processed cereal/legume blend with amylase (industrial). | Growth, morbidity |
| Duration: 3.5 months | |||||
| Owino et al. (2007) | Efficacy | 1+ | Zambia | Children received processed cereal/legume blend with or without amylase. | Growth, Fe status |
| Duration: 3 months | |||||
ARF, amylase‐rich flour; CF, complementary food; 1++, randomized controlled trials with very low risk of bias; 1+, randomized controlled trials with low risk of bias; 1−, randomized controlled trials with high risk of bias; 2++, non‐randomized trials with very low risk of confounding; 2+, non‐randomized trials with low risk of confounding.
4.1.1 Educational interventions
Nearly half of the interventions (18/42; eight efficacy trials and 10 programme evaluation reports) involved education about complementary feeding or had a significant educational component. In most of the studies, trained community‐based workers or volunteers delivered the educational messages to mothers and caregivers in their homes (Guldan et al. 2000; Kilaru et al. 2005; Vitolo et al. 2005), community centres (Kapur et al. 2003; Hotz & Gibson 2005; Roy et al. 2005) or during clinic attendance (Bhandari et al. 2001; Rivera et al. 2004; Lutter et al. 2006). In Brazil (Santos et al. 2001) and Peru (Penny et al. 2005), however, education was provided to the staff of health facilities (including physicians), who then offered specific counselling to caregivers during hospital/clinic consultations. In India (Bhandari et al. 2004), both community‐based workers and staff of health facilities were involved in offering counselling to mothers at various points of contact.
The educational messages promoted in these interventions varied widely. In one of the studies in Peru (López de Romaña 2000), for example, much of the education was focused on the appropriate use of the fortified food product (Ali Alimentu) being distributed via the programme. The most common educational messages (Table 3) included: (1) sustained breastfeeding during complementary feeding; (2) use of thicker porridges instead of thinner porridges or soups; (3) use of animal‐source foods; (4) dietary diversity; (5) responsive feeding; and (6) personal hygiene.
Table 3.
Summary of educational messages given to mothers
| Author | Educational messages | Message delivered by | Message delivered at |
|---|---|---|---|
| Efficacy trials | |||
| Bhandari et al. (2001) | Not specified: based on negotiating with mother changes that could be implemented in a feasible and sustainable way | Community‐based workers | Homes |
| Bhandari et al. (2004) | a. Continue breastfeeding throughout 6–24 months | Community‐based workers/health facility staff | Homes, community centres, health facility |
| b. Start complementary foods at around 6 months: use thick purees, increase frequency with age | |||
| c. Use responsive feeding | |||
| d. Wash hands | |||
| e. Continue to feed sick child | |||
| Hotz & Gibson (2005) | a. Give thicker porridges, instead of lighter porridges | Community‐based workers | Community centres |
| b. Use ARF to reduce viscosity | |||
| c. Add fish/meat to child's food if possible. | |||
| d. Add nutrient‐dense foods (e.g. egg, banana) to child's porridge | |||
| e. Serve child's food on a separate plate | |||
| f. Offer the child more food if inadequate portion sizes were consumed | |||
| g. Give nutritious snacks between meals | |||
| Kapur et al. (2003) | a. Start complementary foods by 6 months | Community‐based workers | Community centres |
| b. Provide foods of appropriate consistency, quality and quantity | |||
| c. Give small, but frequent feedings | |||
| d. Initiate child to family food by 1 year | |||
| e. Include iron‐rich foods | |||
| f. Give vitamin C‐rich foods with meals | |||
| g. Cook food in iron vessels | |||
| h. Avoid Fe absorption inhibitors such as tea | |||
| i. Maintain good hygiene | |||
| Penny et al. (2005) | 3 key messages: | Health facility staff | Health facility |
| a. Use thick purees instead of soups and at each meal give puree first | |||
| b. Add a special food to your baby's serving (e.g. chicken liver, egg or fish) | |||
| c. Teach your child to eat with love, patience and good humour | |||
| Roy et al. (2005) | a. Prepare food with adequate energy and nutrient density using locally available foods | Community based workers | Community centres |
| b. Use separate feeding pot for child | |||
| Santos et al. (2001) | a. Increase frequency of breastfeeds/complementary feeds | Health facility staff | Health facility |
| b. Give animal protein and micronutrient‐rich foods (egg, chicken liver, shredded chicken and beef) | |||
| c. Add oil to food | |||
| d. Increase energy and nutrient density by giving mashed beans instead of the broth and by giving thick papa instead of soup | |||
| Vitolo et al. (2005) | Based on ‘Ten Steps to Healthy Feeding’: | Community‐based nutrition educators | Homes |
| a. Feed only breastmilk for up to 6 months | |||
| b. Gradually introduce other foods after 6 months while maintaining breastfeeding | |||
| c. Give CF 3× per day after 6 months | |||
| d. Ensure that no schedules impair the offering of CF | |||
| e. Offer ‘thick’ foods using spoons | |||
| f. Offer child different foods during the day | |||
| g. Stimulate daily consumption of fruits/vegetables | |||
| h. Avoid sugar and other junk foods | |||
| i. Pay attention to hygiene and proper handling of food | |||
| j. Stimulate sick/convalescent to eat | |||
| Gartner et al. (2007) | Not specified | ||
| Guldan et al. (2000) | a. Bottle feeding may be dangerous | Community‐based nutrition educators | Homes |
| b. Frequent suckling on demand is best | |||
| c. After 4–6 months give daily hard‐boiled egg yolk, at first mixed with some breastmilk, thereafter give thickened rice porridge and other foods | |||
| d. Baby needs breastmilk for at least a year and needs other foods daily | |||
| e. Use home‐produced food and the family diets | |||
| Guyon et al. (2006) | Not specified, but emphasized, among others: | ||
| a. Promotion of feasible Essential Nutrition Actions that families can take | |||
| Age‐appropriate nutrition services and messages in the health system and the community | |||
| Hossain et al. (2005b) | Not specified, but focused on: | Community‐based workers | Community centres |
| a. Breastfeeding promotion | |||
| b. Caring practices | |||
| c. Personal hygiene | |||
| d. Use of iodized salt | |||
| Kilaru et al. (2005) | Not specified but based on: | Community‐based workers | Homes |
| a. Use of appropriate local foods and preparation of these foods | |||
| b. Appropriate feeding frequency | |||
| c. Gradually increasing food diversity | |||
| d. Complementary feeding followed by breastfeeding | |||
| e. Avoidance of feeding bottles | |||
| Lutter et al. (2006) | Not specified: based on raising awareness about good early child nutrition | Health workers | Health facility |
| López de Romaña (2000) | Not specified but based on: | Community‐based workers | Community centres |
| a. Nutritional needs of children of this age | |||
| b. Breastfeeding promotion | |||
| c. Preparation and administration of Ali Alimentu | |||
| Maluccio & Flores (2004) | Not specified but based on: | Community centres | |
| a. Breastfeeding | |||
| b. Child feeding | |||
| c. Illness care | |||
| d. Household sanitation and hygiene | |||
| Rivera et al. (2004) | Not stated | Health workers | Health facility |
| Schroeder et al. (2002) | Not specified but based on: | Community‐based volunteers | Community centres |
| a. Breastfeeding | |||
| b. Food variety | |||
| c. Complementary feeding | |||
| d. Health care | |||
| e. Taking care of healthy children at home | |||
ARF, amylase‐rich flour; CF, complementary food.
4.1.2 Provision of food offering extra energy (with or without micronutrient fortification)
We found 10 efficacy trials and seven effectiveness studies/programmes in which the provision of additional energy from complementary food(s) (compared with no additional energy) either was the only intervention strategy or formed a significant part of the overall intervention strategy. Not surprisingly, the foods differed widely across studies. In Vietnam (Schroeder et al. 2002), the food was prepared from locally available raw ingredients provided by mothers, and was fed to malnourished children at nutrition rehabilitation sessions. In other studies, the foods included: (1) cereal/legume blends with (López de Romaña 2000; Lutter et al. 2006) or without (Lartey et al. 1999; Obatolu 2003; Roy et al. 2005; Gartner et al. 2007; Owino et al. 2007) milk; (2) micronutrient‐fortified cereals (Lartey et al. 1999; Bhandari et al. 2001; Oelofse et al. 2003); or (3) fortified milk powder (Rivera et al. 2004; Santos et al. 2005). These foods were mostly centrally processed, and needed to be either cooked (Lartey et al. 1999) or reconstituted with water at home and served to children. Two recent studies have used fat‐based spreads containing peanut paste and soy or milk, which were either consumed directly without any further preparation (Kuusipalo et al. 2006) or mixed with other home‐prepared complementary foods (Adu‐Afarwuah et al. 2007).
The amount of energy provided daily in these studies ranged from 108 kcal for children aged 6–12 months (Adu‐Afarwuah et al. 2007) to 1510 kcal for children aged 9–18 months (Obatolu 2003).
4.1.3 Micronutrient fortification of complementary foods
Fortification of complementary foods was the intervention strategy in 15 of the studies, in which children receiving complementary foods with added micronutrients were compared with those receiving complementary foods without added micronutrients (i.e. no difference in the amount of energy provided). In most of these studies, fortification was accomplished through central processing of the complementary food (Lartey et al. 1999; Faber et al. 2005), but in some recent interventions, micronutrient supplements were added to home‐prepared complementary foods. Three types of supplements for home fortification have so far been evaluated: Sprinkles™, crushable tablets and fat‐based products. Sprinkles™ are single‐dose sachets containing micronutrients in a powdered form, to be sprinkled onto the child's food just before it is consumed. The iron in Sprinkles™ is ferrous fumarate that is microencapsulated to prevent the iron from interacting with food. Other micronutrients, such as zinc, iodine, folic acid and vitamins A, C and D, can be added to the sachet. Several studies evaluating the efficacy of Sprinkles™ for treating anaemia have been conducted, but for this review we restrict consideration to use of Sprinkles™ for anaemia prevention, which has been evaluated in Ghana (Zlotkin et al. 2003; Adu‐Afarwuah et al. 2007), Cambodia (Giovannini et al. 2006) and Pakistan (Sharieff et al. 2006). The efficacy of crushable multiple micronutrient tablets, called ‘foodlets’, was evaluated in four countries involved in the IRIS (International Research on Infant Supplementation) trials. However, in only one of the four countries, South Africa, was the foodlet mixed with complementary foods. In the other sites, it was taken between meals after being dissolved in water. Because this paper deals with complementary feeding interventions, only the results from South Africa (Smuts et al. 2005) and a separate trial in Ghana (Adu‐Afarwuah et al. 2007) will be included. The fat‐based product has been tested in Ghana (Adu‐Afarwuah et al. 2007) and Malawi (Kuusipalo et al. 2006), in both cases with peanut as the food base. It should be noted that the fat‐based product contains some energy, protein and essential fatty acids, so the results for these comparisons are included in category 4.1.2.
4.1.4 Increasing energy density of complementary foods through simple technology
The typically high viscosity (and thus, low energy density) of cereal gruels consumed by infants in many developing countries has been viewed as a cause of low energy intake. The addition of amylase to cereal gruels reduces viscosity and bulk, and allows foods of greater energy density to be prepared. A method to increase energy density of complementary food was the primary intervention strategy in five efficacy trials. Four of these studies used amylase, which was either obtained industrially (John & Gopaldas 1993; Moursi et al. 2003), or prepared as amylase‐rich flour from germinated wheat (Hossain et al. 2005a; Owino et al. 2007). In Tanzania, the simple traditional technologies of soaking, germination and roasting were used to increase not only energy density but also iron solubility of complementary foods.
4.1.5 Categorization of results by intervention strategy
In accordance with the four intervention strategies described above, we present the impact of the interventions on growth, morbidity, child development, micronutrient intake and micronutrient status using the following categories:
-
1
education as the main treatment,
-
2
complementary food or a food product offering extra energy (with or without added micronutrients) provided as the only treatment,
-
3
provision of food combined with some other strategy, usually education for mothers,
-
4
fortification of complementary foods (central or home fortification) with micronutrients (with no difference in energy provided to intervention vs. control groups), and
-
5
increased energy density and/or nutrient bioavailability of complementary foods through the use of simple technologies.
Some studies had more than one intervention group and may thus be included in more than one of the categories. In these situations, only the results for the intervention groups that are relevant to the comparison in question are included in that section.
4.2 Growth outcomes
4.2.1 Interventions using educational approaches
i. Efficacy trials
We found six efficacy studies, two from India (Bhandari et al. 2001; Bhandari et al. 2004), two from Brazil (Santos et al. 2001; Vitolo et al. 2005) and one each from Peru (Penny et al. 2005) and Bangladesh (Roy et al. 2005), in which education about child feeding was the intervention treatment and child growth was one of the outcomes (Table 4). In one of the studies in India (Bhandari et al. 2004), health facility workers received nutrition training, and then counselled mothers beginning from the birth of their babies and continuing through 18 months. The education occurred at various points of contact including immunization and hospital/clinic attendance. In the other study in India (Bhandari et al. 2001), health workers visited mothers in their homes and offered 30–45 min of nutrition counselling each month from 4 to 12 months of age. Two different complementary feeding educational approaches were tested in Brazil: in the first (Vitolo et al. 2005), trained health workers offered home counselling based on the ‘Ten Steps to Healthy Feeding’ to mothers during 0–12 months post‐partum, and in the second (Santos et al. 2001), physicians in intervention health facilities counselled mothers during clinic/hospital consultations after having received extra training in counselling totalling about 20 h. This latter approach is similar to the one adopted in Peru (Penny et al. 2005), in which the staff of health facilities were trained and assisted in delivering appropriate educational messages on complementary feeding to mothers during 0–18 months post‐partum. Although the study in Peru was designed as an effectiveness study, which influenced the type of data collected for the evaluation, it is classified as an efficacy trial in this review because of the high level of supervision involved in implementation. In Bangladesh, health workers provided intensive education to mothers twice a week for 3 months.
Table 4.
Impact on growth outcomes of interventions using educational approaches*
| Author | Site | Target group | Study groups | n | Weight | Length/height | % underweight | % stunted |
|---|---|---|---|---|---|---|---|---|
| Efficacy trials | ||||||||
| Bhandari et al. (2001) | India | 4 months | Education | 97 | 1.93 ± 0.57 | 68.6 ± 2.9 | 63.9 | |
| Visitation | 91 | 1.84 ± 0.72 | 68.4 ± 2.4 | 75.8 | ||||
| ES: 0.14 (Wt gain) | ES: 0.08 (Lt) | Diff: −11.9 PP | ||||||
| Bhandari et al. (2004) | India | Newborn | Education | 435 | 1.16 ± 0.65 | 6.01 ± 2.01 § | 54.2 | 50.1 |
| No intervention | 394 | 1.15 ± 0.67 | 5.91 ± 1.83 | 52.9 | 51.2 | |||
| ES: 0.02 (Wt gain) | ES: 0.05 (Lt gain) | Diff: +1.3 PP | Diff: −1.1 PP | |||||
| Penny et al. (2005) | Peru | Newborn | Education | 171 | −0.33 ± 0.90 † | −0.81 ± 0.80 † | 4.7 † | |
| No intervention | 167 | −0.62 ± 0.83 | −1.19 ± 0.83 | 15.8 | ||||
| ES: 0.34 (WAZ) | ES: 0.49 (LAZ) | Diff: −11.1 PP | ||||||
| Roy et al. (2005) | Bangladesh | 6–24 months | Education | 93 | 0.24 ± 0.39 † | −0.06 ± 0.43 | ||
| No intervention | 90 | −0.003 ± 0.46 | −0.11 ± 0.61 | |||||
| ES: 0.58 (WAZ change) | ES: 0.09 (LAZ change) | |||||||
| Santos et al. (2001) | Brazil | <18 months | Education | 209 | −0.18 ± 0.78 ‡ | −0.37 ± 0.97 | ||
| No intervention | 195 | −0.25 ± 0.78 | −0.41 ± 0.81 | |||||
| ES: 0.09 (WAZ) | ES: 0.04 (LAZ) | |||||||
| Vitolo et al. (2005) | Brazil | Newborn | Education | 163 | 5.5 | |||
| No intervention | 234 | 5.6 | ||||||
| Diff: −0.1 PP | ||||||||
| Programmes | ||||||||
| Guldan et al. (2000) | China | 0–12 months | Education | 250 | −1.17 ± 0.79 † , ** | −1.32 ± 1.00 † , †† | 0 | 5 |
| No intervention | 245 | −1.93 ± 0.79 ** | −1.96 ± 1.00 †† | 3 | 2 | |||
| ES: 0.96 (WAZ) | ES: 0.64 (LAZ) | Diff: −3 PP | Diff: −3 PP | |||||
| Guyon et al. (2006) | Madagascar | 6–23 months | Post‐intervention | NA | −1.57 ± 1.16 | −1.87 ± 1.00 | 38 | 45 |
| Pre‐intervention | NA | −1.50 ±1.16 | −2.01 ± 1.00 | 34 | 49 | |||
| ES: −0.06 (WAZ) | ES: 0.14 (LAZ) | Diff: +4 PP | Diff: −4 PP | |||||
| Kilaru et al. (2005) | India | 5–11 months | Education | 173 | 0.25 ± 0.18 ‡ , ‡‡ | |||
| No intervention | 69 | 0.22 ± 0.18 ‡‡ | ||||||
| ES: 0.16 (Wt velocity) | ||||||||
| Maluccio & Flores (2004) | Nicaragua | 0–59 months | Education (+income) | NA | 0.14 ± 1.1 † | 10.0 † | 37.0 ¶ | |
| No intervention | NA | −0.03 ± 1.65 | 16.0 | 42.0 | ||||
| ES: 0.12 (LAZ) | Diff: −6.0 PP | Diff: −5.0 PP | ||||||
Diff, difference; ES, effect size; LAZ, length‐for‐age z‐score; NA, not available; PP, percentage point; WAZ, weight‐for‐age z‐score. *Weight (Wt) and length/height (Lt) refer to the growth outcome shown in parentheses (units: Wt in kg; Lt in cm), which is also the outcome that gave the largest effect size in studies that reported more than one weight or length outcome. For Bhandari et al. (2004), weight and length gains are averages for 6–12 and 12–18 months. For Guldan et al. (2000), differences remained significant when adjusting for potential confounders, but only unadjusted values were reported. Italicized SD values are estimates. †Means are significantly different (P < 0.05). ‡Significant difference observed only in subsample: Brazil (Santos et al. 2001), children ≥12 months of age at baseline; India (Kilaru et al. 2005), females. §Significant difference observed only between 6 and 12 months (ES = 0.17), and for males at 18 months (ES = 0.11). ¶Significantly different at 10% level. **SD values are estimates from subjects of similar age from Vietnam (Schroeder et al. 2002). ††SD values are estimates, assuming LAZ has N(0, 1) distribution. ‡‡SD values are estimates from subjects of similar age from Congo (Moursi et al. 2003).
In neither of the studies in India was there any significant effect on weight. Similarly, in Brazil (Santos et al. 2001) there was no main effect on weight in the total sample, but in children >12 months of age at baseline, the intervention group had greater weight compared with the control group. The study by Vitolo et al. (2005) did not have data on weight outcomes. In Peru (Penny et al. 2005), the intervention children had significantly greater weight (by 0.29 kg) and change in WAZ (+0.29) at 18 months, but this difference in weight became non‐significant after adjustment for birthweight and socio‐economic factors. In Bangladesh, intervention children had greater WAZ change (+0.25) [and weight‐for‐length z‐score (WLZ)] compared with non‐intervention children, but it must be noted that these children were particularly undernourished [WAZ 61–75% of National Center of Health Statistics (NCHS) median] at baseline.
Results for linear growth were similar: educational interventions did not affect the LAZ of the malnourished children in Bangladesh (Roy et al. 2005), or the prevalence of stunting in Brazil (Vitolo et al. 2005). In the first study in India (Bhandari et al. 2001), monthly home counselling did not impact linear growth. In the second study in India (Bhandari et al. 2004), the children whose mothers received counselling at the health facility had greater length gain [by 0.32 cm, 95% confidence interval (CI) 0.03, 0.61] at 6–12 months, but not at 12–18 months of age. However, among males, there was a significantly greater attained length at 18 months in the intervention group than in the control group (a difference of 0.37 cm, 95% CI 0.08, 0.66). The only significant main effect of education on linear growth was found in Peru (Penny et al. 2005), where at 18 months, children in the intervention group were 1 cm taller (P = 0.0003) and three times less likely (P = 0.018) to be stunted (11.1 PP decrease in stunting prevalence) compared with children in the control group.
ii. Effectiveness studies/programme reports
The effect of educational programmes on growth was evaluated in China (Guldan et al. 2000), Madagascar (Guyon et al. 2006), India (Kilaru et al. 2005) and Nicaragua (Red de Protección Social or ‘Social Safety Net’) (Maluccio & Flores 2004) (second section of Table 4). In the case of the Nicaraguan programme, families also received cash transfers for food, as well as health services. The evaluation of the Madagascar programme did not include a control group, but data from a cross‐sectional survey conducted at the beginning of the intervention (year 2000) were compared with those from another survey conducted 5 years after the programme had been in operation.
Education about child feeding had no impact on WAZ in Madagascar or weight velocity (kg month−1) in India (except among females, who gained an additional 77 g month−1), but in China the strategy was associated with an unadjusted difference of +0.76 in WAZ (P = 0.004). In Nicaragua, the percentage of children who were underweight was reduced by 6 PP, from 16% to 10% (Maluccio & Flores 2004). Similar results were found for linear growth, with no significant effect in Madagascar but an improvement in China (+0.64 LAZ, P = 0.02) and Nicaragua [+0.17 height‐for‐age z‐score (HAZ), P < 0.05; % stunted −5 PP, from 42% to 37%, P < 0.05] (data on length were not collected in the India programme).
Summary
Taking all of these studies together, education about child feeding had a modest effect on weight (mean effect size = 0.28; range −0.06, 0.96) and linear growth (mean effect size 0.20, range 0.04, 0.64). These effects were larger in the programmes (effect sizes: weight = 0.35, range −0.06, 0.96; length = 0.30, range 0.12, 0.64) than in the efficacy trials (effect sizes: weight = 0.23, range 0.02, 0.58; length = 0.15, range 0.04, 0.47), which may be due to the fact that the programmes usually targeted children from low‐socio‐economic background experiencing poor growth, and such children are more likely to respond to an intervention. However, it is also possible that the less rigorous study design of the programme evaluations has contributed to an overestimation of impact, or that there is greater publication bias (publishing only if positive results are found) for programme evaluations than for efficacy trials.
4.2.2 Interventions in which provision of complementary food was the only treatment
i. Efficacy trials
Seven efficacy trials, conducted in Africa (Lartey et al. 1999; Obatolu 2003; Oelofse et al. 2003; Kuusipalo et al. 2006; Adu‐Afarwuah et al. 2007; Owino et al. 2007) and Asia (Beckett et al. 2000), compared the growth of infants receiving a complementary food with that of a control group not provided with any additional food (Table 5). Most of the foods provided were fortified (Lartey et al. 1999; Oelofse et al. 2003; Owino et al. 2007) or unfortified (Lartey et al. 1999; Obatolu 2003) cereal (Oelofse et al. 2003) or cereal/legume and/or fish blends (Lartey et al. 1999; Obatolu 2003; Oelofse et al. 2003; Owino et al. 2007). Fat‐based spreads were used in Ghana (Adu‐Afarwuah et al. 2007) and Malawi (Kuusipalo et al. 2006), whereas condensed milk was used in Indonesia (Beckett et al. 2000). Energy contribution from these foods ranged from 108 kcal day−1, 7 days week−1 (Adu‐Afarwuah et al. 2007) to 1510 kcal day−1, 7 days week−1 (Obatolu 2003).
Table 5.
Impact on growth outcomes of interventions in which provision of complementary food was the only treatment*
| Author | Site | Target group | Study groups | n | Weight | Length/height | % underweight | % stunted |
|---|---|---|---|---|---|---|---|---|
| Efficacy trials | ||||||||
| Adu‐Afarwuah et al. (2007) | Ghana | 6 months | Fortified spread | 98 | −0.40 ± 1.10 † | −0.14 ± 1.00 † | ||
| No intervention | 96 | −0.74 ± 1.10 | −0.40 ± 1.00 | |||||
| ES: 0.31 (WAZ) | ES: 0.26 (LAZ) | |||||||
| Beckett et al. (2000) | Indonesia | 12 and 18 months | Fortified food | 38 | 8.78 ± 1.08 ‡ | 76.3 ± 3.3 ‡ | ||
| Very low‐energy food | 40 | 8.75 ± 1.08 ‡ | 76.2 ± 3.3 ‡ | |||||
| ES: 0.03 (Wt) | ES: 0.02 (Lt) | |||||||
| Kuusipalo et al. (2006) | Malawi | 6–17 months | Fortified spread | 94 | 0.18 ± 0.40 † | 2.5 ± 1.1 † | ||
| No intervention | 18 | 0 ± 0.30 | 1.7 ± 1.3 | |||||
| ES: 0.51 (WAZ change) | ES: 0.67 (LAZ change) | |||||||
| Lartey et al. (1999) | Ghana | 6 months | Fortified cereal/legume | 190 | −1.19 ± 0.93 † | −0.63 ± 0.84 † | ||
| No intervention | NA | −1.71 ± 0.9 | −1.27 ± 1.02 | |||||
| ES: 0.57 (WAZ) | ES: 0.69 (LAZ) | |||||||
| Obatolu (2003) | Nigeria | 4 months | Fortified food | 30 | 10.07 ± 1.08 † , ‡ | 79.7 ± 3.3 † , ‡ | ||
| No intervention | 30 | 6.84 ± 1.08 ‡ | 73.7 ± 3.3 ‡ | |||||
| ES: 2.99 (Wt) | ES: 1.81 (Lt) | |||||||
| Oelofse et al. (2003) | South Africa | 6 months | Fortified food | 16 | −0.55 ± 0.99 | 74.4 ± 1.8 | ||
| No intervention | 14 | −0.52 ± 1.60 | 74.5 ± 3.1 | |||||
| ES: −0.02 (WAZ) | ES: −0.04 (Lt) | |||||||
| Owino et al. (2007) | Zambia | 5 months | Fortified food | 37 | 9.0 ± 1.5 | 71.8 ± 2.5 † | ||
| No intervention | 69 | 8.6 ± 1.1 | 70.9 ± 2.4 | |||||
| ES: 0.30 (Wt) | ES: 0.37 (Lt) | |||||||
| Programmes | ||||||||
| Santos et al. (2005) | Brazil | 6–23 months | Food supplement | 99 | 0.33 ± 0.71 | 0.05 ± 0.98 | ||
| No intervention | 92 | 0.26 ± 0.73 | 0.07 ± 0.97 | |||||
| ES: 0.10 (WAZ change) | ES: −0.02 (LAZ change) | |||||||
ES, effect size; LAZ, length‐for‐age z‐score; NA, not available; WAZ, weight‐for‐age z‐score. *Weight (Wt) and length/height (Lt) refer to the growth outcome shown in parentheses (units: Wt in kg; Lt in cm), which is also the outcome that gave the largest effect size in studies that reported more than one weight or length outcome. Italicized SD values are estimates. †Means are significantly different (P < 0.05). ‡SD values are estimates from subjects of similar age from India (Bhandari et al. 2004).
Supplementation with micronutrient fortified or unfortified cereal/legume blends was associated with an increase of 0.52 in the WAZ of Ghanaian infants (P < 0.001) from 6 to 12 months of age (Lartey et al. 1999), and an increase of 3.2 kg in the weight of Nigerian children (Obatolu 2003) from 4 to 18 months of age. Consumption of a fortified spread from 6 to 12 months increased WAZ (by 0.34 Z) among infants in Ghana (Adu‐Afarwuah et al. 2007), when compared with a non‐intervention group. In Malawi, 6–17‐month‐old underweight (WAZ < −2) children who consumed at least 50 g of a similar spread daily for 3 months gained 230 g more in weight compared with those receiving 0–5 g day−1. In contrast, provision of a complementary food did not affect the weight of children in South Africa (Oelofse et al. 2003), Zambia (Owino et al. 2007) or Indonesia (Beckett et al. 2000).
Linear growth was increased in five of the seven studies. In the two studies in Ghana, 6 months of intervention was associated with an increase in LAZ of 0.26–0.69 Z (Lartey et al. 1999; Adu‐Afarwuah et al. 2007), compared with non‐intervention children. In Zambia, children consuming a fortified cereal/legume blend for 3 months grew 0.9 cm more than their counterparts not included in the intervention, and in Malawi, malnourished children consuming fortified fat‐based spreads for 3 months gained 0.8 cm more than unsupplemented children. The greatest effect of food supplementation on linear growth was observed in Nigeria (Obatolu 2003), where the height of intervention children receiving large quantities of a cereal/legume/fish oil blend from 4 to 18 months of age was reportedly 6 cm greater than that of the control group. However, no significant effect on linear growth was found in the studies in South Africa (Oelofse et al. 2003) and Indonesia (Beckett et al. 2000).
ii. Effectiveness studies/programme reports
We found only one study that evaluated the effect on growth of a large‐scale food supplementation programme without any other significant intervention component (Table 5). This was the Brazilian National Food Supplementation Program for Malnourished Children and Pregnant Women at Risk (also known as the Milk Supplement Program) in which families of intervention children 6–23 months of age received 120 g of dry milk, plus 24 mL of cooking oil per day, which provided approximately 800 kcal day−1, 7 days week−1 (Santos et al. 2005). The programme did not have any significant effect on weight or linear growth: after 6 months, intervention children on average gained 1.53 kg in weight and 6.3 cm in length, compared with control children who gained 1.54 kg and 6.6 cm (WAZ difference = +0.07; LAZ difference = −0.02).
Summary
Taken together, these eight efficacy and programme evaluation studies indicate that provision of a complementary food can have a significant impact on growth under well‐controlled situations, although the results are somewhat inconsistent: there was a positive impact in Ghana (Lartey et al. 1999; Adu‐Afarwuah et al. 2007), Nigeria (Obatolu 2003), Zambia (Owino et al. 2007) and Malawi (Kuusipalo et al. 2006) but no impact in South Africa (Oelofse et al. 2003), Indonesia (Beckett et al. 2000) or Brazil (Santos et al. 2005). Two important aspects of the Malawi (Kuusipalo et al. 2006) and Nigeria (Obatolu 2003) studies must be recognized: in the former, the children were malnourished (WAZ < −2 SD; WLZ > −3 SD) at baseline and in the latter, the energy contribution of the supplement was very high. Thus, the positive responses observed in those studies are perhaps not surprising. The lack of significant effect in South Africa (Oelofse et al. 2003) could be due to small sample size (n = 16, intervention; n = 14, control), but the authors also reported that some infants refused to consume the study food. The evaluation study in Brazil (Santos et al. 2005) was not a randomized trial, and despite efforts to select comparable groups, the control children had higher socio‐economic status than the intervention group, which made it difficult to detect an effect of the intervention. Furthermore, the milk supplement tended to displace energy intake from other foods, and for about 50% of recipients, there were frequent gaps in the delivery of the food. In Indonesia (Beckett et al. 2000), the authors speculated that the lack of effect on growth was due to diversion of energy to increased physical activity, rather than to poor compliance or replacement of the habitual diet by the food provided.
The overall mean effect size was 0.60 (range −0.02, 2.99) for weight and 0.47 (range −0.04, 1.81) for linear growth. However, these effects are inflated by the results from Nigeria (Obatolu 2003) (effect sizes: weight = 2.99, length = 1.81). Excluding that study, the mean effect size was more modest: 0.26 (range −0.02, 0.57) for weight and 0.28 (range −0.04, 0.69) for length.
4.2.3 Interventions in which provision of complementary food was combined with another strategy, usually education for mothers
i. Efficacy trials
There have been two efficacy studies, one in India (Bhandari et al. 2001) and one in Bangladesh (Roy et al. 2005), in which a group exposed to a combined food supplementation and education intervention was compared with a control group (Table 6). In India, infants were given a fortified milk‐based cereal from 4 to 12 months of age and received monthly visits by a physician who offered encouragement to mothers regarding the feeding of the child. The amount of energy provided by the food increased from 225 kcal day−1 at 4 months to 1125 kcal day−1 at 12 months. The control infants (‘Visitation group’) were visited twice per week only for morbidity assessment. In Bangladesh (Roy et al. 2005), malnourished children (weight‐for‐age between 61% and 75% of NCHS median) 6–24 months of age received supplementary food 6 days week−1 (∼300 kcal day−1) for 3 months, while their mothers attended intensive nutrition educations sessions twice per week; the control group received the normal services (nutrition education every 2 weeks, supplementary feeding for severely malnourished children) provided by the Bangladesh Integrated Nutrition Program (BINP).
Table 6.
Impact on growth outcomes of interventions in which provision of complementary food was combined with another strategy, usually education for mothers*
| Author | Site | Target group | Study groups | n | Weight | Length/height | % underweight | % stunted |
|---|---|---|---|---|---|---|---|---|
| Efficacy | ||||||||
| Bhandari et al. (2001) | India | 4 months | Fortified food + education | 87 | 2.09 ± 0.83 † | 10.3 ± 1.6 | 69.0 | |
| Visitation | 91 | 1.84 ± 0.72 | 9.9 ± 1.6 | 75.8 | ||||
| ES: 0.32 (Wt gain) | ES: 0.25 (Lt gain) | Diff: −6.8 PP | ||||||
| Roy et al. (2005) | Bangladesh | 6–24 months | Food + education | 99 | 0.30 ± 0.46 † | 0.05 ± 0.38 ‡ | ||
| No intervention | 90 | 0 ± 0.46 | −0.11 ± 0.61 | |||||
| ES: 0.66 (WAZ change) | ES: 0.32 (LAZ change) | |||||||
| Programmes | ||||||||
| Gartner et al. (2007) | Senegal | 6–35 months | Food + education | 759 | 24.0 | 14.7 | ||
| No food + education | 917 | 22.7 | 14.5 | |||||
| Diff: +1.3 PP** | Diff: −0.2 PP | |||||||
| Hossain et al. (2005b) | Bangladesh | 6–23 months | Fortified food + education | 1598 | 46.6 | 39.1 | ||
| No intervention | 790 | 48.4 | 40.0 | |||||
| Diff: −1.8 PP | Diff: −0.9 PP | |||||||
| Lutter et al. (2006) | Ecuador | 6–12 months | Fortified food + education | 170 | −1.00 ± 0.97 † | −1.27 ± 1.04 § | 14.5 † | 23.7 |
| No intervention | 149 | −1.23 ± 0.94 | −1.42 ± 1.09 | 24.1 | 27.5 | |||
| ES: 0.24 (WAZ) | ES: 0.14 (LAZ) | Diff: −9.6 PP | Diff: −3.8 PP | |||||
| López de Romaña (2000) | Peru | 6–23 months | Fortified food + education | NA | 56.0 | |||
| No intervention | NA | 56.0 | ||||||
| Diff: 0 | ||||||||
| Rivera et al. (2004) | Mexico | 0–12 months | Food + education + income for 2 years | 373 | 26.4 ± 9.0 ¶ | |||
| Food + education + income for 1 year | 277 | 25.3 ± 9.0 | ||||||
| ES: 0.12 (Lt gain) | ||||||||
| Schroeder et al. (2002) | Vietnam | 5–25 months | Food + education | 114 | −1.92 ± 0.78 ‡ | −1.66 ± 0.94 ‡ | 46.5 | 36.0 |
| No intervention | 118 | −2.06 ± 0.79 | −1.66 ± 0.88 | 55.9 | 33.1 | |||
| ES: 0.18 (WAZ) | ES: 0 (LAZ) | Diff: −9.4 PP | Diff: +2.9 PP | |||||
Diff, difference; ES, effect size; LAZ, length‐for‐age z‐score; NA, not available; PP, percentage point; WAZ, weight‐for‐age z‐score. *Weight (Wt) and length/height (Lt) refer to the growth outcome shown in parentheses (units: Wt in kg; Lt in cm), which is also the outcome that gave the largest effect size in studies that reported more than one weight or length outcome. †Means or percentages are significantly different (P < 0.05). ‡Significant difference observed only in children <15 months of age and WAZ <−2 or LAZ −2 at baseline (intervention, n = 16; control, n = 19). §Marginally significant (P = 0.08). ¶Significant difference observed only in a children <6 months of age at baseline. **The decrease in prevalence from baseline was significantly lower (P = 0.042) in the intervention community (28.1% to 24.0%) than in the control community (34.1% to 22.7%).
There was a positive impact on weight in both studies. In India, intervention children gained 0.25 kg more weight than the control children during the 8‐month intervention (Bhandari et al. 2001), and in Bangladesh there was a 0.30 Z difference between groups in change in WAZ from baseline (Roy et al. 2005). There was no significant effect on linear growth in either study, although in India, there was a non‐significant reduction in the prevalence of stunting (by 6.8 PP), and in Bangladesh, intervention children gained 0.4 cm more in height compared with the control children 6 months after the end of the intervention.
ii. Effects of programmes
Six large‐scale programmes using food supplementation, generally coupled with education, have been evaluated (Table 6). These include the Senegal Community Nutrition Project (CNP) (Gartner et al. 2007), the BINP (Hossain et al. 2005b), the Food and Nutrition Program (PANN) in Ecuador (Lutter et al. 2006), the National Fund of Development and Social Compensation (FONCODES) Project in Peru (López de Romaña 2000), the Mexican Program for Education, Health, and Nutrition (Progresa) (Rivera et al. 2004) and the Community Empowerment and Nutrition Program (CENP) in Vietnam (Schroeder et al. 2002). In Senegal, intervention children (<80% of NCHS median weight‐for‐age) received a flour mix from local ingredients for 6 months, while their mothers received nutrition education. In Bangladesh, children with severe malnutrition or growth failure were given supplementary food, and their mothers were counselled during monthly visits to community nutrition centres. The PANN programme in Ecuador had several components including the distribution of a fortified food (Mi Papilla) and education for families. This was similar to the FONCODES Project in Peru, where children received the fortified Ali Alimentu and mothers were given education mainly in its use. The Mexican Progresa programme provided a micronutrient‐fortified milk‐based food to children, and health services and cash transfers to the family. In Vietnam, the CENP programme included education for all caregivers and intensive feeding for malnourished children.
Four of these six evaluation studies (Schroeder et al. 2002; Hossain et al. 2005b; Lutter et al. 2006; Gartner et al. 2007) reported data on ponderal (weight) growth. In Ecuador (Lutter et al. 2006), the PANN was associated with an increase of 0.23 in WAZ (P = 0.04) compared with the control group and a 9.6 PP decrease (14.5 % vs. 24.1%) in the prevalence of underweight (P = 0.02). In Vietnam (Schroeder et al. 2002), the CENP did not have any significant effect on weight, except in a subsample of children (n = 16, intervention; n = 19, control) who were <15 months old and had WAZ <−2 at baseline; this difference (0.15–0.21 Z) was observed only during the first 4 months of follow‐up. The CNP in Senegal (Gartner et al. 2007) also had no positive impact on weight; in fact, the decrease in the prevalence of underweight was significantly lower (P = 0.042) in the intervention community (28.1% to 24.0%) than in the control community (34.1% to 22.7%). There was no significant effect on weight reported for the BINP programme.
The impact of these interventions on linear growth was rather modest, and was observed primarily in relatively young children. In Vietnam, the CENP had a positive impact on length among younger (<15 months) malnourished children, but not in the total sample. Similarly, in Mexico (Rivera et al. 2004), an effect was observed only among children <6 months of age at baseline (+1.1 cm, P = 0.046 adjusted for initial length). In Ecuador, there was a marginally significant difference in LAZ (−0.32 Z vs. −0.49 Z, P = 0.08) between intervention and control groups. There was no impact on the prevalence of stunting in the FONCODES programme in Peru, the BINP in Bangladesh or the CNP in Senegal.
Summary
In this category of interventions, the average effect sizes for growth were larger for the efficacy trials (average effect sizes: weight 0.49, range 0.32, 0.66; length 0.29, range 0.25, 0.32) than for the programmes (average effect sizes: weight 0.21, range 0.18, 0.24; length 0.09, range 0, 0.14). The smaller effect of the programmes may be attributed to several factors including technical and logistical difficulties that hamper implementation. In Senegal, for example (Gartner et al. 2007), only 45% of the rations intended for beneficiary children actually got distributed. In Bangladesh (Hossain et al. 2005b), coverage of the supplementary feeding component for severely malnourished children was very low (20%). With the two efficacy trials and the six programmes combined, the average effect size for weight was 0.35 (range 0.18, 0.66) and that for linear growth was 0.17 (range 0, 0.32).
4.2.4 Interventions in which complementary foods were fortified with additional micronutrients
i. Efficacy trials
The effect of fortification of complementary foods on growth was tested in six efficacy trials in which there was no difference in the amount of energy provided to intervention and control groups (Table 7). Three of these studies involved home fortification using micronutrient supplements (Sprinkles™ or crushable tablets), from 6 through 12 (Smuts et al. 2005; Adu‐Afarwuah et al. 2007) or 18 months (Giovannini et al. 2006) of age. The other studies used cereal/legume mixes (Lartey et al. 1999; Faber et al. 2005) or a milk formulation (Dhingra et al. 2004) to which the micronutrients were added during processing. In the latter studies, the control groups received unfortified products (Lartey et al. 1999; Dhingra et al. 2004; Faber et al. 2005).
Table 7.
Impact on growth outcomes of interventions in which complementary foods were fortified with additional micronutrients*
| Author | Site | Target group | Study groups | n | Weight | Length/height | % underweight | % stunted |
|---|---|---|---|---|---|---|---|---|
| Efficacy | ||||||||
| Adu‐Afarwuah et al. (2007) | Ghana | 6 months | SP or NT | 200 | −0.71 ± 1.10 | −0.42 ± 1.10 | ||
| No intervention | 96 | −0.74 ± 1.10 | −0.40 ± 1.00 | |||||
| ES: 0.03 (WAZ) | ES: −0.02 (LAZ) | |||||||
| Dhingra et al. (2004) | India | 12–36 months | Milk powder + micronutrients | 289 | 2.13 ± 0.58 † | 0.24 ± 0.45 † | ||
| Milk powder | 281 | 1.92 ± 0.55 | 0.05 ± 0.4 | |||||
| ES: 0.37 (Wt gain) | ES: 0.45 (LAZ change) | |||||||
| Faber et al. (2005) | South Africa | 6–12 months | Food + micronutrients | 145 | 10.7 ± 1.4 | 76.1 ± 3.3 | ||
| Food | 147 | 10.7 ± 1.6 | 75.7 ± 3.8 | |||||
| ES: 0 (Wt) | ES: 0.11 (Lt) | |||||||
| Giovannini et al. (2006) | Cambodia | 6 months | MMN Sprinkles™ | 65 | −1.25 ± 0.79 ‡ | −1.56 ± 1.0 § | ||
| Placebo | 62 | −1.08 ± 0.79 ‡ | −1.63 ± 1.0 § | |||||
| ES: −0.22 (WAZ) | ES: 0.07 (LAZ) | |||||||
| Lartey et al. (1999) | Ghana | 6 months | Fortified cereal/legume | 47 | 1.3 ± 0.5 | 7.0 ± 1.4 | ||
| Cereal/legume/fish | 143 | 1.2 ± 0.5 | 6.9 ± 1.2 | |||||
| ES: 0.20 (Wt gain) | ES: 0.08 (Lt gain) | |||||||
| Smuts et al. (2005) | South Africa | 6–12 months | Daily MMN foodlet | 49 | −0.25 ± 0.84 | −1.11 ± 0.98 | ||
| Placebo | 50 | −0.5 ± 0.91 | −1.16 ± 0.94 | |||||
| ES: 0.29 (WAZ change) | ES: 0.05 (LAZ) | |||||||
ES, effect size; LAZ, length‐for‐age z‐score; MMN, multiple micronutrients; SP or NT, Sprinkles or Nutritabs; WAZ, weight‐for‐age z‐score. *Weight (Wt) and length/height (Lt) refer to the growth outcome shown in parentheses (units: Wt in kg; Lt in cm), which is also the outcome that gave the largest effect size in studies that reported more than one weight or length outcome. Italicized SD values are estimates. †Means are significantly different (P < 0.05). ‡SD values are estimates from subjects of similar age from Vietnam (Schroeder et al. 2002). §SD values are estimates assuming that LAZ has N(0, 1) distribution.
In the milk‐fortification study in India (Dhingra et al. 2004), intervention children gained significantly more weight (by 0.21 kg, 95% CI 0.12, 0.31 kg) and had greater WAZ (by 0.24 Z, 95% CI 0.11, 0.36 Z) and WLZ (mean difference 0.16 Z, 95% CI 0.03, 0.30 Z) at the end of 12 months of supplementation, compared with the control group. In the other five efficacy trials (Lartey et al. 1999; Faber et al. 2005; Smuts et al. 2005; Giovannini et al. 2006; Adu‐Afarwuah et al. 2007), fortification of complementary foods had no significant effect on weight.
Similar results were reported for linear growth: only in India (Dhingra et al. 2004) was there a significant impact of fortification. In that study, intervention children had greater mean length gain (8.6 ± 1.14 vs. 8.1 ± 1.37 cm, P < 0.05) and LAZ (by 0.19 Z, 95% CI 0.12, 0.26) at the end of study, compared with the control group.
We found no evaluations of large‐scale fortification programmes that reported growth outcomes.
Summary
Only one out of six efficacy studies conducted in four countries reported a significant impact of home or commercial fortification of complementary foods on growth. Based on these six trials, the average effect size of micronutrient fortification was 0.11 (range −0.22, 0.37) for weight and 0.12 (range −0.02, 0.45) for length.
4.2.5 Interventions to increase energy density of complementary foods
i. Efficacy trials
We found five efficacy trials in which the effect of efforts to increase the energy density of a complementary food on the growth of infants was tested (Table 8). In Bangladesh (Hossain et al. 2005a), severely malnourished children (weight‐for‐age <60% of NCHS median) received a cereal/legume/oil blend containing amylase‐rich flour from germinated wheat 6 days week−1 for 1.5 months. In India (John & Gopaldas 1993), the food given was a wheat gruel with industrial amylase that was consumed ad lib once daily for 6 months. Similar types of cereal/legume blends containing industrial amylase were provided to infants in Congo (Moursi et al. 2003) for 4.5 months and in Zambia (Owino et al. 2007) for 3 months, but in Tanzania (Mamiro et al. 2004) the increased energy density of the mainly cereal/legume blend was achieved though traditional methods of soaking, germination and roasting. In each of these studies, the control group received the same type of food but without the added amylase or processing.
Table 8.
Impact on growth outcomes of interventions to increase energy density of complementary foods*
| Author | Site | Target group | Study groups | n | Weight | Length/height | % underweight | % stunted |
|---|---|---|---|---|---|---|---|---|
| Efficacy | ||||||||
| Hossain et al. (2005a) | Bangladesh | 6–24 months | Food + ARF | 65 | 0.5 ± 0.34 | 0.82 ± 0.98 | ||
| Food | 35 | 0.4 ± 0.47 | 0.57 ± 0.58 | |||||
| ES: 0.25 (Wt gain) | ES: 0.32 (Lt gain) | |||||||
| John & Gopaldas (1993) | India | 6–24 months | Food + amylase | 21 | 2.1 ± 0.7 † | 6.1 ± 2.8 † | ||
| Food | 21 | 1.0 ± 0.9 | 4.5 ± 1.8 | |||||
| ES: 1.37 (Wt gain) | ES: 0.71 (Lt gain) | |||||||
| Mamiro et al. (2004) | Tanzania | 6 months | Processed food | 133 | −2.08 ± 1.02 | |||
| Unprocessed food | 125 | −2.04 ± 1.07 | ||||||
| ES: −0.04 (LAZ) | ||||||||
| Moursi et al. (2003) | Congo | 4.5 months | Food + amylase | 37 | 0.36 ± 0.14 | 1.85 ± 0.42 ‡ | ||
| Food | 38 | 0.38 ± 0.17 | 1.68 ± 0.43 | |||||
| ES: −0.13 (Wt velocity) | ES: 0.40 (Lt velocity) | |||||||
| Owino et al. (2007) | Zambia | 5 months | Fortified food + amylase | 44 | 8.9 ± 1.4 | 71.3 ± 1.5 | ||
| Fortified food | 69 | 9.0 ± 1.5 | 71.8 ± 2.5 | |||||
| ES: −0.07 (Wt) | ES: −0.25 (Lt) | |||||||
ARF, amylase‐rich flour; ES, effect size; LAZ, length‐for‐age z‐score. *Weight (Wt) and length/height (Lt) refer to the growth outcome shown in parentheses (units: Wt in kg; Lt in cm), which is also the outcome that gave the largest effect size in studies that reported more than one weight or length outcome. †Means are significantly different (P < 0.05). ‡Means are significantly different (P = 0.04) by 0.22 cm month−1 (95% confidence interval 0.02, 0.43) after adjustment for initial length and morbidity during the intervention.
In India (John & Gopaldas 1993), children who received the high‐energy, low‐bulk diet with amylase gained more weight (+1.1 kg, P < 0.001) and length (+1.6 cm, P < 0.05) after 6 months of follow‐up than the control children. In Congo, intervention children did not differ significantly in weight velocity (kg month−1) from the controls (0.36 ± 0.14 intervention vs. 0.38 ± 0.17 control), but they gained an additional 0.22 cm month−1 (95% CI 0.02, 0.43) in length compared with the control children (1.88 cm month−1 vs. 1.66 cm month−1, P = 0.04) when adjusting for initial length and morbidity during the intervention. The other three studies did not report any significant effect of this intervention strategy on growth.
We did not find any reports of large‐scale programmes that have used this intervention strategy.
Summary
Of five efficacy trials in five different countries that used strategies to increase energy density as the only intervention, only two had an impact on growth. Based on all five trials, the average effect sizes were 0.35 (range −0.13, 1.37) for weight and 0.23 (range −0.25, 0.71) for linear growth.
4.3 Morbidity outcomes
4.3.1 Interventions using educational approaches
i. Efficacy trials
Morbidity data were reported in three efficacy trials, from Brazil (Vitolo et al. 2005), Bangladesh (Roy et al. 2005) and India (Bhandari et al. 2001). Table 9 shows that in Brazil, the intervention was associated with a 13.6 PP decrease (28.4% vs. 42.0%, P = 0.006) in the percentage of children who experienced diarrhoea and a 15.2 PP decrease (25.8% vs. 41.0%, P = 0.002) in the percentage who experienced respiratory infection during the first year of life. The study in Bangladesh did not show any impact on morbidity at the end of follow‐up, although the incidence (per 100 child months) of diarrhoea, URI and fever were actually higher in the intervention group during the first 2 months of follow‐up than in the control group. In India, education alone did not affect morbidity.
Table 9.
Impact on morbidity outcomes of interventions using educational approaches
| Author | Site | Target group | Study group | n | % diarrhoea | % URI | % LRI | % fever | Inc. of diarrhoea | Inc. of URI | Inc. of LRI | Inc. of fever |
|---|---|---|---|---|---|---|---|---|---|---|---|---|
| Efficacy trials | ||||||||||||
| Bhandari et al. (2001)* | India | 4 months | Education | 97 | 8.8 | 6.9 | 0.74 | 5.6 | ||||
| Visitation | 91 | 8.8 | 6.7 | 0.88 | 5.6 | |||||||
| Diff: 0 PP | Diff: +2.99% | Diff: −15.9% | Diff: 0 % | |||||||||
| Roy et al. (2005) † | Bangladesh | 6–24 months | Education | 93 | 11 ¶ | 2 ¶ | 26 ¶ | |||||
| No intervention | 90 | 10 | 3 | 19 | ||||||||
| Diff: 10% | Diff: −33.3% | Diff: +36.8% | ||||||||||
| Vitolo et al. (2005) ‡ | Brazil | Newborn | Education | 163 | 28.4 § | 25.8 § | ||||||
| No intervention | 234 | 42.0 | 41.0 | |||||||||
| Diff: −13.6 PP | Diff: 15.2 PP | |||||||||||
Diff, difference; Inc., incidence; LRI, lower respiratory infection; PP, percentage point; URI, upper respiratory infection. *Prevalence of fever is per cent of surveillance days with fever. Incidence values are number of episodes per child during follow‐up. †Incidence values are number of new episodes per 100 days at risk. ‡Prevalence vales are the percentages of children showing at least one episode of illness during the 12‐month surveillance period. §Percentages are significantly different (P < 0.05) between intervention and control groups. ¶Significant difference observed during part of follow‐up period.
None of the evaluation reports of programmes using educational approaches (Maluccio & Flores 2004; Kilaru et al. 2005; Guyon et al. 2006) reported data on morbidity.
4.3.2 Interventions in which provision of complementary food was the only treatment
i. Efficacy trials
Only one efficacy trial in this category (Adu‐Afarwuah et al. 2007) reported data on morbidity for both intervention and control groups (Table 10). In that study, the prevalence (% of children with illness) of infectious illnesses during the week prior to the last (12 months) interview was compared among groups. Prevalence values ranged from 2.1% for URI in the intervention group to 7.1% for diarrhoea in the control group, and the fortified spread‐supplemented children did not differ significantly in the prevalence of these illnesses, compared with the non‐intervention group.
Table 10.
Impact on morbidity outcomes of interventions in which provision of complementary food was the only treatment
| Author | Site | Target group | Study group | n | % diarrhoea | % URI | % LRI | % fever | Inc. of diarrhoea | Inc. of URI | Inc. of LRI | Inc. of fever |
|---|---|---|---|---|---|---|---|---|---|---|---|---|
| Efficacy trials | ||||||||||||
| Adu‐Afarwuah et al. (2007)* | Ghana | 6 months | Fortified spread | 98 | 6.2 | 2.1 | 3.1 | |||||
| No intervention | 96 | 7.1 | 5.7 | 5.7 | ||||||||
| Diff: −0.9 PP | Diff: −3.6 PP | Diff: −2.6 PP | ||||||||||
Diff, difference; Inc., incidence; LRI, lower respiratory infection; PP, percentage point; URI, upper respiratory infection. *Values are percentages of children with illness.
There was only one programme evaluation in this category (Santos et al. 2005), and it did not include data on morbidity.
4.3.3 Interventions in which provision of complementary food was combined with another strategy, usually education for mothers
i. Efficacy trials
The efficacy study in India (Bhandari et al. 2001), in which intervention children received food supplementation and encouragement to eat, and the one in Bangladesh (Roy et al. 2005), in which intervention children received food supplementation and their mothers were given intensive nutrition education, both assessed morbidity (Table 11). In India, the prevalence of fever (per 100 days) was significantly higher in the intervention group (12.7% vs. 8.8%, P < 0.05) compared with the visitation group. Prevalence of dysentery (but not all cases of diarrhoea) was also significantly higher in the intervention group. In Bangladesh, the groups did not differ at the end of the 3‐month intervention period, but during the first 2 months, intervention children had a lower incidence of URI (P < 0.0001), and a higher incidence of diarrhoea (P < 0.002) and fever (P < 0.002).
Table 11.
Impact on morbidity outcomes of interventions in which provision of complementary food was combined with another strategy, usually education for mothers
| Author | Site | Target group | Study group | n | % diarrhoea | % URI | % LRI | % fever | Inc. of diarrhoea | Inc. of URI | Inc. of LRI | Inc. of fever |
|---|---|---|---|---|---|---|---|---|---|---|---|---|
| Efficacy trials | ||||||||||||
| Bhandari et al. (2001)* | India | 4 months | Fortified food + education | 87 | 12.7 ‡ | 7.1 | 0.79 | 6.3 | ||||
| Visitation | 91 | 8.8 | 6.7 | 0.88 | 5.6 | |||||||
| Diff: 3.9 PP | Diff: +6.0% | Diff: −10.2% | Diff: +12.5% | |||||||||
| Roy et al. (2005) † | Bangladesh | 6–24 months | Food + education | 99 | 11 § | 2 § | 31 § | |||||
| No intervention | 90 | 10 | 3 | 19 | ||||||||
| Diff: +10.0% | Diff: −33.3% | Diff: +63.1% | ||||||||||
| Programmes | ||||||||||||
| Schroeder et al. (2002) | Vietnam | 5–25 months | Food + education | 114 | 2 | 44 ‡ | ||||||
| No intervention | 118 | 2 | 54 | |||||||||
| Diff: 0 PP | Diff: −10 PP | |||||||||||
Diff, difference; Inc., incidence; LRI, lower respiratory infection; PP, percentage point; URI, upper respiratory infection. *Incidence values are number of episodes per child during follow‐up. †Incidence values are number new episodes per 100 days at risk. ‡Percentages are significantly different (P < 0.05) between intervention and control groups. §Significant difference observed during the first 2 months of the study.
ii. Effectiveness studies/programme reports
As shown in the second section of Table 11, only one programme evaluation in this category reported data on morbidity (Schroeder et al. 2002). This intervention in Vietnam was associated with a 10.0 PP decrease in the prevalence of respiratory illness (44% vs. 54%), and in a multivariate analysis, the intervention reduced the odds of having a respiratory illness in the past 14 days by 50% (adjusted odds ratio = 0.5, 95% CI 0.4–0.7; P < 0.0001) during months 2–6 of the intervention period, when controlling for age at baseline, gender and location of residence.
4.3.4 Interventions in which complementary foods were fortified with additional micronutrients
i. Efficacy trials
Five efficacy studies in this category (Lartey et al. 1999; Smuts et al. 2005; Sharieff et al. 2006; Sazawal et al. 2007; Adu‐Afarwuah et al. 2007) evaluated the impact on morbidity (Table 12). In three of these (Lartey et al. 1999; Smuts et al. 2005; Adu‐Afarwuah et al. 2007) fortification had no significant impact on morbidity. However, in the study conducted in India (Sazawal et al. 2007) micronutrient fortification of milk was associated with an 18% (OR = 0.82, 95% CI 0.77, 0.89) lower incidence of diarrhoea, a 26% lower incidence of acute lower respiratory illness (OR = 0.74, 95% CI 0.62, 0.89) and a 15% lower incidence of severe illness including fever (OR = 0.85, 95% CI 0.76, 0.96) compared with the group receiving unfortified milk. In Pakistan (Sharieff et al. 2006), infants 6–12 months of age at high risk for diarrhoea who consumed home‐made complementary foods mixed with micronutrient Sprinkles™ for 2 months had a significantly lower prevalence (% of study days with illness) of diarrhoea, by 11.0 PP (P = 0.009), and a lower incidence (day per child) of fever (1.2 vs. 3.2, P = 0.004) compared with those not receiving Sprinkles™.
Table 12.
Impact on morbidity outcomes of interventions in which complementary foods were fortified with additional micronutrients
| Author | Site | Target group | Study group | n | % diarrhoea | % URI | % LRI | % fever | Inc. of diarrhoea | Inc. of URI | Inc. of LRI | Inc. of fever |
|---|---|---|---|---|---|---|---|---|---|---|---|---|
| Efficacy trials | ||||||||||||
| Adu‐Afarwuah et al. (2007)* | Ghana | 6 months | SP or NT | 200 | 6.7 | 5.1 | 4.5 | |||||
| No intervention | 96 | 7.1 | 5.7 | 5.7 | ||||||||
| Diff: −0.4 PP | Diff: −0.6 PP | Diff: −1.2 PP | ||||||||||
| Sazawal et al. (2007) † | India | 12–36 months | Micronutrients + milk powder | 289 | 0.82** | 0.74** | 0.85** | |||||
| Milk powder | 281 | 1.00 | 1.00 | 1.00 | ||||||||
| Diff: −18% | Diff: −26% | Diff: −15% | ||||||||||
| Lartey et al. (1999) ‡ , § | Ghana | 6 months | Fortified cereal/legume | 47 | 17.9 | 17.4 | 9.0 | 7.8 | 3.1 | 2.5 | ||
| Cereal/legume/fish | 143 | 14.7 | 16.7 | 8.1 | 7.2 | 3.0 | 2.4 | |||||
| Diff: +3.2 PP | Diff: +0.7 PP | Diff: +0.9 PP | Diff: +8.3% | Diff: +3.3% | Diff: +4.2% | |||||||
| Sharieff et al. (2006) ‡ , ¶ | Pakistan | 6–12 months | Sprinkles™ | 22 | 15** | 1.2** | ||||||
| Placebo | 21 | 26 | 3.2 | |||||||||
| Diff: −11.0 PP | Diff: −62.5% | |||||||||||
| Smuts et al. (2005) θ | South Africa | 6–12 months | Daily MMN foodlet | 49 | 22.7 | 6.8 | 10.6 | |||||
| Placebo | 50 | 20.9 | 9 | 13.4 | ||||||||
| Diff: +1.8 PP | Diff: −2.2 PP | Diff: −2.8 PP | ||||||||||
Diff, difference; Inc., incidence; LRI, lower respiratory infection; MMN, multiple micronutrients; PP, percentage point; SP or NT, Sprinkles or nutritabs; URI, upper respiratory infection. *Values are percentages of children with illness. **Significant difference between intervention and control groups (P < 0.05). †Morbidity values are odds ratios. ‡Prevalence values are percentage of surveillance days ill. §Incidence values are number of new episodes per child 100 days at risk. ¶Incidence values are number of new episodes per child during follow‐up. θValues are percentage of child contacts with illness.
There have been evaluation reports on two large‐scale programmes in Haiti (Menon et al. 2007) and Mongolia (WVM 2005) in which home‐prepared complementary foods were fortified with multiple micronutrient Sprinkles™, but these reports did not include data on morbidity.
4.3.5 Interventions to increase energy density of complementary foods
i. Efficacy trials
In Congo (Moursi et al. 2003), the prevalence (percentage of days with illness) of cough (28.% vs. 19.0%) and rhinitis (27.6% vs. 19.0%) was significantly greater (P < 0.05) in the intervention group than in the control group and so was the incidence (new episodes per 100 days at risk) of the two symptoms (cough: 1.9 vs. 1.4; rhinitis: 2.0 vs. 1.4) (Table 13). The groups did not differ with respect to rates of diarrhoea or fever. None of the other studies in this category reported data on morbidity.
Table 13.
Impact on morbidity outcomes of interventions to increase energy density of complementary foods
| Author | Site | Target group | Study group | n | % diarrhoea | % URI | % LRI | % fever | Inc. of diarrhoea | Inc. of URI | Inc. of LRI | Inc. of fever |
|---|---|---|---|---|---|---|---|---|---|---|---|---|
| Efficacy trials | ||||||||||||
| Moursi et al. (2003)* | Congo | 4.5 months | Food + amylase | 37 | 27.6† | 0.4 | 2.0† | 1.3 | ||||
| Food | 38 | 19.0 | 0.4 | 1.4 | 1.0 | |||||||
| Diff: 8.6 PP | Diff: 0% | Diff: 42.9% | Diff: 30.0% | |||||||||
Diff, difference; Inc., incidence; LRI, lower respiratory infection; PP, percentage point; URI, upper respiratory infection. *Incidence values are number new episodes per 100 days at risk. URI is specifically rhinitis.
As mentioned previously, we did not find any large‐scale programme that used this strategy.
Summary of interventions and morbidity
Data on the impact of complementary feeding interventions on morbidity are scanty and inconsistent. Of the 42 papers reviewed, only 10 presented results on morbidity. In most of these, there were no significant effects on morbidity. Most of these studies included morbidity as a secondary outcome and were not designed or powered to detect differences in morbidity. In four studies (Schroeder et al. 2002; Vitolo et al. 2005; Sharieff et al. 2006; Sazawal et al. 2007) the intervention was associated with reduced morbidity, but in three studies the interventions were associated with increased symptoms of morbidity. This was evident in Bangladesh during the first 2 months of the intervention (Roy et al. 2005), in India (Bhandari et al. 2001) and in Congo (Moursi et al. 2003). In India, the adverse effects on fever and dysentery associated with food supplementation could have been due to the reduction in breastfeeding that occurred in the intervention group. In this study, food supplementation began at 4 months of age and the amounts provided were large relative to energy needed from complementary foods, which probably contributed to the decreased prevalence and frequency of breastfeeding. Although children in the Bangladesh study (Roy et al. 2005) were older (6–24 months) at the beginning of the intervention, it is possible that a similar displacement of breastmilk by increased energy intake induced by the intervention contributed to the transient increase in morbidity. In Congo (Moursi et al. 2003), breastfeeding practices did not differ between groups, despite the increased energy intake from complementary foods because of the intervention. However, another potential explanation in all three studies is that microbial contamination of the complementary foods (consumed in greater amounts than in the comparison groups) may have contributed to increased morbidity regardless of the impact on breastfeeding. The impact of complementary feeding interventions on morbidity requires further study.
4.4 Child development
Child development outcomes were not reported for any of the educational interventions (with or without other strategies) or for those designed to increase energy density of complementary foods. Thus, the sections below deal with only two of the five categories of interventions.
4.4.1 Interventions in which provision of complementary food was the only treatment
Table 14 presents the results of the impact of three efficacy trials in this category on developmental outcomes. In the study by Adu‐Afarwuah et al. (2007) in Ghana, the proportion of children who were able to stand or walk independently by 12 months of age was compared between the four groups (two of which are relevant to this intervention strategy: the group receiving the fortified spread and the non‐intervention group). The groups did not differ in the ability to stand independently, but 49% of infants receiving the fortified spread were able to walk independently compared with only 25% in the non‐intervention group (P = 0.01). In South Africa, where infants received fortified or unfortified cereal from 6 to 12 months of age, the level of mental and motor development was observed by research assistants using an instrument based on the Denver Development Screening Test (Oelofse et al. 2003). At 12 months, test scores (calculated by expressing the number of positive observations as a percentage of the maximum possible observations) did not differ significantly in the intervention (83.0 ± 10.9) and control (88.2 ± 9.0) groups. In the Indonesia study (Beckett et al. 2000) in which poorly nourished children 12 or 18 months of age received high‐ or low‐energy milk products with micronutrients, the relatively short 18‐month‐olds who received the high‐energy diet over 1 year had higher mental test performance (based on the 1969 version of the Bayley Scales of Infant Development), compared with their counterparts who received the low‐energy diet (Pollitt et al. 2002).
Table 14.
Impact on developmental outcomes of interventions in which provision of complementary food was the only treatment
| Author | Site | Target group | Developmental outcome measured | Study groups | n | Group mean |
|---|---|---|---|---|---|---|
| Efficacy trials | ||||||
| Adu‐Afarwuah et al. (2007) | Ghana | 6 months | % of children able to walk independently by 12 months of age | Fortified spread | 98 | 49%* |
| No intervention | 96 | 25% | ||||
| Diff: 24.0 PP | ||||||
| Oelofse et al. (2003) | South Africa | 6 months | Denver Development Screening Test score | Fortified food | 16 | 83.0 ± 10.9 |
| No intervention | 14 | 88.2 ± 9.0 | ||||
| Diff: −6.2% | ||||||
| Beckett et al. (2000) | Indonesia | 12 and 18 months | Mean (±SD) slope for Bayley mental ANCOVA models | High energy + micronutrients | 11 | 6.13 ± 0.98*, † |
| Low energy + micronutrients | 12 | 4.68 ± 1.41 † | ||||
| Diff: +31.0% | ||||||
Diff, difference; PP, percentage point; ANCOVA, analysis of co‐variance. *Means are significantly different (P < 0.05). †Values are slopes for children 18 months of age at baseline with LAZ lower than the median for the cohort‐treatment groups, because of a significant cohort × length category × treatment interaction (P = 0.008).
These are the only studies in this category of interventions that reported data on child development.
4.4.2 Interventions in which complementary foods were fortified with additional micronutrients
In the Ghana study (Table 15), children who received the Sprinkles™ or the crushable tablets (Nutritabs) were more likely to be able to walk independently by 12 months (37%) than children in the non‐intervention group (25%, P = 0.04) (Adu‐Afarwuah et al. 2007). In India, the impact of the fortified milk intervention on child development was assessed using the Bayley Scales of Infant Development, Behavior Rating Scale and Language questionnaire (Dhingra et al. 2004). There were no significant differences between groups receiving fortified vs. unfortified milk, except that improvement in subset orientation was greater in the intervention group (by 0.9, P = 0.005) at the end of the first half of the study.
Table 15.
Impact on developmental outcomes of interventions in which complementary foods were fortified with additional micronutrients
| Author | Site | Target group | Developmental outcome measured | Study groups | n | Group mean |
|---|---|---|---|---|---|---|
| Efficacy trials | ||||||
| Adu‐Afarwuah et al. (2007) | Ghana | 6 months | % of children able to walk independently by 12 months of age | Micronutrients | 188 | 37%* |
| No micronutrients | 88 | 25% | ||||
| Diff: 12 PP | ||||||
| Dhingra et al. (2004) † | India | 12–36 months | Subset orientation score | Micronutrients + milk powder | 316 | NA |
| Milk powder | 317 | NA | ||||
Diff, difference; NA, not available; PP, percentage point. *Means are significantly different (P < 0.05). †Only the difference in mean subset orientation scores (0.9) was reported, which was significantly greater (P = 0.005) in the intervention group.
Summary of interventions and child development
In all, only four efficacy studies presented data on behavioural development, with no data coming from any effectiveness study or programme report. The provision of a fat‐based fortified food product or micronutrients alone improved gross motor development in Ghana (Adu‐Afarwuah et al. 2007) but these types of interventions did not have any significant effect on developmental outcomes in South Africa (Oelofse et al. 2003) or India (Dhingra et al. 2004). Positive results of supplementation with extra energy in Indonesia were seen only in a subgroup (Pollitt et al. 2002). Future studies should include assessment of cognitive, psychosocial and motor development to the extent possible.
4.5 Micronutrient intake
4.5.1 Intervention studies using educational approaches
i. Efficacy trials
There were four efficacy trials, conducted in four countries, in which the impact of nutrition education of mothers on the micronutrient intake of their children was evaluated (Table 16). In Malawi (Hotz & Gibson 2005), mothers received four locally adapted lessons on complementary feeding practices, which emphasized increased food intake, energy and nutrient density of the complementary diet, and iron and zinc bioavailability of the complementary diet. In India, flip charts, information leaflets and video clips were used to provide education on child feeding practices and on improving food and iron intakes (Kapur et al. 2003). In Peru (Penny et al. 2005), trained staff in health facilities assisted in delivering key educational messages on complementary feeding to mothers. A similar approach was adopted in Brazil (Santos et al. 2001). In these studies, Fe and Zn intakes were determined using 24 h recall (Kapur et al. 2003; Hotz & Gibson 2005; Penny et al. 2005) or a 12 h weighed food intake record (Santos et al. 2001) but no data on vitamin A intakes were reported.
Table 16.
Impact on micronutrient intakes of interventions using educational approaches*
| Author | Site | Target group | Study groups | n | Fe intake (mg day−1) | Zn intake (mg day−1) | Vitamin A intake |
|---|---|---|---|---|---|---|---|
| Efficacy trials | |||||||
| Hotz & Gibson (2005) | Malawi | 9–23 months | Education | 71 | 4.0 † | 2.3 † | |
| No intervention | 40 | 2.5 | 1.5 | ||||
| Diff: +60% | Diff: +53.3% | ||||||
| Kapur et al. (2003) | India | 9–36 months | Education | 81 | 7.4 † | ||
| Placebo | 64 | 5.9 | |||||
| Diff: +25.4% | |||||||
| Penny et al. (2005) | Peru | Newborn | Education | 171 | 6.3 ‡ | 4.4 † | |
| No intervention | 167 | 5.4 | 3.8 | ||||
| Diff: +16.7% | Diff: +15.8% | ||||||
| Santos et al. (2001) | Brazil | <18 months | Education | 34 | 2.6 ± 1.8 | 4.6 ± 2.6 | |
| No intervention | 32 | 2.8 ± 2.4 | 4.2 ± 2.6 | ||||
| Diff: −7.1% | Diff: +9.5% | ||||||
Diff, difference. *SD values were not available for all studies. We did not estimate unreported SD values because of the wide range in intakes across different populations. †Means are significantly different (P < 0.05). ‡Difference became non‐significant (P > 0.05) after adjustment for socio‐economic variables.
In Malawi, Fe and Zn intakes from complementary foods increased significantly (P < 0.001) in the intervention group, by 1.5 mg (60%) and 0.8 mg (53%), respectively, compared with the control group (Hotz & Gibson 2005). In India, Fe intake increased by 25% (1.5 mg) (P < 0.05) in the intervention group vs. the placebo group (Kapur et al. 2003). In Peru, Fe intake was greater in the intervention group (6.3 mg vs. 5.4 mg; 17%) at 18 months (as well as at 8 and 9 months) of age, but these differences became non‐significant after adjustment for household socio‐economic variables. Zn intake was greater in the intervention group (2.3 mg vs. 1.9 mg; P = 0.014) at 9 months of age, and the difference remained significant (P = 0.035) even after controlling for parents' educational levels. In contrast, nutrition education did not affect Fe or Zn intake in Brazil (Santos et al. 2001).
We found no evaluations of large‐scale educational intervention programmes in which micronutrient intakes were assessed.
4.5.2 Interventions in which provision of complementary food was the only treatment
Only one study in this category, the evaluation of the Milk Supplement Program in Brazil (Santos et al. 2005), reported micronutrient (Fe, Zn and vitamin A) intakes for both intervention and control groups (Table 17). In that study, the total Fe, Zn and vitamin A intakes from complementary foods were not significantly different in the intervention group, despite the fact that the milk product provided an additional 0.56 mg of Fe, 4 mg of Zn and 336 mg of retinol per day. The lack of a positive impact was attributed to irregular distribution of the food, the food being diverted from the target child within the family and low maternal compliance.
Table 17.
Impact on micronutrient intakes of interventions in which provision of complementary food was the only treatment
| Author | Site | Target group | Study groups | Fe intake (mg day−1) | Zn intake (mg day−1) | Vitamin A intake (mg day−1) | |
|---|---|---|---|---|---|---|---|
| Programme | |||||||
| Santos et al. (2005) | Brazil | 6–23 months | Food supplement | 91 | 2.8 ± 2.1 | 3.1 ± 2.1 | 301 ± 341 |
| No intervention | 81 | 3.3 ± 2.4 | 3.6 ± 2.7 | 318 ± 274 | |||
| Diff: −13.5% | Diff: −15.4% | Diff: −5.4% | |||||
Diff, difference.
4.5.3 Interventions in which provision of complementary food was combined with another strategy, usually education for mothers
In this category of interventions, only the evaluation of the PANN programme in Ecuador (Lutter et al. 2006) reported micronutrient intakes (Table 18). In that study, the provision of Mi Papilla[Fe 10 mg, Zn 10 mg, vitamin A 127 µg retinol equivalents (RE) per 100 g of dry product] increased total Fe intake from complementary foods by 151% (8.8 vs. 3.5 mg), Zn intake by 201% (7.8 vs. 2.6 mg) and vitamin A intake by 107% (367.0 vs. 177.6 µg RE).
Table 18.
Impact on micronutrient intakes of interventions in which provision of complementary food was combined with another strategy, usually education for mothers*
| Author | Site | Target group | Study groups | Fe intake (mg day−1) | Zn intake (mg day−1) | Vitamin A intake (µg RE day−1) | |
|---|---|---|---|---|---|---|---|
| Programme | |||||||
| Lutter et al. (2006) | Ecuador | 6–12 months | Fortified food + education | 49 | 8.8 ± 5.8 † | 7.8 ± 5.6 † | 367 ± 447 † |
| No intervention | 51 | 3.5 ± 2.0 | 2.6 ± 1.8 | 178 ± 219 | |||
| Diff: +151.4% | Diff: +201.2% | Diff: +106.6% | |||||
Diff, difference; RE, ••. †Means are significantly different (P < 0.05).
4.5.4 Interventions in which complementary foods were fortified with additional micronutrients
The studies in Ghana (Lartey et al. 1999) and Mexico (Villalpando et al. 2006) are the only ones in this category that reported micronutrient intakes (Table 19). In the Ghana study, intakes were determined by 12 h weighed food intake, and for this analysis, we compared the group that received the fortified cereal/legume blend (Fe 27.5 mg, Zn 12.8, vitamin A 1386 RE per 100 g of dry product) with the groups that received the other foods without added micronutrients. In Mexico, the fortified milk contained 11 mg of Fe (ferrous gluconate), 11 mg of Zn (Zn oxide) and 44.9 µg of retinol palmitate per 100 g of dry powder.
Table 19.
Impact on micronutrient intakes of interventions in which complementary foods were fortified with additional micronutrients
| Author | Site | Target group | Study groups | n | Fe intake (mg day−1) | Zn intake (mg day−1) | Vitamin A intake (µg RE day−1) |
|---|---|---|---|---|---|---|---|
| Efficacy trials | |||||||
| Lartey et al. (1999) | Ghana | 6 months | Fortified cereal/legume | 47 | 16.6 ± 11.0* | 7.8 ± 5.1* | 866* |
| Cereal/legume/fish | 143 | 5.4 ± 3.9 | 2.1 ± 1.4 | 36 | |||
| Diff: +207.4% | Diff: +271.0% | Diff: 2339.0% | |||||
| Villalpando et al. (2006) | Mexico | 10–30 months | Fortified food | 58 | 15.7 ± 13.4* | ||
| Food | 58 | 6.4 ± 5.1 | |||||
| Diff: +145.3% | |||||||
Diff, difference; RE, retinol equivalents. *Means are significantly different (P < 0.05).
In Ghana, fortification significantly increased total Fe intake from complementary foods by more than 200% (16.6 vs. 5.4 mg), Zn intake by almost 300% (7.8 vs. 2.1 mg) and vitamin A intake by nearly 24 times (865.7 vs. 35.5 RE) at 12 months. In Mexico, Fe intake was increased by 145% (15.7 vs. 6.4 mg). The Mexico study did not report Zn or vitamin A intakes. Taking these two efficacy trials together, fortification increased Fe intake from complementary foods by 176% (range 145%, 207%).
4.5.5 Interventions to increase energy density of complementary foods
The Tanzania study (Mamiro et al. 2004) assessed the effect of traditional processing (soaking, germination, roasting) of local complementary foods (cereal/legume blends with mango puree) on Fe intakes of infants (Table 20). The control group received unprocessed food. Data from 24 h dietary recalls showed that the mean Fe intake from complementary foods in the intervention group (6.8 mg day−1) did not differ significantly from that of the control group (6.5 mg day−1), although the porridge prepared with the processed food had greater iron solubility and lower phytate concentration compared with the porridge made from the unprocessed food. This study did not report Zn or vitamin A intake, and it is the only one in this category that reported any data on micronutrient intake.
Table 20.
Impact on micronutrient intakes of interventions using complementary foods with increased energy density
| Author | Site | Target group | Study groups | n | Fe intake (mg day−1) | Zn intake (mg day−1) | Vitamin A intake (µg RE day−1) |
|---|---|---|---|---|---|---|---|
| Efficacy trial | |||||||
| Mamiro et al. (2004) | Tanzania | 6 months | Processed food | 71 | 6.8 ± 2.7 | ||
| Unprocessed food | 66 | 6.5 ± 2.4 | |||||
| Diff: +4.6% | |||||||
Diff, difference; RE, retinol equivalents.
Summary of interventions and micronutrient intakes
Only a few intervention studies reported data on Fe, Zn and vitamin A intakes. Education for mothers significantly increased child Fe intake in Malawi (Hotz & Gibson 2005), India (Kapur et al. 2003) and Peru (Penny et al. 2005), but did not have any significant effect on intakes in Brazil (Santos et al. 2001). Taking those four studies together, the intervention increased Fe intake from complementary foods by 24% (range −7%, 60%) and Zn intake by 26% (range 9%, 53%). In Brazil (Santos et al. 2005) the large‐scale food supplementation programme failed to have an impact on micronutrient intakes. There was also no impact of traditional processing of complementary foods in Tanzania (Mamiro et al. 2004). The largest impact on micronutrient intakes resulted from fortification strategies, which increased Fe intake by 145–207% in Mexico and Ghana (Lartey et al. 1999; Villalpando et al. 2006) , Zn intake by 201–271% in Ecuador and Ghana (Lartey et al. 1999; Lutter et al. 2006) and vitamin A intake by 107% to more than 2300% in Ecuador and Ghana (Lartey et al. 1999; Lutter et al. 2006). Despite some of those increases, mean Fe and Zn intake from complementary foods was still well below recommended intakes in some sites (Kapur et al. 2003; Penny et al. 2005).
4.6 Iron status
4.6.1 Intervention studies using educational approaches
Table 21 shows the results of educational interventions in which Hb or other indicators of iron status were assessed. Kapur et al. (2003) compared the effect of nutrition education emphasizing iron‐rich foods, iron supplementation (20 mg day−1) or education plus iron supplementation with the outcomes for a placebo group among children 9–36 months in India. Mean Hb was higher in all three intervention groups (by 6–8 g L−1), compared with the placebo group, and mean ferritin concentrations were higher in the two groups receiving nutrition education. In China, Guldan et al. (2000) demonstrated that a nutrition education intervention emphasizing daily consumption of egg yolk for infants 4–12 months of age was associated with improved mean Hb (by 4 g L−1) and a lower prevalence of anaemia (22% vs. 32% in the control communities). In contrast, an educational intervention in Brazil (Vitolo et al. 2005) emphasizing ‘Ten steps to healthy eating’ for infants 0–12 months had no impact on rates of anaemia at 12 months, and a large‐scale project in Nicaragua (Maluccio & Flores 2004) that included cash transfers in addition to nutrition counselling (with iron supplements prescribed for some children) also had no impact on rates of anaemia among children 6–59 months of age. The difference in impact across studies could be due to the specificity of the messages regarding enhancement of iron intake in the two former studies, compared with the latter two projects. Overall, for these four studies the average impact was +4 g L−1 Hb and −5 PP in the prevalence of anaemia.
Table 21.
Impact on anaemia and iron status of interventions using educational approaches
| Author | Site | Target group | Study groups | n | Fe dose | Mean Hb (g L−1) | Anaemia (%) | Mean ferritin (µg L−1) | ID (%) |
|---|---|---|---|---|---|---|---|---|---|
| Efficacy trials | |||||||||
| Kapur et al. (2003) | India | 13–40 months | Education | 58 | – | 105 ± (15)* | NA | 5.6* (n = 15) | NA |
| Fe supp | 58 | 20 mg week−1 | 103 ± (16)* | NA | 3.3 (n = 15) | NA | |||
| Education + Fe supp | 58 | 20 mg week−1 | 104 ± (21)* | NA | 5.6* (n = 15) | NA | |||
| Placebo | 58 | – | 97 ± (14) | NA | 3.4 (n = 15) | NA | |||
| Diff: +8.2% (education vs. placebo) | Diff: +64.7% (Education vs. Placebo) | ||||||||
| Vitolo et al. (2005) | Brazil | 0–12 months | Education | 163 | NA | NA | 66.2 | NA | NA |
| No intervention | 234 | NA | NA | 61.8 | NA | NA | |||
| (Hb < 110 g L−1) | |||||||||
| Diff: +4.4 PP | |||||||||
| Programmes | |||||||||
| Guldan et al. (2000) | China | 12 months | Education | 250 | NA | 117 ± (11)* | 22* | NA | NA |
| No intervention | 245 | NA | 113 ± (12) | 32 | NA | NA | |||
| Diff: +3.5% | (Hb < 110 g L−1) | ||||||||
| Diff: −10 PP | |||||||||
| Maluccio & Flores (2004) | Nicaragua | 6–59 | Education (+income) | 448 | NA | 112 ± (NA) | 33 | NA | NA |
| No intervention | 515 | NA | 114 ± (NA) | 31 | NA | NA | |||
| Diff: −1.8% | Diff: +2 PP | ||||||||
Diff, difference; Hb, haemoglobin; ID, iron deficiency; NA, not available; PP, percentage point; supp, supplementation. *Means are significantly different from control (P < 0.05).
4.6.2 Interventions in which complementary food was provided, with or without another strategy such as education for mothers
Table 22 shows data for the five studies in which the target group was provided with a complementary food (as compared with no extra food in the control group). In all five cases, the food provided was fortified with iron. All of these studies were conducted with children <24 months of age. Two relatively small efficacy trials (Oelofse et al. 2003; Owino et al. 2007) were conducted in Africa. In both, fortified complementary food was provided from 6 to 12 months of age. The first (Oelofse et al. 2003) showed a non‐significant increase of +2 g L−1 in Hb, whereas the second (Owino et al. 2007) demonstrated a significant increase of +5–6 g L−1 in Hb and a difference of −15 PP in prevalence of anaemia compared with a non‐randomly selected control group. The other three studies were evaluations of large‐scale programmes in Latin America (López de Romaña 2000; Rivera et al. 2004; Lutter et al. 2006) that included provision of a fortified complementary food. The average impact on Hb was +3 g L−1 in Mexico (Rivera et al. 2004) and +5 g L−1 in Ecuador (Lutter et al. 2006) [mean Hb was not described in the Peru study report (López de Romaña 2000)]. The impact on prevalence of anaemia was −11 PP in Mexico, −16 PP in Ecuador and −8 PP in Peru (−36 PP for the younger subgroup, 6–13 months). Overall, for these five studies the average impact was +4 g L−1 Hb and −13 PP in the prevalence of anaemia.
Table 22.
Impact on anaemia and iron status of interventions using provision of complementary foods (fortified)
| Author | Site | Target group | Study groups | n | Fe dose | Mean Hb (g L−1) | Anaemia (%) | Mean ferritin (µg L−1) | ID (%) |
|---|---|---|---|---|---|---|---|---|---|
| Efficacy trials | |||||||||
| Oelofse et al. (2003) | South Africa | 12 months | Fortified food | 16 | 8 mg day−1 | 108 ± (9) | NA | NA | NA |
| Control | 14 | (8.8 mg day−1) | 106 ± (13) | NA | NA | NA | |||
| Hb < 105 g L−1 | |||||||||
| Owino et al. (2007) | Zambia | 9 months | Fortified food | 37 | 28 mg day−1 (max) | 104 ± (12)* | 62* | NA | NA |
| Fortified food + amylase | 44 | 28 mg day−1 (max) | 103 ± (12)* | 68* | NA | NA | |||
| Control | 69 | – | 98 ± (14) | 77 | NA | NA | |||
| Hb < 110 g L−1 | |||||||||
| Programmes | |||||||||
| Rivera et al. (2004) | Mexico | <12 months | Intervention | 289 | 10 mg day−1 | 111 ± (NA)* | 44* | NA | NA |
| No intervention | 202 | – | 108 ± (NA) | 55 | NA | NA | |||
| Hb < 110 g L−1 | |||||||||
| López de Romaña (2000) | Peru | 6–23 months | Intervention | 62 | 9 mg day−1 | NA | 36 (30 in 6–13 months) | NA | NA |
| Control | 62 | – | 95 | 44 (66 in 6–13 months) | NA | NA | |||
| Hb cut‐off not specified | |||||||||
| Lutter et al. (2006) | Ecuador | 20–26 months | Programme | 74 | 6.5 mg day−1 | 115 ± (9)* | 28* | 15.8 | 30 |
| Control | 80 | – | 110 ± (10) | 44 | 15.8 | 27 | |||
| Hb < 110 g L−1 | |||||||||
Hb, haemoglobin; ID, iron deficiency; max, maximum; NA, not available. *Means are significantly different from control (P < 0.05).
4.6.3 Interventions in which commercially processed complementary foods were fortified with iron or multiple micronutrients
Table 23 shows data for seven efficacy studies in which the target group was provided with a fortified complementary food (intervention) or an unfortified complementary food (control). In four studies the target group was infants <12 months, and in three the target age range extended to 30 or 36 months. The impact on mean Hb ranged from +3 to +14 g L−1, with the largest effect observed in the study in India (Dhingra et al. 2004) where the baseline Hb levels were very low and the intervention lasted for 12 months. The impact on prevalence of anaemia ranged from −4 PP to −39 PP, with the largest impact again observed in India. In that study, the anaemia rate at the end of 12 months was 20% in the intervention group vs. 59% in the control group. The relatively small impact in Chile (−4 PP) can be explained by the low prevalence of anaemia in that population (Walter et al. 1993). In Ghana (Lartey et al. 1999), there was a relatively small impact on anaemia (−4 PP) but a large impact on the prevalence of iron deficiency (−25 PP), which could be explained by other causes of anaemia such as malaria. Four of these seven studies documented the effect of the intervention on the prevalence of iron deficiency (i.e. low ferritin concentration): the impact was −12 PP in Mexico, −16 PP in Pakistan, −31 PP in India and −44 PP in Ghana. Overall, the average effect across all seven studies was +6 g L−1 Hb and −17 PP in the prevalence of anaemia.
Table 23.
Impact on anaemia and iron status of interventions using fortified complementary foods
| Author | Site | Target group | Study groups | n | Fe dose | Mean Hb (g L−1) | Anaemia (%) | Mean ferritin (µg L−1) | ID (%) |
|---|---|---|---|---|---|---|---|---|---|
| Efficacy trials | |||||||||
| Lartey et al. (1999) | Ghana | 12 months | Fortified maize/legume | 47 | 16–21 mg day−1 | 104 ± (17) | 34 | 22.1 | 11* |
| Maize/legume/fish | 48 | – | 103 ± (15) | 35 | 14.9 | 48 | |||
| Maize/fish | 44 | – | 105 ± (13) | 22 | 12.1 | 57 | |||
| Maize/legume | 48 | – | 100 ± (12) | 38 | 14.6 | 55 | |||
| Hb < 100 g L−1 | |||||||||
| Faber et al. (2005) | South Africa | 12–18 months | Fortified maize | 144 | 11 mg day−1 | 119 ± (11)* | 17* | 15.8* | NA |
| Unfortified maize | 142 | – | 110 ± (15) | 42 | 6.5 | NA | |||
| Hb < 110 g L−1 | |||||||||
| Dhingra et al. (2004) | India | 24–48 months | Fortified milk | 233 | 9.6 mg day−1 | 109 ± (11)* | 20* | 18.2* | 11* |
| Unfortified milk | 232 | – | 95 ± (15) | 59 | 10.2 | 42 | |||
| Hb < 100 g L−1 | |||||||||
| Javaid et al. (1991) | Pakistan | 6–12 months | Fortified milk cereal | 57 | 3–5 mg day−1 | 104 ± (11)* | 48 | 13.3 | 45 |
| Unfortified milk cereal | 29 | – | 98 ± (14) | 67 | 8.5 | 61 | |||
| Hb < 100 g L−1 | |||||||||
| Walter et al. (1993) | Chile | 15 months | Fortified rice cereal | 72 | 14 mg day−1 | 124 ± (8)* | 1 | 11 | NA |
| Unfortified rice cereal | 64 | – | 119 ± (8) | 5 | 10 | NA | |||
| Hb < 105 g L−1 | |||||||||
| Schumann et al. (2005) | Guatemala | 14–38 months | Black beans with haem Fe | 30 | 25 mg day−1 | 120 ± (9) | NA | 15.3 | NA |
| Black beans with Fe sulphate | 31 | 25 mg day−1 | 117 ± (11) | NA | 10.1 | NA | |||
| Unfortified black beans | 30 | – | 116 ± (12) | NA | 10.9 | NA | |||
| Villalpando et al. (2006) | Mexico | 16–36 months | Fortified milk | 58 | 5.8 mg day−1 | 127 ± (12)* | 12* | 11.4 | 67% baseline 28% final |
| Unfortified milk | 57 | – | 124 ± (12) | 24 | 11.4 | NA | |||
| Hb < 110 g L−1, adjusted for altitude | |||||||||
Hb, haemoglobin; ID, iron deficiency; NA, not available. *Means are significantly different from control (P < 0.05).
4.6.4 Interventions in which home fortification of complementary foods was the primary intervention
Table 24 shows data for seven home‐fortification studies. Five were efficacy trials and two were evaluations of large‐scale programmes. Three of the efficacy trials included use of Sprinkles™ for 2–12 months (Giovannini et al. 2006; Sharieff et al. 2006; Adu‐Afarwuah et al. in press): the impact on Hb ranged from +4 g L−1 (with 2–6 months of duration) to +9 g L−1 (with 12 months of duration), and the impact on anaemia prevalence ranged from −8 to −21 PP. Two of the efficacy trials included use of a crushable tablet mixed with complementary foods, both for 6 months (Smuts et al. 2005; Adu‐Afarwuah et al. in press): the impact on Hb was +6 g L−1 in both trials and the impact on anaemia prevalence in Ghana was −16 PP (anaemia rates were not presented for the South Africa study). Two efficacy trials evaluated the use of a fat‐based product mixed with complementary foods (Kuusipalo et al. 2006; Adu‐Afarwuah et al. in press): the impact on Hb was +8 g L−1 in Ghana and +8 to +17 g L−1 in Malawi, with a corresponding reduction in anaemia prevalence of −22 PP in Ghana (anaemia rates were not presented for the Malawi study). The effectiveness studies were carried out in Haiti (Menon et al. 2007) and Mongolia (WVM 2005). In the Haiti study, the intervention group received Sprinkles™ in addition to fortified wheat/soy blend, and the control group received only fortified wheat/soy blend. After 2 months, the Sprinkles™ group had higher mean Hb (+5 g L−1) and a lower prevalence of anaemia (28% vs. 45%). Using the ‘double‐difference’ calculation for the impact on anaemia rates (i.e. taking into account the baseline difference in anaemia prevalence between groups), the effect was −32 PP. In Mongolia, Sprinkles™ used in conjunction with an educational intervention were associated with a 22 PP reduction in anaemia rates. Taking all seven studies together, the average effect was +8 g L−1 Hb and −21 PP in the prevalence of anaemia.
Table 24.
Impact on anaemia and iron status of interventions using home fortification of complementary foods (prevention trials)
| Author | Site | Target group | Study groups | n | Fe dose | Mean Hb (g L−1) | Anaemia (%) | Mean ferritin (µg L−1) | ID (%) |
|---|---|---|---|---|---|---|---|---|---|
| Efficacy trials | |||||||||
| Sharieff et al. (2006) | Pakistan | 8–14 months, prior history of diarrhoea | SP with MMN | 13 | 30 mg day−1 | 103 ± (8) | 38 | 48 | 23 |
| SP with MMN + LAB | 12 | 30 mg day−1 | 102 ± (13) | 25 | 50 | 25 | |||
| Placebo SP | 13 | – | 99 ± (12) | 46 | 28 | 30 | |||
| Hb < 100 g L−1 | |||||||||
| Giovannini et al. (2006) | Cambodia | 18 months | SP with MMN | 65 | 12.5 mg day−1 | 108 ± (11)* | 13.8* | 41.6* | 13.8* |
| SP with Fe and folic acid | 64 | 12.5 mg day−1 | 109 ± (12)* | 10.9* | 53.2* | 7.8* | |||
| Placebo SP | 62 | – | 100 ± (10) | 32.3 | 14.1 | 51.6 | |||
| Hb < 100 g L−1 | |||||||||
| Smuts et al. (2005) | South Africa | 12–18 months | Daily MMN | 49 | 10 mg day−1 | 117 ± (11)* | NA | 27.9* | NA |
| Weekly MMN | 46 | 20 mg week−1 | 116 ± (10) | NA | 22.2 | NA | |||
| Daily iron | 49 | 10 mg day−1 | 116 ± (9) | NA | 27.7* | NA | |||
| Placebo | 50 | – | 111 ± (12) | NA | 16.3 | NA | |||
| Adu‐Afarwuah et al. (in press) | Ghana | 12 months | Sprinkles™ | 98 | 12.5 mg day−1 | 110 ± (14) | 18* | 20.8* | 28* |
| Nutritabs | 102 | 9 mg day−1 | 112 ± (14)* | 16* | 19.1* | 23* | |||
| Nutributter | 98 | 9 mg day−1 | 114 ± (14)* | 10* | 23.9* | 26* | |||
| Non‐intervention | 96 | – | 106 ± (14) | 32 | 7.9 | 54 | |||
| Hb < 100 g L−1 | |||||||||
| Kuusipalo et al. (2006) | Malawi | 9–20 months WAZ <‐2 | Milk FS 75 g day−1 | 9 | 11 mg day−1 | +12 ± (13) | NA | NA | NA |
| Milk FS 50 g day−1 | 18 | 11 mg day−1 | +18 ± (12) | NA | NA | NA | |||
| Milk FS 25 g day−1 | 20 | 11 mg day−1 | +11 ± (21) | NA | NA | NA | |||
| Milk FS 5 g day−1 | 13 | 11 mg day−1 | +11 ± (21) | NA | NA | NA | |||
| Soy FS 75 g day−1 | 9 | 13 mg day−1 | +16 ± (14) | NA | NA | NA | |||
| Soy FS 50 g day−1 | 18 | 12 mg day−1 | +16 ± (11) | NA | NA | NA | |||
| Soy FS 25 g day−1 | 20 | 12 mg day−1 | +9 ± (19) | NA | NA | NA | |||
| No supplement | 18 | 0 | +1 ± (20) | NA | NA | NA | |||
| Change in Hb P = 0.06 | |||||||||
| Programmes | |||||||||
| Menon et al. (2007) | Haiti | 11–26 months | Sprinkles™ + WSB | 254 | +12.5 mg day−1 | 105 ± (9)* (2 months) | 52 baseline | NA | NA |
| 28 after 2 months | |||||||||
| 16 after 9 months | |||||||||
| WSB | 161 | – | 100 ± (12) | 37 baseline | NA | NA | |||
| 45 after 2 months | |||||||||
| Hb < 100 g L−1 | |||||||||
| WVM (2005) | Mongolia | 6–36 months | Post‐intervention | 1108 | 40 mg day−1 | NA | 33* | NA | NA |
| Pre‐intervention | 1235 | – | NA | 55 | NA | NA | |||
| Hb < 115 g L−1 | |||||||||
Hb, haemoglobin; ID, iron deficiency; LAZ, length‐for‐age z‐score; MMN, multiple micronutrients; NA, not available; PP, percentage point; SP, Sprinkles; WAZ, weight‐for‐age z‐score; WSB, wheat–soy blend. *Means are significantly different from control (P < 0.05).
4.7 Zinc status
4.7.1 Interventions in which complementary foods were fortified with additional micronutrients, either commercially or with home fortification
Table 25 shows the results of interventions in which plasma zinc concentration (Zn) was assessed. Only five studies reported this outcome, all of which involved evaluation of a fortified complementary food (Lartey et al. 1999; Oelofse et al. 2003; Faber et al. 2005; Lutter et al. 2006), or a home‐fortification product (Smuts et al. 2005). The fortified foods provided 3–6.5 mg day−1 Zn, and the home‐fortification ‘foodlet’ provided 10 mg day−1 (daily multiple micronutrient group) or 20 mg week−1 (weekly multiple micronutrient group). In the four studies using fortified foods, none demonstrated a significant difference between intervention and control groups in mean plasma Zn concentration or the percentage of children with low plasma Zn. In the foodlet intervention trial in South Africa, the group receiving daily micronutrients had significantly higher plasma Zn than the placebo group (Smuts et al. 2005). Overall, these results indicate that complementary foods fortified with multiple micronutrients, including zinc, have little impact on plasma Zn concentration, perhaps because of the relatively low bioavailability of zinc when consumed with cereal‐based or cereal/legume blend foods.
Table 25.
Impact on plasma zinc concentration of complementary feeding interventions
| Author | Site | Target group | Study groups | n | Zn dose (mg) | Mean plasma Zn (µg dL−1) | % low (<70 µg dL−1) |
|---|---|---|---|---|---|---|---|
| Efficacy trials | |||||||
| Lartey et al. (1999) | Ghana | 12 months | Fortified maize/legume | 30 | 6 | 94.2 ± (22.2) | 10.0 |
| Maize/legume/fish | 31 | 0 | 104.0 ± (18.3) | 6.5 | |||
| Maize/fish | 29 | 0 | 102.0 ± (22.2) | 6.9 | |||
| Maize/legume | 31 | 0 | 101.4 ± (28.1) | 3.2 | |||
| Faber et al. (2005) | South Africa | 12–18 months | Fortified maize | 140 | 3 | 69.3 ± (13.7) | NA |
| Unfortified maize | 132 | 0 | 69.3 ± (11.8) | NA | |||
| Smuts et al. (2005) | South Africa | 12–18 months | Daily MMN | 49 | 10 mg day−1 | +6.8 ± (2.2)* | NA |
| Weekly MMN | 46 | 20 mg week−1 | +3.7 ± (2.4) | NA | |||
| Daily iron | 49 | 0 | +0.5 ± (2.2) | NA | |||
| Placebo | 50 | 0 | −2.0 ± (2.8) (change from baseline) | NA | |||
| Oelofse et al. (2003) | South Africa | 12 months | Fortified food | 16 | 5.6 | 85.0 ± (9) | NA |
| Control | 14 | 0 | 73.6 ± (12) | NA | |||
| Programmes | |||||||
| Lutter et al. (2006) | Ecuador | 20–26 months | Programme | 74 | 6.5 mg day−1 | 89.0 ± (26.7) | 23.0 |
| Control | 80 | 0 | 86.3 ± (22.5) | 17.7 | |||
MMN, multiple micronutrients; NA, not available. *Means are significantly different from control (P < 0.05).
4.8 Vitamin A status
4.8.1 Interventions in which complementary foods were fortified with additional micronutrients, either commercially or with home fortification
Table 26 provides information on vitamin A status of children in the seven intervention trials in which this outcome was measured. All of these studies involved evaluation of a fortified complementary food (Lartey et al. 1999; López de Romaña 2000; Oelofse et al. 2003; Faber et al. 2005; Lutter et al. 2006) or home‐fortification products (Zlotkin et al. 2003; Smuts et al. 2005). The amount of vitamin A provided ranged widely, from 83 to 658 µg RE day−1. There was a significant impact on mean serum vitamin A concentration in four of the five interventions using fortified complementary foods (though only in phase 1 of the study by Faber et al.), with differences between intervention and control groups generally ranging from +2 to +7 µg dL−1. The percentage of children with serum vitamin A <20 µg dL−1 in intervention and control groups was 10% vs. 27–34% in Ghana and 7% vs. 15% in Ecuador respectively. In Peru, the percentage of children with serum vitamin A <20 µg dL−1 among intervention communities decreased from 36% to 8%, but there was no significant difference in mean serum concentrations between intervention and control communities at the time of the follow‐up. There was no significant impact on serum vitamin A concentration in the two studies using home‐fortification products (Zlotkin et al. 2003; Smuts et al. 2005), which the investigators attributed to widespread participation in vitamin A supplementation programmes that occurred during the study time period. Taken together, these seven studies indicate that complementary foods fortified with vitamin A can reduce the incidence of vitamin A deficiency (an average of ∼−13 PP in the two studies that reported this), although this impact may be obscured by concurrent vitamin A supplementation programmes.
Table 26.
Impact on plasma vitamin A concentration of complementary feeding interventions
| Author | Site | Target group | Study groups | n | Vitamin A dose (µg RE) | Mean plasma retinol (µg dL−1) | % low (<20 µg dL−1) |
|---|---|---|---|---|---|---|---|
| Efficacy trials | |||||||
| Lartey et al. (1999) | Ghana | 12 months | Fortified maize/legume | 29 | 658 day−1 | 28.0 ± (8.6)* | 10.4* |
| Maize/legume/fish | 34 | 0 | 24.0 ± (11.4) | 34.3 | |||
| Maize/fish | 32 | 0 | 26.3 ± (8.6) | 28.1 | |||
| Maize/legume | 37 | 0 | 26.6 ± (11.4) | 27.0 | |||
| Faber et al. (2005) | South Africa | 12–18 months | Fortified maize | 68 (phase 1) | 500 day−1 | 34.6 ± (10.0)* | NA |
| 71 (phase 2) | 500 day−1 | 22.9 ± (8.6) | NA | ||||
| Unfortified maize | 71 (phase 1) | 0 | 31.5 ± (8.0) | NA | |||
| 64 (phase 2) | 0 | 27.2 ± (7.4) | NA | ||||
| Smuts et al. (2005) | South Africa | 12–18 months | Daily MMN | 49 | 375 day−1 | +1.7 ± (1.1) | NA |
| Weekly MMN | 46 | 750 week−1 | −0.3 ± (1.4) | NA | |||
| Daily iron | 49 | 0 | −1.4 ± (1.4) | NA | |||
| Placebo | 50 | 0 | −0.6 ± (1.4) (change from baseline) | NA | |||
| Oelofse et al. (2003) | South Africa | 18 months | Fortified food | 16 | 360 day−1 | 26.8 ± (6.6)* | NA |
| Control | 14 | 0 | 21.4 ± (5.7) | NA | |||
| Zlotkin et al. (2003) | Ghana | 14–26 months | Sprinkles™ with Fe + vitamin A | 55 | 600 day−1 | 21.2 ± (8.6) | NA |
| Sprinkles™ with Fe | 47 | 0 | 22.3 ± (6.6) | NA | |||
| Programmes | |||||||
| Lutter et al. (2006) | Ecuador | 20–26 months | Programme | 74 | 83 day−1 | 31.0 ± (6.7)* | 6.7 |
| Control | 80 | 0 | 28.4 ± (7.8) | 15.4 | |||
| López de Romaña (2000) | Peru | 6–23 months | Intervention | 60 | 649 day−1 | 28.2 ± (7.0) | 36 baseline 8 final |
| Control | 47 | 0 | 27.7 ± (6.4) | NA | |||
MMN, multiple micronutrients; NA, not available. *Means are significantly different from control (P < 0.05).
5. Discussion
Complementary feeding interventions encompass a wide variety of approaches, including education/counselling about child feeding, food supplementation, fortification or home fortification of complementary foods, and food processing techniques to increase energy density or enhance nutrient quality of prepared complementary foods. Because there is no single, universal package of components in such interventions, it is difficult to generalize about the impact of efforts to improve complementary feeding. Furthermore, there are many different outcomes that can be assessed when evaluating the impact of complementary feeding interventions. Child growth is the most common outcome measured, but it may not be the most sensitive indicator of benefit because of other constraints that limit the extent to which a child's growth (particularly height) can respond to post‐natal interventions. The persistent effects of intrauterine growth retardation may take several generations to overcome (although a successful intervention should improve linear growth to some extent if there is evidence of linear growth faltering during the 6–24 months of age interval at baseline in the target population). For this reason, it is useful to include outcomes such as behavioural development, morbidity and micronutrient status in impact evaluations.
In this review, the interventions were grouped into categories reflecting the primary approach used, and average standardized impact estimates for each outcome were described for each of these categories. The discussion will first summarize the findings for each outcome and then conclude with some general considerations.
5.1 Impact of complementary feeding interventions on growth
The results of interventions in which the primary approach was education about child feeding were mixed. When comparing across studies, it would appear that educational interventions are more likely to have an impact on growth when there is an emphasis on feeding nutrient‐rich animal‐source foods. The two educational interventions with the greatest impact on both weight and length gain (effect sizes of 0.34–0.96) were the projects in Peru (Penny et al. 2005) and China (Guldan et al. 2000). In both of these, a key message was to regularly provide an animal‐source food to the infant (chicken liver, egg or fish in Peru; egg in China). Although other interventions may have included general advice about nutrient‐rich foods, it is possible that the specificity of the messages in the Peru and China projects was more effective. However, it is important to note that in both populations, the advice to provide animal‐source foods was achievable because the recommended foods were available and affordable; this may not be the case in other settings. Milk products were recommended in one of the educational interventions in India (Bhandari et al. 2004), but milk is a poor source of iron and thus the infants' diets may still have been nutritionally incomplete. Nonetheless, it should be noted that there was a significant effect on length gain among the males in that study, who had a significantly greater increase in milk intake (+70%) than seen in the females (+43%). The other educational intervention with a relatively large impact on weight (though not on length) was the study in Bangladesh (which was the only one in this category that targeted children with low weight‐for‐age at baseline) (Roy et al. 2005). That intervention also promoted the home preparation of a complementary food mixture that included egg, meat or fish. The results of these three studies support the conclusion that for optimal growth, infants and young children need complementary foods with a high micronutrient density, especially at 6–12 months.
Interventions in which complementary foods were provided, with or without concurrent strategies such as nutrition education, had a positive impact on growth in many studies, but not all. The variability in results may be at least partially explained by sample size, as the effect sizes were generally in the small to medium range (∼0.3–0.4 for weight, 0.2–0.3 for length). Studies in Africa and South Asia generally showed positive effects, while those in other regions were more variable. This may be related to the relatively high prevalence of food insecurity in Africa and South Asia. In such contexts, providing additional food – not just education – may facilitate the ability of families to follow complementary feeding guidelines. Two studies specifically evaluated whether provision of food plus education was more effective than education alone (Bhandari et al. 2001; Roy et al. 2005). In India (Bhandari et al. 2001), the food plus education group gained 250 g more weight and 0.4 cm more than the control group during the 8‐month intervention, whereas the education‐only group gained only 90 g more than the control group and did not have any advantage in length gain. In Bangladesh (Roy et al. 2005), results for the education‐only group were intermediate between those of the food plus education and control groups. Thus, in these two settings the inclusion of a food supplement was more effective than education alone.
In several studies, the impact of providing a complementary food, in combination with nutrition education, was evident only in the younger children. In Mexico, for example, the Progresa programme had a positive effect on linear growth only in children who were <6 months old at baseline (Rivera et al. 2004), and in Vietnam, an effect was seen only in children <15 months (Schroeder et al. 2002). These results underscore the importance of beginning complementary feeding programmes during infancy, when nutrient needs relative to energy intake are the highest and the ability of the child to respond to a nutritional intervention is the greatest.
In general, effect sizes for interventions providing complementary foods were greater for efficacy trials than for programmes. This is not surprising, given the logistical challenges of ensuring consistent delivery of food (and education) in large‐scale programmes. The efficacy trials all provided a complementary food specifically formulated for infants, whereas some programmes, for example, the Brazilian National Food Supplementation Program for Malnourished Children and Pregnant Women at Risk (Santos et al. 2005), did not provide a complementary food per se but gave eligible families dry milk plus cooking oil. This programme had no impact on child growth, whereas several other programmes in Latin America in which a specially formulated, fortified complementary food was provided (Rivera et al. 2004; Lutter et al. 2006) were more successful. It is unclear whether this is attributable to reduced ‘leakage’ when foods are specifically targeted for children 6–24 months, or to the better match of such (fortified) foods to the nutritional needs at this age, or both.
Because most trials have used fortified foods, it is not possible to determine whether the positive effects on growth are due to greater energy/protein/fat intake, greater micronutrient intake, or the combination. In one of the efficacy trials in Ghana (Adu‐Afarwuah et al. 2007), the effect on weight was partially explained by greater energy intake from complementary foods. However, the effect on length was not explained by greater energy intake and instead was related in path analyses to changes in the plasma fatty acid profiles of the infants who received the fat‐based product (which provided a substantial amount of n‐3 fatty acids). It should be noted, however, that the fat‐based product also included some milk protein, so it is not possible to determine which aspect of its macronutrient content was responsible for the growth effect. There is some evidence that milk products can have a growth‐promoting effect (Hoppe et al. in press), although further research on their importance for complementary feeding is needed.
Although several of the educational and food‐based interventions had positive effects on child growth, the interventions in which micronutrient fortification was the sole component (i.e. comparisons of fortified vs. unfortified complementary foods, or evaluations of home fortification) generally had little or no effect on growth. The exception was the randomized trial in India (Dhingra et al. 2004) in which a milk powder was fortified with multiple micronutrients and was given for 1 year to children with an average age of 23 months and an initial mean HAZ of −2. The group given the fortified milk (n = 233) had significantly less morbidity and greater weight and height gain than the group given unfortified milk (n = 232). Subjects in this trial were older and more stunted at baseline than subjects in the other trials in this category. These characteristics could be associated with a greater risk of zinc deficiency and thus may have increased the likelihood of a positive response to a fortified product containing zinc. Providing zinc in a milk product may have enhanced bioavailability relative to the fortified cereals or cereal/legume blends used in the other studies. This trial was also considerably larger than most of the other studies in this category. All of these differences may explain why an effect on growth was seen in this study and not in the others.
Only two of the five interventions to increase the energy density of complementary foods had a significant impact on growth. In the other three (Mamiro et al. 2004; Hossain et al. 2005a; Owino et al. 2007) there was no increase in energy intake, so the lack of impact on growth is not surprising. In the two studies in which growth was affected, there was a significant impact on both weight and length in India (John & Gopaldas 1993), but only on length in Congo (Moursi et al. 2003). The duration of the intervention was 6 months in India and 3 months in Congo. These results suggest that increasing energy density may be effective under certain circumstances, when the traditional complementary food has a low energy density and infants are unable to adequately compensate by consuming a higher volume or being fed more frequently. Before including this strategy in a complementary feeding programme, it is advisable to first demonstrate that increasing energy density of the traditional food will actually result in increased total daily energy intake (including energy intake from breastmilk). This would indicate that energy intake of children in the target population is being constrained by the low energy density of the traditional food. It should be noted, however, that increasing energy density will not necessarily result in adequate micronutrient intake, so this strategy should be accompanied by other efforts to improve dietary adequacy.
To summarize, the potential for an impact on growth appears to be greater with interventions using key educational messages (overall effect size 0.28 for weight and 0.21 for length), provision of complementary food with or without fortification (alone or in combination with other strategies; effect size 0.26–0.42 for weight and 0.17–0.28 for length, excluding the Nigeria study which is an outlier) and increased energy density of complementary foods (in certain populations; effect size 0.35 for weight and 0.19 for length) than with interventions based on fortification alone (effect size 0.10 for weight and 0.12 for length). 1, 2 compare the effect sizes across each category of intervention. The average effect sizes are in the small to moderate range, which is in agreement with estimates from the previous review of interventions completed between 1970 and 1997 [effect size generally 0.10–0.50 (Caulfield et al. 1999)]. However, when considering only the interventions that were most successful, which gives an indication of the potential impact if programmes are optimally designed and implemented, the overall effect sizes are larger: an average of ∼0.6 for educational interventions (Guldan et al. 2000; Penny et al. 2005) and ∼0.5 for food‐based interventions (Lartey et al. 1999; Bhandari et al. 2001; Roy et al. 2005; Kuusipalo et al. 2006; Gartner et al. 2007; Adu‐Afarwuah et al. 2007; Owino et al. 2007).
Figure 1.
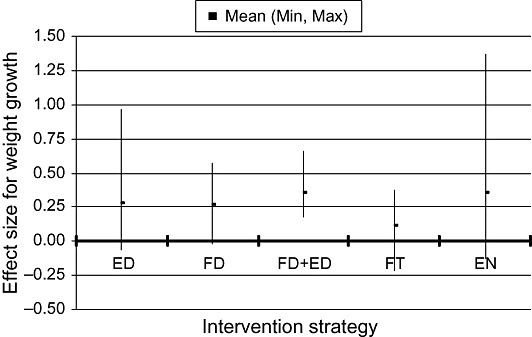
Effect sizes of different intervention strategies for growth in weight. ED = education about child feeding alone; FD = provision of complementary food alone; FD+ED = provision of complementary food plus some other strategy, usually education; FT = Fortification of complementary foods; EN = increased energy density. Each curve shows the mean effect size and range (minimum and maximum). The study by Obatolu (2003) was an outlier (effect size for weight at 18 months = 2.99) and was thus excluded.
Figure 2.
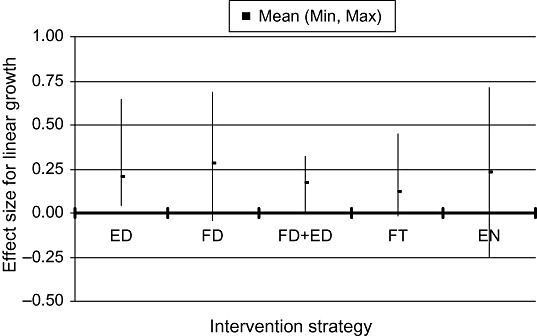
Effect sizes of different intervention strategies for linear growth. ED = education about child feeding alone; FD = provision of complementary food alone; FD+ED = provision of complementary food plus some other strategy, usually education; FT = fortification of complementary foods; EN = increased energy density. Each curve shows the mean effect size and range (minimum and maximum). The study by Obatolu (2003) was an outlier (effect size for length at 18 months = 1.81) and was thus excluded.
5.2 Impact of complementary feeding interventions on morbidity
Only 10 of the intervention studies included data on morbidity outcomes. Two studies showed a beneficial effect of educational interventions: a reduction in diarrhoea in Brazil (Vitolo et al. 2005) and a reduction in URI in Vietnam (Schroeder et al. 2002). The milk‐fortification study in India demonstrated significant effects on both diarrhoea and acute lower respiratory illness (Sazawal et al. 2007), and the Sprinkles™ study in Pakistan showed beneficial effects on diarrhoea and fever (Sharieff et al. 2006). Most of the other studies showed no significant impact, but the sample sizes varied from 21 (Sharieff et al. 2006) to 289 (Sazawal et al. 2007) children per group, and thus many studies were underpowered to detect differences in morbidity rates. There is the potential for adverse effects on morbidity of strategies such as food supplementation (Bhandari et al. 2001; Roy et al. 2005) and increased energy density (Moursi et al. 2003). As mentioned previously, this may be due to excessive displacement of breastmilk and/or unhygienic preparation and storage of complementary foods. This highlights the need to couple complementary feeding interventions with counselling regarding continued breastfeeding, responsive feeding (i.e. feeding only to the point of satiety) and hygienic practices.
5.3 Impact of complementary feeding interventions on child development
Only four of the intervention studies included data on behavioural development. Two studies in which a complementary food supplement was provided showed a positive impact on either gross motor development (Adu‐Afarwuah et al. 2007) or mental development [in a subset of the Indonesian children (Pollitt et al. 2002)], but the other studies did not report any significant effects. It is important to include assessments of behavioural development in evaluations of complementary feeding interventions, as these outcomes may be more sensitive to improvements in child nutrition than outcomes such as growth and morbidity.
5.4 Impact of complementary feeding interventions on micronutrient intake
Educational strategies, particularly those that emphasize consumption of specific nutrient‐rich foods, can have a significant impact on micronutrient intakes, but the net increase is relatively modest relative to requirements. In four studies that evaluated the impact of education on Fe intakes, there was a significant increase of ∼1.5 mg day−1 in two studies, and no significant effect in the other two. Mean total Fe intake in the intervention groups in the two former interventions was only 4–7 mg day−1, still considerably below the recommended intake of 9–11 mg day−1 at 6–12 months. Thus, the potential increase from educational strategies is generally not sufficient to fill the gap. For Zn, two of three intervention studies demonstrated a significant increase in intake in the intervention group. The increase of 0.6–0.8 mg day−1 brought total intakes from complementary foods to 2.3–4.4 mg day−1, which is reasonable given that recommended intake is 3–4 mg day−1 at 6–12 months (Dewey & Brown 2003).
Not surprisingly, fortification strategies have a larger impact on micronutrient intakes. In three intervention trials using fortified complementary foods, Fe intake increased by 5–11 mg day−1, resulting in total Fe intakes of 9–16 mg day−1. Similarly, in two of these interventions, Zn intake increased by 5–6 mg day−1, resulting in total Zn intakes from complementary foods of ∼8 mg day−1. Increases in vitamin A intake resulting from fortification were more variable because of differences in the level of fortification. Total intakes in the intervention groups in two such studies were 367 µg RE day−1 (Lutter et al. 2006) and 866 µg RE day−1 (Lartey et al. 1999), which compares favourably to the recommended intake of 400–500 µg RE day−1 at 6–12 months (Dewey & Brown 2003).
Previous calculations have demonstrated that it is very difficult for infants to consume sufficient Fe to meet estimated requirements at 6–12 months (Dewey & Brown 2003), and that fortification (either processed complementary foods or home fortification) is the most feasible option in most circumstances given the cost of iron‐rich foods (such as liver or meat). These results support this conclusion. For Zn and vitamin A, however, it is possible to meet estimated requirements from local foods, although this requires careful attention to dietary choices. For these nutrients, fortification can certainly fill the gap but it is not the only option.
5.5 Impact of complementary feeding interventions on micronutrient status
With regard to iron status, two studies demonstrated that educational approaches can have a positive impact if the messages are specific to iron‐rich foods. In these two studies (Guldan et al. 2000; Kapur et al. 2003), there was a 4–8 g L−1 increase in Hb, and in one of them, anaemia prevalence decreased from 32% to 22% (Guldan et al. 2000). Two other educational interventions, however, failed to have any impact on anaemia rates (Maluccio & Flores 2004; Vitolo et al. 2005). The impact of fortified complementary foods and home‐fortification products was generally significant and substantial, with an overall increase of +4–8 g L−1 in Hb and an average reduction of 13–21 PP in the prevalence of anaemia.
In contrast, there is little evidence of any impact of fortified complementary foods (processed or home‐fortified) on plasma zinc concentrations. One possible explanation is that the zinc added to these foods is not well absorbed because of high phytate concentrations in cereals and grains. Although plasma zinc is not an ideal indicator of the zinc status of an individual, there is evidence that it does respond to zinc supplements (generally taken between meals) and is an indicator of zinc status at the population level. Thus, further research is needed to understand why zinc‐fortified foods have little effect on plasma zinc concentrations.
Several studies demonstrated that complementary foods fortified with vitamin A can reduce the prevalence of vitamin A deficiency. In some studies, there was no significant effect on plasma vitamin A concentrations between intervention and control groups, probably because children in both groups may have participated in concurrent vitamin A supplementation programmes. In the two studies in which the percentage of children with low plasma vitamin A concentrations was reported (Lartey et al. 1999; Lutter et al. 2006), there was an average decrease of ∼13 PP in the prevalence of vitamin A deficiency.
These studies demonstrate that although fortification alone may not affect child growth, it can be highly effective at improving iron and vitamin A status. Although this could be accomplished by other strategies, such as iron or vitamin A supplementation, using complementary foods as the vehicle may be less risky [given recent concerns about adverse effects of iron supplements in certain situations (WHO & UNICEF 2007)] and more acceptable to caregivers.
5.6 Conclusions
The fundamental question that policy‐makers have is ‘Do complementary feeding interventions “work”, and if so, which specific programme elements are most effective and what is their cost?’. The results of this review suggest that such interventions can have an impact, but the specifics depend on which health outcome is being targeted and the ability of the target population to respond. The small to medium effect on child growth of many interventions (not just complementary feeding) may be disappointing to some, but it must be recognized that a child's growth trajectory is determined by a myriad of pre‐ and post‐natal factors, including but not limited to dietary intake. The magnitude of response to an intervention is likely to vary with the characteristics of the target population (e.g. age, degree of nutritional deficiency) and the quality of the intervention. Although the effect of complementary feeding interventions may be to increase length‐for‐age by only 0.2–0.5 SD, the impact on the lower tail of the distribution – that is, on stunting rates – could be considerably larger. Unfortunately, many of the published reports did not include data on rates of stunting, or were not specifically designed or powered to examine this as an outcome. In the Peru study (Penny et al. 2005), however, the percentage of children who were stunted was 4.7% in the intervention group, compared with 15.8% in the control group, a highly significant difference. Some of the interventions that demonstrated very small changes in mean length‐for‐age nonetheless showed reductions in stunting of 4–11 PP (Bhandari et al. 2001; Maluccio & Flores 2004; Guyon et al. 2006). It should also be noted that complementary feeding interventions, by themselves, cannot change the underlying conditions of poverty and poor sanitation that contribute to poor child growth. They need to be implemented in conjunction with a larger strategy that includes improved water and sanitation, better health care and adequate housing.
With properly designed interventions, substantial effects on iron and vitamin A status can be expected (e.g. reductions of 13–21 PP in the prevalence of anaemia or vitamin A deficiency). The average effect sizes for fortified processed complementary foods and home‐fortification products were similar (and larger than those for educational approaches), although it is difficult to compare the efficacy of the two fortification approaches because no study has directly evaluated the difference in impact between these two strategies. Home fortification has several advantages over centrally processed, fortified complementary foods. First, the dose of iron can be tailored to the age of the infant, regardless of the amount of food consumed, which is important because the amount of iron needed at 6–12 months is greater than at 12–24 months of age. Second, home fortification requires little change in dietary practices and allows families to continue to use home‐prepared or purchased complementary foods as the basis for the child's diet. Third, the cost of home‐fortification products is likely to be lower than that of commercially produced complementary foods. On the other hand, commercially produced complementary foods (especially ‘instant’ products) may be a more convenient option for populations in which caregivers face time constraints in preparing complementary foods several times a day. However, the evaluations of fortified complementary foods to date have all been based on programmes in which the food was provided to families. The impact of products that would have to be purchased by the caregiver or family is not known. Moreover, even when a commercially produced complementary food is available and affordable, the child also needs to consume other foods to achieve a diverse diet and eventually make the transition to family foods.
There is much less information on the impact of complementary feeding interventions on morbidity and behavioural development, but several recent studies have yielded promising results using specially designed fortified milk‐based or fat‐based complementary foods (Sazawal et al. 2007; Adu‐Afarwuah et al. 2007). The finding that 49% of children receiving a small amount of a fat‐based fortified product (‘Nutributter’) walked at 12 months of age, compared with 25% of children in the non‐intervention group, is notable given that the expected percentage in a healthy, well‐nourished population is 50% (Adu‐Afarwuah et al. 2007). This is certainly an area in need of further research.
One of the key issues for policy‐makers is whether education alone can achieve the desired results, or provision of a food supplement is needed. The results from the two studies that directly compared these approaches, both in South Asia, suggest that a greater impact can be expected when a food supplement is provided. However, this may be highly context specific, and may not be as critical in populations with greater food security.
Provision of food can be expensive, and thus it is essential to identify options that will have a large impact at the lowest possible cost. The amount of energy provided by the various food‐based interventions reviewed herein ranged from ∼100 kcal day−1 to more than 1500 kcal day−1. The latter amount is clearly excessive, as it is greater than the total energy requirements of children 6–24 months of age and does not make allowance for the energy contributed by breastmilk. The intervention providing the lowest amount of energy, which was supplied by 20 g day−1 of the fat‐based product (Adu‐Afarwuah et al. 2007), had an impact on weight and length (effect size ∼0.3) that was comparable to that of some interventions providing much larger amounts (e.g. Bhandari et al. 2001), although this may be due to the macronutrient composition of the product and not just its energy content. In an intervention in Malawi using doses of 50 g day−1 of a similar product, effect sizes were ∼0.5–0.7 (Kuusipalo et al. 2006). Thus, it is possible that with carefully formulated products, the dose and cost of a fortified food supplement can be kept to a minimum (as low as $0.03–0.06 day−1) without compromising efficacy. Using a relatively small dose also reduces the risk of excessive displacement of breastmilk. Given that the energy needs from complementary foods are only 200–300 kcal day−1 at 6–12 months, the daily ration provided should certainly not exceed this amount and would preferably be lower so as to allow for consumption of home‐prepared complementary foods.
What lessons have been learned regarding the educational component of complementary feeding interventions? First, education can be provided via multiple channels – positive impacts have been observed when interventions are delivered via training of health‐care providers and also when delivered directly to caregivers in person. Studies directly comparing these approaches are lacking, but the optimal design likely depends on the existing infrastructure and local communication channels, as well as opportunities to improve the infrastructure via training, materials and supervision. Second, the most effective educational interventions used a carefully selected, small number of specific key messages about practices that can feasibly be adopted by the target population, rather than general advice about child feeding. Ideally, the messages chosen would be based on a needs assessment and formative research with the target group, to identify the practices most in need of improvement and amenable to change. Tools available for identifying key limiting nutrients and potential food sources to fill the gaps include linear programming (Ferguson et al. 2006), which allows programmers to identify key foods and determine whether fortification is warranted for certain nutrients, and assessment manuals such as Process for the Promotion of Child Feeding (developed by PAHO) (PAHO 2004). Third, nearly all of the educational interventions included messages regarding optimal breastfeeding practices as well as hygienic preparation and storage of complementary foods, which are essential for reducing morbidity. Although further research on how best to deliver an educational intervention is certainly needed, there is a general consensus on the key guiding principles (PAHO/WHO 2003) and on the behaviours needed to optimize complementary feeding practices.
Many strategies can be used to improve complementary feeding. There is no single ‘best’ approach that can be applied universally because the opportunities and constraints vary greatly in different populations. In addition, the evidence base for complementary feeding interventions is still relatively thin, and there are many unanswered questions that deserve further research. Box 1 lists some of the key research priorities that emerged from this review. These include additional efficacy trials as well as studies that examine operational effectiveness and impact of programmes implemented at the regional or national level. To date, a few large‐scale programmes have used a combination of the strategies described in this review, including education, provision of food (sometimes fortified) and in some cases an income supplement (Maluccio & Flores 2004; Rivera et al. 2004). The results of these programmes have been mixed, in part because of difficulties in achieving adequate coverage and quality of services (Hossain et al. 2005b). Thus, the biggest challenge remaining is how to design and implement high‐quality programmes that combine the most effective components of the interventions reviewed herein and are sustainable when delivered on a large scale.
Box 1. Research priorities
-
1
Efficacy trials to determine the optimal macro‐ and micronutrient content of fortified complementary foods and products for home fortification. These should address the following questions:
-
•
Is inclusion of milk protein beneficial for growth, and if so, how much is needed?
-
•
How much and what type of fat, including essential fatty acids, is optimal for growth and development?
-
•
What is the optimal, safe level of iron fortification? Are fortified foods, or products for home fortification, a safer strategy than iron supplements for reducing iron deficiency in malarial areas?
-
•
Why have most previous studies found no impact of zinc‐fortified foods on plasma zinc concentrations? How much zinc should be included to optimize growth and functional outcomes, taking into account the expected amount absorbed?
-
•
Do food matrix effects or nutrient‐nutrient interactions affect the amounts of micronutrients needed?
-
•
Aside from iron and zinc, which micronutrients are the highest priority for inclusion in such products?
-
•
-
2
Efficacy trials to evaluate the recommended ration of a fortified complementary food for each age group (6–8, 9–11 and 12–23 months) that will be most beneficial to growth, morbidity and development without compromising breast milk intake.
-
3
Further efficacy trials of increasing energy density of complementary foods via use of amylase, in contexts where energy intake from complementary foods appears to be limited by low energy density. These trials could be designed to evaluate the use of amylase in products for home fortification.
-
4
Investigation of the reasons for the low impact on rates of anaemia in some iron‐fortification trials.
-
5
Additional effectiveness studies that are adequately designed and powered to detect meaningful effects on rates of stunting, morbidity and developmental delay.
-
6
Additional effectiveness studies in various regions to compare nutrition education interventions with interventions that include both nutrition education and provision of complementary food.
-
7
Effectiveness studies of the impact of fortified complementary foods and home‐fortification products when these are not given free of charge but are available for purchase.
-
8
Programme evaluations that examine the additive or synergistic effect of coupling complementary feeding interventions with cash transfers for poor families.
-
9
Process evaluations of programs to examine:
-
•
the optimal delivery system for education about complementary feeding in various settings;
-
•
strategies to maintain a high quality of the programme delivered; and
-
•
integration of complementary feeding interventions into existing and new delivery systems to maximize coverage and sustainability.
-
•
Key messages:
-
1)
Educational interventions that include a strong emphasis on feeding nutrient‐rich animal source foods may be more likely to show an effect on child growth than interventions with more general messages about complementary feeding.
-
2)
In areas with a high prevalence of food insecurity, complementary feeding interventions that include provision of additional food, not just education, may be more effective.
-
3)
Interventions in which micronutrient fortification is the sole component can be effective at improving iron and vitamin A status, but they generally have little impact on growth.
-
4)
Appropriately designed complementary feeding interventions can reduce morbidity, but caution is needed to avoid excessive displacement of breast milk and to include counseling on responsive feeding, hygienic practices and continued breastfeeding.
-
5)
Recent studies of complementary feeding interventions have suggested a positive impact on behavioral development, which may be a more sensitive indicator of improvements in child nutrition than other outcomes.
Acknowledgments
We gratefully acknowledge assistance from Dr Frances Aboud and Dr Charles Lawson with the systematic literature review, organization of the report and comments on a preliminary draft. We also thank all of the investigators who provided data in addition to what has been formally published, and the external reviewers who provided many useful suggestions for revision of the first draft.
Conflicts of interest
The authors have declared no conflicts of interest.
Appendix 1
Search strategy
(((randomized controlled trial[pt] OR controlled clinical trial[pt] OR randomized controlled trials[mh] OR random allocation[mh] OR double‐blind method[mh] OR single‐blind method[mh] OR clinical trial[pt] OR clinical trials[mh] OR (‘clinical trails’[tw]) OR ((sing*[tw] OR doubl*[tw] OR trebl*[tw] OR tripl*[tw]) AND (mask*[tw] OR blind*[tw])) OR (‘latin square’[tw]) OR placebos[mh] OR placebo*[tw] OR random*[tw] OR research design[mh:noexp] OR comparative study[mh] OR evaluation studies[mh] OR follow‐up studies[mh] OR prospective studies[mh] OR cross‐over studies[mh] OR control*[tw] OR prospective*[tw] OR volunteer*[tw]) NOT (animal[mh] NOT human[mh]) AND (Clinical Trial[ptyp] OR Randomized Controlled Trial[ptyp] OR Classical Article[ptyp] OR Clinical Trial, Phase I[ptyp] OR Clinical Trial, Phase III[ptyp] OR Clinical Trial, Phase IV[ptyp] OR Controlled Clinical Trial[ptyp] OR Journal Article[ptyp]) AND (English[lang] OR Spanish[lang]) AND (infant[MeSH:noexp]) AND (‘1996/01/01’[PDat] : ‘2006/01/01’[PDat])) AND ((weaning food*[tw] OR weaning food*[mh] OR complementary food*[tw] OR complementary food*[mh] OR complementary feed*[tw] OR complementary feed*[mh]) OR home fortification[tw] AND (Clinical Trial[ptyp] OR Randomized Controlled Trial[ptyp] OR Classical Article[ptyp] OR Clinical Trial, Phase I[ptyp] OR Clinical Trial, Phase III[ptyp] OR Clinical Trial, Phase IV[ptyp] OR Controlled Clinical Trial [ptyp] OR Journal Article[ptyp]) AND (English[lang] OR Spanish[lang]) AND (infant[MeSH:noexp]) AND (‘1996/01/01’[PDat]: ‘2006/07/01’[PDat]))) NOT (retracted publication[pt]).
References
- Adu‐Afarwuah S., Lartey A., Brown K.H., Zlotkin S., Briend A. & Dewey K.G. (2007) Randomized comparison of 3 types of micronutrient supplements for home fortification of complementary foods in Ghana: effects on growth and motor development. American Journal of Clinical Nutrition 86, 412–420. [DOI] [PubMed] [Google Scholar]
- Adu‐Afarwuah S., Lartey A., Brown K.H., Zlotkin S., Briend A., Dewey K.G. Home fortification of complementary foods with micronutrient supplements is well accepted and has positive effects on infant iron status in Ghana. Am J Clin Nutr (in press). [DOI] [PubMed]
- Beckett C., Durnin J.V., Aitchison T.C. & Pollitt E. (2000) Effects of an energy and micronutrient supplement on anthropometry in undernourished children in Indonesia. European Journal of Clinical Nutrition 54 (Suppl.2), S52–S59. [DOI] [PubMed] [Google Scholar]
- Bhandari N., Bahl R., Nayyar B., Khokhar P., Rohde J.E. & Bhan M.K. (2001) Food supplementation with encouragement to feed it to infants from 4 to 12 months of age has a small impact on weight gain. Journal of Nutrition 131, 1946–1951. [DOI] [PubMed] [Google Scholar]
- Bhandari N., Mazumder S., Bahl R., Martines J., Black R.E. & Bhan M.K. (2004) An educational intervention to promote appropriate complementary feeding practices and physical growth in infants and young children in rural Haryana, India. Journal of Nutrition 134, 2342–2348. [DOI] [PubMed] [Google Scholar]
- Caulfield L.E., Huffman S.L. & Piwoz E.G. (1999) Interventions to improve intake of complementary foods by infants 6 to 12 months of age in developing countries: impact on growth and on the prevalence of malnutrition and potential contribution to child survival. Food and Nutrition Bulletin 20, 183–200. [Google Scholar]
- Cohen J. (1988) Statistical Power Analysis for the Behavioral Sciences, 2nd edn. Lawrence Earlbaum Associates: Hillsdale, NJ. [Google Scholar]
- Dewey K.G. (2005) Complementary feeding In: Encyclopedia of Human Nutrition (eds Caballero B., Allen L. Prentice A.), pp 465–470. Elsevier Ltd.: Amsterdam. [Google Scholar]
- Dewey K.G. & Brown K.H. (2003) Update on technical issues concerning complementary feeding of young children in developing countries and implications for intervention programs. Food and Nutrition Bulletin 24, 5–28. [DOI] [PubMed] [Google Scholar]
- Dhingra P., Menon V.P., Sazawal S., Dhingra U., Marwah D., Sarkar A. et al (2004) Effect of fortification of milk with zinc and iron along with vitamins C, E, A and selenium on growth, iron status and development in preschool children – a community‐based double‐masked randomized trial. Report from the 2nd World Congress of Pediatric Gastroenterology, Hepatology and Nutrition. Paris, France, 3–7 July 2004.
- Faber M., Kvalsvig J.D., Lombard C.J. & Benade A.J. (2005) Effect of a fortified maize‐meal porridge on anemia, micronutrient status, and motor development of infants. American Journal of Clinical Nutrition 82, 1032–1039. [DOI] [PubMed] [Google Scholar]
- Ferguson E.L., Darmon N., Fahmida U., Fitriyanti S., Harper T.B. & Premachandra I.M. (2006) Design of optimal food‐based complementary feeding recommendations and identification of key ‘problem nutrients’ using goal programming. Journal of Nutrition 136, 2399–2404. [DOI] [PubMed] [Google Scholar]
- Gartner A., Kameli Y., Traissac P., Dhur A., Delpeuch F. & Maire B. (2007) Has the first implementation phase of the Community Nutrition Project in urban Senegal had an impact? Nutrition 23, 219–228. [DOI] [PubMed] [Google Scholar]
- Giovannini M., Sala D., Usuelli M., Livio L., Francescato G., Braga M. et al (2006) Double‐blind, placebo‐controlled trial comparing effects of supplementation with two different combinations of micronutrients delivered as sprinkles on growth, anemia, and iron deficiency in Cambodian infants. Journal of Pediatric Gastroenterology and Nutrition 42, 306–312. [DOI] [PubMed] [Google Scholar]
- Guldan G.S., Fan H.C., Ma X., Ni Z.Z., Xiang X. & Tang M.Z. (2000) Culturally appropriate nutrition education improves infant feeding and growth in rural Sichuan, China. Journal of Nutrition 130, 1204–1211. [DOI] [PubMed] [Google Scholar]
- Guyon A., Quinn V., Rambeloson Z. & Hainsworth M. (2006) Using the Essential Nutrition Actions approach to improve the nutritional practices of women and children at scale in Antananarivo and Fianarantsoa provinces of Madagascar: results and trends 2000–2005. Final Report, July 2006. LINKAGES, USAID.
- Hoppe C., Andersen G., Jacobsen S., Mølgaard C., Friis H., Sangild P. et al (in press) The use of whey or skimmed milk powder in fortified blended foods for vulnerable groups; a literature review. [DOI] [PubMed]
- Hossain M.I., Wahed M.A. & Ahmed S. (2005a) Increased food intake after the addition of amylase‐rich flour to supplementary food for malnourished children in rural communities of Bangladesh. Food and Nutrition Bulletin 26, 323–329. [DOI] [PubMed] [Google Scholar]
- Hossain S.M., Duffield A. & Taylor A. (2005b) An evaluation of the impact of a US$60 million nutrition programme in Bangladesh. Health Policy Plan 20,35–40. [DOI] [PubMed] [Google Scholar]
- Hotz C. & Gibson R.S. (2005) Participatory nutrition education and adoption of new feeding practices are associated with improved adequacy of complementary diets among rural Malawian children: a pilot study. European Journal of Clinical Nutrition 59, 226–237. [DOI] [PubMed] [Google Scholar]
- Javaid N., Haschke F., Pietschnig B., Schuster E., Huemer C., Shebaz A., Ganesh P., Steffan I., Hurrel R., Secretin M.C. (1991) Interactions between infections, malnutrition and iron nutritional status in Pakistani infants. A longitudinal study. Acta Paediatr Scand Suppl 374, 141–150. [DOI] [PubMed] [Google Scholar]
- John C. & Gopaldas T. (1993) Evaluation of the impact on growth of a controlled 6‐month feeding trial on children (6–24 months) fed a complementary feed of a high energy‐low bulk gruel versus a high energy‐high bulk gruel in addition to their habitual home diet. Journal of Tropical Pediatrics 39, 16–22. [DOI] [PubMed] [Google Scholar]
- Kapur D., Sharma S. & Agarwal K.N. (2003) Effectiveness of nutrition education, iron supplementation or both on iron status in children. Indian Pediatrics 40, 1131–1144. [PubMed] [Google Scholar]
- Kilaru A., Griffiths P.L., Ganapathy S. & Ghosh S. (2005) Community‐based nutrition education for improving infant growth in rural Karnataka. Indian Pediatrics 42, 425–432. [PubMed] [Google Scholar]
- Kuusipalo H., Maleta K., Briend A., Manary M. & Ashorn P. (2006) Growth and change in blood haemoglobin concentration among underweight Malawian infants receiving fortified spreads for 12 weeks: a preliminary trial. Journal of Pediatric Gastroenterology and Nutrition 43, 525–532. [DOI] [PubMed] [Google Scholar]
- Lartey A., Manu A., Brown K.H., Peerson J.M. & Dewey K.G. (1999) A randomized, community‐based trial of the effects of improved, centrally processed complementary foods on growth and micronutrient status of Ghanaian infants from 6 to 12 mo of age. American Journal of Clinical Nutrition 70, 391–404. [DOI] [PubMed] [Google Scholar]
- López de Romaña G. (2000) Experience with complementary feeding in the FONCODES Project. Food and Nutrition Bulletin 21, 43–48. [Google Scholar]
- Lozoff B., Beard J., Connor J., Barbara F., Georgieff M. & Schallert T. (2006) Long‐lasting neural and behavioral effects of iron deficiency in infancy. Nutrition Reviews 64, S34–S43, discussion S72–S91. [DOI] [PMC free article] [PubMed] [Google Scholar]
- Lutter C.K., Mora J.O., Habicht J.P., Rasmussen K.M., Robson D.S. & Herrera M.G. (1990) Age‐specific responsiveness of weight and length to nutritional supplementation. American Journal of Clinical Nutrition 51, 359–364. [DOI] [PubMed] [Google Scholar]
- Lutter C.K., Rodriguez A., Fuenmayor G. & Sempertegui F. (2006) Evaluation of a national food and nutrition program in Ecuador on child growth and micronutrient status. An abstract submitted to Experimental Biology 2006. 20 April. San Francisco, CA, USA.
- Maluccio J.A. & Flores R. (2004) Impact evaluation of a conditional cash transfer program: the Nicaraguan Red de protección social . IFPRI FCND Discussion Paper No. 184. Washington, DC.
- Mamiro P.S., Kolsteren P.W., Van Camp J.H., Roberfroid D.A., Tatala S. & Opsomer A.S. (2004) Processed complementary food does not improve growth or hemoglobin status of rural Tanzanian infants from 6–12 months of age in Kilosa district, Tanzania. Journal of Nutrition 134, 1084–1090. [DOI] [PubMed] [Google Scholar]
- Martorell R., Khan L.K. & Schroeder D.G. (1994) Reversibility of stunting: epidemiological findings in children from developing countries. European Journal of Clinical Nutrition 48 (Suppl. 1), S45–S57. [PubMed] [Google Scholar]
- Menon P., Ruel M.T., Loechl C.U., Arimond M., Habicht J.P., Pelto G. et al (2007) Micronutrient Sprinkles reduce anemia among 9‐ to 24‐mo‐old children when delivered through an integrated health and nutrition program in rural Haiti. Journal of Nutrition 137, 1023–1030. [DOI] [PubMed] [Google Scholar]
- Moursi M., Mbemba F. & Treche S. (2003) Does the consumption of amylase‐containing gruels impact on the energy intake and growth of Congolese infants? Public Health Nutrition 6, 249–258. [DOI] [PubMed] [Google Scholar]
- Obatolu V.A. (2003) Growth pattern of infants fed with a mixture of extruded malted maize and cowpea. Nutrition 19, 174–178. [DOI] [PubMed] [Google Scholar]
- Oelofse A., Van Raaij J.M., Benade A.J., Dhansay M.A., Tolboom J.J. & Hautvast J.G. (2003) The effect of a micronutrient‐fortified complementary food on micronutrient status, growth and development of 6‐ to 12‐month‐old disadvantaged urban South African infants. International Journal of Food Sciences and Nutrition 54, 399–407. [DOI] [PubMed] [Google Scholar]
- Owino V.O., Kasonka L.M., Sinkala M.M., Wells J.K., Eaton S., Darch T. et al (2007) Fortified complementary foods increases growth and hemoglobin independently of α‐amylase treatment, without reducing breastmilk intake of 9‐month old Zambian infants. American Journal of Clinical Nutrition 86, 1094–1103. [DOI] [PubMed] [Google Scholar]
- PAHO (2004) ProPAN: Process for the Promotion of Child Feeding. Pan; American Health Organization: Washington, DC. [Google Scholar]
- PAHO/WHO (2003) Guiding Principles for Complementary Feeding of the Breastfed Child. Pan; American Health Organization/World Health Organization: Washington, DC. [Google Scholar]
- Penny M.E., Creed‐Kanashiro H.M., Robert R.C., Narro M.R., Caulfield L.E. & Black R.E. (2005) Effectiveness of an educational intervention delivered through the health services to improve nutrition in young children: a cluster‐randomised controlled trial. Lancet 365, 1863–1872. [DOI] [PubMed] [Google Scholar]
- Pollitt E., Jahari A., Husaini M., Kariger P. & Saco‐Pollitt C. (2002) Developmental trajectories of poorly nourished toddlers that received a micronutrient supplement with and without energy. Journal of Nutrition 132, 2617–2625. [DOI] [PubMed] [Google Scholar]
- Rivera J.A., Sotres‐Alvarez D., Habicht J.P., Shamah T. & Villalpando S. (2004) Impact of the Mexican program for education, health, and nutrition (Progresa) on rates of growth and anemia in infants and young children: a randomized effectiveness study. Journal of the American Medical Association 291, 2563–2570. [DOI] [PubMed] [Google Scholar]
- Roy S.K., Fuchs G.J., Mahmud Z., Ara G., Islam S., Shafique S. et al (2005) Intensive nutrition education with or without supplementary feeding improves the nutritional status of moderately‐malnourished children in Bangladesh. Journal of Health, Population, and Nutrition 23, 320–330. [PubMed] [Google Scholar]
- Santos I., Victora C.G., Martines J., Goncalves H., Gigante D.P., Valle N.J. et al (2001) Nutrition counseling increases weight gain among Brazilian children. Journal of Nutrition 131, 2866–2873. [DOI] [PubMed] [Google Scholar]
- Santos I.S., Gigante D.P., Coitinho D.C., Haisma H., Valle N.C. & Valente G. (2005) Evaluation of the impact of a nutritional program for undernourished children in Brazil. Cadernos de Saude Publica 21, 776–785. [DOI] [PubMed] [Google Scholar]
- Sazawal S., Dhingra U., Dhingra P., Hiremath G., Kumar J., Sarkar A. et al (2007) Effects of fortified milk on morbidity in young children in north India: community based, randomised, double masked placebo controlled trial. British Medical Journal 334, 140. [DOI] [PMC free article] [PubMed] [Google Scholar]
- Schumann K., Romero‐Abal M.E., Maurer A., Luck T., Beard J., Murray‐Kolb L., Bulux J., Mena I., Solomons N.W. (2005) Haematological response to haem iron or ferrous sulphate mixed with refried black beans in moderately anaemic Guatemalan pre‐school children. Public Health Nutr 8, 572–581. [DOI] [PubMed] [Google Scholar]
- Schroeder D.G., Martorell R., Rivera J.A., Ruel M.T. & Habicht J.P. (1995) Age differences in the impact of nutritional supplementation on growth. Journal of Nutrition 125, 1051S–1059S. [DOI] [PubMed] [Google Scholar]
- Schroeder D.G., Pachon H., Dearden K.A., Kwon C.B., Ha T.T., Lang T.T. et al (2002) An integrated child nutrition intervention improved growth of younger, more malnourished children in northern Viet Nam. Food and Nutrition Bulletin 23, 53–61. [PubMed] [Google Scholar]
- Sharieff W., Bhutta Z., Schauer C., Tomlinson G. & Zlotkin S. (2006) Micronutrients (including zinc) reduce diarrhoea in children: the Pakistan Sprinkles Diarrhoea Study. Archives of Disease in Childhood 91, 573–579. [DOI] [PMC free article] [PubMed] [Google Scholar]
- Shrimpton R., Victora C.G., De Onis M., Lima R.C., Blossner M. & Clugston G. (2001) Worldwide timing of growth faltering: implications for nutritional interventions. Pediatrics 107, E75. [DOI] [PubMed] [Google Scholar]
- Smuts C.M., Dhansay M.A., Faber M., Van Stuijvenberg M.E., Swanevelder S., Gross R. et al (2005) Efficacy of multiple micronutrient supplementation for improving anemia, micronutrient status, and growth in South African infants. Journal of Nutrition 135, 653S–659S. [DOI] [PubMed] [Google Scholar]
- Villalpando S., Shamah T., Rivera J.A., Lara Y. & Monterrubio E. (2006) Fortifying milk with ferrous gluconate and zinc oxide in a public nutrition program reduced the prevalence of anemia in toddlers. Journal of Nutrition 136, 2633–2637. [DOI] [PubMed] [Google Scholar]
- Vitolo M.R., Bortolini G.A., Feldens C.A. & Drachler Mde L. (2005) Impacts of the 10 steps to healthy feeding in infants: a randomized field trial. Cadernos de Saude Publica 21, 1448–1457. [DOI] [PubMed] [Google Scholar]
- Walter T., Dallman P.R., Pizarro F., Velozo L., Pena G., Bartholmey S.J. et al (1993) Effectiveness of iron‐fortified infant cereal in prevention of iron deficiency anemia. Pediatrics 91, 976–982. [PubMed] [Google Scholar]
- WHO (1998) Complementary Feeding of Young Children in Developing Countries: A Review of Current Scientific Knowledge. World Health Organization: Geneva. [Google Scholar]
- WHO & UNICEF (2007) Iron Supplementation of Young Children in Regions Where Malaria Transmission Is Intense and Infectious Disease Highly Prevalent. Joint World Health Organization/UNICEF Statement: Geneva. Available at: http://www.who.int/nutrition/publications/ [Google Scholar]
- World Bank (2005) Repositioning Nutrition as Central to Development: A Strategy for Large Scale Action. The World Bank: Washington, DC. [Google Scholar]
- WVM (2005) Effectiveness of Home‐Based Fortification with Sprinkles in an Integrated Nutrition Program to Address Rickets and Anemia. World Vision Mongolia: Ulaanbaatar. [Google Scholar]
- Zlotkin S., Antwi K.Y., Schauer C. & Yeung G. (2003) Use of microencapsulated iron(II) fumarate sprinkles to prevent recurrence of anemia in infants and young children at high risk. Bulletin of the World Health Organization 81, 108–115. [PMC free article] [PubMed] [Google Scholar]