

Abstract
The objective of the present observational study was to investigate if the docosahexaenoic acid (DHA) status assessed in infant erythrocytes (RBC) at 9 months was associated with the age when the infants reach developmental milestones and their psychomotor function at 3 years of age. Three hundred eleven healthy Danish children were followed from 9 months to 3 years of age (the SKOT cohort). RBC fatty acid composition was analysed by gas chromatography in 272 of the children. Milestone age was collected by questionnaires at 9 and 18 months and psychomotor development at 3 years of age was assessed by the parents using third edition of the Ages and Stages Questionnaire (ASQ‐3). RBC DHA levels ranged from 2.2% to 12.6% of the RBC fatty acids. The age of reaching milestones correlated with psychomotor development, particularly with gross motor function at 3 years. An association between milestones and later personal and social skills was also observed, but only for girls. In girls, RBC–DHA was found to be inversely correlated with communication at 3 years of age (odds ratio = 0.69, 95% confidence interval: 0.56–0.86, P = 0.001), but no other associations with psychomotor development or milestones were found. The results from study indicate that DHA status at 9 months may not have a pronounced beneficial effect on psychomotor development in early childhood and that communicative skills at 3 years of age may even be inversely associated with early RBC–DHA levels in girls.
Keywords: n‐3 fatty acids, brain development, communication, infant nutrition, cohort study
Introduction
The unique high content of n‐3 long‐chain polyunsaturated fatty acids (n‐3 LCPUFA), primarily docosahexaenoic acid (DHA), in the central nervous system (CNS) has been shown to accumulate during the brain‐growth spurt (Martinez 1992; Lauritzen et al. 2001). Studies have shown that breastfed children have higher levels of DHA in the brain (Farquharson et al. 1992; Makrides et al. 1994) and achieve higher scores in various developmental tests when compared with formula‐fed children (Anderson et al. 1999; Sacker et al. 2006; Horta et al. 2007). However, randomized controlled trials with DHA‐enriched infant formula have shown conflicting results (McCann & Ames 2005; Eilander et al. 2007). Possible reasons for the inconsistent results could be: timing of the supplementation, duration of the trial or the n‐3 LCPUFA‐status at baseline in the supplemented individuals (Calder et al. 2010). Furthermore, Caspi et al. (2007) and Steer et al. (2010) found that the cognitive advantages of the breastfeeding are modified by genetic differences in the LCPUFA metabolism (Caspi et al. 2007). The effect of DHA supplementation may also be limited in groups with particular LCPUFA‐metabolism gene variants (Tanaka et al. 2009).
Cohort studies have shown that early child development is positively associated with maternal seafood consumption during pregnancy (Hibbeln et al. 2007; Oken et al. 2008). Some studies have found a beneficial association between maternal fish oil supplementation during pregnancy and lactation and child development (Helland et al. 2003; Jensen et al. 2005; Judge et al. 2007), whereas others did not (Lauritzen et al. 2005). Some studies even points to a potential unbeneficial influence of high DHA intakes on language development in children (Scott et al. 1998; Lauritzen et al. 2005; Makrides et al. 2010; Cheatham et al. 2011). Most of the studies have focused on intake during pregnancy and the first months of life and few have included DHA status in erythrocytes (RBC) later in infancy. Two maternal fish oil‐supplementation trials have found significant associations between high RBC–DHA levels and child development (Gibson et al. 1997; Dunstan et al. 2006), but again limited to the first months after birth.
A transition from breast milk as the main source of n‐3 LCPUFA to fish products takes place during the complementary feeding period, when the child is adapting to the family diet. Observational studies suggest that plasma LCPUFA concentrations decrease as breast milk is replaced by solid food (Schwartz et al. 2009). The rate of CNS development and brain growth is still high during the complementary feeding period. We hypothesize that complementary feeding is a critical period with respect to n‐3 LCPUFA, which affect structural and functional changes in the CNS with potential long‐term programming consequences on development.
The aim of this study was to examine associations between the level of DHA in RBC at 9 months and the age by which the infant reach the World Health Organization‐specified developmental milestones (Wijnhoven et al. 2004) and psychomotor developmental scores at 3 years of age, assessed by a questionnaire that determines communication, problem solving, fine and gross motor development, and personal and social abilities.
Key messages
-
•
Docosahexaenoic acid (DHA) accumulates in the central nervous system (CNS) during early life. Diet can modulate CNS DHA content, which has developmental effect, especially on infant visual acuity. The importance for psychomotor development of intake of DHA in the complementary feeding period is unknown.
-
•
DHA levels at 9 months are not associated with a pronounced beneficial effect on psychomotor development in early childhood. Communicative skills at 3 years of age may even be inversely associated with early DHA levels in girls.
Methods
The study used data from the SKOT‐cohort carried out in May 2007–October 2010 at the Department of Human Nutrition, University of Copenhagen (Madsen et al. 2010). The study was approved by the Scientific‐Ethical Committees for Copenhagen and Frederiksberg (H‐KF‐2007–0003) and written informed consent was obtained from the parents of all participating children after they were informed about the study both orally and in writing.
Participants
The participants were recruited by age and address through the Danish Social Security Register and excluded if the child was a twin, born earlier than the thirty‐seventh gestational week, or suffering from serious chronic diseases that could affect growth and dietary intake, or if the parents did not speak Danish. Invitations were send to 2211 families and we got 380 eligible positive responses, but in 46 cases, it was impossible to arrange meetings in accordance with the age limits for the child, four chose not to participate after all, and one was excluded because of late manifestation of a severe chronic disorder. Thus, 329 children were included and 18 of these dropped out before first examination visit, and one did not complete the background questionnaire (5%). The dietary habits of the children at 9 months has been reported previously (Gondolf et al. 2012). The socio‐demographic and birth characteristics of the infants are shown in Table 1.
Table 1.
Birth and socio‐demographic characteristics of the subjects
| Variables | Mean ± SD | Range | n |
|---|---|---|---|
| Birth weight (g) | 3541 ± 441 | 310 | |
| Boys | 3639 ± 426 | 2500–4850 | 148 |
| Girls | 3451 ± 436 | 2404–4600 | 162 |
| Birth length (cm) | 52.1 ± 2.0 | 310 | |
| Boys | 51.7 ± 2.0 | 48–58 | 148 |
| Girls | 52.6 ± 1.8 | 47–57 | 162 |
| Age of the mother at delivery (years) | 31.8 ± 4.6 | 19–46 | 310 |
| Head circumference at 9 month (cm) | 45.5 ± 1.4 | 310 | |
| Boys | 46.2 ± 1.3 | 43.37–49.53 | 149 |
| Girls | 44.9 ± 1.2 | 41.73–49.67 | 161 |
| Older siblings in the household | 0.56 ± 0.81 | 0–6 | 310 |
| Percent with none | 58.7 | 180 | |
| 1 | 31.0 | 96 | |
| ≥2 | 10.3 | 32 | |
| Education – mother (years) | 15.4 ± 1.8 | 7–17 | 305 |
| Percent with <10 (primary to secondary school) | 2.6 | 8 | |
| >10–13 (high school) | 7.9 | 24 | |
| >13–15.5 (medium to long higher education) | 49.5 | 151 | |
| >15.5 (long higher education) | 40.0 | 122 | |
| Education – father (years) | 15.3 ± 1.9 | 9–17 | 295 |
| Percent with <10 (primary to secondary school) | 1.7 | 5 | |
| >10–13 (high school) | 10.8 | 32 | |
| >13–15.5 (medium to long higher education) | 44.4 | 131 | |
| >15.5 (long higher education) | 43.1 | 127 | |
| Household income (in 100 000 DK kr*) | %: | 304 | |
| <2.0–3.49 | 13.8 | 42 | |
| 3.5–6.49 | 28.0 | 85 | |
| 6.5–7.49 | 23.0 | 70 | |
| 7.5–>8.0 | 35.2 | 107 |
DKK, Danish Kroner; SD, standard deviation. *100 000 DKK equals approximately 13 500 Euro.
Examinations were completed by 94%, 88% and 80% of the children at 9, 18 and 36 months of age, respectively. Anthropometric assessments, dietary recordings and questionnaires about growth, health and development of the child were performed at each visit. The 9‐month examination also included a blood sample for which local anaesthetics (eutectic mixture of local anaesthetics patches with 1 g cream containing 25 mg g−1 lidocaine and 25 mg g−1 prilocaine, AstraZeneca AB, Södertälje, Sweden) was offered for the skin. Blood samples were successfully collected in 272 children at a mean age of 8.6 ± 0.3 months (range 7.5–9.4).
RBC fatty acid analysis
Within half an hour after blood sampling, RBC was isolated from a 2‐mL lithium‐heparin sample by centrifugation (10–15 min, 2300 × G, 4°C). Plasma and buffy coat were removed and the packed RBC was washed three times in 2–3 mL 150 mM NaOH, 1 mM ethylenediaminetetraacetic acid (EDTA) (5 min, 2300 × G, 4°C). The entire procedure was performed on ice and the final packed RBC were reconstituted 1:1 in 150 mM NaOH, 1 mM EDTA and two drops per millilitre RBC solution of 0.1% butylated hydroxytoluene in ethanol was added (final concentration of ∼0.01%). The samples were blown with N2 and frozen at −80°C. On the day of the analysis, lipid was extracted, fatty acid trans‐methylated and the composition was determined by capillary gas chromatography, as previously described (Andersen et al. 2011). The relative amounts of identified fatty acids are given as a percentage of the overall chromatogram area [percent of fatty acids (FA%) ]. Blood sampling and RBC fatty acid analysis was successfully performed in 272 children.
Assessment of psychomotor development
Before attending the 9‐month examinations, the parents filled out a questionnaire about the age at which their child reached milestones of gross motor development, as defined by the World Health Organization: Sitting without support, standing with assistance, hands‐and‐knee crawling, walking with assistance, standing alone and walking alone (Wijnhoven et al. 2004). The same questionnaire was answered before the 18‐month examination to provide information about milestones achievements from 9 to 18 months of age. Of the children with RBC data, 262 children also had milestone data.
At 3 years of age, psychomotor development were assessed by the parent in the third edition of Ages & Stages Questionnaires® (ASQ‐3™; Squires & Bricker 2009), which is designed as a screening tool for developmental delays within abilities, such as communication, gross motor skills, fine motor skills, problem solving and personal and social skills. The questionnaire was translated into Danish in corporation with a professor in psychology. The questionnaire consisted of 30 questions (six per ability), which could be answered with either ‘yes’ (=10), ‘sometimes’ (=5) or ‘not yet’ (=0) – resulting in a score of 0–60 for each ability. If more than two of the six questions were not answered, then that ability was not scored for the child. The average age for answering the ASQ‐3 was 37.2 ± 1.3 months with a range of 34.5–40.6 months. However, 14 children were excluded because the ASQ‐3 was filled out >38.9 months, leaving 241 for analysis of ASQ‐3 skills vs. RBC–DHA.
Statistics
Data are presented as mean ± standard deviation for normally distributed variables, as percent for categorical variables or as median and interquartile range for not normally distributed variables. All statistical analysis was performed with STATA™ 10.0 (Stata Corporation, College Station, TX, USA) and level of significance was set to 5% (two‐sided tests).
Several of the psychomotor development variables were dependent on gender and all analysis was thus, carried out separately for each gender. Student's t‐test was used to compare means of continuous outcomes between boys and girls, whereas Mann–Whitney U‐test was applied for not normally distributed continuous and ordinal variables. The ASQ‐3 data were not normally distributed, and scores for each ASQ‐3 skill was grouped into four approximately equal‐sized groups (near‐quartiles); 0–49.9, 50–54.9, 55–59.9 and 60. Correlation analysis between age of reaching milestones and 3‐year ASQ‐3 abilities scores was performed by Spearman's test.
Binary correlation analyses were also performed with RBC–DHA (FA%) and the outcome variables: the six milestone ages (as continuous variables in weeks) and the five ASQ‐3 abilities (in score‐interval groups). For the five ASQ‐3 abilities, we furthermore performed ordinal logistic regression analysis, providing an estimate of the likelihood of obtaining a given score or more relative to a lower score with an increase in exposure.
Multiple regression analysis was performed for each of the six continuous milestone variables both controlling for sex and for boys and girls separately. Potential confounding factors and covariates to be included in the statistical analysis were picked if they had previously been shown to be, or they are theoretically inferred to be, associated with the outcome. We included all covariates of a priori interest, namely; infant sex, birth weight, maternal age at delivery, number of older siblings, head circumference at 9 months of age, maternal education, household income, age at introduction to fish and age at completion of the ASQ‐3. Smoking in the home and during pregnancy has been shown to be potential confounders of psychomotor development (Auestad et al. 2003; Bakker et al. 2003; Oken et al. 2008). However, only four mothers had smoked 11–30 cigarettes per day during pregnancy and 19 < 10 cigarettes per day, six children came from a smoking home, and five children from an only almost non‐smoking home (<1 cigarette per day). Therefore, we did not include any of these smoking parameters in the analyses, and subsequent analysis showed that they did not appreciably change results (data not shown).
We performed multiple logistic regression analysis and analysis of covariance for each of the ASQ‐3 abilities and age of reaching milestones, respectively. In both types of analysis, all the mentioned covariates were included in the first model, followed by a backward exclusion of non‐significant variables (P > 0.05) one at a time by the variables with the highest P‐value. Model plots of predicted values against standardized residuals were examined and a ‘trumpet‐shaped’ fan opening pattern was seen for standing with support, so we used log10 of this variable to achieve a more random pattern.
Results
The majority of the children (64%) had fish introduced in their diet at around 8 months of age (♂ 8.1 ± 1.5 and ♀ 8.2 ± 1.6), and relatively few were given fish oil supplements (0.6% and 7.5% at 9 and 18 months of age, respectively). Table 2 show the overall RBC fatty acid composition at 9 months of age. DHA was found to range from 2.2 to 12.6 FA% (Fig. 1), and did not differ between boys and girls (data not shown).
Table 2.
Erythrocyte fatty acid composition in the infants at 9 months of age
| Fatty acid | Mean ± SD (FA %) |
|---|---|
| SFA | 34.1 ± 3.0 |
| MUFA | 17.5 ± 2.0 |
| PUFA | 45.9 ± 4.4 |
| n‐6 PUFA | 34.2 ± 3.5 |
| 18:2 n‐6 | 12.93 ± 2.01 |
| 20:3 n‐6 | 1.54 ± 0.40 |
| 20:4 n‐6 (AA) | 16.62 ± 2.90 |
| 22:4 n‐6 | 3.16 ± 0.69 |
| 22:5 n‐6 | 1.07 ± 1.01 |
| n‐3 PUFA | 10.0 ± 2.4 |
| 18:3 n‐3 | 0.23 ± 0.13 |
| n‐3 LCPUFA | 9.80 ± 2.42 |
| 20:5 n‐3 (EPA) | 0.73 ± 0.37 |
| 22:5 n‐3 | 2.26 ± 0.46 |
| 22:6 n‐3 (DHA) | 6.59 ± 1.97 |
| Ratio n‐6/n‐3 PUFA | 3.62 ± 1.01 |
SD, standard deviation; FA, fatty acid; n‐3 LCPUFA, n‐3 long‐chain polyunsaturated fatty acids; EPA, eicosapentaenoic acid; DHA, docosahexaenoic acid; SFA, saturated fatty acid; MUFA, monounsaturated fatty acid; PUFA, polyunsaturated fatty acid. Values are given as mean ± SD (n = 272, 135 boys and 137 girls).
Figure 1.
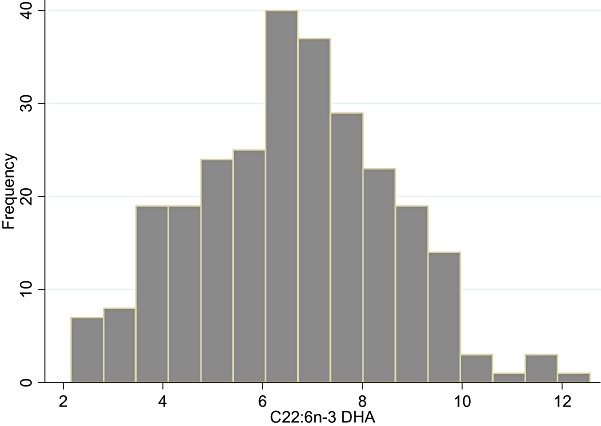
Distribution histogram of erythrocyte docosahexaenoic acid levels in the children.
We found that boys had faster milestone development – with respect to crawling and walking (Table 3). Girls were found to have higher scores at 3 years of age in the ASQ‐3 abilities ‘fine motor’ and ‘personal and social skills’ (Table 3). We found no significant difference between boys and girls with respect to parental education and household income (data not shown).
Table 3.
Difference between the boys and the girls in psychomotor development assessed by age to reach World Health Organization milestones and ASQ‐3 developmental scores at 3 years
| Girls | n | Boys | n | P‐value | |
|---|---|---|---|---|---|
| Mean ± SD (weeks) | Mean ± SD (weeks) | ||||
| Age at reach of milestones | |||||
| Sitting without support | 28.45 ± 4.55 | 160 | 28.56 ± 4.03 | 142 | 0.847 |
| Standing with assistance | 39.12 ± 8.04 | 140 | 38.28 ± 8.75 | 120 | 0.386 |
| Hands‐ and knee‐crawling | 40.48 ± 9.76 | 136 | 38.36 ± 7.09 | 126 | 0.047 |
| Walking with assistance | 46.06 ± 8.94 | 129 | 43.56 ± 7.87 | 120 | 0.021 |
| Standing alone | 50.71 ± 6.91 | 119 | 49.66 ± 7.87 | 112 | 0.284 |
| Walking alone | 56.53 ± 6.95 | 133 | 54.67 ± 7.55 | 130 | 0.039 |
| ASQ‐3 sub‐scales score | Median (IQR) (n = 128) | Median (IQR) (n = 113) | |||
| Communication | 50 (50–55) | 50 (50–55) | 0.142 | ||
| Gross motor | 60 (55–60) | 60 (55–60) | 0.802 | ||
| Fine motor | 55 (45–60) | 50 (40–55) | 0.002 | ||
| Problem solving | 55 (50–60) | 55 (50–60) | 0.940 | ||
| Personal & social skills | 60 (55–60) | 55 (50–55) | <0.001 | ||
ASQ‐3, Ages and Stages Questionnaire, third edition; SD, standard deviation; IQR, interquartile range. For age when reaching milestones for girls and boys the values in the groups are given as mean ± SD and n along with P‐values from a Student's t‐test comparison. Data for the ASQ‐3 score for boys and girls at 3 years of age for each of the five ASQ‐3 themes are not normally distributed, so values in the groups are given as median and IQR with 75–25 percentile along with P‐values from Mann–Whitney U‐test/two‐sample Wilcoxon rank‐sum comparison.
No beneficial association was observed between RBC–DHA and age of reaching milestones (Supporting Information Table S1) and most of the ASQ‐3 abilities at 3 years of age (Table 4). However, we did find an inverse association between RBC–DHA and the ASQ‐3 ability ‘communication’, especially for girls (Table 4, Fig. 2), with the odds ratio for attaining a higher ASQ‐3 score at 0.69 per percent increment in RBC–DHA.
Table 4.
The association between erythrocyte DHA and ASQ‐3 score controlling for sex and for boys and girls separately
| ASQ‐3 score | Odds ratio | 95% CI | P‐value | Pseudo R 2 |
|---|---|---|---|---|
| Communication | 0.86 † | (0.754–0.983) | 0.026 | 0.0106 |
| Boys ‡ | 0.99 | (0.839–1.188) | 0.989 | 0.0000 |
| Girls ‡ | 0.69 | (0.562–0.858) | 0.001 | 0.0450 |
| Gross motor | 0.99 † | (0.865–1.139) | 0.916 | 0.0004 |
| Boys ‡ | 1.04 | (0.859–1.249) | 0.708 | 0.0007 |
| Girls ‡ | 0.94 | (0.764–1.159) | 0.564 | 0.0015 |
| Fine motor | 0.98 † | (0.862–1.106) | 0.709 | 0.0146 |
| Boys ‡ | 1.04 | (0.872–1.226) | 0.680 | 0.0007 |
| Girls ‡ | 0.91 | (0.761–1.093) | 0.318 | 0.0034 |
| Problem solving | 0.99 † | (0.871–1.118) | 0.829 | 0.0002 |
| Boys ‡ | 1.06 | (0.897–1.248) | 0.504 | 0.0016 |
| Girls ‡ | 0.90 | (0.742–1.093) | 0.290 | 0.0041 |
| Personal & social skills | 0.97 † | (0.861–1.100) | 0.664 | 0.0490 |
| Boys ‡ | 0.96 | (0.824–1.131) | 0.659 | 0.0007 |
| Girls ‡ | 0.98 | (0.804–1.197) | 0.847 | 0.0002 |
DHA, docosahexaenoic acid; ASQ‐3, Ages and Stages Questionnaire, third edition; CI, confidence interval; FA%, percent of fatty acids. Values are given with odds ratio per FA% increment in erythrocyte DHA, CI along with P‐value and pseudo R 2 †from ordinal logistic regression analysis controlling for sex and ‡from ordinal logistic regression analysis with boys and girls separately (n = 212, 109 girls and 103 boys). Pseudo R 2 is the part of the variance, which can be explained.
Figure 2.
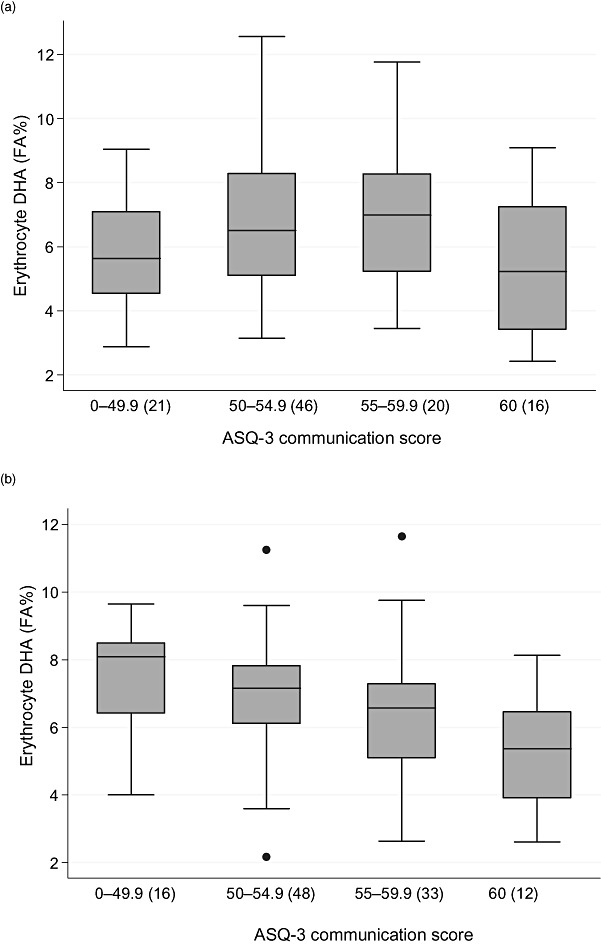
Erythrocyte level of docosahexaenoic acid (DHA) in the different score groups for communicative ability assessed by Ages and Stages Questionnaire, third edition (ASQ‐3) for boys (a) and girls (b). The boxes represent the individual values between twenty‐fifth and seventy‐fifth percentile, the horizontal being the median, the error bars gives the range of the values and dots represents outliers. DHA levels are given as percentage of all fatty acids in the erythrocytes (FA%).
The ASQ‐3 scores at 3 years of age correlated with age of reaching milestones (Table 5). For four out of six associations between the ASQ‐3 ability ‘gross motor skills’ and milestones were significantly negative – i.e. those who reached the milestones fastest also had higher scores at 3 years of age. Separately, in the gender analysis, three of the milestone–ASQ‐3 ‘gross motor’ associations came out significant for the boys, whereas no correlations were seen for the girls. However, for the girls, we saw a significant negative correlation between age of reaching milestones and the ASQ‐3 abilities ‘fine motor’ and ‘personal and social skills’ at 3 years of age.
Table 5.
Correlations between 3‐year ASQ‐3 developmental score and age of reaching milestones for girls and boys separately and together
| ASQ‐3 score/milestones | Communication | Gross motor | Fine motor | Problem solving | Personal and social skills | ||||||||||
|---|---|---|---|---|---|---|---|---|---|---|---|---|---|---|---|
| Girls | Boys | All | Girls | Boys | All | Girls | Boys | All | Girls | Boys | All | Girls | Boys | All | |
| Sitting without support | −0.164 | 0.101 | −0.037 | −0.163 | −0.294 (0.002) | −0.227 (0.001) | −0.218 (0.015) | −0.082 | −0.140 (0.032) | −0.065 | −0.133 | −0.093 | −0.098 | −0.100 | −0.091 |
| Standing with assistance | −0.139 | −0.109 | −0.119 | −0.131 | −0.225 (0.028) | −0.181 (0.009) | −0.278 (0.002) | −0.042 | −0.139 (0.045) | −0.106 | −0.129 | −0.118 | −0.187 (0.046) | −0.186 | −0.144 (0.038) |
| Hands‐ and knee‐crawling | −0.106 | 0.093 | 0.004 | −0.018 | −0.001 | −0.012 | −0.102 | 0.038 | −0.011 | −0.087 | 0.050 | −0.021 | −0.164 | −0.081 | −0.075 |
| Walking with assistance | −0.139 | −0.001 | −0.049 | −0.159 | −0.136 | −0.165 (0.017) | −0.133 | 0.039 | −0.040 | −0.144 | −0.074 | −0.121 | −0.214 (0.024) | −0.157 | −0.115 |
| Standing alone | −0.079 | −0.007 | −0.030 | −0.028 | −0.207 (0.049) | −0.118 | −0.011 | −0.050 | −0.025 | −0.027 | −0.114 | −0.063 | −0.229 (0.018) | −0.114 | −0.136 |
| Walking alone | −0.178 | −0.041 | −0.089 | −0.069 | −0.183 | −0.132 (0.049) | −0.063 | −0.017 | −0.024 | −0.022 | −0.073 | −0.042 | −0.215 (0.019) | −0.046 | −0.085 |
ASQ‐3, Ages and Stages Questionnaire, third edition. The given values are correlations coefficients and P‐values in brackets, if significant. Non‐parametric correlations analysis: Spearman's rank correlations coefficients.
Discussion
In this study of 272 healthy Danish children, we observed an inverse association between RBC–DHA level and communication for girls at 3 years of age, but no association was found for any other measures of psychomotor development. For boys, reaching milestones at young age correlated with higher gross motor development score at 3 years of age, whereas girls, who reached milestones early, had higher scores in fine motor development and personal and social skills at 3 years of age. Curiously, for each of the genders, milestones were associated with exactly the later psychomotor abilities where that gender seems to have their strong sides.
Our results point towards DHA as having a possible unbeneficial effect on language development, which is in conflict with studies that found a beneficial influence in relation to child development. However, results from earlier studies have looked at a number of different aspects of child development and the results in children born at term are inconsistent. Our results of an inverse association between DHA and communicative development in children are in line with previous studies (Scott et al. 1998; Lauritzen et al. 2005; Makrides et al. 2010). In their most recent study, Makrides et al. found that girls exposed to a high dose of DHA in utero, via DHA supplementation of their pregnant mothers, had lower language scores assessed by the Bayley Scales of Infant Development (third edition) at 18 months of age and were more likely to have a delayed language development than girls from the control group (Makrides et al. 2010). Furthermore, in a previous study, we observed an inverse association between RBC–DHA at 4 months and MacArthur verbal comprehension at 12 months of age in children, whose mothers were supplemented with fish oil in the first 4 months of lactation (Lauritzen et al. 2005), but in this case, most pronounced in the boys.
At present, there are conflicting results on whether a negative effect of early intake of DHA on language development indicates a long‐term overall slow development, or if the effect might just be transient. Scott et al. (1998) found an adverse effect on language development with the MacArthur Communicative Inventories at 14 months of age in children who were fed DHA‐enriched formula (Scott et al. 1998), but this was only transient, as no difference was seen at 39 months of age in receptive and language expression assessed by the Revised Peabody Picture Vocabulary test (Scott et al. 1998; Auestad et al. 2003). On the other hand, in our previous study (Lauritzen et al. 2005), the decrement in language comprehension at 12 months was found to correlate with lower prosocial scores at 7 years of age – again only in boys (Cheatham et al. 2011).
Language acquisition in early childhood shows great variation, e.g. a Danish 3‐year‐old child has a mean vocabulary of 600 words with a variation of 500 words (Bleses et al. 2008b). Parental education has been shown to affect many aspects of psychomotor development (Kaplan et al. 2001), including language, which is found to correlate inversely with maternal education in both small children and toddlers (Fenson et al. 2000; Lauritzen et al. 2005). It is widely acknowledged that language acquisition occurs in interplay with innate abilities and experience with linguistic and social input. Therefore, it is possible that children of more educated parents are presented to a more complex language, prolonging their development process, but that they may speed up their language acquisition later. Of the five ASQ‐3 abilities, only personal and social skills were correlated to years of maternal education in the present study (data not shown).
The assessment of psychomotor development in children is complex. Furthermore, comparison of results of different studies of the influence of DHA is often compromised by differences in age of supplementation, length of the follow‐up period and types of tests. In the present study, child age at completion of the ASQ‐3 questionnaire was explanatory for all skills except ‘communication’. Thus, the developmental pattern for language and communication differed from that of other skills such as problem solving, personal and social skills, and gross motor development. Cultural differences could affect the appropriateness of an American questionnaire in Danish children. Compared with American children, Danish children spend more time in institutions from an early age, and this may contribute to a slow language development (Bleses et al. 2008a). Furthermore, the questions originate from other norms – e.g. one of the questions is whether the child when asked ‘what is your name?’ answers with their full name, which Danish children rarely do at any age. Moreover, as the questions are phrased, they assess the ability of the child to follow instructions in addition to actually understanding them. Thus, differences in the responses of girls and boys may be due to differences in temperament and upbringing.
With RBC fatty acid data from 272 children at 9 months of age, this study is unique in size compared with earlier studies. Furthermore, few studies have investigated associations during the complementary feeding period. The rather large variation in RBC–DHA in this cohort is a great advantage in an association study like the present study, as this increase power and the chance that it includes most of the relevant functional range. The variation in RBC–DHA in the present population is due in part to variation both in length of breastfeeding and intake of fish (L. Harsløf, ‘unpublished observations’), which is relatively high in Danes compared with most other countries (Welch et al. 2002). This may compromise comparison with other studies exploring the relationship between early n‐3 LCPUFA intake and cognitive function. It is also an advantage that the children are followed in a relatively long period with assessment of the development at various time points and both as age of reaching milestones and developmental scores at 3 years of age. The fact that we saw correlation between the two types of outcome measures shows a consistency in development and that the two questionnaires identify a continuum of development within the same domain. However, the children in this population approached the upper limits of the score range for many of the ASQ‐3 abilities, gross motor development specifically, and this may have lowered the sensitivity of the ASQ‐3 in relation to our research question. The ASQ‐3 questionnaire was translated from English for the present study by professional linguists, and we therefore believe that previous validations on the questionnaire in English and other languages (Squires et al. 1997; Richter & Janson 2007; Gollenberg et al. 2010; and Guiberson et al. 2011) will also apply to this version, but we did not undertake a separate validation. Also, a limited sensitivity must be expected when using a screening questionnaire like the ASQ‐3. The study has some other potential weaknesses, most notably the lack of a measure of parental intelligence and assessment of the home environment; inclusion of these might have reduced noise. It is always reasonable to discuss whether a result could be due to chance, especially when only one of a number of outcomes turns out as significant. However, as the significant association was seen between RBC–DHA and communication, which is in line with earlier studies, the results should not just be disclaimed as due to chance.
Conclusion
Presently, we assume that the need for DHA the first 6 months of life is high, but we know little about the importance during complementary feeding. In this study, we wished to clarify the importance of RBC–DHA status during complementary feeding, but the results were not as hypothesized. Generally, no beneficial influence was seen for high DHA levels at 9 months on psychomotor development up to 3 years of age. However, communication deviated from the other skills as RBC–DHA level at 9 months of age was inversely associated with the ASQ‐3 communication score at 3 years of age for girls. The study is the first study with RBC data from the weaning period and the results underline the need to look more into, whether the influence of DHA on communication is transient or linked to cognitive development in later childhood. Furthermore, the study raises a need to examine in more detail how and why boys and girls respond differently to high DHA levels.
Source of funding
The work was supported by a grant from the Danish Directorate for Food, Fisheries and Agriculture Business.
Conflicts of interest
The authors declare that they have no conflicts of interest.
Contributions
KFM and LL are responsible for the initial idea of the study, SE analysed and interpreted the data and wrote the initial draft of the manuscript with some assistance from KMHT and LL, who also provided statistical guidance in data analyses. LIH was responsible for the FA analysis, and he and KFM assisted in the interpretation of results. All co‐authors participated in manuscript preparation and critically reviewed all sections of the text for important intellectual content.
Supporting information
Table S1. Estimated linear relationships between docosahexaenoic acid status in erythrocytes at 9 month of age (FA%) and age of reaching developmental milestones in Danish boys and girls.
Supporting info item
Acknowledgement
We gratefully acknowledge the help of PhD students Anja Lykke Madsen, Line Brinch Christensen Katrine T. Andersen and Laurine Harsløf, who did much of the data collection; lab technicians Inge Rasmussen and Vivian Anker, who collected the blood samples; and Jannie Agersten for her skilled analysis of RBC FA composition.
References
- Andersen A.D., Michaelsen K.F., Hellgren L.I., Trolle E. & Lauritzen L. (2011) A randomized controlled intervention with fish oil versus sunflower oil from 9 to 18 months of age – exploring changes in growth and skinfold thickness. Pediatric Research 70, 368–374. doi: 10.1203/PDR.0b013e318229007b. [DOI] [PubMed] [Google Scholar]
- Anderson J.W., Johnstone B.M. & Remley D.T. (1999) Breast‐feeding and cognitive development: a meta‐analysis. The American Journal of Clinical Nutrition 70, 525–535. [DOI] [PubMed] [Google Scholar]
- Auestad N., Scott D.T., Janowsky J.S., Jacobsen C., Carroll R.E. & Montalto M.B. (2003) Visual, cognitive, and language assessments at 39 months: a follow‐up study of children fed formulas containing long‐chain polyunsaturated fatty acids to 1 year of age. Pediatrics 112, 177–183. [DOI] [PubMed] [Google Scholar]
- Bakker E.C., Ghys A.J., Kester A.D., Vles J.S., Dubas J.S., Blanco C.E. et al (2003) Long‐chain polyunsaturated fatty acids at birth and cognitive function at 7 y of age. European Journal of Clinical Nutrition 57, 89–95. [DOI] [PubMed] [Google Scholar]
- Bleses D., Vach W., Slott M., Thomsen P., Madsen T.O. & Basbøll H. (2008a) Early vocabulary development in Danish and other languages: a CDI‐based comparison. Journal of Child Language 35, 619–650. doi:10.1017/S0305000908008714. [DOI] [PubMed] [Google Scholar]
- Bleses D., Vach W., Slott M., Wehberg S., Thomsen P., Madsen T.O. et al (2008b) The Danish communicative developmental inventories: validity and main developmental trends. Journal of Child Language 35, 651–669. doi:10.1017/S0305000907008574. [DOI] [PubMed] [Google Scholar]
- Calder P.C., Dangour A.D., Diekman C., Eilander A., Koletzko B., Meijer G.W. et al (2010) Review. Essential fats for future health. Proceedings of the 9th Unilever Nutrition Symposium, 26–27 May 2010. European Journal of Clinical Nutrition 64 (Suppl. 4), 1S–13S. [DOI] [PubMed] [Google Scholar]
- Caspi A., Williams B., Kim‐Cohen J., Craig I.W., Milne B.J., Poulton R. et al (2007) Moderation of breastfeeding effects on the IQ by genetic variation in fatty acid metabolism. Proceedings of the National Academy of Sciences of the United States of America 104, 18860–18865. [DOI] [PMC free article] [PubMed] [Google Scholar]
- Cheatham C.L., Nerhammer A.S., Asserhøj M., Michaelsen K.F. & Laurtizen L. (2011) Fish oil supplementation during lactation: effects on cognition and behaviour at 7 years of age. Lipids 46, 637–645. doi:10.1007/s11745‐011‐3557‐x. [DOI] [PubMed] [Google Scholar]
- Dunstan J.A., Simmer K., Dixon G. & Prescott S.L. (2006) Cognitive assessment of children at age 2 (1/2) years after maternal fish oil supplementation in pregnancy: a randomised controlled trial. Archives of Disease in Childhood. Fetal and Neonatal Edition 93, F45–F50. [DOI] [PubMed] [Google Scholar]
- Eilander A., Hundscheid D.C., Osendarp S.J., Transler C. & Zock P.L. (2007) Effects of n‐3 long chain polyunsaturated fatty acid supplementation on visual and cognitive development throughout childhood: a review of human studies. Prostaglandins, Leukotrienes, and Essential Fatty Acids 76, 189–203. [DOI] [PubMed] [Google Scholar]
- Farquharson J., Cockburn F., Patrick W.A., Jamieson E.C. & Logan R.W. (1992) Infant cerebral cortex phospholipid fatty‐acid composition and diet. Lancet 340, 810–813. [DOI] [PubMed] [Google Scholar]
- Fenson L., Bates E., Dale P., Goodman J., Reznick J.S. & Thal D. (2000) Measuring variability in early child language: don't shoot the messenger. Child Development 71, 323–328. [DOI] [PubMed] [Google Scholar]
- Gibson R.A., Neumann M.A. & Makrides M. (1997) Effect of increasing breast milk docosahexaenoic acid on plasma and erythrocyte phospholipid fatty acids and neural indices of exclusively breast fed infants. European Journal of Clinical Nutrition 51, 578–584. [DOI] [PubMed] [Google Scholar]
- Gollenberg A.L., Lynch C.D., Jackson L.W., McGuinness B.M. & Msall M.E. (2010) Concurrent validity of the parent‐completed Ages and Stages Questionnaires, 2nd Ed. with the Bayley Scales of Infant Development II in a low‐risk sample. Child Care, Health and Development 36, 485–490. [DOI] [PubMed] [Google Scholar]
- Gondolf U.H., Tetens I., Michaelsen K.F. & Trolle E. (2012) Dietary habits of partly breast‐fed and completely weaned infants at 9 months of age. Public Health Nutrition 15, 578–586. [DOI] [PubMed] [Google Scholar]
- Guiberson M., Rodríguez B.L. & Dale P.S. (2011) Classification accuracy of brief parent report measures of language development in Spanish‐speaking toddlers. Language, Speech, and Hearing Services in Schools 42, 536–549. [DOI] [PubMed] [Google Scholar]
- Helland I.B., Smith L., Saarem K., Saugstad O.D. & Drevon C.A. (2003) Maternal supplementation with very‐long‐chain n‐3 fatty acids during pregnancy and lactation augments children's IQ at 4 years of age. Pediatrics 111, 39–44. [DOI] [PubMed] [Google Scholar]
- Hibbeln J.R., Davis J.M., Steer C., Emmet P., Roger I., Williams C. et al (2007) Maternal seafood consumption in pregnancy and neurodevelopmental outcomes in childhood (ALSPAC study): an observational cohort study. Lancet 369, 578–585. [DOI] [PubMed] [Google Scholar]
- Horta B.L., Bahl R., Martines J.C. & Victora C.G. (2007) Evidence on the long‐term effects of breastfeeding: systematic review and meta‐analyses. WHO Library Cataloguing‐in‐Publication Data Evidence .
- Jensen C.L., Voigt R.G., Prager T.C., Zou Y.L., Fraley J.K., Rozelle J.C. et al (2005) Effects of maternal docosahexaenoic acid intake on visual function and neurodevelopment in breastfed term infants. The American Journal of Clinical Nutrition 82, 125–132. [DOI] [PubMed] [Google Scholar]
- Judge M.P., Harel O. & Lammi‐Keefe C.J. (2007) Maternal consumption of a docosahexaenoic acid‐containing functional food during pregnancy: benefit for infant performance on problem‐solving but not on recognition memory tasks at age 9 mo. The American Journal of Clinical Nutrition 85, 1572–1577. [DOI] [PubMed] [Google Scholar]
- Kaplan G.A., Turell G., Lynch J.W., Everson S.A., Helkala E.L. & Salonen J.T. (2001) Childhood socioeconomic position and cognitive function in adulthood. International Journal of Epidemiology 30, 256–263. [DOI] [PubMed] [Google Scholar]
- Lauritzen L., Hansen H.S., Jorgensen M.H. & Michaelsen K.F. (2001) The essentiality of long chain n‐3 fatty acids in relation to development and function of the brain and retina. Progress in Lipid Research 40, 1–94. [DOI] [PubMed] [Google Scholar]
- Lauritzen L., Jorgensen M.H., Olsen S.F., Straarup E.M. & Michaelsen K.F. (2005) Maternal fish oil supplementation in lactation: effect on developmental outcome in breast‐fed infants. Reproduction, Nutrition, Development 45, 535–547. [DOI] [PubMed] [Google Scholar]
- Madsen A.L., Schack‐Nielsen L., Larnkjaer A., Molgaard C. & Michaelsen K.F. (2010) Determinants of blood glucose and insulin in healthy 9‐month‐old term Danish infants; the SKOT cohort. Diabetic Medicine: A Journal of the British Diabetic Association 27, 1350–1357. [DOI] [PubMed] [Google Scholar]
- Makrides M., Neumann M.A., Byard R.W., Simmer K. & Gibson R.A. (1994) Fatty acid composition of brain, retina, and erythrocytes in breast‐ and formula‐fed infants. The American Journal of Clinical Nutrition 60, 189–194. [DOI] [PubMed] [Google Scholar]
- Makrides M., Gibson R.A., McPhee A.J., Yelland L., Quinlivan J., Ryan P. et al (2010) Effect of DHA supplementation during pregnancy on maternal depression and neurodevelopment of young children. A randomized controlled trial. JAMA: The Journal of the American Medical Association 304, 1675–1683. [DOI] [PubMed] [Google Scholar]
- Martinez M. (1992) Tissue levels of polyunsaturated fatty acids during early human development. Journal of Pediatrics 120, 129–138. [DOI] [PubMed] [Google Scholar]
- McCann J.C. & Ames B.N. (2005) Is docosahexaenoic acid, an n‐3 long‐chain polyunsaturated fatty acid, required for development of normal brain function? An overview of evidence from cognitive and behavioral tests in humans and animals. American Journal of Clinical Nutrition 82, 281–295. [DOI] [PubMed] [Google Scholar]
- Oken E., Osterdal M.L., Gillman M.W., Knudsen V.K., Halldorsson T.I., Strøm M. et al (2008) Associations of maternal fish intake during pregnancy and breastfeeding duration with attainment of developmental milestones in early childhood: a study from the Danish National Birth Cohort. American Journal of Clinical Nutrition 88, 789–796. [DOI] [PMC free article] [PubMed] [Google Scholar]
- Richter J. & Janson H. (2007) A validation study of the Norwegian version of the ages and stages questionnaires. Acta Paediatrica (Oslo, Norway: 1992) 96, 748–752. [DOI] [PubMed] [Google Scholar]
- Sacker A., Quigley M.A. & Kelly Y.J. (2006) Breastfeeding and developmental delay: findings from the millennium cohort study. Pediatrics 118, 682–689. [DOI] [PubMed] [Google Scholar]
- Schwartz J., Dube K., Sichert‐Hellert W., Kannenberg F., Kunz C., Kalhoff H. et al (2009) Modification of dietary polyunsaturated fatty acids via complementary food enhances n‐3 long‐chain polyunsaturated fatty acid synthesis in healthy infants: a double blinded randomised controlled trial. Archives of Disease in Childhood 94, 876–882. [DOI] [PubMed] [Google Scholar]
- Scott D.T., Janowsky J.S., Carroll R.E., Taylor J.A., Auestad N. & Montalto M.B. (1998) Formula supplementation with long‐chain polyunsaturated fatty acids: are there developmental benefits? Pediatrics 102, e59. [DOI] [PubMed] [Google Scholar]
- Squires J. & Bricker D. (2009) Ages & Stages Questionnaires®, Third Edition (ASQ‐3™) Questionnaires. Paul H. Brookes Publishing Co., Inc.: Baltimore, MD. [Google Scholar]
- Squires J., Bricker D. & Potter L. (1997) Revision of a parent‐completed development screening tool: ages and stages questionnaires. Journal of Pediatric Psychology 22, 313–328. [DOI] [PubMed] [Google Scholar]
- Steer C.D., Smith G.D., Emmett P.M., Hibbeln J.R. & Golding J. (2010) FADS2 polymorphisms modify the effect of breastfeeding on child IQ. PLoS ONE 5, e11570. doi:10.1371/journal.pone.0011570. [DOI] [PMC free article] [PubMed] [Google Scholar]
- Tanaka T., Shen J., Abecasis G.R., Kisialiou A., Ordovas J.M., Guralnik J.M. et al (2009) Genome‐wide association study of plasma polyunsaturated fatty acids in the InCHIANTI study. PLoS Genetics 5, e1000338. doi:10.1371/journal.pgen.1000338. [DOI] [PMC free article] [PubMed] [Google Scholar]
- Welch A.A., Lund E., Amiano P., Dorronsoro M., Brustad M., Kumle M. et al (2002) Variability of fish consumption within the 10 European countries participating in the European Investigation into Cancer and Nutrition (EPIC) study. Public Health Nutrition 5, 1273–1285. [DOI] [PubMed] [Google Scholar]
- Wijnhoven T.M., de Onis M., Onyango A.W., Wang T., Bjoerneboe G.E., Bhandari N. et al (2004) Assessment of gross motor development in the WHO Multicentre Growth Reference Study. Food and Nutrition Bulletin 25 (Suppl. 1), 37S–45S. [DOI] [PubMed] [Google Scholar]
Associated Data
This section collects any data citations, data availability statements, or supplementary materials included in this article.
Supplementary Materials
Table S1. Estimated linear relationships between docosahexaenoic acid status in erythrocytes at 9 month of age (FA%) and age of reaching developmental milestones in Danish boys and girls.
Supporting info item