

Abstract

| Table of Contents | |
|---|---|
| Abstract | 5 |
| 1. Introduction | 6 |
| 1.1 The current nutrition response to emergencies | 7 |
| 1.1.1 General food distributions (GFD) | 7 |
| 1.1.2 Supplementary feeding programs | 8 |
| 1.1.3 Micronutrient interventions | 9 |
| 1.1.4 LNS as supplements in an emergency nutrition response | 10 |
| 2. Objectives | 11 |
| 3. Methodological approach | 11 |
| 3.1 Dietary intake in emergency nutrition settings and composition of rations for GFD | 11 |
| 3.2 Hypothetical intake from example GFD rations | 12 |
| 3.3 Nutrient composition and adequacy of hypothetical ration | 13 |
| 3.4 Determination of the desired micronutrient composition of LNS | 16 |
| 3.5 Accounting for bioavailability of nutrients from the GFD ration and LNS | 20 |
| 3.6 Cost comparability estimates | 21 |
| 4. Results | 21 |
| 4.1 Nutrient adequacy of ‘typical’ GFD ration | 21 |
| 4.1.1 Hypothetical intake from and nutrient adequacy of ‘typical’ GFD ration for children 6–11 months of age | 21 |
| 4.1.2 Hypothetical intake from and nutrient adequacy of ‘typical’ GFD ration for children 12–35 months of age | 23 |
| 4.1.3 Hypothetical intake from and nutrient adequacy of ‘typical’ GFD ration for pregnant and lactating women (PLW) | 24 |
| 4.2 Nutrient adequacy of ‘revised’ GFD ration with the addition of LNS | 27 |
| 4.2.1 Age‐physiological group specific approach for developing LNS formulation | 30 |
| 4.2.2 ‘Age‐specific’ LNS formulation for 6–35‐month‐old infants and children | 30 |
| 4.2.3 Hypothetical intake from and nutrient adequacy of ‘revised’ GFD ration plus ‘age‐specific’ LNS for 6–35‐month‐old children | 35 |
| 4.2.4 ‘Age‐specific’ LNS formulation for PLW | 35 |
| 4.2.5 Hypothetical intake from and nutrient adequacy of ‘revised’ GFD ration plus ‘age‐specific’ LNS for PLW | 38 |
| 4.3 ‘One‐size‐fits‐all’ approach for developing LNS formulation | 40 |
| 5. Appropriate use and toxicity concerns | 43 |
| 5.1 Potential strategies to ensure appropriate use and to avoid inappropriate consumption | 50 |
| 6. Cost estimates of providing LNS with the ‘revised’ GFD ration | 52 |
| 7. Quality control, nutrient formulation, shelf‐life and packaging | 55 |
| 7.1 Quality control of LNS production | 56 |
| 7.2 Nutrient formulation | 56 |
| 7.3 Shelf‐life and packaging | 56 |
| 8. Discussion | 57 |
| Acknowledgements | 60 |
| Conflicts of interest | 60 |
| References | 60 |
| Appendix 1: Planned general food distribution ration examples used for development of ‘typical’ general food distribution ration | 63 |
| Appendix 2: Nutrient composition of principal food aid commodities used in this document | 65 |
| Appendix 3: Protein adequacy of diets in emergency settings when supplemented with lipid‐based nutrient supplements | 66 |
| List of Tables | ||
|---|---|---|
| Table 1 : | ‘Typical’ GFD ration with CSB, and a ‘revised’ GFD ration with CSB substituted with an equivalent amount of pulse and grain | 12 |
| Table 2 : | Energy requirements of each age/physiologic group | 13 |
| Table 3 : | Hypothetical intake for each age/physiological group from the ‘typical’ GFD ration | 14 |
| Table 4 : | Hypothetical intake for each age/physiological group from the ‘revised’ GFD ration, adjusted for the quantity of LNS that will be added (118 kcal) | 14 |
| Table 5 : | Average nutrient concentrations in mature breast milk (World Health Organization 1998) | 15 |
| Table 6 : | Adequate Intakes (AI) and Recommended Nutrient Intakes (RNIs) and Upper Levels (UL) for 7–11‐month‐old infants (IOM and WHO/FAO 2004) | 17 |
| Table 7 : | Adequate Intakes (AI), Recommended Dietary Allowances (RDAs) or Recommended Nutrient Intakes (RNIs) and Upper Levels (UL) for 1–3‐year‐old (12–35‐month‐old) children (IOM and WHO/FAO 2004) | 18 |
| Table 8 : | Adequate Intakes (AI), Recommended Dietary Allowances (RDAs) or Recommended Nutrient Intakes (RNIs) and Upper Levels (UL) for pregnant women (19+ years of age) (IOM and WHO/FAO 2004) | 19 |
| Table 9 : | Adequate Intakes (AI), Recommended Dietary Allowances (RDAs) or Recommended Nutrient Intakes (RNIs) and Upper Levels (UL) for lactating women (19+ years of age) (IOM and WHO/FAO 2004) | 20 |
| Table 10 : | Hypothetical quantity consumed from each component of the ‘typical’ GFD ration for each age or physiologic group | 21 |
| Table 11 : | Amount of nutrient provided by each ‘typical’ GFD ration (and ‘average’ breast milk intake) and per cent of the daily recommended intake provided for 6–8‐month‐old children. Diets are identified by the type of grain or grain product provided, with all other components equivalent between diets | 24 |
| Table 12 : | Amount of nutrient provided by each ‘typical’ GFD ration (and ‘average’ breast milk intake) and per cent of the daily recommended intake provided for 9–11‐month‐old children. Diets are identified by the type of grain or grain product provided, with all other components equivalent between diets | 25 |
| Table 13 : | Amount of nutrient provided by each ‘typical’ GFD ration (and ‘average’ breast milk intake) and per cent of the daily recommended intake provided for 12–23‐month‐old children. Diets are identified by the type of grain or grain product provided, with all other components equivalent between diets | 26 |
| Table 14 : | Amount of nutrient provided by each ‘typical’ GFD ration and per cent of the daily recommended intake provided for 24–35‐month‐old children. Diets are identified by the type of grain or grain product provided, with all other components equivalent between diets | 27 |
| Table 15 : | Nutrients that exceed the UL from the hypothetical intake from the ‘typical’ GFD ration. Presented by age/physiologic group and identified by the staple grain used in the GFD hypothetical intake (with all other components being equal between diets) | 29 |
| Table 16 : | Amount of nutrient provided by each ‘typical’ GFD ration and per cent of the daily recommended intake provided for pregnant women. Diets are identified by the type of grain or grain product provided, with all other components equivalent between diets | 31 |
| Table 17 : | Amount of nutrient provided by each ‘typical’ GFD ration and per cent of the daily recommended intake provided for lactating women. Diets are identified by the type of grain or grain product provided, with all other components equivalent between diets | 32 |
| Table 18 : | Composition (g) of hypothetical intakes from ‘revised’ GFD ration, taking into account energy content (118 kcal or 236 kcal) to be provided via LNS | 33 |
| Table 19 : | LNS macro‐ and micro‐nutrient content for 6–35‐month‐olds based on the higher of the two daily recommended intake values for 7–11 and 12–35 months (micronutrients only), except where noted | 36 |
| Table 20 : | Amount of nutrient provided by each ‘revised’ GFD ration, breast milk and LNS (6–35 mo formulation) and per cent of the daily recommended intake provided for 6–8‐month‐old children. Diets are identified by the type of grain or grain product provided, with all other components equivalent between diets | 37 |
| Table 21 : | Amount of nutrient provided by each ‘revised’ GFD ration, breast milk and LNS (6–35 mo formulation) and per cent of the daily recommended intake provided for 9–11‐month‐old children. Diets are identified by the type of grain or grain product provided, with all other components equivalent between diets | 38 |
| Table 22 : | Amount of nutrient provided by each ‘revised’ GFD ration, breast milk and LNS (6–35 mo formulation) and per cent of the daily recommended intake provided for 12–23‐month‐old children. Diets are identified by the type of grain or grain product provided, with all other components equivalent between diets | 39 |
| Table 23 : | Amount of nutrient provided by each ‘revised’ GFD ration, breast milk and LNS (6–35 mo formulation) and per cent of the daily recommended intake provided for 24–35‐month‐old children. Diets are identified by the type of grain or grain product provided, with all other components equivalent between diets | 40 |
| Table 24 : | Nutrients that exceed the UL when the 6–35 mo formulation LNS is added to the hypothetical intake from the ‘revised’ GFD ration, and breast milk (when applicable). Presented by age group and identified by the staple grain used in the GFD hypothetical intake (with all other components being equal between diets) | 41 |
| Table 25 : | LNS macro‐ and micro‐nutrient content for pregnant and lactating women (PLW) based on the higher of the two RNI levels for pregnancy and lactation, except where noted | 42 |
| Table 26 : | Amount of nutrient provided by each ‘revised’ GFD diet and LNS (PLW formulation) and per cent of the daily recommended intake provided for pregnant women. Diets are identified by the type of grain or grain product provided, with all other components equivalent between diets | 43 |
| Table 27 : | Amount of nutrient provided by each ‘revised’ GFD diet and LNS (PLW formulation) and per cent of the daily recommended intake provided for lactating women. Diets are identified by the type of grain or grain product provided, with all other components equivalent between diets | 44 |
| Table 28 : | Nutrients that exceed the UL when the PLW LNS formulation is added to the hypothetical intake from the GFD ration. Presented by physiologic group and identified by the staple grain used in the GFD hypothetical intake (with all other components being equal between diets) | 45 |
| Table 29 : | LNS micronutrient content for all groups, ‘one‐size fits all’ approach | 46 |
| Table 30 : | Amount of nutrient provided by each ‘revised’ GFD diet and LNS (‘one size’ formulation) and per cent of the daily recommended intake provided for pregnant women. Diets are identified by the type of grain or grain product provided, with all other components equivalent between diets | 47 |
| Table 31 : | Amount of nutrient provided by each ‘revised’ GFD diet and LNS (‘one size’ formulation) and per cent of the daily recommended intake provided for lactating women. Diets are identified by the type of grain or grain product provided, with all other components equivalent between diets | 48 |
| Table 32 : | Nutrients that exceed the UL when the ‘one‐size’ LNS formulation is added to the hypothetical intake from the GFD ration. Presented by age/physiologic group and identified by the staple grain used in the GFD hypothetical intake (with all other components being equal between diets) | 49 |
| Table 33 : | Toxicity estimates for 6–35‐month‐old children consuming 2–7 times the recommended daily dose of the age‐specific or one‐size LNS formulation (alone) | 49 |
| Table 34 : | Toxicity estimates for 6–35‐month‐old children consuming 2–7 times the recommended daily dose of the PLW LNS formulation (alone) | 50 |
| Table 35 : | Toxicity estimates for PLW consuming 2–7 times the recommended daily dose of the PLW LNS formulation (alone) | 51 |
| Table 36 : | Toxicity estimates for PLW consuming 2–7 times the recommended daily dose of LNS (alone), for the one‐size formulation | 52 |
| Table 37 : | Average commodity cost in US$ per metric ton (MT) of GFD commodities as provided by the Food for Peace commodity calculator for fiscal year 2009 (http://www.usaid.gov/our_work/humanitarian_assistance/ffp/comcalc_new.xls, accessed March 2009) | 53 |
| Table 38 : | Cost estimate (in US$) for ‘typical’ full GFD ration and ‘revised’ full GFD ration (excluding sugar and salt) | 54 |
| Table 39 : | Cost (in US$) of providing the hypothetical diet for each age/physiologic group from the ‘typical’ and ‘revised’ GFD rations, with and without addition of LNS, as well as the per cent change in cost from the current ‘typical’ GFD ration | 54 |
| Table 40 : | Change in total commodity provided (g) for the ‘typical’ GFD diet vs. ‘revised’ GFD diet plus LNS for each age/physiologic group, plus a hypothetical mother–child dyad | 55 |
| Table 41 : | Possible chemical forms of nutrients included in products for infants and young children, and recommended chemical forms for inclusion in LNS | 57 |
| List of Figures | ||
|---|---|---|
| Figure 1 : | Per cent of the daily recommended intake provided by the ‘typical’ general food distribution ration (and ‘average’ breast milk intake) for selected nutrients for 6–8‐month‐old infants. Diets are identified by the type of grain or grain product provided, with all other components equivalent between diets | 22 |
| Figure 2 : | Per cent of the daily recommended intake provided by the ‘typical’ general food distribution ration (and ‘average’ breast milk intake) for selected nutrients for 9–11‐month‐old infants. Diets are identified by the type of grain or grain product provided, with all other components equivalent between diets | 23 |
| Figure 3 : | Per cent of the daily recommended intake provided by the ‘typical’ general food distribution ration (and ‘average’ breast milk intake) for selected nutrients for 12–23‐month‐old infants. Diets are identified by the type of grain or grain product provided, with all other components equivalent between diets | 28 |
| Figure 4 : | Per cent of the daily recommended intake provided by the ‘typical’ general food distribution ration (and ‘average’ breast milk intake) for selected nutrients for 24–35‐month‐old infants. Diets are identified by the type of grain or grain product provided, with all other components equivalent between diets | 28 |
| Figure 5 : | Per cent of the daily recommended intake provided by the ‘typical’ general food distribution ration for selected nutrients for pregnant women. Diets are identified by the type of grain or grain product provided, with all other components equivalent between diets | 29 |
| Figure 6 : | Per cent of the daily recommended intake provided by the ‘typical’ general food distribution ration for selected nutrients for lactating women. Diets are identified by the type of grain or grain product provided, with all other components equivalent between diets | 30 |
| Figure 7 : | Per cent of the daily recommended intake provided by the ‘typical’ general food distribution ration for selected nutrients for a 4‐year‐old child. Diets are identified by the type of grain or grain product provided, with all other components equivalent between diets | 33 |
| Figure 8 : | Per cent of the daily recommended intake provided by the ‘revised’ general food distribution ration for selected nutrients for a 4‐year‐old child. Diets are identified by the type of grain or grain product provided, with all other components equivalent between diets | 34 |
| Figure 9 : | Per cent of the daily recommended intake provided by the ‘typical’ general food distribution ration for selected nutrients for an adult male. Diets are identified by the type of grain or grain product provided, with all other components equivalent between diets | 34 |
| Figure 10 : | Per cent of the daily recommended intake provided by the ‘revised’ general food distribution ration for selected nutrients for an adult male. Diets are identified by the type of grain or grain product provided, with all other components equivalent between diets | 35 |
| List of Acronyms | |
|---|---|
| AI | Adequate intake |
| AMDR | Acceptable macronutrient distribution range |
| CSB | Corn‐soy blend |
| CV | Coefficient of variation |
| EAR | Estimated average requirement |
| EFA | Essential fatty acid |
| EMOP | Emergency operation |
| FAO | Food and Agriculture Organization |
| FBF | Fortified blended food |
| GFD | General food distribution |
| IDP | Internally displaced person |
| IOM | Institute of Medicine |
| IZiNCG | International Zinc Nutrition Consultative Group |
| LNS | Lipid‐based nutrient supplement |
| MAM | Moderate acute malnutrition |
| MNP | Micronutrient powder |
| NOAEL | No observed adverse effect level |
| PLW | Pregnant and lactating women |
| RDA | Recommended dietary allowance |
| RNI | Recommended nutrient intake |
| RUTF | Ready‐to‐use therapeutic food |
| SAM | Severe acute malnutrition |
| SFP | Supplementary (selective) feeding program |
| UL | Upper Level |
| USDA | United States Department of Agriculture |
| USAID | United States Agency for International Development |
| WFP | World Food Program |
| WHO | World Health Organization |
Abstract
The term ‘lipid‐based nutrient supplements’ (LNS) refers generically to a range of fortified, lipid‐based products, including products like Ready‐to‐Use Therapeutic Foods (RUTF) (a large daily ration with relatively low micronutrient concentration) as well as highly concentrated supplements (1–4 teaspoons/day, providing <100 kcal/day) to be used for ‘point‐of‐use’ fortification. RUTF have been successfully used for the management of severe acute malnutrition (SAM) among children in emergency settings. Recent research on smaller doses of LNS for prevention of malnutrition has created interest in their potential use in emergency settings to ensure a more nutritionally adequate ration for the most vulnerable groups [e.g. infants and children between 6 and 24 months of age, and pregnant and lactating women (PLW)]. Currently, the main food and nutrition interventions in emergency settings include general food distribution (GFD) rations, which are provided to the affected population as a whole, and selective (or supplementary) feeding programs (SFP), which are to be provided to nutritionally vulnerable or malnourished individuals. In addition to logistical and operational challenges that may limit the intended effect of these programs, the nutritional quality of the food commodities provided may be insufficient to meet the needs of infants and young children and PLW. Because these subgroups have particularly high nutrient needs for growth and development, meeting these needs is challenging in settings where the ration is limited to a few food commodities, with little access to a diverse diet and bioavailable sources of micronutrients. In recent years, there has been increased attention to adding micronutrient interventions, on top of the other food‐based interventions (such as GFDs and SFPs), to fill micronutrient gaps in diets in emergency settings.
The focus of this document is the potential role of LNS in meeting the nutritional needs of these vulnerable subgroups, with the goal of preventing malnutrition in emergency‐affected populations. The document addresses the desired nutritional formulation of LNS for these target groups, taking into account the expected bioavailability of relevant nutrients and toxicity concerns. It also discusses the recommended chemical forms of the fortificants in LNS; stability and shelf‐life considerations; production, packaging and distribution of LNS in the context of emergencies; and cost implications of the addition of LNS to current GFD rations for vulnerable groups.
To develop the desired nutritional formulation of LNS for these purposes, we calculated the current nutrient content of commonly provided GFD rations and determined the nutritional ‘gaps’ (of both micro‐ and macronutrients) of these rations for each of the target groups (i.e. children 6–35 months of age and PLW). For fat and protein, both quantity and quality were evaluated. Through an iterative process, we determined the formulation of a small dose of LNS that would best meet the recommended nutrient intakes for each group in combination with other foods in the GFD ration [composed of a grain, pulse, oil, sugar and salt, but excluding a fortified blended food (FBF)], as well as breast milk for children 6–24 months of age, while avoiding excess levels of any one nutrient to the extent possible. The composition of the LNS used for these calculations is based on an existing LNS product (Nutributter®, Malaunay, France, Nutriset), but with less sugar and more oil. Two different approaches were used: (1) developing two different formulations of LNS, one to be used for infants and children 6–35 months of age and a separate one for PLW; and (2) developing a single formulation that could be used for all of these subgroups. We used commodity cost data to estimate the cost of adding an LNS product to the GFD ration.
The results indicate that the typical GFD ration currently provided in emergency settings – based on cereals, pulse, an FBF such as corn–soy blend (CSB), oil, salt and sugar – does not meet the nutritional needs of infants and young children and PLW. The hypothetical intake from a ration composed of food aid commodities (based on the current USAID/USDA specifications for exported food aid commodities used in emergency settings), and including breast milk for children 6–24 months of age, provided less than 75% of the recommended intake for several micronutrients for certain age/physiologic groups, including calcium, iron, zinc, B vitamins such as riboflavin, B6 and B12, and fat‐soluble vitamins such as D, E and K. It also generally contained lower than recommended levels of fat and essential fatty acids.
The initial LNS formulation for each target group was designed to provide 100% of the recommended amount (RDA or RNI) for most micronutrients per daily dose (20 g, ∼118 kcal) of LNS. This would ensure consumption of the recommended levels of each nutrient even if the ‘base’ diet changed. However, because such a formulation could provide excess amounts of certain nutrients when consumed in combination with the ‘base’ diet (especially when the ‘base’ diet contains fortified foods), we made adjustments in the LNS formulation when there was a risk of greatly exceeding the Upper Level for certain subgroups and there were relevant concerns about adverse effects from chronic consumption of such amounts. For most nutrients, consumption of toxic amounts is highly unlikely with the proposed LNS formulations.
The ‘one‐size’ LNS formulation was designed so that one ‘dose’ (20 g) would be provided to infants and young children and two ‘doses’ (i.e. 40 g/day) would be provided to PLW. This ‘one‐size’ formulation was based on the LNS formulation developed for children 6–35 months of age. Although the resulting formulation is not a perfect match for the unique nutritional needs of each subgroup, there are several practical advantages to using such an approach.
As anticipated, addition of LNS to the GFD ration, even after eliminating the FBF (e.g. CSB), increases the cost. The ‘revised’ ration without CSB but with LNS would cost 34–52% more (food only) than the ‘typical’ GFD diet for a hypothetical mother–infant pair, depending on how many LNS ‘doses’ were provided to the mother. However, depending on the contribution of food costs to overall program costs, the overall increase in costs may be significantly less. Although cost is an important consideration, options to improve the nutritional quality of foods provided in emergency settings should also be assessed with regard to effectiveness in maintaining and improving nutritional outcomes. Another consideration is whether a specialized product like LNS is more easily targeted to the individuals for whom it is intended, thus reducing inter‐ and intra‐household sharing, a common concern with other fortified products such as CSB. This could have substantial cost implications because programs usually compensate for sharing by inflating the amount of FBF provided.
This document is intended to be a starting point for considering the incorporation of LNS in the food packages provided in emergency settings. Our goal was to examine the potential nutritional benefits but also the challenges of adopting such a strategy. There are many different options for emergency nutrition programs, and there are also many considerations governing which option to choose. This document is intended to encourage further evaluation of all of these options.
Keywords: Lipid‐based nutrient supplements, emergency, fortified‐blended foods, micronutrients
1. Introduction
In recent years, there has been great success with the use of lipid‐based fortified Ready‐to‐Use Therapeutic Foods (RUTF) for management of severe acute malnutrition (SAM) among children, and there is growing attention to the idea of using similar products, but in lower doses, for other target groups. ‘Lipid‐based nutrient supplements’ (LNS) is a term used to describe a broad category of fortified, lipid‐based products, based on similar ingredients but with different concentrations of micronutrients, ranging from products like RUTF (a large daily ration with relatively low micronutrient concentration) to highly concentrated supplements (1–4 teaspoons/day, providing <100 kcal/day) to be used for ‘point‐of‐use’ fortification. Various types of LNS (including RUTF) have been used for target groups such as children with moderate acute malnutrition (MAM) and HIV‐positive women and their children at 6–24 months of age (Ndekha et al. 2005). There is interest in using LNS in emergency settings not just for treatment of SAM, but for prevention of malnutrition by ensuring a more nutritionally adequate ration for the most vulnerable groups [e.g. infants and children between 6 and 24 months of age, and pregnant and lactating women (PLW)].
The ration size of LNS used to date has generally contributed a relatively large percentage of the individual's energy requirements (ranging from 200 kcal/kg body weight/day for treatment of SAM to 500 kcal/day for MAM), which means that the quantity and cost of LNS required are quite high. For prevention of malnutrition, an alternative approach to reduce cost is to provide a more ‘concentrated’ product (i.e. the same amounts of micronutrients in a smaller quantity of food) that can be mixed with the staple foods provided via food assistance programs. The potential role of LNS in improving the nutritional content of foods provided in response to emergencies, with a goal of preventing malnutrition in emergency‐affected populations, will be the focus of this document. The use of LNS for treatment of severe and MAM in children will not be addressed, as therapeutic and supplementary feeding for these purposes is outside the scope of this document and has been previously addressed elsewhere (Prudhon et al. 2006).
1.1 The current nutrition response to emergencies
One of the frequent responses to an emergency situation – whether a sudden‐onset emergency due to a natural disaster, a ‘slow‐onset’ or chronic emergency due to environmental conditions such as drought, or more complex emergencies due to war or civil conflict – is the provision of food for the affected population. In recent years, the number of emergencies requiring humanitarian assistance has increased from an estimated 15 per year in the 1980s to approximately twice that since 2000 (WFP 2006). In 2003, the percentage of World Food Program (WFP) resources used for emergencies was approximately 90% (WFP 2006). However, this allocation also reflects donor practice to give priority to emergencies over longer‐term development objectives. In emergency settings, general food distributions (GFD) are seen as providing ‘general food support’ to the affected population, while ‘nutrition interventions’ have been mainly limited to selective feeding programs (i.e. therapeutic and supplementary feeding), which are used to rehabilitate malnourished children. In some cases, micronutrient interventions (such as provision of single‐ or multi‐micronutrient tablets or powders) which aim to prevent and/or correct particular micronutrient deficiencies are also employed; however, there is limited experience with these interventions in emergency settings. Micronutrient interventions have been recognized as important for meeting the micronutrient needs of particular groups who may not be able to reach their requirements through the food commodities provided in the GFD ration alone.
1.1.1 General food distributions (GFD)
Recommendations for the initial planning of GFD rations in emergencies have been established and agreed upon by international organizations involved in the provision of food aid in emergency contexts (UNHCR/UNICEF/WFP/WHO 2004). These guidelines specify how much energy should be provided in the GFD ration, as well as the proportion of energy in the ration that should come from protein and fat. In planning an emergency food aid ration, the initial planning figure for energy in an ‘adequate’ ration is 2100 kcal per person per day, with at least 10–12% of the energy to be provided as protein, and at least 17% of energy to be provided as fat (UNHCR/UNICEF/WFP/WHO 2004). These recommendations were created to ensure that the food aid ration meets the population's average energy, protein and fat requirements for survival and light activity (UNHCR/UNICEF/WFP/WHO 2004), in other words, to maintain the nutritional status of the affected populations (WFP 2006). Additional information that is gathered during later phases of the emergency on the nutritional status of the population, contextual factors of the emergency that can affect nutritional needs (such as climatic conditions), and any available ‘coping’ mechanisms (such as access to food from other sources) should then be considered to adjust the initial planned ration figures to more adequately estimate the nutritional needs of the affected population.
Although recommendations for addressing micronutrient content of the GFD ration exist, and software to calculate micronutrient adequacy when designing food rations is available, meeting the micronutrient requirements of all groups is challenging. As a consequence, GFD rations frequently do not meet micronutrient requirements for all age groups. The standard GFD ration developed and delivered – usually consisting of a grain, pulse, vegetable oil (generally fortified with vitamin A), a fortified blended food (FBF), sugar and/or salt – is inadequate nutritionally, particularly in the case of micronutrients, for many population subgroups with higher nutritional requirements, including infants, young children, and PLW (Seal & Prudhon 2007). Cereals constitute a large portion of the GFD ration, and though some of the cereals provided are fortified, the ‘anti‐nutrient’ factors (such as phytate and fibre) found in most cereals inhibit the absorption of important micronutrients, particularly iron and zinc. Animal source foods, which provide more bioavailable sources of many micronutrients, are generally not a part of food rations provided in an emergency response. An additional factor that could contribute to poor micronutrient intake among populations receiving a diet primarily limited to food aid commodities is the stability of some vitamins, in particular after cooking. Cooking prior to consumption is required for the FBF (e.g. corn‐soy blend, CSB) and fortified cereals frequently provided as emergency food aid; an assessment of vitamin C and A activity in FBFs showed large losses of both nutrients after typical preparation methods including cooking (SUSTAIN 1999).
In addition, because of logistical and operational difficulties, the ration that is ultimately distributed may not meet the international recommendations for an adequate ration. A review of 37 WFP emergency operations (EMOPs) providing a GFD ration in 2002 showed that 80% of the planned and delivered rations met the recommended protein levels (WFP 2006). However, 68% planned to deliver less than the minimum amount of fat recommended (predominantly supplied by vegetable oil), generally because of cost and shelf‐life concerns (WFP 2006). In terms of supply logistics, there are frequent interruptions and delays in emergency food distribution; from the same review of WFP EMOPs in 2002, two‐thirds experienced at least one pipeline break in distribution, and one‐third of the breaks were caused by delayed arrival or procurement of commodities (WFP 2006). In the event of pipeline breaks, frequent responses are to reduce the general ration size for some beneficiaries, attempt to target the more nutritionally vulnerable, or do away with distribution of certain items entirely. Thus, because of problems with both nutritional composition and delivery, GFDs are likely not meeting the nutritional needs (of either macronutrients or micronutrients) of many individuals in emergency‐affected populations.
1.1.2 Supplementary feeding programs
Because of the recognition that certain population subgroups have greater nutritional needs than others, and are frequently more undernourished, selective or supplementary feeding programs (SFP) that target these ‘vulnerable’ groups were established. These provide a supplement of food (generally consisting of an FBF, such as CSB, as well as sugar and oil, or, increasingly, a ready‐to‐use food) in addition to the GFD ration (if such a distribution is in place). In theory, SFPs in emergencies are designed to operate alongside a GFD so that the food insecurity of a family is addressed and the supplementary food provided to the intended recipient is not shared with the entire family; however, in practice it is not uncommon that families receiving a supplementary food ration are not targeted by the GFD, nor is there consistently a GFD in place. A targeted SFP, implemented when the prevalence of wasting (weight‐for‐length/height <−2 Z‐scores) among children 6–59 months is between 10 and 15%, is by far the most common approach and is aimed at the rehabilitation of moderately wasted children 6–59 months of age and PLW (until their child reaches 6 months of age) identified through active case finding. Occasionally other age groups are also targeted, if the need has been identified, such as malnourished adolescents and elderly people. A blanket SFP, implemented when the overall prevalence of wasting among under‐fives is 15% or more, does not target by nutritional status, but involves distribution of a food supplement to all children 6–59 months of age and PLW. While targeting children with MAM for supplementation can prevent their progression to SAM, which is highly correlated with mortality, targeted SFPs do not prevent malnutrition among those not currently malnourished. In addition, if the non‐malnourished are 100% dependent on the GFD ration, they are not likely meeting their nutritional needs. Adopting a ‘preventive’ approach for the GFD rations, in which targeting is by age/physiologic status rather than nutritional status (for example, all PLW as well as all children 6–24 months of age would receive an improved food ration), may be preferable to effectively prevent malnutrition. These can be designed to operate alongside selective feeding programs to treat acute malnutrition. Such a preventive approach has been recently evaluated in a development setting (i.e. a US Title II Maternal and Child Health and Nutrition program of World Vision/Haiti) and was more effective at reducing malnutrition in the population than a ‘recuperative approach’ that targeted only underweight children (Ruel et al. 2008).
SFPs, as they are carried out in emergency contexts were the focus of a recent review (Navarro‐Colorado 2007). Of the 82 programs reviewed (80 targeted SFPs and 2 blanket SFPs), there was a lack of consistency among program objectives, which included ‘treating moderate malnutrition, preventing severe malnutrition, reducing population malnutrition rates, improving quality of care of malnourished children and improving nutrition and hygiene education’. Addressing micronutrient deficiencies was mentioned in only 15 programs and approximately half of the SFPs were implemented without a GFD in place. In addition, in many instances, no evaluation of the current nutrition situation was performed prior to implementation of the SFP. Of the SFPs with analysable data, approximately 64% achieved a recovery rate of at least 75% during the period of operations reported; however, when ‘non‐response’ values were included in the analysis, only 40% met that same cut‐off. As in GFD programs, substitutions in the commodities provided to the targeted recipients were frequent because of supply disruptions.
1.1.3 Micronutrient interventions
For the groups of individuals who are most at risk of nutritional deficiencies (i.e. infants, young children, PLW) the GFD ration does not adequately address their nutritional needs, both in terms of micro‐ and macronutrients. Recognizing that even fortified food aid commodities may not provide sufficient levels of some micronutrients for these particularly vulnerable groups, WHO/WFP/UNICEF recommend that multi‐micronutrient supplementation be provided to these individuals (WHO/WFP/UNICEF 2007). The feasibility of one approach to meeting this recommendation was evaluated in the context of the emergency response to the 2004 earthquake and subsequent tsunami affecting Indonesia, where micronutrients were provided to internally displaced persons (IDPs) via several different approaches, one of which was a multi‐micronutrient powder (MNP) (‘Vitalita’ Sprinkles®, Fortitech Asia Pacific Sdn. Bhd., Selangor, Malaysia) (de Pee et al. 2007). MNPs are encapsulated vitamins and minerals that are packaged in small sachets and designed to be ‘sprinkled’ into the ‘base’ diet. Like other ‘point of use’ supplements, MNP makes it possible to provide the appropriate amounts of micronutrients needed by each age subgroup (e.g. 6–12 months, 12–23 months) regardless of how much of the family diet they eat, and without the need to make major changes in dietary practices. This is an important advantage over the FBFs commonly used for feeding infants and young children in emergency contexts: because of the variability in consumption of such food products – infants may consume very small amounts (e.g. 10 g dry weight), while children 12–23 months of age may consume far more (e.g. 50–100 g dry weight) – it is very difficult to ensure adequate nutrient intake from a single product with a set level of fortification (Dewey 2003).
In the context of Indonesia after the tsunami in 2004, Sprinkles were distributed on a monthly basis to children 6 months to 12 years of age in the affected area. The distribution was accompanied by an intensive social marketing campaign and training of approximately 7500 government and health volunteer staff, as well as staff from hospitals and local and international NGOs, to promote the appropriate use of the Sprinkles. Overall, coverage was high (reaching 90% of eligible recipients in participating districts 5 months after the tsunami) and mothers' knowledge regarding Sprinkles use was good (both in terms of target age groups and preparation): 83% reported that the product needed to be mixed with solid food, and few mothers (less than 6%) reported that Sprinkles were a product appropriate for children less than 6 months of age. It was not possible to evaluate the nutritional impact of the Sprinkles intervention from the monitoring and evaluation data of the program; however, a survey of IDPs conducted by other investigators showed that children who had received Sprinkles were 25% less likely to have anaemia than similar children who had not received them (CRDNF/NIHRD/SEAMO/UNICEF 2006). The authors highlighted the critical issue of what must be provided alongside the distribution of a completely new product in an emergency setting: because the affected population will most likely not be familiar with the new product's use, its introduction needs to be well planned, including appropriate packaging that provides self‐explanatory pictorial messages on appropriate use and preparation, a social marketing campaign or community mobilization to explain to the recipients the purpose and correct use of the product, and thorough training of staff involved in its distribution. The sudden and often unpredictable nature of many emergencies would necessitate that some steps be taken in advance as preparatory measures – for example, having standard training materials prepared that would only need translation into the appropriate language and having locally available sources of production, or prepositioning needed supplies – so that in the event of an emergency a quick, but thorough, intervention is possible.
1.1.4 LNS as supplements in an emergency nutrition response
Though not yet tested as part of a regular emergency response, LNS might provide some advantages over MNPs or other multi‐micronutrient interventions for meeting the nutritional needs of vulnerable groups. LNS would be considered a micronutrient intervention, but LNS also contain macronutrients (fat, protein and carbohydrate) that may confer important benefits. For example, intake of certain essential fatty acids (EFA) that are provided in LNS has been linked with improved growth and brain development in children (Auestad et al. 2003; Heird & Lapillonne 2005; Eilander et al. 2007; Hadders‐Algra et al. 2007). When added to the regularly consumed ‘base’ diet, the fat content of LNS increases the energy density of foods and may enhance absorption of fat‐soluble vitamins such as vitamin A in settings where the diet provides little energy from fat. As the GFD rations provided in emergencies generally do not include adequate amounts of fat for infants and young children, who should receive 30–40% of energy as fat (IOM 2009, http://fnic.nal.usda.gov/nal_display/index.php?info_center=4&tax_level=3&tax_subject=256&topic_id=1342&level3_id=5141 (accessed 2 December 2009)), addition of LNS to the GFD ration could be beneficial. In addition, a wider range of micronutrients can be incorporated into an LNS product than in a typical MNP, particularly the ‘bulkier’ nutrients such as potassium and phosphorous. Because of the food matrix, the dose of LNS provided can be easily divided over the day, thereby minimizing any potential hazard of single large doses of iron (e.g. in malarial areas) (Sazawal et al. 2006; WHO/UNICEF 2007). Finally, LNS have been shown to improve linear growth of children (Adu‐Afarwuah et al. 2007) and prevent severe stunting (2008, 2009), an effect that has not yet been demonstrated with MNPs (Adu‐Afarwuah et al. 2007; Dewey &Adu‐Afarwuah 2008).
There is also potential for using LNS to meet the greater nutrient requirements of PLW, which would have benefits for maternal health, pregnancy outcome and the health of their infants (Huybregts et al. 2009). The standard nutritional intervention during pregnancy is iron‐folic acid tablets, but the percentage of pregnant women who regularly take such tablets (i.e. 90+ tablets) is generally quite low, in part because of poor acceptance and side effects (Galloway & McGuire 1994). Furthermore, there is growing evidence of the importance of EFA intake during pregnancy and lactation, with consequences for child neurological development and maternal health (Larque et al. 2002; Bouwstra et al. 2006; Helland et al. 2006; Szajewska et al. 2006; Horvath et al. 2007). Thus, LNS may be a superior way to ensure adequate nutrition during these critical periods of the life cycle.
However, one of the most frequent concerns regarding distribution of LNS is the relatively high cost compared with the food aid commodities generally provided as well as other multi‐micronutrient supplements. The RUTFs used for nutritional rehabilitation of children with SAM (e.g. Plumpy'nut®, Nutriset, Malaunay, France) are the most well‐known, but they are formulated assuming a large dose per day: approximately 200–300 g per day, providing 200 kcal/kg body weight/day, and amounting to, on average, 12 kg of product for one course of treatment. By contrast, LNS developed for the prevention of malnutrition are based on much smaller doses, generally between 20 and 50 g/day (providing approximately 100–250 kcal/day). These LNS products include the Nutributter® (Nutriset, Malaunay, France) (20 g or 108 kcal per day) used in a recent randomized trial in Ghana (Adu‐Afarwuah et al. 2007; Adu‐Afarwuah et al. 2008), Plumpy'doz® (Nutriset, Malaunay, France) (46 g or 246 kcal per day) used by Médecins Sans Frontières in Niger (Defourney et al. 2009) and ‘fortified spreads’ (25–75 g or 128–384 kcal per day) used in several trials in Malawi (Kuusipalo et al. 2006; Phuka et al. 2008; Phuka et al. 2009). The smaller daily dose of LNS used for point‐of‐use fortification would be much less costly on an individual basis than the amount of LNS used as RUTF, though it would need to be provided for a longer period of time as well as to a larger group of individuals (i.e. all children 6–24 months of age, or all PLW). The total amount of product required on an individual basis (3.6 kg for 6 months or 7.3 kg for 12 months of prevention using 20 g/day) would be considerably less than the amount required for rehabilitation of a child with SAM (on average, 12 kg). Moreover, if using a preventive approach leads to fewer children developing MAM or SAM, there would be a reduced need for selective or therapeutic feeding programs, which are resource and staff intensive. In addition, it is hypothesized that LNS are less likely to be shared within the family than FBFs, and thus may reduce the need to provide excess ration to compensate for intrafamilial sharing (as is currently done in most supplementary feeding programs). Local production of LNS could also potentially reduce production and transport costs and may provide local economic benefits.
2. Objectives
The primary objective of this document is to outline the optimal formulation of LNS for various target groups (infants and young children 6 to 35 months of age, and PLW) in emergency settings, with the goal of augmenting the nutritional quality of food aid provided. 1 In addition to presenting the recommended nutritional formulation of LNS for use in these contexts, this document also includes discussion of (1) the expected bioavailability of relevant nutrients when the LNS product is mixed with other foods; (2) the possibility of chronic excess intake from consumption of both LNS and the fortified food aid commodities most frequently used; (3) acute toxicity concerns should individuals consume a much larger quantity of LNS than the daily recommended ‘dose’; (4) the recommended chemical form of each of the nutrients in the vitamin‐mineral premix used for fortification of LNS; and (5) stability and shelf‐life considerations, including packaging options. A secondary objective is to explore cost implications of the addition of LNS to current food aid ‘baskets’ for vulnerable groups.
3. Methodological approach
To outline a potential formulation of LNS for various target groups in emergency settings, the current nutritional composition of commonly provided food aid rations was first determined. The nutritional adequacy of this diet for each of the target groups was then assessed, and the nutritional ‘gaps’ were identified for each group. Through an iterative process, the formulation of the LNS that best met the recommended levels of nutrient intake for each group, without providing excess amounts of any one nutrient, was determined. While the development of a different LNS product specifically for each age/physiologic group would provide the best match for different nutritional requirements, it is likely not a feasible approach in terms of product development and distribution in an emergency context. Thus, we determined the desired LNS formulation based on two approaches: (1) developing one formulation to be used for infants and children 6–35 months of age and one formulation for PLW or (2) developing one formulation that could be used for all subgroups: children 6–35 months of age and PLW.
3.1 Dietary intake in emergency nutrition settings and composition of rations for GFD
There are few data on individual‐level dietary intake in emergency nutrition settings, from either food aid commodities or ‘home’ foods. Thus, for the purposes of determining which nutrients may be inadequate in emergency nutrition settings, as well as the ‘nutritional gap’ that LNS could fill if applied in these settings, we assumed a complete reliance on food aid. GFD rations for emergencies are planned according to recommendations for energy and macronutrient intake: 2100 kcal is the preliminary planning figure for energy per daily ration, with at least 10–12% of the energy to be provided as protein, and at least 17% of energy to be provided as fat (UNHCR/UNICEF/WFP/WHO 2004). From recent examples of general food rations developed for WFP EMOP, the most frequently used commodities were grain (typically rice, corn, wheat or sorghum), a pulse, oil, sugar, salt, and an FBF, most commonly CSB. (See Appendix 1 for additional information on food ration examples used).
Assuming 100% reliance on food aid may overestimate the dietary intake coming from food aid commodities in an emergency setting, but probably not by much. From a review of non‐emergency food aid programs in Malawi and Uganda, on average, 82% of the households reported that at least 75% of their daily diet was from food aid commodities (Rowe et al. 2008). Though this is a very small sample of non‐emergency food aid programs, it likely follows that in emergency situations, where stores of food and food production mechanisms may not be functioning and where trading food aid commodities for other foodstuffs may be less feasible, it is reasonable to assume that nearly 100% of the diet of the targeted population could come from food aid. In addition, many of the WFP EMOP reports reviewed allowed for a full GFD ration (100%) to be distributed (Appendix 1, A1.1–A1.3, A1.4–A1.5, A1.6, A1.7).
3.2 Hypothetical intake from example GFD rations
Using the above‐mentioned examples of recent GFD rations from WFP EMOPs, we constructed hypothetical intakes for each age/physiological group based on consumption of a ‘typical’ GFD ration. A ‘typical’ GFD ration was constructed for each of the most commonly used staple grains/grain products (either rice, cornmeal, wheat flour or sorghum) from the WFP EMOP examples, with the other components (pulse, oil, sugar, salt) held equivalent across rations (Table 1). Current EMOP rations usually include an FBF, most commonly CSB; however, to determine whether LNS could substitute for such products, we also created a ‘revised’ ration that did not include CSB (Table 1). When we did not include CSB in the ration, we substituted the same amount of energy with equal parts pulse and cereal. 2 This substitution was made to maintain the overall energy and macronutrient adequacy of the GFD ration for the general population, as it is not envisioned that all individuals would be receiving LNS. The ‘revised’ ration (without CSB) was used as the diet to be consumed with the addition of LNS; we did not assess the nutritional adequacy of a diet containing both CSB and LNS. To determine whether elimination of the CSB from the general ration would negatively affect the nutrient adequacy of the diet with respect to the population subgroups not receiving LNS, the adequacy of this ‘revised’ ration was also determined for a 4‐year‐old child and an adult male and compared with the adequacy of the ‘typical’ GFD ration (including CSB).
Table 1.
‘Typical’ GFD ration with CSB, and a ‘revised’ GFD ration with CSB substituted with an equivalent amount of pulse and grain
| Commodity | ‘Typical’ GFD ration with CSB | ‘Revised’ GFD ration without CSB | ||||
|---|---|---|---|---|---|---|
| Weight (g) | Energy (kcal) | Per cent of total energy | Weight (g) | Energy (kcal) | Per cent of total energy | |
| Grain (e.g. rice, cornmeal, wheat flour or sorghum) | 400 | 1356–1476 | 70 | 425 | 1441–1568 | 74 |
| Corn–soy blend | 50 | 190 | 9 | – | – | – |
| Pulse | 50 | 173 | 8 | 75 | 345 | 12 |
| Vegetable oil | 25 | 221 | 10 | 25 | 221 | 11 |
| Sugar | 15 | 58 | 3 | 15 | 58 | 3 |
| Salt | 5 | – | – | 5 | – | – |
| TOTAL | 545 | 1997–2117 | 100 | 545 | 1978–2106 | 100 |
GFD, general food distribution; CSB, corn–soy blend.
The populations considered ‘vulnerable’ were infants and children from 6 to 35 months of age (broken down into four age groups of 6–8, 9–11, 12–23 and 24–35 months of age) and PLW. Each age/physiological group's hypothetical intake from the ‘typical’ GFD ration was based upon the average energy requirement of each group (Table 2), taking into account the portion of energy requirements that would be expected to come from ‘average’ breast milk intake for children under 24 months of age (World Health Organization 1998; Dewey & Brown 2003). The hypothetical intake from the ‘typical’ GFD ration for each age/physiological group was constructed to contain the same proportion of energy coming from each commodity as in the overall ration (i.e. if 70% of energy in the overall ration was from grain, then 70% of the energy of hypothetical intake for each age/physiological group would be from grain) (Table 3). Salt, which is frequently included in planned GFD rations as a source of iodine but does not contribute to the energy content, was included in the hypothetical intake for each group by weight – that is, the percentage, by weight, of the overall GFD ration constituted by salt was used to calculate the amount of salt that would be included in each age/physiological group's hypothetical intake.
Table 2.
Energy requirements of each age/physiologic group*
| Age/physiologic group | ‘Average’ intake from breast milk (kcal) | Energy requirement from food (kcal) | Total intake (kcal) |
|---|---|---|---|
| 6–8 mo | 413 | 202 | 615 |
| 9–11 mo | 379 | 307 | 686 |
| 12–23 mo | 346 | 548 | 894 |
| 24–35 mo | – | 1024 † | 1024 † |
| Pregnant | – | 2588 ‡ | 2588 ‡ |
| Lactating | – | 2815 § | 2815 § |
Sources: Food and Agriculture Organization/World Health Organization/United Nations University (UNU) (2001) Human Energy Requirements. FAO: Rome; and Dewey K.G. & Brown K.H. (2003) Update on technical issues concerning. complementary feeding of young children in developing countries and implications for intervention programs. Food and Nutrition Bulletin 24, 5–28.
†Estimated energy requirement (EER) for 24‐month‐olds, males and females combined.
Average requirement over three trimesters for an 18–29‐year‐old woman. Based on a body weight of 55 kg, and a physical activity level of 1.75, and an additional energy allowance for pregnancy of 360 kcal in the second trimester and 475 kcal in the third.
Average requirement over the first year postpartum for an 18–29‐year‐old woman Based on a body weight of 55 kg, and a physical activity level of 1.75, and an additional energy allowance for lactation of 505 kcal in the first 6 months postpartum.
Table 3.
Hypothetical intake for each age/physiological group from the ‘typical’ GFD ration
| Portion of energy in overall ration (%) | Energy (kcal) needed from each ration component | ||||||
|---|---|---|---|---|---|---|---|
| 6–8 mo | 9–11 mo | 12–23 mo | 24–35 mo | Pregnant | Lactating | ||
| Grain | 70 | 141 | 215 | 384 | 717 | 1812 | 1971 |
| Pulse | 8 | 16 | 25 | 44 | 82 | 207 | 225 |
| CSB | 9 | 18 | 28 | 49 | 92 | 233 | 253 |
| Veg oil | 10 | 20 | 31 | 55 | 102 | 259 | 282 |
| Sugar | 3 | 6 | 9 | 16 | 31 | 78 | 85 |
| Salt* | – | 0 | 0 | 0 | 0 | 0 | 0 |
| Hypothetical intake from ration (kcal) | 202 | 307 | 548 | 1024 | 2588 | 2815 | |
GFD, general food distribution; CSB, corn–soy blend. *As salt did not contribute to the overall energy intake, the amount included in the diet is not presented. See Table 10 for quantity provided.
For the ‘revised’ GFD ration (without CSB), the same hypothetical intake calculation was completed; however, it was assumed that each ration of LNS would provide 118 kcal in 20 g of product, based on a recently formulated LNS product that contains slightly more oil and less sugar than Nutributter. 3 Thus, the amount of energy corresponding to what was provided as LNS (for one daily dose of 20 g or 118 kcal) was subtracted from the total energy to be provided from the ‘revised’ GFD ration; for example, a 6–8‐month‐old child with a complementary food intake requirement of 202 kcal/day would receive 84 kcal from the GFD ration and 118 kcal from LNS (Table 4). For the PLW, two scenarios were explored in which either one or two LNS ‘doses’ would be added to the ration per day (see section 3.4) and thus intake from the GFD ration was revised accordingly to address both scenarios.
Table 4.
Hypothetical intake for each age/physiological group from the ‘revised’ GFD ration, adjusted for the quantity of LNS that will be added (118 kcal)
| Portion of energy in overall ration (%) | Energy (kcal) needed from each ration component | ||||||||
|---|---|---|---|---|---|---|---|---|---|
| 6–8 mo | 9–11 mo | 12–23 mo | 24–35 mo | Pregnant (1 dose LNS) | Pregnant (2 dose LNS) | Lactating (1 dose LNS) | Lactating (2 dose LNS) | ||
| Grain | 74 | 62 | 140 | 319 | 672 | 1833 | 1745 | 2002 | 1913 |
| Pulse | 12 | 10 | 23 | 53 | 112 | 306 | 292 | 334 | 320 |
| Veg. oil | 11 | 9 | 20 | 46 | 96 | 262 | 249 | 286 | 273 |
| Sugar | 3 | 2 | 5 | 12 | 25 | 69 | 66 | 75 | 72 |
| Salt* | – | 0 | 0 | 0 | 0 | 0 | 0 | 0 | 0 |
| Hypothetical intake from ration (kcal) | 84 | 189 | 430 | 906 | 2470 | 2352 | 2697 | 2579 | |
| Intake from LNS (kcal) | 118 | 118 | 118 | 118 | 118 | 236 | 118 | 236 | |
| Total energy intake from non‐breast milk sources (kcal) | 202 | 307 | 548 | 1024 | 2588 | 2588 | 2815 | 2815 | |
GFD, general food distribution; LNS, lipid‐based nutrient supplement. *As salt did not contribute to the overall energy intake, the amount included in the diet is not presented. See Table 18 for quantity provided.
3.3 Nutrient composition and adequacy of hypothetical ration
The hypothetical nutrient intake of each age/physiological group was calculated as: (1) the sum of the nutrients provided from the ‘typical’ GFD ration plus the nutrients provided from an ‘average’ breast milk intake for each age group 4 (when applicable) (see Table 5 for average nutrient concentrations of breast milk used for these analyses) or (2) the sum of the nutrients provided from the ‘revised’ GFD ration, plus the nutrients and energy provided from an ‘average’ breast milk intake for each age group (when applicable), and the nutrients provided from the daily dose of LNS, whose nutritional composition will be discussed later. The macro‐ and micro‐nutrient content of the ration was determined using nutritional data from the United States Department of Agriculture (USDA) National Nutrient Database for Standard Reference (http://www.nal.usda.gov/fnic/foodcomp/search/) and the United States Agency for International Development (USAID) Commodity Reference Guide (http://www.usaid.gov/our_work/humanitarian_assistance/ffp/crg/), USDA export commodity specifications (http://www.fsa.usda.gov/FSA/webapp?area=home&subject=coop&topic=pas-ex-cr) and published values for the average nutrient content of breast milk (World Health Organization 1998). Because a variety of pulses are used in GFD rations, an average nutritional composition of the pulses commonly provided was used. In addition to the FBF such as CSB, which are fortified with a range of vitamins and minerals, several US food aid commodities are fortified or enriched according to USAID specifications. 5 Cornmeal and wheat flour are fortified with iron, calcium, vitamin A and enriched with thiamine, riboflavin and niacin; wheat flour is additionally enriched with folic acid; and vegetable oil is required to be fortified with vitamin A. Rice and sorghum do not have any additional vitamins or minerals added. The nutrient composition of the main commodities used in the analyses is provided in Appendix 2. The values for niacin include both preformed niacin and niacin equivalents from tryptophan. 6 For the EFA content of the ration (specifically, the levels of linoleic and alpha‐linolenic acid), only the GFD ration and the LNS (if applicable) contributed to this amount; breast milk EFA content was not included because it is highly variable. Because not all fatty acid isomers are included in the USDA Nutrient Database for each food commodity, the calculation of the linoleic acid and alpha‐linolenic acid contents of the food commodities in the ration was based on the total amount of 18:2 and 18:3 isomers, as linoleic acid (18:2 n‐6 cis, cis) and alpha‐linolenic acid (18:3 n‐3 cis, cis, cis) are the most abundant isomers of the 18:2 and 18:3 fatty acids, respectively. For the calculation of nutrient intake from CSB and other fortified processed foods in the ‘typical’ GFD ration for the specified vulnerable groups, we used the USAID/USDA specifications (in terms of ingredients used and vitamin/mineral premix added). 7
Table 5.
Average nutrient concentrations in mature breast milk (World Health Organization 1998)
| Nutrient | Amount (mean ± SD) |
|---|---|
| Lactose (g/L) | 72 ± 2.5 |
| Protein (g/L) | 10.5 ± 2.0 |
| Fat (g/L) | 39.0 ± 4.0 |
| Calcium (mg/L) | 280 ± 26 |
| Copper (mg/L) | 0.25 ± 0.03 |
| Folate (µg/L) | 85 ± 37 |
| Iodine (µg/L) | 110 ± 40 |
| Iron (mg/L) | 0.30 ± 0.10 |
| Magnesium (mg/L) | 35 ± 2 |
| Manganese (µg/L) | 6 ± 2 |
| Niacin (mg/L) | 1.50 ± 0.20 |
| Pantothenic acid (mg/L) | 1.80 ± 0.20 |
| Phosphorous (mg/L) | 140 ± 22 |
| Potassium (mg/L) | 525 ± 35 |
| Riboflavin (mg/L) | 0.35 ± 0.025 |
| Selenium (µg/L) | 20 ± 5 |
| Sodium (mg/L) | 180 ± 40 |
| Thiamine (mg/L) | 0.21 ± 0.03 |
| Vitamin A (µg RAE/L) | 500 |
| Vitamin B12 (µg/L) | 0.97 |
| Vitamin B6 (µg/L) | 93 ± 0.8 |
| Vitamin C (mg/L) | 40 ± 10 |
| Vitamin D (µg/L) | 0.55 ± 0.10 |
| Vitamin E (mg/L) | 2.3 ± 1.0 |
| Vitamin K (µg/L) | 2.1 ± 0.1 |
| Zinc (mg/L) | 1.2 ± 0.2 |
We used multiple sources for the reference values to which the hypothetical nutrient intake values were compared to determine inadequate or excessive intake for each nutrient for each age/physiological group. For most nutrients, the daily recommended intake levels set forth by WHO and the Food and Agriculture Organization (FAO) – referred to as RNIs, for Recommended Nutrient Intake – were used (WHO/FAO 2004). 8 When the WHO/FAO did not provide information for a particular nutrient, we used the values set forth by the United States Institute of Medicine (IOM): either the RDA, for Recommended Dietary Allowance, or the AI, for Adequate Intake (IOM 2009, http://fnic.nal.usda.gov/nal_display/index.php?info_center=4&tax_level=3&tax_subject=256&topic_id=1342&level3_id=5141). 9 For zinc, the International Zinc Nutrition Consultative Group (IZiNCG) has suggested revisions to the IOM and FAO/WHO values for some age groups, both for recommended levels of intake and excessive intake (Hotz & Brown 2004); those values were used for the purposes of this document. For fat, a recommendation for an absolute daily intake is not provided for some age groups (children 12–35 months of age and PLW); instead the ‘acceptable macronutrient distribution range’ (AMDR) set by the IOM was used as a reference for adequacy of intake. Intake was compared with the RNI or the RDA (or AI if an RDA was not set) for determination of adequacy, and the Upper Level (UL) 10 for determination of excess intake for each age and physiologic group. For pregnancy, when a recommended intake of a given nutrient was listed for each trimester, an average of the three values was used. Similarly, for lactation, an average of the values given for the first 6 months and second 6 months of the first year postpartum was used. Intake was considered ‘inadequate’ if <75% of the recommended intake for that age/physiologic group was met. Based on an assumed coefficient of variation (CV) of 10–15% 11 for the variability in requirements, 75% of the RDA would be equivalent to 90–98% of the estimated average requirement (EAR), which is the daily amount that is estimated to meet the needs of 50% of the population. 12 The RNIs, RDAs, ULs and AMDRs used for these analyses are shown in 6, 7, 8, 9.
Table 6.
Adequate Intakes (AI) and Recommended Nutrient Intakes (RNIs) and Upper Levels (UL) for 7–11‐month‐old infants (IOM and WHO/FAO 2004)
| Nutrient | IOM | WHO/FAO | Final values used for deficient/excess intake | |||
|---|---|---|---|---|---|---|
| AI | UL | RNI | UL | Recommended daily intake | UL | |
| Carbohydrate (g/d) | 95 | – | – | – | 95 | – |
| Fat (g/d) | 30 | – | – | – | 30 | – |
| Linoleic acid (g/d) | 4.6 | – | – | – | 4.6 | – |
| α‐Linolenic acid (g/d) | 0.5 | – | – | – | 0.5 | – |
| Protein (g/d) | 11 | – | – | – | 11 | – |
| Calcium (mg/d) | 270 | ND | 400 | ND | 400 | ND |
| Copper (mg/d) | 0.22 | ND | – | – | 0.22 | ND |
| Folate (µg DFE/d) | 80 | ND | 80 | ND | 80 | ND |
| Iodine (µg/d) | 130 | ND | 90 | 140 µg/kg/d* | 90 | 1260 |
| Iron (mg/d) † | 1.1 | 40 | 0.93 | ND | 0.93 | 40 |
| Magnesium (mg/d) | 75 | ND | 54 | ND | 54 | ND |
| Manganese (mg/d) | 0.6 | ND | – | – | 0.6 | ND |
| Niacin (mg/d) | 4 | ND | 4 | ND | 4 | ND |
| Pantothenic acid (mg/d) | 1.7 | ND | 1.8 | ND | 1.8 | ND |
| Phosphorous (mg/d) | 275 | ND | – | – | 275 | ND |
| Potassium (mg/d) | 700 | ND | – | – | 700 | ND |
| Riboflavin (mg/d) | 0.4 | ND | 0.4 | ND | 0.4 | ND |
| Selenium (µg/d) | 20 | 60 | 10 | ND | 10 | 60 |
| Thiamine (mg/d) | 0.3 | ND | 0.3 | ND | 0.3 | ND |
| Vitamin A (µg RAE /d) | 500 | 600 ‡ | 400 | ND | 400 | 600 |
| Vitamin B12 (µg/d) | 0.5 | ND | 0.7 | ND | 0.7 | ND |
| Vitamin B6 (mg/d) | 0.3 | ND | 0.3 | ND | 0.3 | ND |
| Vitamin C (mg/d) | 50 | ND | 30 | ND | 30 | ND |
| Vitamin D (IU/d) | 200 | 1000 | 200 | ND | 200 | 1000 |
| Vitamin E (mg/d) | 5 | ND | 2.7 | ND | 2.7 | ND |
| Vitamin K (µg/d) | 2.5 | ND | 10 | ND | 10 | ND |
| Zinc (mg/d) § | 1.0 | 5 | 1.3 | 23–38 | 1.1 ¶ | 6 ¶ |
IOM, Institute of Medicine; WHO, World Health Organization; FAO, Food and Agriculture Organization; DFE, dietary folate equivalents; RAE, retinol activity equivalents; IU, international units; ND, not determined. *Assuming a reference weight for a 7–12 month‐old infant of 9 kg, the UL for iodine would be approximately 1260 µg/d. This value was used for purposes of determining excessive iodine intake among 7–12 month‐old children. †Requirement for absorbed iron presented; the ULs are presented in terms of amount ingested. The amount needed in the diet will depend on estimated absorption level. ‡The UL for vitamin A is for intake of preformed vitamin A. §Requirement for absorbed zinc presented; the ULs are presented in terms of amount ingested. The amount needed in the diet to meet the absorbed requirement will depend on estimated absorption level. ¶Alternative recommendations made by the International Zinc Nutrition Consultative Group were used; daily requirement represents the ‘absorbed’ requirement, and the UL is based on the amount ingested.
Table 7.
Adequate Intakes (AI), Recommended Dietary Allowances (RDAs) or Recommended Nutrient Intakes (RNIs) and Upper Levels (UL) for 1–3‐year‐old (12–35‐month‐old) children (IOM and WHO/FAO 2004)
| Nutrient | IOM | WHO/FAO | Final values used for deficient/excess intake | |||
|---|---|---|---|---|---|---|
| AI/RDA | UL | RNI | UL | Recommended daily intake | UL | |
| Carbohydrate (g/d) | 130 | – | – | – | 130 | ND |
| Fat (g/d) | 30–40 % E † | – | – | – | 30–40 % E † | ND |
| Linoleic acid (g/d) | 7* | – | – | – | 7* | ND |
| α‐Linolenic acid (g/d) | 0.7* | – | – | – | 0.7* | ND |
| Protein (g/d) | 13 | – | – | – | 13 | ND |
| Calcium (mg/d) | 500* | 2500 | 500 | 2500 | 500* | 2500 |
| Copper (mg/d) | 0.34 | 1 | – | – | 0.34 | 1 |
| Folate (µg DFE/d) | 150 | 300 ‡ | 150 | 300 | 150 | 300 |
| Iodine (µg/d) | 90 | 200 | 90 | 50 µg/kg/d § | 90 | 600 |
| Iron (mg/d) ¶ | 1.26 | 40 | 0.58 | 40 | 0.58 | 40 |
| Magnesium (mg/d) | 80 | 65 †† | 60 | 65 | 60 | 65 |
| Manganese (mg/d) | 1.2* | 2 | 1.2 | ND | 1.2* | 2 |
| Niacin (mg/d) | 6 | 10 | 6 | ND | 6 | 10 |
| Pantothenic acid (mg/d) | 2* | ND | 2.0 | ND | 2* | ND |
| Phosphorous (mg/d) | 460 | 3000 | – | – | 460 | 3000 |
| Potassium (mg/d) | 3000* | ND | – | – | 3000* | ND |
| Riboflavin (mg/d) | 0.5 | ND | 0.5 | 30 | 0.5 | 30 |
| Selenium (µg/d) | 20 | 90 | 17 | – | 17 | 90 |
| Thiamine (mg/d) | 0.5 | ND | 0.5 | 10 | 0.5 | 10 |
| Vitamin A (µg RAE /d) | 300 | 600 ‡‡ | 400 | 600 | 400 | 600 |
| Vitamin B12 (µg/d) | 0.9 | ND | 0.9 | – | 0.9 | ND |
| Vitamin B6 (mg/d) | 0.5 | 30 | 0.5 | 30 | 0.5 | 30 |
| Vitamin C (mg/d) | 15 | 400 | 30 | 400 | 30 | 400 |
| Vitamin D (IU/d) | 200* | 2000 | 200 | 2000 | 200* | 2000 |
| Vitamin E (mg/d) | 6 | 200 | 5 | 200 | 5 | 200 |
| Vitamin K (µg/d) | 30* | ND | 15 | – | 15 | ND |
| Zinc (mg/d) §§ | 0.9 | 7 | 1.2 | 23–28 | 0.7 ¶¶ | 8 ¶¶ |
IOM, Institute of Medicine; WHO, World Health Organization; FAO, Food and Agriculture Organization; RAE, retinol activity equivalents; IU, international units; ND, not determined. *AI. †An AI/RDA is not provided for fat for this age group. The ‘acceptable macronutrient distribution range’ for fat intake is 30–40% of total energy intake. ‡The UL for folate is for intake from fortified foods or supplements. §Assuming a reference weight for a 12–35‐month‐old child of 12 kg, the UL for iodine would be approximately 600 µg/day. This value was used as the UL for iodine at 12–35 months of age. ¶Requirement for absorbed iron presented; the ULs are presented in terms of amount ingested. The amount needed in the diet will depend on estimated absorption level. ††The UL for magnesium is for intake from non‐food sources. ‡‡The UL for vitamin A is for intake of preformed vitamin A. §§Requirement for absorbed zinc presented; the ULs are presented in terms of amount ingested. The amount needed in the diet to meet the absorbed requirement will depend on estimated absorption level. ¶¶Alternative recommendations for the ‘no‐observed‐adverse‐effect‐level’ made by the International Zinc Nutrition Consultative Group were used. The daily requirement represents the ‘absorbed’ requirement, and the UL is based on the amount ingested.
Table 8.
Adequate Intakes (AI), Recommended Dietary Allowances (RDAs) or Recommended Nutrient Intakes (RNIs) and Upper Levels (UL) for pregnant women (19+ years of age) (IOM and WHO/FAO 2004)
| Nutrient | IOM | WHO/FAO | Final values used for deficient/excess intake | |||
|---|---|---|---|---|---|---|
| AI/RDA | UL | RNI | UL | Recommended daily intake | UL | |
| Carbohydrate (g/d) | 175 | – | – | – | 175 | ND |
| Fat (g/d) | 20–35 %E † | – | – | – | 20–35% E † | ND |
| Linoleic acid (g/d) | 13* | – | – | – | 13* | ND |
| α‐Linolenic acid (g/d) | 1.4* | – | – | – | 1.4* | ND |
| Protein (g/d) | 71 | – | – | – | 71 | ND |
| Calcium (mg/d) | 1000* | 2500 | 1200 | 3000 | 1200 | 3000 |
| Copper (mg/d) | 1 | 10 | – | – | 1 | 10 |
| Folate (µg DFE /d) | 600 | 1000 ‡ | 600 | 1000 | 600 | 1000 |
| Iodine (µg/d) | 220 | 1100 | 200 | 1100 | 200 | 1100 |
| Iron (mg/d) § | 4.6 | 45 | – ¶ | 45 | 4.6 | 45 |
| Magnesium (mg/d) | 350–360 | 350 †† | 220 | – | 220 | 350 |
| Manganese (mg/d) | 2* | 11 | – | – | 2* | 11 |
| Niacin (mg/d) | 18 | 35 | 18 | 35 | 18 | 35 |
| Pantothenic acid (mg/d) | 6* | ND | 6.0 | – | 6 | ND |
| Phosphorous (mg/d) | 700 | 3500 | – | – | 700 | 3500 |
| Potassium (mg/d) | 4700* | ND | – | – | 4700* | ND |
| Riboflavin (mg/d) | 1.4 | ND | 1.4 | – | 1.4 | ND |
| Selenium (µg/d) | 60 | 400 | 28, 30 ‡‡ | 29 | 400 | |
| Thiamine (mg/d) | 1.2 | ND | 1.4 | – | 1.4 | ND |
| Vitamin A (µg RAE /d) | 770 | 3000 §§ | 800 | 3000 | 800 | 3000 |
| Vitamin B12 (µg/d) | 2.6 | ND | 2.6 | – | 2.6 | ND |
| Vitamin B6 (mg/d) | 1.9 | 100 | 1.9 | 100 | 1.9 | 100 |
| Vitamin C (mg/d) | 85 | 2000 | 55 | 1000 | 55 | 1000 |
| Vitamin D (IU/d) | 200* | 2000 | 200 | 2000 | 200* | 2000 |
| Vitamin E (mg/d) | 15 | 1000 | – | – | 15 | 1000 |
| Vitamin K (µg/d) | 90* | ND | 55 | – | 55 | ND |
| Zinc (mg/d) ¶¶ | 5.4 | 40 | 3.4 | 45 | 3.2 ††† | 40 |
IOM, Institute of Medicine; WHO, World Health Organization; FAO, Food and Agriculture Organization; DFE, dietary folate equivalents; RAE, retinol activity equivalents; IU, international units; ND, not determined. *AI. †An AI/RDA is not provided for fat for this physiologic group. The ‘acceptable macronutrient distribution range’ for fat intake during pregnancy is 20–35% of energy intake. ‡The UL for folate is for intake from fortified foods or supplements. §Requirement for absorbed iron is presented; the ULs are presented in terms of amount ingested. The amount needed in the diet will depend on estimated absorption level. ¶Iron supplements (e.g. 100 mg of iron as ferrous sulphate) are recommended for all non‐anaemic pregnant women during the second half of pregnancy. ††The UL for magnesium is for intake from supplements, not food or water. ‡‡Requirements for second and third trimester; first trimester not determined. §§The UL for vitamin A is for intake of preformed vitamin A. ¶¶Requirement for absorbed zinc presented and averaged over three trimesters; the ULs are presented in terms of amount ingested. The amount needed in the diet to meet the absorbed requirement will depend on estimated absorption level. †††Alternative recommendations made by the International Zinc Nutrition Consultative Group were used; daily requirement represents the ‘absorbed’ requirement, and the UL is based on the amount ingested.
Table 9.
Adequate Intakes (AI), Recommended Dietary Allowances (RDAs) or Recommended Nutrient Intakes (RNIs) and Upper Levels (UL) for lactating women (19+ years of age) (IOM and WHO/FAO 2004)
| Nutrient | IOM | WHO/FAO | Final values used for deficient/excess intake | |||
|---|---|---|---|---|---|---|
| AI/RDA | UL | RNI | UL | Recommended daily intake | UL | |
| Carbohydrate (g/d) | 210 | ND | – | – | 210 | ND |
| Fat (g/d) | 20–35% E † | ND | – | – | 20–35% E † | ND |
| Linoleic acid (g/d) | 13* | ND | – | – | 13* | ND |
| α‐Linolenic acid (g/d) | 1.3* | ND | – | – | 1.3* | ND |
| Protein (g/d) | 71 | ND | – | – | 71 | ND |
| Calcium (mg/d) | 1000* | 2500 | 1000 | 3000 | 1000* | 3000 |
| Copper (mg/d) | 1.3 | 10 | – | – | 1.3 | 10 |
| Folate (µg DFE/d) | 500 | 1000 ‡ | 500 | 1000 | 500 | 1000 |
| Iodine (µg/d) | 290 | 1100 | 200 | 1100 | 200 | 1100 |
| Iron (mg/d) § | 1.62 | 45 | 1.5 | 45 | 1.5 | 45 |
| Magnesium (mg/d) | 310–320 | 350 ¶ | 270 | 350 | 270 | 350 |
| Manganese (mg/d) | 2.6* | 11 | 2.6 | 11 | 2.6* | 11 |
| Niacin (mg/d) | 17 | 35 | 17 | 35 | 17 | 35 |
| Pantothenic acid (mg/d) | 7* | ND | 7 | – | 7* | ND |
| Phosphorous (mg/d) | 700 | 4000 | – | – | 700 | 4000 |
| Potassium (mg/d) | 5100 | ND | – | – | 5100 | ND |
| Riboflavin (mg/d) | 1.6 | ND | 1.6 | – | 1.6 | ND |
| Selenium (µg/d) | 70 | 400 | 35 | 400 | 35 | 400 |
| Thiamine (mg/d) | 1.4 | ND | 1.5 | – | 1.5 | ND |
| Vitamin A (µg RAE /d) | 1300 | 3000 †† | 850 | 3000 | 850 | 3000 |
| Vitamin B12 (µg/d) | 2.8 | ND | 2.8 | – | 2.8 | ND |
| Vitamin B6 (mg/d) | 2 | 100 | 2 | 100 | 2 | 100 |
| Vitamin C (mg/d) | 120 | 2000 | 70 | 1000 | 70 | 1000 |
| Vitamin D (µg/d) | 200* | 2000 | 200 | 2000 | 200* | 2000 |
| Vitamin E (mg/d) | 19 | 1000 | – | – | 19 | 1000 |
| Vitamin K (µg/d) | 90* | ND | 55 | – | 55 | ND |
| Zinc (mg/d) ‡‡ | 5.3 | 40 | 4.3 | 45 | 3.6 §§ | 40 §§ |
IOM, Institute of Medicine; WHO, World Health Organization; FAO, Food and Agriculture Organization; DFE, dietary folate equivalents; RAE, retinol activity equivalents; ND, not determined. *AI. †An AI/RDA is not provided for fat for this physiologic group. The ‘acceptable macronutrient distribution range’ for fat intake during lactation is 20–35% of energy intake. ‡The UL for folate is for intake from fortified foods or supplements. §Requirement for absorbed iron presented; the ULs are presented in terms of amount ingested. The amount needed in the diet will depend on estimated absorption level. ¶The UL for magnesium is for intake from supplements, not food or water. ††The UL for vitamin A is intake of preformed vitamin A. ‡‡Requirement for absorbed zinc is presented; the ULs are presented in terms of amount ingested. The amount needed in the diet to meet the absorbed requirement will depend on estimated absorption level. §§Alternative recommendations made by the International Zinc Nutrition Consultative Group were used; daily requirement represents the ‘absorbed’ requirement, and the UL is based on the amount ingested.
The calculations of protein adequacy were more complicated, as they required consideration of protein quality as well as quantity. The details of these calculations are provided in Appendix 3.
3.4 Determination of the desired micronutrient composition of LNS
The challenge of developing LNS for emergency settings is that there are few data on foods and consumption patterns in such situations, making it difficult to know which nutrients are adequate in the diet and which are not. Assuming 100% reliance on food aid, as we have done for this document, probably provides a more nutritionally adequate ‘base’ diet than what would be available in an emergency setting where less food aid was available. Thus there were two possible ways of developing the desired LNS formulation: (1) starting with an LNS formulation that would provide 100% of the RDA/RNI for each micronutrient regardless of dietary intake from other sources or (2) ‘filling in the gaps’ of what was not provided from the ‘revised’ GFD ration and breast milk (when applicable). We chose the former rather than the latter because even when a ration is planned to provide 100% of a population's food needs, this may not always be the case because of logistical difficulties; also, the latter approach would only be relevant to settings where the particular mix of food aid commodities used as the basis for the calculations was consistently delivered. Using the ‘100% RDA/RNI’ approach, we explored two possibilities for the micronutrient composition of LNS:
-
•
Age/physiologic‐group specific formulation: This approach was used to develop two different formulations of LNS: one for all infants and children 6–35 months of age, and one for all PLW. For creation of the LNS for the 6–35‐month‐old group, which encompasses two sets of nutritional requirements (those for children 6–11 months of age, and those for children 12–35 months of age), for each micronutrient the higher of the two RNIs (or RDAs) was chosen (i.e. 100% of the RNI for whichever group had the higher requirement was included in the LNS formulation). Similarly, for the LNS for both PLW (who have different nutrient requirements), the higher of the two groups' requirements was chosen to be included in the LNS formulation. Each age/physiologic group was projected to receive one daily dose of the respective LNS (20 g, 118 kcal) per day.
-
•
‘One‐size‐fits‐all’ formulation: This approach started with the LNS formulation based on meeting 100% of the RNI/RDA for each micronutrient for infants/children 6–35 months of age, and then determined whether the same LNS could be used for PLW, just by varying the size of the dose. Infants and children 6–35 months of age were projected to receive one dose per day (20 g, 118 kcal/d), while PLW were projected to receive two doses per day (40 g, 236 kcal/d), and thus a larger amount of energy was subtracted from the ‘base’ diet for the PLW.
For both approaches, once the LNS was added to the hypothetical intake from the ‘revised’ GFD ration and breast milk (when applicable), a preliminary review was done to assess which micronutrients were still deficient and which were in excess of the UL for each age/physiologic group. For each nutrient that was in excess or deficient, we determined whether the level could be adjusted to eliminate the excess or deficiency in the affected group, while not creating an excess or deficient intake for another group. Adjusting nutrients that were in excess of the UL was, in several cases, constrained by the ration itself which in some cases already provided an ‘excessive’ amount of a given nutrient (e.g. vitamin A, folic acid and niacin) to certain groups even before addition of the LNS. This is because several of the commodities are already fortified (processed cereal grains and vegetable oil, for example). The basis for the UL was also examined for each nutrient that was found to be in excess, as the UL for some nutrients is for supplemental/pharmacological forms of the nutrient rather than naturally occurring forms of the nutrient found in food or as food fortificants (e.g. folic acid, magnesium). The chemical form of the nutrient that is used for fortification purposes must also be considered, as some forms can have adverse effects at high levels, while other forms do not (e.g. niacin). For those nutrients that were in excess of the UL because of the addition of LNS and whose UL was based on intake from food sources (naturally occurring or fortified), the LNS formulation was adjusted accordingly.
In addition, there are a few nutrients whose concentrations had to be limited in LNS because of technological constraints (e.g. ‘bulkiness’ of the nutrient that prohibits including the full RNI/RDA, or concerns about palatability or reactivity with other nutrients). These nutrients included calcium, potassium, phosphorous, and magnesium.
3.5 Accounting for bioavailability of nutrients from the GFD ration and LNS
The absorption of iron and zinc from the diet is affected by inhibiting and promoting factors found in food. Published algorithms were applied to estimate the bioavailability of these two nutrients based on other dietary components (e.g. phytate, vitamin C). For iron, the phytate and vitamin C content of the meal (including breast milk when applicable), as well as the expected iron status of the population (assumed to be deficient, which would increase iron absorption) were included in the estimation of the absorption of the iron provided from the GFD and LNS (except for pregnant women, for whom a standard 25% absorption was assumed) (Hallberg & Hulthen 2000). For zinc, the phytate content and the total zinc content of the diet (including breast milk when applicable) were included in the calculation of zinc absorption from the GFD and LNS (Hotz 2007). These calculations were then used to estimate the total absorbed iron and zinc from the diet and re‐adjust the iron and zinc content of the LNS accordingly.
3.6 Cost comparability estimates
We compared the cost of providing the current food aid ration (including CSB) with the cost of providing a ‘revised’ food aid ration (not including CSB) plus LNS. The cost of providing the ‘typical’ or ‘revised’ food aid ration was calculated as the sum of the projected estimated cost of each commodity for fiscal year 2009 (estimated costs are available on the commodity calculator at http://usaid.gov/our_work/humanitarian_assistance/ffp/comcalc_new.xls). For the cost of LNS, estimated costs for several different LNS were provided by Nutriset from their main production facilities in France. 13 Because of the difficulty in estimating shipping costs, which will depend on the form of transport used as well as the final location of distribution, transport costs were not included. Also not included are the costs associated with delivery of the food ration or LNS to the intended recipients (e.g. staff, delivery logistics), nor community mobilization and other training/education costs for explaining the purpose and use of the LNS product to both staff and recipients.
4. Results
4.1 Nutrient adequacy of ‘typical’ GFD ration
4.1.1 Hypothetical intake from and nutrient adequacy of ‘typical’ GFD ration for children 6–11 months of age
The composition, by weight, of the hypothetical intake from the current ‘typical’ GFD ration for 6–11‐month‐old children is provided in Table 10. The hypothetical quantity consumed is approximately 53 g (202 kcal) for the 6–8‐month‐old children and 81 g (307 kcal) for the 9–11‐month‐old children. These quantities represent the ‘dry weight’ of the ration that would need to be consumed to meet the average energy intake of each age group, though it would be expected that the ration components would be diluted when prepared for feeding of this age group, and thus the total weight and volume of food would be greater once diluted. 14
Table 10.
Hypothetical quantity consumed from each component of the ‘typical’ GFD ration for each age or physiologic group
| Food | Amount in hypothetical intake from GFD diet (g) | |||||
|---|---|---|---|---|---|---|
| 6–8 months | 9–11 months | 12–23 months | 24–35 months | Pregnant women | Lactating women | |
| Grain* | 39 | 60 | 107 | 199 | 503 | 547 |
| Pulse | 5 | 7 | 13 | 23 | 59 | 64 |
| Corn‐soy blend | 5 | 7 | 13 | 24 | 61 | 67 |
| Vegetable oil | 2 | 4 | 6 | 12 | 29 | 32 |
| Sugar | 2 | 2 | 4 | 8 | 20 | 22 |
| Salt | 1 | 1 | 1 | 3 | 5 | 5 |
| Total (g) | 53 | 81 | 144 | 269 | 679 | 739 |
GFD, general food distribution. *Because four different grains/grain products (rice, cornmeal, wheat flour and sorghum) were used, with slight variations in energy density, there were small differences in the quantity provided for each grain; for purposes of presentation in the table, the average quantity for all four grains is presented.
When the nutritional adequacy of the hypothetical intake of the current GFD ration, 15 plus an ‘average’ intake of breast milk, is determined for the 6–11‐month‐olds, some nutritional deficiencies are apparent ( 1, 2 and 11, 12). Although total fat is >75% of the recommended daily intake, the recommended levels of the EFAs linoleic acid and alpha‐linolenic acid are not met by any of the four rations (not counting the fatty acids coming from breast milk). For some micronutrients, the nutritional adequacy of the diet depends on the type of grain or grain product provided, as cornmeal and wheat flour are fortified with iron, calcium, and vitamin A and enriched with niacin, thiamine, riboflavin and folic acid (wheat flour only), while sorghum and rice are not enriched or fortified. For example, folic acid meets at least 75% of the recommended daily intake in the diet based on wheat flour for 6–8 and 9–11‐month‐olds, but is below this cutoff in the diets based on rice, cornmeal and sorghum. However, even with the fortified grain products, the hypothetical intake from the four diets constructed from the different GFD rations does not meet at least 75% of the RDA for 6–8‐month‐olds for vitamins D, E, B6 and K, calcium, iron and zinc. The three latter nutrients have been identified as ‘problem nutrients’ for infants and young children because of the gap between the amount needed and the amount that can usually be obtained from complementary foods (World Health Organization 1998). The bioavailability of iron and zinc is also negatively affected by the high phytate content of the cereal‐based GFD ration. In the ‘typical’ GFD ration, the calculated estimated absorption is on average 14% for iron, and somewhat higher for zinc (47%), for the 6–8‐month‐olds. Phosphorous and potassium, two nutrients that are usually not considered in assessments of dietary adequacy but may be important for linear growth (Golden 2009) are deficient in three of the four diets.
Figure 1.

Per cent of the daily recommended intake provided by the ‘typical’ general food distribution ration (and ‘average’ breast milk intake) for selected nutrients for 6–8‐month‐old infants. Diets are identified by the type of grain or grain product provided, with all other components equivalent between diets.
Figure 2.

Per cent of the daily recommended intake provided by the ‘typical’ general food distribution ration (and ‘average’ breast milk intake) for selected nutrients for 9–11‐month‐old infants. Diets are identified by the type of grain or grain product provided, with all other components equivalent between diets.
Table 11.
Amount of nutrient provided by each ‘typical’ GFD ration (and ‘average’ breast milk intake) and per cent of the daily recommended intake provided for 6–8‐month‐old children. Diets are identified by the type of grain or grain product provided, with all other components equivalent between diets
| Nutrient | Unit | Rice | Corn | Wheat | Sorghum | ||||
|---|---|---|---|---|---|---|---|---|---|
| Amt. | % daily intake | Amt. | % daily intake | Amt. | % daily intake | Amt. | % daily intake | ||
| Protein | g | 10.9 | 99 | 11.0 | 100 | 12.2 | 111 | 12.9 | 117 |
| Fat | g | 26.7 | 89 | 27.1 | 90 | 26.8 | 89 | 27.8 | 93 |
| Linoleic acid | g | 1.4 | 30 | 1.6 | 35 | 1.5 | 32 | 1.9 | 40 |
| α‐Linolenic acid | g | 0.2 | 38 | 0.2 | 38 | 0.2 | 38 | 0.2 | 42 |
| n6 : n3 | 7.1 | 8.4 | 7.7 | 8.9 | |||||
| Carbohydrate | g | 82.2 | 87 | 81.4 | 86 | 80.7 | 85 | 82.2 | 87 |
| Calcium | mg | 218.6 | 55 | 267.6 | 67 | 261.7 | 65 | 225.2 | 56 |
| Copper | mg | 0.3 | 126 | 0.2 | 107 | 0.3 | 119 | 0.2 | 94 |
| Folic acid | µg DFE | 42.3 | 53 | 50.8 | 63 | 138.3 | 173 | 39.3 | 49 |
| Iodine | µg | 99.5 | 111 | 99.5 | 111 | 99.5 | 111 | 99.5 | 111 |
| Iron | mg | 1.6 | 17 | 3.3 | 36 | 3.0 | 32 | 3.1 | 33 |
| Absorbed iron* | mg | 0.3 | 28 | 0.5 | 48 | 0.4 | 44 | 0.4 | 43 |
| Magnesium | mg | 46.4 | 86 | 49.0 | 91 | 44.1 | 82 | 35.6 | 66 |
| Manganese | mg | 0.5 | 88 | 0.2 | 29 | 0.4 | 62 | 0.1 | 17 |
| Niacin | mg | 2.7 | 68 | 3.9 | 98 | 4.5 | 112 | 3.7 | 92 |
| Pantothenic acid | mg | 1.8 | 100 | 1.4 | 79 | 1.5 | 83 | 1.3 | 73 |
| Phosphorous | mg | 156.0 | 57 | 154.7 | 56 | 156.5 | 57 | 234.2 | 85 |
| Potassium | mg | 433.3 | 62 | 455.5 | 65 | 438.8 | 63 | 543.2 | 78 |
| Riboflavin | mg | 0.3 | 66 | 0.4 | 98 | 0.4 | 100 | 0.3 | 76 |
| Selenium | µg | 19.4 | 194 | 17.9 | 179 | 26.6 | 266 | 13.5 | 135 |
| Sodium | mg | 305.2 | 82 | 307.0 | 83 | 305.1 | 82 | 306.8 | 83 |
| Thiamine | mg | 0.2 | 73 | 0.5 | 154 | 0.4 | 147 | 0.3 | 97 |
| Vitamin A | µg RAE | 378.3 | 95 | 603.7 | 151 | 606.8 | 152 | 378.3 | 95 |
| Vitamin B12 | µg | 0.7 | 93 | 0.7 | 93 | 0.7 | 93 | 0.7 | 93 |
| Vitamin B6 | mg | 0.2 | 54 | 0.2 | 58 | 0.1 | 39 | 0.1 | 33 |
| Vitamin C | mg | 26.3 | 88 | 26.3 | 88 | 26.3 | 88 | 26.3 | 88 |
| Vitamin D | IU | 22.7 | 11 | 22.7 | 11 | 22.7 | 11 | 22.7 | 11 |
| Vitamin E | mg | 1.9 | 71 | 1.9 | 71 | 1.9 | 70 | 1.9 | 69 |
| Vitamin K | µg | 6.0 | 60 | 6.0 | 60 | 6.1 | 61 | 6.0 | 60 |
| Zinc | mg | 1.5 | 37 | 1.4 | 33 | 1.4 | 33 | 1.1 | 27 |
| Absorbed zinc † | mg | 0.8 | 72 | 0.6 | 57 | 0.6 | 58 | 0.5 | 46 |
GFD, general food distribution; DFE, dietary folate equivalents; RAE, retinol activity equivalents; IU, international units. *Adequacy based on absorbed iron requirement and based on calculated bioavailability of the diet. †Adequacy based on absorbed zinc requirement and based on calculated bioavailability of the diet.
Table 12.
Amount of nutrient provided by each ‘typical’ GFD ration (and ‘average’ breast milk intake) and per cent of the daily recommended intake provided for 9–11‐month‐old children. Diets are identified by the type of grain or grain product provided, with all other components equivalent between diets
| Nutrient | Unit | Rice | Corn | Wheat | Sorghum | |||||
|---|---|---|---|---|---|---|---|---|---|---|
| Amt. | % daily intake | Amt. | % daily intake | Amt. | % daily intake | Amt. | % daily intake | |||
| Protein | g | 12.7 | 115 | 12.9 | 117 | 14.7 | 134 | 15.8 | 144 | |
| Fat | g | 26.3 | 88 | 27.0 | 90 | 26.5 | 88 | 28.0 | 93 | |
| Linoleic acid | g | 2.1 | 45 | 2.4 | 52 | 2.2 | 48 | 2.8 | 61 | |
| α‐Linolenic acid | g | 0.3 | 58 | 0.3 | 57 | 0.3 | 58 | 0.3 | 63 | |
| n6 : n3 | 7.1 | 8.4 | 7.7 | 8.9 | ||||||
| Carbohydrate | g | 98.6 | 104 | 97.4 | 103 | 96.4 | 101 | 98.6 | 104 | |
| Calcium | mg | 229.9 | 57 | 304.3 | 76 | 295.3 | 74 | 239.9 | 60 | |
| Copper | mg | 0.3 | 149 | 0.3 | 121 | 0.3 | 139 | 0.2 | 101 | |
| Folic acid | µg DFE | 63.7 | 80 | 76.6 | 96 | 209.7 | 262 | 59.2 | 74 | |
| Iodine | µg | 111.0 | 123 | 111.0 | 123 | 111.0 | 123 | 111.0 | 123 | |
| Iron | mg | 2.3 | 25 | 5.0 | 53 | 4.4 | 47 | 4.6 | 49 | |
| Absorbed iron* | mg | 0.3 | 37 | 0.6 | 64 | 0.5 | 58 | 0.5 | 56 | |
| Magnesium | mg | 57.8 | 107 | 61.7 | 114 | 54.3 | 101 | 41.3 | 76 | |
| Manganese | mg | 0.8 | 133 | 0.3 | 44 | 0.6 | 93 | 0.2 | 26 | |
| Niacin | mg | 3.6 | 90 | 5.5 | 137 | 6.3 | 158 | 3.3 | 83 | |
| Pantothenic acid | mg | 2.1 | 115 | 1.5 | 84 | 1.6 | 89 | 1.4 | 75 | |
| Phosphorous | mg | 185.9 | 68 | 184.0 | 67 | 186.6 | 68 | 304.7 | 111 | |
| Potassium | mg | 466.5 | 67 | 500.2 | 71 | 474.9 | 68 | 633.6 | 91 | |
| Riboflavin | mg | 0.3 | 68 | 0.5 | 117 | 0.5 | 120 | 0.3 | 84 | |
| Selenium | µg | 22.2 | 222 | 19.9 | 199 | 33.2 | 332 | 13.2 | 132 | |
| Sodium | mg | 397.5 | 107 | 400.2 | 108 | 397.3 | 107 | 399.9 | 108 | |
| Thiamine | mg | 0.3 | 86 | 0.6 | 208 | 0.6 | 198 | 0.4 | 122 | |
| Vitamin A | µg | 392.1 | 98 | 734.6 | 184 | 739.3 | 185 | 392.1 | 98 | |
| Vitamin B12 | µg RAE | 0.6 | 91 | 0.6 | 91 | 0.6 | 91 | 0.6 | 91 | |
| Vitamin B6 | mg | 0.2 | 71 | 0.2 | 77 | 0.1 | 48 | 0.1 | 39 | |
| Vitamin C | mg | 25.4 | 85 | 25.4 | 85 | 25.4 | 85 | 25.4 | 85 | |
| Vitamin D | IU | 26.4 | 13 | 26.4 | 13 | 26.4 | 13 | 26.4 | 13 | |
| Vitamin E | mg | 2.1 | 76 | 2.1 | 77 | 2.0 | 75 | 2.0 | 74 | |
| Vitamin K | µg | 8.4 | 84 | 8.4 | 84 | 8.5 | 85 | 8.4 | 84 | |
| Zinc | mg | 1.9 | 46 | 1.6 | 40 | 1.6 | 40 | 1.2 | 30 | |
| Absorbed zinc † | mg | 0.9 | 80 | 0.7 | 61 | 0.7 | 63 | 0.5 | 46 | |
GFD, general food distribution; DFE, dietary folate equivalents; RAE, retinol activity equivalents; IU, international units. *Adequacy based on absorbed iron requirement and based on calculated bioavailability of the diet. †Adequacy based on absorbed zinc requirement and based on calculated bioavailability of the diet.
Among 9–11‐month‐old infants, who are consuming more energy from the GFD ration than from breast milk but have the same micronutrient requirements as the infants between 6 and 8 months of age, a similar pattern of deficiency is apparent, with the exception of folic acid and vitamin E which are no longer at deficient levels for any of the diets. The estimated absorption of iron and zinc for the 9–11‐month‐olds is 13 and 43%, respectively.
At the same time, the hypothetical intake from the diet based on cornmeal or wheat flour rations provides an amount of vitamin A that exceeds the UL for both 6–8 and 9–11‐month‐old infants because of the fortification of these two staples with vitamin A, as well as the fortification of CSB and vegetable oil included in both rations. Although iodine intakes are adequate, the sole source of iodine among the food aid commodities provided is iodized salt, a commodity that may not always be distributed with regularity or added in sufficient quantities to diets of infants. Thus, in populations which are completely food‐aid dependent but in which the GFD ration does not provide iodized salt, iodine intake would be deficient.
Protein adequacy of the diet is discussed in Appendix 3.
4.1.2 Hypothetical intake from and nutrient adequacy of ‘typical’ GFD ration for children 12–35 months of age
The hypothetical quantity of the GFD ration that would be consumed is approximately 144 g (548 kcal) for 12–23‐month‐old children and 269 g (1024 kcal) for 24–35‐month‐old children (Table 10). As with the younger age groups, the hypothetical intake from the current GFD ration (plus an ‘average’ intake of breast milk for the 12–23 month age group) does not meet all of the nutritional needs of the 12–35‐month‐old children (13, 14, 3, 4). For 12–23‐month‐olds, fat content is borderline low across the four diets, at 28–29% of energy in three and 31% in the fourth (the recommended range is 30 to 40% of energy from fat for this age group). The levels of alpha‐linolenic acid are greater than 75% of the daily recommended intake level; however the levels of linoleic acid still fall slightly short of 75% in the four diets (not counting intake from breast milk). Among the 12–23‐month‐old children, calcium intake is deficient in the rice‐ and sorghum‐based diets; potassium, vitamins B6, B12, D and E are inadequate across all 4 diets. For the 24–35‐month‐old age group, fat content is still below the recommended level (30–40% of energy). In this age group, vitamin C is deficient across all four rations, and some nutrients that were already at insufficient levels among the 12–23‐month‐olds, such as vitamin B12, become even more inadequate because it is assumed that breast milk is no longer contributing a portion of the overall intake.
Table 13.
Amount of nutrient provided by each ‘typical’ GFD ration (and ‘average’ breast milk intake) and per cent of the daily recommended intake provided for 12–23‐month‐old children. Diets are identified by the type of grain or grain product provided, with all other components equivalent between diets
| Nutrient | Unit | Rice | Corn | Wheat | Sorghum | ||||
|---|---|---|---|---|---|---|---|---|---|
| Amt. | % daily intake | Amt. | % daily intake | Amt. | % daily intake | Amt. | % daily intake | ||
| Protein | g | 17.5 | 134 | 17.9 | 137 | 21.2 | 163 | 23.1 | 178 |
| Fat* | g | 27.9 | 28 | 29.2 | 29 | 28.3 | 29 | 31.0 | 31 |
| Linoleic acid | g | 3.7 | 53 | 4.3 | 62 | 4.0 | 57 | 5.0 | 72 |
| α‐Linolenic acid | g | 0.5 | 74 | 0.5 | 73 | 0.5 | 73 | 0.6 | 81 |
| n6 : n3 | 7.1 | 8.4 | 7.7 | 8.9 | |||||
| Carbohydrate | g | 141.1 | 109 | 138.9 | 107 | 137.0 | 105 | 141.1 | 109 |
| Calcium | mg | 274.2 | 55 | 407.0 | 81 | 391.1 | 78 | 292.1 | 58 |
| Copper | mg | 0.5 | 137 | 0.4 | 104 | 0.4 | 125 | 0.3 | 81 |
| Folic acid | µg DFE | 113.0 | 75 | 136.1 | 91 | 373.6 | 249 | 104.9 | 70 |
| Iodine | µg | 143.6 | 160 | 144.8 | 161 | 144.8 | 161 | 144.8 | 161 |
| Iron | mg | 4.0 | 68 | 8.7 | 151 | 7.8 | 134 | 8.1 | 140 |
| Absorbed iron † | mg | 0.5 | 88 | 0.9 | 156 | 0.8 | 143 | 0.8 | 137 |
| Magnesium | mg | 86.1 | 144 | 93.1 | 155 | 79.9 | 133 | 56.7 | 95 |
| Manganese | mg | 1.4 | 118 | 0.5 | 39 | 1.0 | 83 | 0.3 | 23 |
| Niacin | mg | 5.7 | 95 | 8.9 | 149 | 10.4 | 174 | 8.3 | 138 |
| Pantothenic acid | mg | 2.8 | 141 | 1.8 | 92 | 2.0 | 100 | 1.5 | 77 |
| Phosphorous | mg | 263.8 | 57 | 260.3 | 57 | 265.0 | 58 | 475.9 | 103 |
| Potassium | mg | 577.5 | 19 | 637.8 | 21 | 592.6 | 20 | 875.8 | 29 |
| Riboflavin | mg | 0.3 | 64 | 0.7 | 132 | 0.7 | 138 | 0.4 | 86 |
| Selenium | µg | 29.8 | 176 | 25.9 | 152 | 49.5 | 291 | 13.8 | 81 |
| Sodium | mg | 615.7 | 62 | 628.2 | 63 | 623.0 | 62 | 627.7 | 63 |
| Thiamine | mg | 0.4 | 71 | 1.0 | 202 | 1.0 | 192 | 0.6 | 110 |
| Vitamin A | µg RAE | 457.0 | 114 | 1068.2 | 267 | 1076.6 | 269 | 457.0 | 114 |
| Vitamin B12 | µg | 0.7 | 74 | 0.7 | 74 | 0.7 | 74 | 0.7 | 74 |
| Vitamin B6 | mg | 0.3 | 67 | 0.4 | 74 | 0.2 | 42 | 0.2 | 33 |
| Vitamin C | mg | 25.9 | 86 | 25.9 | 86 | 25.9 | 86 | 25.9 | 86 |
| Vitamin D | IU | 36.5 | 18 | 36.5 | 18 | 36.5 | 18 | 36.5 | 18 |
| Vitamin E | mg | 2.6 | 43 | 2.6 | 43 | 2.5 | 42 | 2.4 | 41 |
| Vitamin K | µg | 14.0 | 93 | 13.9 | 93 | 14.2 | 95 | 13.9 | 93 |
| Zinc | mg | 2.8 | 68 | 2.3 | 57 | 2.3 | 57 | 1.6 | 39 |
| Absorbed zinc ‡ | 1.1 | 156 | 0.8 | 115 | 0.8 | 117 | 0.6 | 81 | |
GFD, general food distribution; DFE, dietary folate equivalents; RAE, retinol activity equivalents; IU, international units. *Because there is not a recommended absolute amount of fat for the 12–35 month age group, the per cent of energy from fat is displayed in the ‘% daily intake column’. For this age group, the per cent of energy from fat is recommended to be between 30 and 40% of energy (Institute of Medicine). †Adequacy based on absorbed iron requirement and based on calculated bioavailability of the diet. ‡Adequacy based on absorbed zinc requirement and based on calculated bioavailability of the diet.
Table 14.
Amount of nutrient provided by each ‘typical’ GFD ration and per cent of the daily recommended intake provided for 24–35‐month‐old children. Diets are identified by the type of grain or grain product provided, with all other components equivalent between diets
| Nutrient | Unit | Rice | Corn | Wheat | Sorghum | ||||
|---|---|---|---|---|---|---|---|---|---|
| Amt. | % daily intake | Amt. | % daily intake | Amt. | % daily intake | Amt. | % daily intake | ||
| Protein | g | 22.7 | 175 | 23.4 | 180 | 29.6 | 228 | 33.2 | 255 |
| Fat* | g | 15.1 | 13 | 17.4 | 15 | 15.9 | 14 | 20.9 | 18 |
| Linoleic acid | g | 6.9 | 99 | 8.1 | 115 | 7.4 | 106 | 9.4 | 135 |
| α‐Linolenic acid | g | 1.0 | 139 | 1.0 | 136 | 1.0 | 137 | 1.1 | 151 |
| n6 : n3 | 7.1 | 8.4 | 7.7 | 8.9 | |||||
| Carbohydrate | g | 195.1 | 150 | 191.1 | 147 | 187.6 | 144 | 195.1 | 150 |
| Calcium | mg | 246.2 | 49 | 494.3 | 99 | 464.6 | 93 | 279.6 | 56 |
| Copper | mg | 0.6 | 186 | 0.4 | 124 | 0.6 | 164 | 0.3 | 81 |
| Folic acid | µg DFE | 209.8 | 140 | 252.8 | 169 | 696.7 | 464 | 194.5 | 130 |
| Iodine | µg | 163.6 | 182 | 166.0 | 184 | 166.0 | 184 | 166.0 | 184 |
| Iron † | mg | 7.1 | 123 | 16.0 | 276 | 14.2 | 245 | 14.8 | 256 |
| Absorbed iron † | mg | 0.6 | 101 | 1.0 | 181 | 1.0 | 165 | 0.9 | 158 |
| Magnesium | mg | 127.6 | 213 | 140.7 | 234 | 116.0 | 193 | 72.7 | 121 |
| Manganese | mg | 2.6 | 220 | 0.9 | 72 | 1.9 | 154 | 0.5 | 43 |
| Niacin | mg | 9.3 | 154 | 15.3 | 254 | 18.1 | 301 | 14.0 | 234 |
| Pantothenic acid | mg | 3.6 | 179 | 1.7 | 86 | 2.0 | 101 | 1.2 | 58 |
| Phosphorous | mg | 359.9 | 78 | 353.3 | 77 | 362.1 | 79 | 756.2 | 164 |
| Potassium | mg | 580.0 | 19 | 692.6 | 23 | 608.0 | 20 | 1137.4 | 38 |
| Riboflavin | mg | 0.3 | 52 | 0.9 | 181 | 1.0 | 191 | 0.5 | 93 |
| Selenium | µg | 36.7 | 216 | 29.3 | 172 | 73.5 | 432 | 6.8 | 40 |
| Sodium | mg | 977.8 | 98 | 1002.2 | 100 | 992.6 | 99 | 1001.3 | 100 |
| Thiamine | mg | 0.5 | 94 | 1.7 | 338 | 1.6 | 318 | 0.8 | 166 |
| Vitamin A | µg RAE | 378.5 | 95 | 1520.7 | 380 | 1536.4 | 384 | 378.5 | 95 |
| Vitamin B12 | µg | 0.3 | 35 | 0.3 | 35 | 0.3 | 35 | 0.3 | 35 |
| Vitamin B6 | mg | 0.5 | 107 | 0.6 | 120 | 0.3 | 61 | 0.2 | 43 |
| Vitamin C | mg | 10.3 | 34 | 10.3 | 34 | 10.3 | 34 | 10.3 | 34 |
| Vitamin D | IU | 47.3 | 24 | 47.3 | 24 | 47.3 | 24 | 47.3 | 24 |
| Vitamin E | mg | 2.6 | 43 | 2.7 | 45 | 2.5 | 41 | 2.4 | 39 |
| Vitamin K | µg | 24.2 | 161 | 24.0 | 160 | 24.6 | 164 | 24.0 | 160 |
| Zinc | mg | 4.1 | 99 | 3.2 | 79 | 3.2 | 79 | 1.9 | 45 |
| Absorbed zinc ‡ | mg | 2.2 | 187 | 0.9 | 130 | 0.9 | 133 | 0.6 | 80 |
GFD, general food distribution; DFE, dietary folate equivalents; RAE, retinol activity equivalents; IU, international units. *Because there is not a recommended absolute amount of fat for the 12–35 month age group, the per cent of energy from fat is displayed in the ‘% daily intake’ column. For this age group, the per cent of energy from fat is recommended to be between 30 and 40% of energy (Institute of Medicine). †Adequacy based on absorbed iron requirement and based on calculated bioavailability of the diet. ‡Adequacy based on absorbed zinc requirement and based on calculated bioavailability of the diet.
Figure 3.

Per cent of the daily recommended intake provided by the ‘typical’ general food distribution ration (and ‘average’ breast milk intake) for selected nutrients for 12–23‐month‐old infants. Diets are identified by the type of grain or grain product provided, with all other components equivalent between diets.
Figure 4.
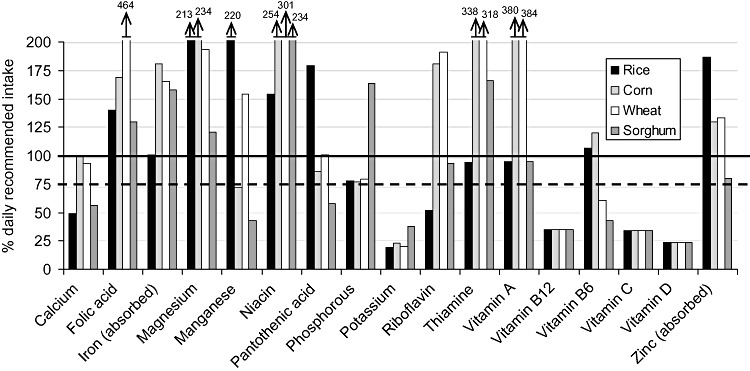
Per cent of the daily recommended intake provided by the ‘typical’ general food distribution ration (and ‘average’ breast milk intake) for selected nutrients for 24–35‐month‐old infants. Diets are identified by the type of grain or grain product provided, with all other components equivalent between diets.
Magnesium, manganese, vitamin A, folic acid and niacin all exceed the UL in at least one ration among the 12–35‐month‐old children (Table 15). Vitamin A levels are in excess of the UL in the corn‐ and wheat‐based GFD rations for the 24–35‐month‐old children. Magnesium levels exceed the ULs in all diets for 12–35‐month‐old children. Folic acid levels in the wheat‐flour based GFD rations exceed the UL for both age groups, and niacin intakes exceed the UL for the 24–35‐month‐old children consuming GFD rations based on cornmeal, wheat flour and sorghum. The manganese UL is also exceeded for the rice ration in the 24–35 month age group.
Table 15.
Nutrients that exceed the UL from the hypothetical intake from the ‘typical’ GFD ration. Presented by age/physiologic group and identified by the staple grain used in the GFD hypothetical intake (with all other components being equal between diets)
| Age/physiologic group (mo) | Rice | Cornmeal | Wheat flour | Sorghum |
|---|---|---|---|---|
| 6–8 | Vitamin A | Vitamin A | ||
| 9–11 | Vitamin A | Vitamin A | ||
| 12–23 | Magnesium | Magnesium Vitamin A | Niacin Magnesium Vitamin A Folic acid | Magnesium |
| 24–35 | Magnesium Manganese | Magnesium Vitamin A Niacin | Magnesium Vitamin A Niacin Folic acid | Magnesium Niacin |
| Pregnant | Magnesium Niacin Vitamin A | Folic acid Magnesium Niacin Vitamin A | Niacin | |
| Lactating | Magnesium | Magnesium Niacin Vitamin A | Folic acid Niacin Vitamin A | Niacin |
UL, Upper Levels; GFD, general food distribution.
Protein adequacy of the diet is discussed in Appendix 3.
4.1.3 Hypothetical intake from and nutrient adequacy of ‘typical’ GFD ration for pregnant and lactating women (PLW)
PLW are estimated to consume roughly 679 and 739 g of the GFD ration, amounting to 2588 and 2815 kcal per day for pregnancy and lactation, respectively (Table 10). For PLW, there are several nutrients that do not reach at least 75% of the recommended level of daily intake, while at the same time, several nutrients exceed the UL ( 5, 6 and 16, 17). For pregnant women, nutrients that do not reach 75% of the daily recommended intake level across the four rations include vitamins B12, C, D and E, potassium and absorbed zinc. In addition, the GFD ration based on rice is deficient in calcium, iron, vitamin B6 and riboflavin. The GFD ration based on sorghum has additional deficiencies in calcium, copper, manganese, and vitamin B6, and neither the sorghum GFD or cornmeal ration provide sufficient levels of pantothenic acid. At the same time, the GFD rations based on cornmeal and wheat flour provide more than the UL for magnesium, niacin and vitamin A for pregnant women (Table 15). Niacin also is higher than the UL in the sorghum ration. The corn‐based GFD ration also provides levels of magnesium above the UL for pregnant women, and the wheat‐based GFD ration provides levels of folic acid above the UL for pregnant women.
Figure 5.

Per cent of the daily recommended intake provided by the ‘typical’ general food distribution ration for selected nutrients for pregnant women. Diets are identified by the type of grain or grain product provided, with all other components equivalent between diets.
Figure 6.
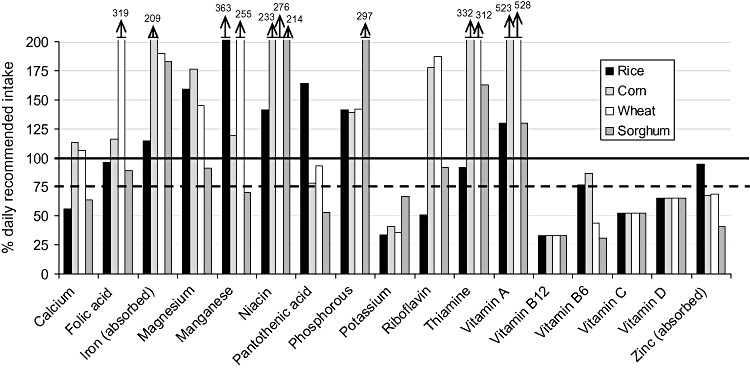
Per cent of the daily recommended intake provided by the ‘typical’ general food distribution ration for selected nutrients for lactating women. Diets are identified by the type of grain or grain product provided, with all other components equivalent between diets.
Table 16.
Amount of nutrient provided by each ‘typical’ GFD ration and per cent of the daily recommended intake provided for pregnant women. Diets are identified by the type of grain or grain product provided, with all other components equivalent between diets
| Nutrient | Unit | Rice | Corn | Wheat | Sorghum | ||||
|---|---|---|---|---|---|---|---|---|---|
| Amt. | % daily intake | Amt. | % daily intake | Amt. | % daily intake | Amt. | % daily intake | ||
| Protein | g | 57.3 | 81 | 59.1 | 83 | 74.9 | 105 | 83.9 | 118 |
| Fat* | g | 41.5 | 13 | 47.8 | 15 | 43.6 | 14 | 57.5 | 18 |
| Linoleic acid | g | 17.5 | 135 | 20.3 | 157 | 18.8 | 144 | 23.8 | 183 |
| α‐Linolenic acid | g | 2.5 | 175 | 2.4 | 172 | 2.4 | 173 | 2.7 | 190 |
| n6 : n3 | 7.1 | 8.4 | 7.7 | 8.9 | |||||
| Carbohydrate | g | 493.2 | 282 | 482.9 | 276 | 474.1 | 271 | 493.1 | 282 |
| Calcium | mg | 621.9 | 52 | 1248.9 | 104 | 1173.8 | 98 | 706.3 | 59 |
| Copper | mg | 1.6 | 160 | 1.1 | 107 | 1.4 | 141 | 0.7 | 69 |
| Folic acid | µg DFE | 530.1 | 88 | 638.9 | 106 | 1760.8 | 293 | 491.7 | 82 |
| Iodine | µg | 334.2 | 167 | 334.2 | 167 | 334.2 | 167 | 334.2 | 167 |
| Iron | mg | 18.0 | 67 | 40.5 | 150 | 35.9 | 133 | 37.5 | 139 |
| Absorbed iron † | mg | 4.5 | 98 | 10.1 | 220 | 9.0 | 195 | 9.4 | 204 |
| Magnesium | mg | 322.6 | 147 | 355.5 | 162 | 293.2 | 133 | 183.7 | 84 |
| Manganese | mg | 6.7 | 334 | 2.2 | 109 | 4.7 | 234 | 1.3 | 64 |
| Niacin | mg | 23.4 | 130 | 38.6 | 214 | 45.7 | 254 | 45.7 | 254 |
| Pantothenic acid | mg | 9.0 | 151 | 4.3 | 72 | 5.1 | 85 | 2.9 | 49 |
| Phosphorous | mg | 909.5 | 130 | 893.0 | 128 | 915.0 | 131 | 1911.2 | 273 |
| Potassium | mg | 1465.7 | 31 | 1750.2 | 37 | 1536.5 | 33 | 2874.4 | 61 |
| Riboflavin | mg | 0.7 | 47 | 2.3 | 163 | 2.4 | 172 | 1.2 | 84 |
| Selenium | µg | 92.8 | 320 | 74.0 | 255 | 185.8 | 641 | 17.1 | 59 |
| Sodium | mg | 1960.2 | 131 | 1982.9 | 132 | 1958.4 | 131 | 1980.5 | 132 |
| Thiamine | mg | 1.2 | 85 | 4.3 | 305 | 4.0 | 287 | 2.1 | 150 |
| Vitamin A | µg RAE | 956.5 | 120 | 3843.3 | 480 | 3883.0 | 485 | 956.5 | 120 |
| Vitamin B12 | µg | 0.8 | 31 | 0.8 | 31 | 0.8 | 31 | 0.8 | 31 |
| Vitamin B6 | mg | 1.4 | 71 | 1.5 | 80 | 0.8 | 40 | 0.5 | 29 |
| Vitamin C | mg | 26.0 | 47 | 26.0 | 47 | 26.0 | 47 | 26.0 | 47 |
| Vitamin D | IU | 119.5 | 60 | 119.5 | 60 | 119.5 | 60 | 119.5 | 60 |
| Vitamin E | mg | 6.5 | 44 | 6.8 | 45 | 6.3 | 42 | 6.0 | 40 |
| Vitamin K | µg | 61.1 | 111 | 60.6 | 110 | 62.1 | 113 | 60.6 | 110 |
| Zinc | mg | 10.3 | 137 | 8.2 | 109 | 8.2 | 109 | 4.7 | 62 |
| Absorbed zinc ‡ | mg | 2.2 | 68 | 1.5 | 46 | 1.5 | 48 | 0.9 | 29 |
GFD, general food distribution; DFE, dietary folate equivalents; RAE, retinol activity equivalents; IU, international units. *Because there is not a recommended absolute amount of fat for pregnant or lactating women, the per cent of energy from fat is displayed in the ‘% daily intake’ column. For this physiological group, the per cent of energy from fat is recommended to be between 20 and 35% of energy (Institute of Medicine). †Amount of absorbed iron is based on an assumed 25% absorption for pregnant women (Institute of Medicine). Adequacy based on absorbed iron requirement. ‡Amount of absorbed zinc is based on calculated bioavailability of diet. Using standard equations for determining the bioavailability of zinc from the diet, the calculated zinc absorption from the ‘typical’ GFD ration is 19%. Adequacy based on absorbed zinc requirement.
Table 17.
Amount of nutrient provided by each ‘typical’ GFD ration and per cent of the daily recommended intake provided for lactating women. Diets are identified by the type of grain or grain product provided, with all other components equivalent between diets
| Nutrient | Unit | Rice | Corn | Wheat | Sorghum | ||||
|---|---|---|---|---|---|---|---|---|---|
| Amt. | % daily intake | Amt. | % daily intake | Amt. | % daily intake | Amt. | % daily intake | ||
| Protein | g | 62.4 | 88 | 64.3 | 91 | 81.5 | 115 | 91.2 | 128 |
| Fat* | g | 41.5 | 13 | 47.8 | 354 | 43.6 | 323 | 57.5 | 426 |
| Linoleic acid | g | 19.0 | 146 | 22.1 | 170 | 20.4 | 157 | 25.9 | 199 |
| α‐Linolenic acid | g | 2.7 | 191 | 2.6 | 187 | 2.6 | 189 | 2.9 | 207 |
| n6 : n3 | 7.1 | 8.4 | 7.7 | 8.9 | |||||
| Carbohydrate | g | 536.4 | 307 | 525.2 | 300 | 515.7 | 295 | 536.4 | 307 |
| Calcium | mg | 676.4 | 56 | 1358.4 | 113 | 1276.7 | 106 | 768.2 | 64 |
| Copper | mg | 1.7 | 174 | 1.2 | 116 | 1.5 | 153 | 0.8 | 75 |
| Folic acid | µg DFE | 576.6 | 96 | 695.0 | 116 | 1915.2 | 319 | 534.8 | 89 |
| Iodine | µg | 337.3 | 169 | 337.3 | 169 | 337.3 | 169 | 337.3 | 169 |
| Iron | mg | 19.6 | 73 | 44.1 | 163 | 39.1 | 145 | 40.8 | 151 |
| Absorbed iron † | 1.7 | 115 | 3.1 | 209 | 2.9 | 190 | 2.7 | 183 | |
| Magnesium | mg | 350.8 | 159 | 386.7 | 176 | 318.9 | 145 | 199.8 | 91 |
| Manganese | mg | 7.3 | 363 | 2.4 | 119 | 5.1 | 255 | 1.4 | 70 |
| Niacin | mg | 25.4 | 141 | 41.9 | 233 | 49.7 | 276 | 38.6 | 214 |
| Pantothenic acid | mg | 9.8 | 164 | 4.7 | 78 | 5.6 | 93 | 3.2 | 53 |
| Phosphorous | mg | 989.2 | 141 | 971.4 | 139 | 995.3 | 142 | 2078.9 | 297 |
| Potassium | mg | 1594.2 | 34 | 1903.7 | 41 | 1671.3 | 36 | 3126.5 | 67 |
| Riboflavin | mg | 0.7 | 51 | 2.5 | 178 | 2.6 | 187 | 1.3 | 92 |
| Selenium | µg | 101.0 | 348 | 80.5 | 278 | 202.1 | 697 | 18.6 | 64 |
| Sodium | mg | 1962.1 | 131 | 1986.8 | 132 | 1960.2 | 131 | 1984.3 | 132 |
| Thiamine | mg | 1.3 | 92 | 4.6 | 332 | 4.4 | 312 | 2.3 | 163 |
| Vitamin A | µg | 1040.4 | 130 | 4180.4 | 523 | 4223.6 | 528 | 1040.4 | 130 |
| Vitamin B12 | µg | 0.9 | 33 | 0.9 | 33 | 0.9 | 33 | 0.9 | 33 |
| Vitamin B6 | mg | 1.5 | 77 | 1.7 | 87 | 0.8 | 44 | 0.6 | 31 |
| Vitamin C | mg | 28.3 | 52 | 28.3 | 52 | 28.3 | 52 | 28.3 | 52 |
| Vitamin D | IU | 130.0 | 65 | 130.0 | 65 | 130.0 | 65 | 130.0 | 65 |
| Vitamin E | mg | 7.1 | 47 | 7.4 | 49 | 6.8 | 46 | 6.5 | 43 |
| Vitamin K | µg | 66.4 | 121 | 65.9 | 120 | 67.5 | 123 | 65.9 | 120 |
| Zinc | mg | 11.2 | 149 | 8.9 | 119 | 8.9 | 118 | 5.1 | 68 |
| Absorbed zinc ‡ | 3.4 | 94.3 | 2.4 | 67.6 | 2.5 | 68.8 | 1.5 | 40.9 | |
GFD, general food distribution; DFE, dietary folate equivalents; IU, international units. *Because there is not a recommended absolute amount of fat for pregnant or lactating women, the recommended per cent of energy from fat is displayed in the ‘% daily intake’ column. For this physiological group, the per cent of energy from fat is recommended to be between 20 and 35% of energy (Institute of Medicine). †Amount of absorbed iron presented based on calculated bioavailability of diet. For lactating women, using standard equations for determining the bioavailability of iron from the diet, the calculated iron absorption from the ‘typical’ GFD ration for lactating women is 7%. Adequacy based on absorbed iron requirement. ‡Amount of absorbed zinc presented based on calculated bioavailability of diet. For lactating women, using standard equations for determining the bioavailability of zinc from the diet, the calculated zinc absorption from the ‘typical’ GFD ration is 21% (an increase of 10% above pregnancy). Adequacy based on absorbed zinc requirement.
For lactating women, nutrients deficient across all four GFD rations include potassium and vitamins B12, C, D and E. In addition, the rice ration is deficient in calcium, riboflavin and vitamin B6, the cornmeal ration is deficient in pantothenic acid and zinc, and the wheat ration is deficient in vitamin B6 and zinc. The sorghum GFD ration has deficient levels of copper, magnesium, manganese, pantothenic acid, vitamin B6 and zinc. Similar to the case of pregnant women, the ULs for niacin and vitamin A are exceeded by the GFD rations based on corn, wheat and sorghum; the wheat‐based ration also has levels of folic acid greater than the UL. The rice‐ and corn‐based GFD rations also have levels of magnesium above the UL.
Protein adequacy of the ration is discussed in Appendix 3.
4.2 Nutrient adequacy of ‘revised’ GFD ration with the addition of LNS
For determination of the desired composition of LNS, the hypothetical intake from the ‘revised’ GFD ration (without CSB) was used. Both approaches for developing the LNS formulation used the composition of the rations presented in Table 18, with the appropriate amount of energy to be provided from LNS (118 kcal for one ‘dose’ of LNS or 236 kcal for two ‘doses’ of LNS) subtracted from the ‘revised’ GFD ration, and the appropriate amounts of nutrients and energy from breast milk added, when applicable (i.e. instead of the ‘revised’ GFD ration providing the full 202 kcal needed from complementary foods by 6–8‐month‐olds –Table 4– 84 kcal would be provided from the ration and 118 kcal from the LNS). The goal of both approaches for determining the optimal nutritional composition of LNS was to maximize the number of nutrients meeting at least 75% of recommended intake levels via the combined GFD ration, breast milk (if applicable), and LNS, and minimize the number of nutrients exceeding the UL (specific ULs are discussed later in this document). Because salt is assumed to be included in the GFD ration, no additional sodium is added to the LNS formulation; in settings where salt is not provided as part of the GFD ration, additional needs for sodium would need to be considered in the formulation of LNS.
Table 18.
Composition (g) of hypothetical intakes from ‘revised’ GFD ration, taking into account energy content (118 kcal or 236 kcal) to be provided via LNS
| Food | 6–8 mo (84 kcal) | 9–11 mo (189 kcal) | 12–23 mo (430 kcal) | 24–35 mo (906 kcal) | Pregnant (2470 kcal) | Pregnant (2352 kcal)* | Lactating (2697 kcal) | Lactating (2579 kcal)* |
|---|---|---|---|---|---|---|---|---|
| Grain (g) † | 17 | 39 | 89 | 188 | 512 | 487 | 559 | 534 |
| Pulses (g) | 3 | 7 | 16 | 33 | 89 | 85 | 97 | 93 |
| Veg. oil (g) | 1 | 2 | 5 | 11 | 30 | 28 | 32 | 31 |
| Salt (g) | 0.2 | 0.5 | 1 | 2 | 6 | 6 | 7 | 6 |
| Sugar (g) | 0.6 | 1 | 3 | 7 | 18 | 17 | 19 | 19 |
| Total (g) | 22 | 50 | 114 | 240 | 654 | 623 | 714 | 683 |
GFD, general food distribution; LNS, lipid‐based nutrient supplement. †Because four different grains/grain products (rice, cornmeal, wheat flour and sorghum) were used, with slight variations in energy density, there were small differences in the quantity assumed for each grain; for purposes of presentation in the table, the average quantity for all four grains is presented. *Two ‘doses’ of LNS provided (236 kcal).
The nutritional adequacy of the ‘revised’ GFD ration was also assessed for members of ‘less vulnerable’ groups, specifically a 4‐year‐old child and an adult male, to determine whether removal of the CSB and replacement with an equivalent quantity of pulse and grain, but no additional LNS, would significantly affect the nutritional adequacy of the diet in comparison to what is currently provided in the ‘typical’ GFD ration. Comparing the nutrient intake from a ‘revised’ GFD ration to the nutrient intake from the ‘typical’ GFD ration for a 4‐year‐old child ( 7, 8), both formulations provide less than 75% of the following nutrients for at least one of the four rations (rice, cornmeal, wheat flour and sorghum): calcium, manganese, pantothenic acid, potassium, riboflavin, vitamins B12, C and D. The ‘revised’ GFD ration based on rice also provides less than 75% of the daily absorbed iron needs, and less than 75% of the daily recommended intake of vitamin A. The ‘typical’ GFD ration based on rice provides less than 75% of the daily absorbed zinc needs for a 4‐year‐old child. For an adult male ( 9, 10), both the ‘typical’ and ‘revised’ GFD rations provide less than 75% of the daily recommended intake for the following nutrients for at least one of the rations (rice, cornmeal, wheat flour and sorghum): magnesium, manganese, pantothenic acid, potassium, riboflavin, vitamin B12, B6, C and D and absorbed zinc. The ‘revised’ rations based on rice and sorghum also provide less than 75% of the daily recommended intake of calcium.
Figure 7.

Per cent of the daily recommended intake provided by the ‘typical’ general food distribution ration for selected nutrients for a 4‐year‐old child. Diets are identified by the type of grain or grain product provided, with all other components equivalent between diets.
Figure 8.

Per cent of the daily recommended intake provided by the ‘revised’ general food distribution ration for selected nutrients for a 4‐year‐old child. Diets are identified by the type of grain or grain product provided, with all other components equivalent between diets.
Figure 9.
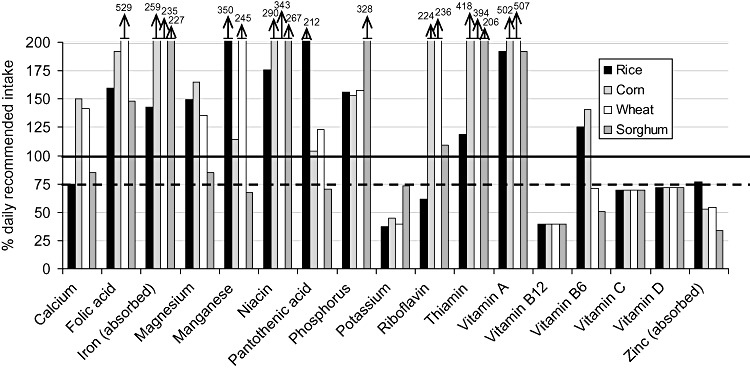
Per cent of the daily recommended intake provided by the ‘typical’ general food distribution ration for selected nutrients for an adult male. Diets are identified by the type of grain or grain product provided, with all other components equivalent between diets.
Figure 10.
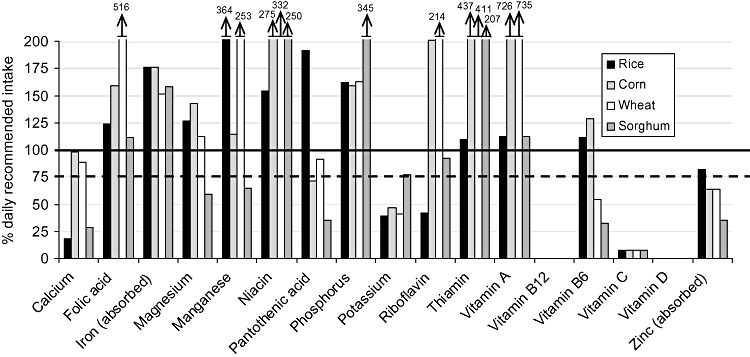
Per cent of the daily recommended intake provided by the ‘revised’ general food distribution ration for selected nutrients for an adult male. Diets are identified by the type of grain or grain product provided, with all other components equivalent between diets.
4.2.1 Age‐physiological group specific approach for developing LNS formulation
For this approach, the target groups were divided into two broad groups: (1) 6–35‐month‐old children, and (2) PLW. As described in the methods, because there are two sets of nutritional requirements within the 6–35‐month‐old group and within the PLW group, the higher of the two values for each micronutrient was used when developing the LNS formulation. After an initial assessment, the micronutrient composition of LNS was adjusted as needed to maximize nutritional adequacy while minimizing the number of nutrients that would be consumed in excess of the UL when both the GFD ‘revised’ ration and LNS were consumed.
4.2.2 ‘Age‐specific’ LNS formulation for 6–35‐month‐old infants and children
The calculated formulation of the LNS for 6–35‐month‐olds is presented in Table 19, alongside the daily recommended intake values (RDA, AI, or RNIs) that were used to assess dietary adequacy for 6–11 and 12–35‐month‐olds. Adjustments in the formulation of LNS were considered for seven nutrients: folic acid, niacin, magnesium, manganese, vitamin A, iron and zinc.
Table 19.
LNS macro‐ and micro‐nutrient content for 6–35‐month‐olds based on the higher of the two daily recommended intake values for 7–11 and 12–35 months (micronutrients only), except where noted
| Nutrient | Unit | Daily recommended intake: 7–11 mo | Daily recommended intake: 12–35 mo | LNS 6–35 mo composition, per 20g ration |
|---|---|---|---|---|
| Protein | g | 11.0 | 13 | 2.6 |
| Fat | g | 30.0 | 30–40% E | 9.6 |
| Linoleic acid | g | 4.6 | 7 | 4.5 |
| α‐linolenic acid | g | 0.5 | 0.7 | 0.6 |
| Carbohydrate | g | 95.0 | 130 | 5.3 |
| Energy | kcal | NA | NA | 118 |
| Calcium | mg | 400 | 500 | 280* |
| Copper | mg | 0.22 | 0.34 | 0.34 |
| Folic acid | µg DFE | 80 | 150 | 150 |
| Iodine | µg | 90 | 90 | 90 |
| Iron † | mg | 0.93 | 0.58 | 6 ‡ |
| Magnesium | mg | 54 | 60 | 60 |
| Manganese | mg | 0.6 | 1.2 | 1.2 |
| Niacin | mg | 4 | 6 | 6 |
| Pantothenic acid | mg | 1.8 | 2 | 2 |
| Phosphorus | mg | 275 | 460 | 190* |
| Potassium | mg | 700 | 3000 | 200* |
| Riboflavin | mg | 0.4 | 0.5 | 0.5 |
| Selenium | µg | 10 | 17 | 17 |
| Thiamine | µg | 0.3 | 0.5 | 0.5 |
| Vitamin A | µg RAE | 400 | 400 | 400 |
| Vitamin B12 | mg | 0.7 | 0.9 | 0.9 |
| Vitamin B6 | mg | 0.3 | 0.5 | 0.5 |
| Vitamin C | IU | 30 | 30 | 30 |
| Vitamin D | mg | 200 | 200 | 200 |
| Vitamin E | µg | 2.7 | 5 | 5 |
| Vitamin K | mg | 10 | 15 | 15 |
| Zinc † | mg | 1.1 | 0.7 | 5 § |
LNS, lipid‐based nutrient supplement; DFE, dietary folate equivalents; RAE, retinol activity equivalents. *Nutrients whose content in LNS is limited to less than 1 recommended nutrient intake due to technical/food science constraints. †The daily recommended intake for iron and zinc provided is the absorbed need. ‡The iron content in the LNS was based on an average of the calculated levels of iron absorption from the GFD diets for 7–11‐month‐olds of 21% and 16% for the 12–35‐month‐olds. The value was increased by 30–50% to account for uncertainty in the absorption from the base diet and LNS. §The average calculated zinc absorption from the GFD diets was 39% for the 7–11‐month‐olds and 29% for the 12–35‐month‐olds; however due to uncertainty in absorption from LNS, 5 mg was included.
Folic acid and niacin: There are differing enrichment/fortification profiles of the four grains used with respect to folic acid and niacin: wheat flour is enriched with folic acid and niacin, cornmeal is enriched with niacin, and rice and sorghum are not enriched with either. Thus, for the 24–35‐month‐old children (who consume larger quantities of the GFD ration), the hypothetical intake of folic acid and niacin from the cornmeal and wheat rations, in a few cases even before the addition of the LNS, exceeds the recommended UL. Even for the GFD rations based on rice and sorghum, which are not enriched with these nutrients, the content of niacin from the ration alone approaches the UL. The UL for folic acid is based on evidence from consumption of supplements, as ‘no adverse effects have been associated with the consumption of the amounts of folate normally found in fortified foods’ (IOM 2009, http://fnic.nal.usda.gov/nal_display/index.php?info_center=4&tax_level=3&tax_subject=256&topic_id=1342&level3_id=5141). The UL for niacin applies to all forms of the nutrient, including nicotinic acid and nicotinamide (the chemical form that is used in LNS, see section 7.2), however, ‘most of the data on the adverse effects of excess niacin intake are from studies and case reports . . . of [treatment with] pharmacological preparations containing . . . nicotinic acid’. In addition, nicotinamide ‘does not appear to be associated with flushing’, the adverse effect upon which the UL is based. Thus the levels of folic acid and niacin were not adjusted from 100% of the recommended daily intake.
Magnesium: The UL set for magnesium is for intake from magnesium salts used for pharmacological purposes (IOM 2009, http://fnic.nal.usda.gov/nal_display/index.php?info_center=4&tax_level=3&tax_subject=256&topic_id=1342&level3_id=5141). The adverse effect (osmotic diarrhea) observed from high intakes of this particular source of magnesium has not been seen with magnesium from food sources (including fortified foods), thus the level of magnesium was not altered in the LNS formulation.
Vitamin A: Adverse effects (intracranial and skeletal abnormalities) in children have been observed from chronic intake of 5500–6750 µg of preformed vitamin A/day (IOM 2009, http://fnic.nal.usda.gov/nal_display/index.php?info_center=4&tax_level=3&tax_subject=256&topic_id=1342&level3_id=5141); the UL for children 7–35 months of age is set at 600 µg/day which is very close to the recommended daily intake of 400 µg/day, allowing for a very narrow margin between adequate and excess intake. However, the no‐observed‐adverse‐effect‐level (NOAEL 16 ) for this age group is 6000 µg/day and the UL of 600 µg/day was derived based on an uncertainty factor of 10, allowing for a large margin of safety. The maximum level of vitamin A provided via LNS and the ‘revised’ GFD diet is approximately 1600 µg. Representative data from the USA show that approximately 25% of children 1–3 years of age exceed the UL for vitamin A from their diet alone, with no apparent adverse effects (Allen & Haskell 2002). In addition, home‐fortificants such as LNS and MNP, which provide a daily dose of vitamin A to meet daily requirements, can be safely provided to children who also receive high‐dose vitamin A supplementation [Home Fortification Technical Advisory Group (HFTAG) 2009]. Therefore the level of vitamin A was not reduced.
Manganese: Manganese neurotoxicity has not been observed from consumption of food sources of manganese, nor has manganese toxicity been reported in infants, children or adolescents (IOM 2009, http://fnic.nal.usda.gov/nal_display/index.php?info_center=4&tax_level=3&tax_subject=256&topic_id=1342&level3_id=5141). The extent to which dietary manganese can lead to neurotoxicity is controversial (IOM 2009, http://fnic.nal.usda.gov/nal_display/index.php?info_center=4&tax_level=3&tax_subject=256&topic_id=1342&level3_id=5141). Thus the level of manganese was not reduced in the LNS formulation.
Iron: The bioavailability of both iron and zinc expected from the GFD ration and LNS was taken into account for determination of the LNS content. For iron, the daily absorbed needs are 0.93 and 0.58 mg for 7–11 and 12–35‐month‐old infants, respectively (IOM 2009, http://fnic.nal.usda.gov/nal_display/index.php?info_center=4&tax_level=3&tax_subject=256&topic_id=1342&level3_id=5141). On the basis of the phytate and vitamin C content of the diet (including breast milk), plus an assumed marginal iron status of the population (equivalent to a ferritin concentration of 10 ug/L), the estimated average absorption of iron from the four rations including LNS is 20% for the 7–11‐month‐olds and 15% for the 12–35‐month‐olds. Thus, to achieve the absorbed iron needs of 0.93 and 0.58 mg/d for the 7–11 and 12–35 month groups, respectively, approximately 4.5 and 3.8 mg of iron would be needed in the ration under these assumptions. However, because of uncertainty about the percentage of iron actually absorbed from the GFD ration as well as from LNS, and also because the bioavailability calculations assumed an iron‐deficient population and thus a relatively high percentage absorption, this amount was increased by approximately 30–50%, to 6 mg.
Zinc: For zinc, a similar calculation was made based on the absorbed zinc needs (1.1 and 0.7 mg/d for 7–11 and 12–35‐month‐olds, respectively) and the calculated percentage absorption based on the zinc and phytate quantity of the revised GFD ration and breast milk (when applicable) (40 and 29% for 7–11 and 12–35‐month‐olds, respectively). To meet the absorbed zinc needs based on the above‐mentioned calculations, 2.7 and 2.4 mg/d for 7–11 and 12–35‐month‐olds, respectively, are needed; however, because of uncertainty regarding the level of absorption of zinc from LNS, 5 mg of zinc was included in the LNS formulation. Though including this quantity of zinc in LNS provides a total amount of zinc greater than the UL when combined with the GFD ration and breast milk, IZiNCG has suggested that the UL for children may be set too low. The UL for zinc used in this document is a NOAEL recommended by IZiNCG (because of lack of adequate data for children, and lack of confidence in setting a UL) (Hotz & Brown 2004). For children, the UL set by the IOM is very close to the RDA [5 mg/day for the UL and 4 mg/day for the RDA (IOM 2009, http://fnic.nal.usda.gov/nal_display/index.php?info_center=4&tax_level=3&tax_subject=256&topic_id=1342&level3_id=5141)], and within the range of intakes for healthy US children (median intake from food is 6.3 mg/day among 1–3‐year‐old children) (Hotz & Brown 2004).
4.2.3 Hypothetical intake from and nutrient adequacy of ‘revised’ GFD ration plus ‘age‐specific’ LNS for 6–35‐month‐old children
The nutritional adequacy of the ‘revised’ GFD rations plus LNS (6–35 month formulation) and breast milk, when applicable, for 6–8, 9–11, 12–23 and 24–35‐month‐old children is presented in 20, 21, 22, 23. This combination provides at least 75% of the daily RNI for 6–35‐month‐olds consuming any of the four hypothetical GFD rations with the exception of potassium among 12–23 and 24–35‐month‐old children, calcium among 24–35‐month‐old children consuming the rice‐ or sorghum‐based diets, and manganese among the 12–23‐month‐old children consuming the diet based on the sorghum GFD ration. The levels of fat, including recommended levels of the EFAs linoleic and alpha‐linolenic acid, reach at least 75% of the recommended level of intake for the 12–23‐month‐old children. However, for the 24–35‐month‐old children, the percentage of energy from fat is between 19 and 24% across diets (the recommended range for this age group is 30–40%). Protein adequacy of the diets is discussed in Appendix 3.
Table 20.
Amount of nutrient provided by each ‘revised’ GFD ration, breast milk and LNS (6–35 mo formulation) and per cent of the daily recommended intake provided for 6–8‐month‐old children. Diets are identified by the type of grain or grain product provided, with all other components equivalent between diets
| Nutrient | Unit | Rice | Corn | Wheat | Sorghum | ||||
|---|---|---|---|---|---|---|---|---|---|
| Amt. | % daily intake | Amt. | % daily intake | Amt. | % daily intake | Amt. | % daily intake | ||
| Protein | g | 10.9 | 99 | 10.9 | 99 | 11.5 | 104 | 11.8 | 107 |
| Fat | g | 34.4 | 115 | 34.6 | 115 | 34.5 | 115 | 34.9 | 116 |
| Linoleic acid | g | 5.0 | 108 | 5.1 | 110 | 5.0 | 109 | 5.2 | 113 |
| α‐linolenic acid | g | 0.7 | 132 | 0.7 | 132 | 0.7 | 132 | 0.7 | 134 |
| n6 : n3 ratio | 7.6 | 7.7 | 7.6 | 7.8 | |||||
| Carbohydrate | g | 65.2 | 69 | 64.8 | 68 | 64.5 | 68 | 65.2 | 69 |
| Calcium | mg | 454.9 | 114 | 476.4 | 119 | 473.9 | 118 | 457.8 | 114 |
| Copper | mg | 0.5 | 248 | 0.5 | 240 | 0.5 | 245 | 0.5 | 234 |
| Folic acid | µg DFE | 164.3 | 205 | 168.0 | 210 | 206.6 | 258 | 163.0 | 204 |
| Iodine | µg | 169.3 | 188 | 169.3 | 188 | 169.3 | 188 | 169.3 | 188 |
| Iron | mg | 6.5 | 89 | 7.3 | 100 | 7.1 | 97 | 7.2 | 98 |
| Absorbed iron* | mg | 1.6 | 171 | 1.6 | 168 | 1.6 | 168 | 1.5 | 160 |
| Magnesium | mg | 90.2 | 167 | 91.3 | 169 | 89.1 | 165 | 85.4 | 158 |
| Manganese | mg | 1.4 | 238 | 1.3 | 212 | 1.4 | 227 | 1.2 | 207 |
| Niacin | mg | 7.6 | 189 | 8.2 | 205 | 8.3 | 209 | 8.0 | 200 |
| Pantothenic acid | mg | 3.4 | 186 | 3.2 | 177 | 3.2 | 179 | 3.1 | 175 |
| Phosphorous | mg | 305.6 | 111 | 305.1 | 111 | 305.8 | 111 | 340.1 | 124 |
| Potassium | mg | 568.2 | 81 | 578.0 | 83 | 570.6 | 82 | 616.6 | 88 |
| Riboflavin | mg | 0.7 | 182 | 0.8 | 196 | 0.8 | 197 | 0.7 | 186 |
| Selenium | µg | 32.0 | 320 | 31.3 | 313 | 35.2 | 352 | 29.4 | 294 |
| Sodium | mg | 190.6 | 52 | 191.4 | 52 | 190.6 | 52 | 191.3 | 52 |
| Thiamine | mg | 0.7 | 221 | 0.8 | 256 | 0.8 | 253 | 0.7 | 231 |
| Vitamin A | µg RAE | 721.9 | 180 | 821.2 | 205 | 822.6 | 206 | 721.9 | 180 |
| Vitamin B12 | µg | 1.5 | 213 | 1.5 | 213 | 1.5 | 213 | 1.5 | 213 |
| Vitamin B6 | mg | 0.6 | 199 | 0.6 | 200 | 0.6 | 192 | 0.6 | 189 |
| Vitamin C | mg | 54.4 | 181 | 54.4 | 181 | 54.4 | 181 | 54.4 | 181 |
| Vitamin D | IU | 213.4 | 107 | 213.4 | 107 | 213.4 | 107 | 213.4 | 107 |
| Vitamin E | mg | 6.5 | 241 | 6.5 | 241 | 6.5 | 241 | 6.5 | 240 |
| Vitamin K | µg | 18.4 | 184 | 18.4 | 184 | 18.4 | 184 | 18.4 | 184 |
| Zinc | mg | 6.0 | 274 | 6.0 | 271 | 6.0 | 271 | 5.8 | 265 |
| Absorbed zinc † | mg | 2.6 | 237 | 2.3 | 212 | 2.4 | 215 | 2.2 | 200 |
GFD, general food distribution; LNS, lipid‐based nutrient supplement; DFE, dietary folate equivalents; RAE, retinol activity equivalents. *The total amount of iron in the diet is presented as well as the estimated amount of iron absorbed from the diet (based on the calculated bioavailability). The per cent of daily requirement is calculated based on the amount of absorbed iron. †The total amount of zinc in the diet is presented as well as the estimated amount of zinc absorbed from the diet (based on the calculated bioavailability). The per cent of daily requirement is calculated based on the amount of absorbed zinc.
Table 21.
Amount of nutrient provided by each ‘revised’ GFD ration, breast milk and LNS (6–35 mo formulation) and per cent of the daily recommended intake provided for 9–11‐month‐old children. Diets are identified by the type of grain or grain product provided, with all other components equivalent between diets
| Nutrient | Unit | Rice | Corn | Wheat | Sorghum | ||||
|---|---|---|---|---|---|---|---|---|---|
| Amt. | % daily intake | Amt. | % daily intake | Amt. | % daily intake | Amt. | % daily intake | ||
| Protein | g | 12.7 | 116 | 12.8 | 117 | 14.1 | 128 | 14.8 | 134 |
| Fat | g | 33.9 | 113 | 34.4 | 115 | 34.1 | 114 | 35.0 | 117 |
| Linoleic acid | g | 5.7 | 123 | 5.9 | 128 | 5.8 | 125 | 6.2 | 134 |
| α‐linolenic acid | g | 0.8 | 152 | 0.8 | 151 | 0.8 | 152 | 0.8 | 155 |
| n6 : n3 ratio | 7.5 | 7.8 | 7.6 | 7.9 | |||||
| Carbohydrate | g | 81.8 | 86 | 81.0 | 85 | 80.3 | 85 | 81.8 | 86 |
| Calcium | mg | 446.9 | 112 | 495.4 | 124 | 489.6 | 122 | 453.4 | 113 |
| Copper | mg | 0.6 | 273 | 0.6 | 254 | 0.6 | 266 | 0.5 | 241 |
| Folic acid | µg DFE | 181.0 | 226 | 189.4 | 237 | 276.3 | 345 | 178.0 | 223 |
| Iodine | µg | 180.9 | 201 | 180.9 | 201 | 180.9 | 201 | 180.9 | 201 |
| Iron | mg | 6.9 | 94 | 8.6 | 118 | 8.3 | 113 | 8.4 | 115 |
| Absorbed iron* | mg | 1.5 | 158 | 1.6 | 168 | 1.5 | 165 | 1.5 | 157 |
| Magnesium | mg | 99.5 | 184 | 102.1 | 189 | 97.3 | 180 | 88.8 | 164 |
| Manganese | mg | 1.7 | 285 | 1.4 | 227 | 1.6 | 259 | 1.3 | 216 |
| Niacin | mg | 8.3 | 208 | 9.5 | 238 | 10.1 | 251 | 9.3 | 232 |
| Pantothenic acid | mg | 3.6 | 199 | 3.2 | 179 | 3.3 | 182 | 3.1 | 173 |
| Phosphorous | mg | 337.0 | 123 | 335.7 | 122 | 337.4 | 123 | 414.5 | 151 |
| Potassium | mg | 603.8 | 86 | 625.8 | 89 | 609.3 | 87 | 712.8 | 102 |
| Riboflavin | mg | 0.7 | 182 | 0.9 | 214 | 0.9 | 216 | 0.8 | 192 |
| Selenium | µg | 34.5 | 345 | 33.1 | 331 | 41.7 | 417 | 28.6 | 286 |
| Sodium | mg | 292.8 | 79 | 294.6 | 80 | 292.7 | 79 | 294.4 | 80 |
| Thiamine | mg | 0.7 | 232 | 0.9 | 312 | 0.9 | 305 | 0.8 | 256 |
| Vitamin A | µg RAE | 719.7 | 180 | 943.1 | 236 | 946.2 | 237 | 719.7 | 180 |
| Vitamin B12 | µg | 1.4 | 206 | 1.4 | 206 | 1.4 | 206 | 1.4 | 206 |
| Vitamin B6 | mg | 0.6 | 213 | 0.7 | 218 | 0.6 | 198 | 0.6 | 193 |
| Vitamin C | mg | 52.5 | 175 | 52.5 | 175 | 52.5 | 175 | 52.5 | 175 |
| Vitamin D | IU | 212.3 | 106 | 200.3 | 100 | 212.3 | 106 | 212.3 | 106 |
| Vitamin E | mg | 6.5 | 242 | 6.5 | 242 | 6.5 | 241 | 6.5 | 240 |
| Vitamin K | µg | 21.0 | 210 | 20.9 | 209 | 21.1 | 211 | 20.9 | 209 |
| Zinc | mg | 6.3 | 288 | 6.2 | 281 | 6.2 | 281 | 5.9 | 269 |
| Absorbed zinc † | mg | 2.5 | 226 | 2.1 | 192 | 2.2 | 196 | 2.0 | 178 |
GFD, general food distribution; LNS, lipid‐based nutrient supplement; DFE, dietary folate equivalents; RAE, retinol activity equivalents. *The total amount of iron in the diet is presented as well as the estimated amount of iron absorbed from the diet (based on the calculated bioavailability). The per cent of the daily recommended intake is calculated based on the amount of absorbed iron. †The total amount of zinc in the diet is presented as well as the estimated amount of zinc absorbed from the diet (based on the calculated bioavailability). The per cent of the daily recommended intake is calculated based on the amount of absorbed zinc.
Table 22.
Amount of nutrient provided by each ‘revised’ GFD ration, breast milk and LNS (6–35 mo formulation) and per cent of the daily recommended intake provided for 12–23‐month‐old children. Diets are identified by the type of grain or grain product provided, with all other components equivalent between diets
| Nutrient | Unit | Rice | Corn | Wheat | Sorghum | ||||
|---|---|---|---|---|---|---|---|---|---|
| Amt. | % daily intake | Amt. | % daily intake | Amt. | % daily intake | Amt. | % daily intake | ||
| Protein | g | 17.6 | 136 | 17.9 | 138 | 20.7 | 159 | 22.3 | 172 |
| Fat* | g | 35.3 | 36 | 36.3 | 37 | 35.6 | 36 | 37.9 | 38 |
| Linoleic acid | g | 7.2 | 103 | 7.7 | 110 | 7.5 | 106 | 8.3 | 119 |
| α‐linolenic acid | g | 1.0 | 142 | 1.0 | 141 | 1.0 | 141 | 1.0 | 147 |
| n6 : n3 ratio | 7.3 | 7.9 | 7.5 | 8.1 | |||||
| Carbohydrate | g | 124.7 | 96 | 122.9 | 95 | 121.4 | 93 | 124.7 | 96 |
| Calcium | mg | 447.1 | 89 | 557.6 | 112 | 544.4 | 109 | 462.0 | 92 |
| Copper | mg | 0.7 | 218 | 0.6 | 191 | 0.7 | 209 | 0.6 | 172 |
| Folic acid | µg DFE | 219.4 | 146 | 238.5 | 159 | 436.2 | 291 | 212.6 | 142 |
| Iodine | µg | 211.9 | 235 | 211.9 | 235 | 211.9 | 235 | 211.9 | 235 |
| Iron | mg | 7.8 | 124 | 11.8 | 187 | 10.9 | 174 | 11.2 | 178 |
| Absorbed iron † | mg | 1.4 | 243 | 1.8 | 303 | 1.7 | 289 | 1.6 | 275 |
| Magnesium | mg | 123.4 | 206 | 129.2 | 215 | 118.2 | 197 | 98.9 | 165 |
| Manganese | mg | 2.4 | 197 | 1.6 | 131 | 2.0 | 167 | 1.4 | 117 |
| Niacin | mg | 10.2 | 169 | 12.8 | 214 | 14.1 | 235 | 12.3 | 205 |
| Pantothenic acid | mg | 4.2 | 212 | 3.4 | 170 | 3.5 | 177 | 3.2 | 158 |
| Phosphorous | mg | 418.1 | 91 | 415.2 | 90 | 419.1 | 91 | 594.5 | 129 |
| Potassium | mg | 720.1 | 24 | 770.2 | 26 | 732.5 | 24 | 968.2 | 32 |
| Riboflavin | mg | 0.8 | 151 | 1.0 | 208 | 1.1 | 212 | 0.8 | 169 |
| Selenium | µg | 41.7 | 245 | 38.4 | 226 | 58.0 | 341 | 28.3 | 167 |
| Sodium | mg | 521.1 | 52 | 525.1 | 53 | 520.8 | 52 | 524.7 | 52 |
| Thiamine | mg | 0.8 | 158 | 1.3 | 266 | 1.3 | 258 | 0.9 | 190 |
| Vitamin A | µg RAE | 747.8 | 187 | 1256.3 | 314 | 1263.3 | 316 | 747.8 | 187 |
| Vitamin B12 | µg | 1.4 | 155 | 1.4 | 155 | 1.4 | 155 | 1.4 | 155 |
| Vitamin B6 | mg | 0.7 | 150 | 0.8 | 155 | 0.6 | 129 | 0.6 | 121 |
| Vitamin C | mg | 50.8 | 169 | 50.8 | 169 | 50.8 | 169 | 50.8 | 169 |
| Vitamin D | IU | 211.2 | 106 | 211.2 | 106 | 211.2 | 106 | 211.2 | 106 |
| Vitamin E | mg | 6.7 | 135 | 6.8 | 135 | 6.7 | 134 | 6.6 | 133 |
| Vitamin K | µg | 27.0 | 180 | 26.9 | 180 | 27.2 | 181 | 26.9 | 180 |
| Zinc | mg | 7.1 | 376 | 6.8 | 357 | 6.8 | 357 | 6.2 | 324 |
| Absorbed zinc ‡ | mg | 2.4 | 344 | 1.9 | 277 | 2.0 | 284 | 1.7 | 246 |
GFD, general food distribution; LNS, lipid‐based nutrient supplement; DFE, dietary folate equivalents; RAE, retinol activity equivalents. *Because there is not a recommended absolute amount of fat for the 12–35 month age group, the per cent of energy from fat is displayed in the ‘% daily intake’ column. For this age group, the per cent of energy from fat is recommended to be between 30 and 40% of energy (Institute of Medicine). †The total amount of iron in the diet is presented as well as the estimated amount of iron absorbed from the diet (based on the calculated bioavailability). The per cent of the daily recommended intake is calculated based on the amount of absorbed iron. ‡The total amount of zinc in the diet is presented as well as the estimated amount of zinc absorbed from the diet (based on the calculated bioavailability). The per cent of the daily recommended intake is calculated based on the amount of absorbed zinc.
Table 23.
Amount of nutrient provided by each ‘revised’ GFD ration, breast milk and LNS (6–35 mo formulation) and per cent of the daily recommended intake provided for 24–35‐month‐old children. Diets are identified by the type of grain or grain product provided, with all other components equivalent between diets
| Nutrient | Unit | Rice | Corn | Wheat | Sorghum | ||||
|---|---|---|---|---|---|---|---|---|---|
| Amt. | % daily intake | Amt. | % daily intake | Amt. | % daily intake | Amt. | % daily intake | ||
| Protein | g | 23.0 | 177 | 23.7 | 182 | 29.5 | 227 | 32.9 | 253 |
| Fat* | g | 21.9 | 19 | 24.1 | 21 | 22.7 | 20 | 27.4 | 24 |
| Linoleic acid | g | 10.3 | 147 | 11.3 | 162 | 10.8 | 154 | 12.6 | 180 |
| α‐linolenic acid | g | 1.4 | 207 | 1.4 | 205 | 1.4 | 205 | 1.5 | 218 |
| n6 : n3 ratio | 7.1 | 7.9 | 7.5 | 8.3 | |||||
| Carbohydrate | g | 179.7 | 138 | 175.9 | 135 | 172.6 | 133 | 179.7 | 138 |
| Calcium | mg | 331.9 | 66 | 564.6 | 113 | 536.7 | 107 | 363.2 | 73 |
| Copper | mg | 0.9 | 271 | 0.7 | 213 | 0.9 | 250 | 0.6 | 172 |
| Folic acid | µg DFE | 294.5 | 196 | 334.9 | 223 | 751.2 | 501 | 280.2 | 187 |
| Iodine | µg | 222.7 | 247 | 222.7 | 247 | 222.7 | 247 | 222.7 | 247 |
| Iron | mg | 9.5 | 150 | 17.8 | 283 | 16.1 | 255 | 16.7 | 265 |
| Absorbed iron † | mg | 1.1 | 197 | 1.7 | 300 | 1.6 | 278 | 1.5 | 267 |
| Magnesium | mg | 156.0 | 260 | 168.3 | 280 | 145.1 | 242 | 104.5 | 174 |
| Manganese | mg | 3.6 | 303 | 2.0 | 164 | 2.9 | 241 | 1.6 | 136 |
| Niacin | mg | 13.2 | 220 | 18.8 | 313 | 21.4 | 357 | 17.7 | 294 |
| Pantothenic acid | mg | 4.8 | 239 | 3.0 | 152 | 3.3 | 166 | 2.5 | 126 |
| Phosphorous | mg | 520.4 | 113 | 514.3 | 112 | 522.4 | 114 | 892.2 | 194 |
| Potassium | mg | 732.7 | 24 | 838.3 | 28 | 759.0 | 25 | 1255.5 | 42 |
| Riboflavin | mg | 0.7 | 132 | 1.3 | 252 | 1.3 | 262 | 0.9 | 170 |
| Selenium | µg | 47.5 | 280 | 40.5 | 238 | 82.0 | 482 | 19.4 | 114 |
| Sodium | mg | 865.2 | 87 | 873.6 | 87 | 864.5 | 86 | 872.7 | 87 |
| Thiamine | mg | 0.9 | 177 | 2.0 | 406 | 1.9 | 387 | 1.2 | 244 |
| Vitamin A | µg RAE | 596.8 | 149 | 1668.2 | 417 | 1682.9 | 421 | 596.8 | 149 |
| Vitamin B12 | µg | 0.9 | 100 | 0.9 | 100 | 0.9 | 100 | 0.9 | 100 |
| Vitamin B6 | mg | 0.9 | 184 | 1.0 | 197 | 0.7 | 141 | 0.6 | 125 |
| Vitamin C | mg | 31.0 | 103 | 31.0 | 103 | 31.0 | 103 | 31.0 | 103 |
| Vitamin D | IU | 200.0 | 100 | 200.0 | 100 | 200.0 | 100 | 200.0 | 100 |
| Vitamin E | mg | 6.2 | 124 | 6.3 | 125 | 6.1 | 122 | 6.0 | 119 |
| Vitamin K | µg | 38.1 | 254 | 37.9 | 253 | 38.5 | 256 | 37.9 | 253 |
| Zinc | mg | 8.2 | 434 | 7.5 | 392 | 7.5 | 392 | 6.2 | 324 |
| Absorbed zinc ‡ | mg | 2.3 | 334 | 1.8 | 254 | 1.8 | 260 | 1.5 | 208 |
GFD, general food distribution; LNS, lipid‐based nutrient supplement; DFE, dietary folate equivalents; RAE, retinol activity equivalents. *Because there is not a recommended absolute amount of fat for the 12–35 mo age group, the per cent of energy from fat is displayed in the ‘% daily intake’ column. For this age group, the per cent of energy from fat is recommended to be between 30 and 40% of energy (Institute of Medicine). †The total amount of iron in the diet is presented as well as the estimated amount of iron absorbed from the diet (based on the calculated bioavailability). The per cent of daily requirement is calculated based on the amount of absorbed iron. ‡The total amount of zinc in the diet is presented as well as the estimated amount of zinc absorbed from the diet (based on the calculated bioavailability). The per cent of the daily recommended intake is calculated based on the amount of absorbed zinc.
Table 24 presents the nutrients that were provided in excess amounts by the hypothetical intake from the GFD ration, breast milk (when applicable) and the LNS (6–35 month formulation), even after adjustment of the LNS formulation.
Table 24.
Nutrients that exceed the UL when the 6–35 mo formulation LNS is added to the hypothetical intake from the ‘revised’ GFD ration, and breast milk (when applicable). Presented by age group and identified by the staple grain used in the GFD hypothetical intake (with all other components being equal between diets)
| Age group (mo) | Rice | Cornmeal | Wheat flour | Sorghum |
|---|---|---|---|---|
| 6–8 | Vitamin A Zinc | Vitamin A | Vitamin A | Vitamin A |
| 9–11 | Vitamin A Zinc | Vitamin A Zinc | Vitamin A Zinc | Vitamin A |
| 12–23 | Magnesium* Niacin Vitamin A Manganese | Magnesium* Niacin Vitamin A* | Magnesium* Niacin Vitamin A* Folic acid Manganese | Magnesium Niacin Vitamin A |
| 24–35 | Magnesium* Niacin Manganese* Folic acid Zinc | Folic acid Magnesium* Niacin* Vitamin A* | Folic acid* Magnesium* Manganese Niacin* Vitamin A* | Magnesium Niacin Folic acid |
UL, Upper Levels; LNS, lipid‐based nutrient supplement; GFD, general food distribution. *Nutrient quantity from the hypothetical intake of the ‘revised’ GFD ration already exceeds UL (before addition of LNS).
4.2.4 ‘Age‐specific’ LNS formulation for PLW
The desired nutrient composition of the LNS developed for use by PLW, and the recommended intake values during pregnancy and lactation, are presented in Table 25. The same process as described above for adjusting micronutrients that were in excess of the UL was used. In this case, folic acid, niacin, magnesium, iron and zinc were considered for adjustment in the LNS PLW formulation.
Table 25.
LNS macro‐ and micro‐nutrient content for pregnant and lactating women (PLW) based on the higher of the two RNI levels for pregnancy and lactation, except where noted
| Nutrient | Unit | Daily recommended intake: Pregnancy | Daily recommended intake: Lactation | LNS PLW composition, per 20 g ration |
|---|---|---|---|---|
| Protein | g | 71 | 71 | 2.6 |
| Fat | g | 20–35 %E | 20–35 %E | 9.6 |
| Linoleic acid | g | 13* | 13* | 4.5 |
| α‐linolenic acid | g | 1.4* | 1.3* | 0.6 |
| Carbohydrate | g | 175 | 210 | 5.3 |
| Energy | kcal | NA | NA | 118 |
| Calcium | mg | 1200 | 1000 | 280* |
| Copper | mg | 1 | 1.3 | 1.3 |
| Folic acid | µg DFE | 600 | 500 | 600 |
| Iodine | µg | 200 | 200 | 200 |
| Iron † | mg | 4.6 | 1.5 | 20 ‡ |
| Magnesium | mg | 220 | 270 | 65* |
| Manganese | mg | 2 | 2.6 | 2.6 |
| Niacin | mg | 18 | 17 | 18 |
| Pantothenic acid | mg | 6 | 7 | 7 |
| Phosphorus | mg | 700 | 700 | 190* |
| Potassium | mg | 4700 | 5100 | 200* |
| Riboflavin | mg | 1.4 | 1.6 | 1.6 |
| Selenium | µg | 29 | 35 | 35 |
| Sodium | mg | 1500 | 1500 | 0 |
| Thiamine | mg | 1.4 | 1.5 | 1.5 |
| Vitamin A | µg RAE | 800 | 850 | 850 |
| Vitamin B12 | µg | 2.6 | 2.8 | 2.8 |
| Vitamin B6 | mg | 1.9 | 2 | 2 |
| Vitamin C | mg | 55 | 70 | 70 |
| Vitamin D | IU | 200 | 200 | 200 |
| Vitamin E | mg | 15 | 19 | 19 |
| Vitamin K | µg | 55 | 55 | 55 |
| Zinc † | mg | 3.2 | 3.6 | 23 § |
RNI, Recommended Nutrient Intake; DFE, dietary folate equivalents; RAE, retinol activity equivalents; LNS, lipid‐based nutrient supplement; GFD, general food distribution. *Nutrients whose content in LNS is limited by technical/food science constraints. †The daily recommended intake for iron and zinc provided is the ‘absorbed’ requirement. ‡The iron content in the LNS was based on an average of the estimated levels of iron absorption from the GFD diets of 25% during pregnancy and 13% during lactation. The value was increased by 30–50% to account for uncertainty in the absorption from the base diet and LNS. §The zinc content in the LNS was based on an average of the calculated levels of zinc absorption from the GFD diets of 14% during pregnancy and 24% during lactation.
Folic acid: As discussed previously, the folic acid level set at 100% RNI was not adjusted in the LNS PLW formulation, as no adverse effects have been reported from consumption of folic acid from food.
Niacin: Because the form of niacin used in LNS (nicotinamide) is not associated with adverse effects, the level of niacin at 100% of the RNI was not adjusted.
Magnesium: The level of magnesium is already constrained because of taste/technological issues at 65 mg/dose of LNS, and was not further reduced.
Iron: For iron, the absorbed needs are 4.6 and 1.5 mg/d for PLW, respectively. The absorption from the ‘base’ GFD ration (before addition of LNS) was estimated to be approximately 5% (not accounting for higher iron absorption during pregnancy, as the product would be used for both PLW). The amount of iron provided in the GFD ration for PLW ranges from 11 to 36 mg. Thus from the GFD ration alone, between 0.6 and 1.8 mg of iron could be expected to be absorbed. For pregnant women, LNS with approximately 16 mg of iron would provide another 4.0 mg to reach the target of at least 4.6 mg, assuming at least 25% absorption (calculations performed to estimate the amount of iron absorbed from LNS based on its phytate and vitamin C content, as well as an assumed marginal iron status, yielded estimates between 22 and 32% absorption). However, because of uncertainty regarding the amount of iron absorbed from the GFD ration as well as from the LNS, the amount to be provided in the LNS is set at 20 mg of iron. Though this amount increases the total iron intake for PLW above the UL (which is 45 mg) in three of the four diets, it is presumed that iron naturally occurring in foods or from fortificants does not lead to gastrointestinal distress, and pregnant women frequently consume more than the UL (from fortificants and supplements 17 ) (IOM 2009, http://fnic.nal.usda.gov/nal_display/index.php?info_center=4&tax_level=3&tax_subject=256&topic_id=1342&level3_id=5141).
Zinc: For zinc, a calculation was made based on the absorbed zinc needs (3.2 and 3.6 mg/d for pregnancy and lactation, respectively) and the estimated level of absorption based on the zinc and phytate quantity of the diet (i.e. GFD ration plus LNS). Although the estimated zinc absorption from the diet was roughly similar for the diets consumed by the PLW (approximately 14%), during lactation, zinc absorption from the diet is estimated to increase by approximately 10% (Hotz & Brown 2004). Assuming approximately 14% absorption for pregnant women and 15% absorption for lactating women, the amount of zinc needed to meet the absorbed needs is approximately 23 mg for PLW, and this amount was included in the LNS formulation.
4.2.5 Hypothetical intake from and nutrient adequacy of ‘revised’ GFD ration plus ‘age‐specific’ LNS for PLW
26, 27 display the total nutrient intake from the ‘revised’ GFD ration plus LNS (PLW formulation). This combination provides at least 75% of the recommended daily intake for PLW of all nutrients, with the exception of calcium in the rice and sorghum diets, and potassium, which is below this cutoff across all four diets. For fat, although the recommended levels of EFA are met, the percentage of energy derived from fat in the diet is low, i.e. <20–35% of energy, the recommended range for PLW. Protein adequacy of the diets is discussed in Appendix 3.
Table 26.
Amount of nutrient provided by each ‘revised’ GFD diet and LNS (PLW formulation) and per cent of the daily recommended intake provided for pregnant women. Diets are identified by the type of grain or grain product provided, with all other components equivalent between diets
| Nutrient | Unit | Rice | Corn | Wheat | Sorghum | ||||
|---|---|---|---|---|---|---|---|---|---|
| Amt. | % daily intake | Amt. | % daily intake | Amt. | % daily intake | Amt. | % daily intake | ||
| Protein | g | 58.3 | 82 | 60.0 | 85 | 76.0 | 107 | 85.1 | 120 |
| Fat* | g | 43.2 | 15 | 49.1 | 17 | 45.2 | 16 | 58.1 | 20 |
| Linoleic acid | g | 20.3 | 156 | 23.2 | 179 | 21.6 | 167 | 26.7 | 206 |
| α‐linolenic acid | g | 2.9 | 211 | 2.9 | 207 | 2.9 | 209 | 3.2 | 226 |
| n6 : n3 ratio | 6.9 | 8.0 | 7.4 | 8.5 | |||||
| Carbohydrate | g | 480.7 | 275 | 470.3 | 269 | 461.4 | 264 | 480.7 | 275 |
| Calcium | mg | 421.6 | 35 | 1056.0 | 88 | 980.0 | 82 | 506.9 | 42 |
| Copper | mg | 2.9 | 288 | 2.3 | 234 | 2.7 | 269 | 2.0 | 197 |
| Folic acid | µg DFE | 993.9 | 166 | 1104.0 | 184 | 2239.1 | 373 | 954.9 | 159 |
| Iodine | µg | 566.5 | 283 | 566.5 | 283 | 566.5 | 283 | 566.5 | 283 |
| Iron | mg | 29.4 | 163 | 52.2 | 290 | 47.5 | 264 | 49.1 | 273 |
| Absorbed iron † | mg | 7.6 | 165 | 13.8 | 300 | 12.5 | 272 | 13.0 | 282 |
| Magnesium | mg | 326.7 | 149 | 360.1 | 164 | 297.0 | 135 | 186.3 | 85 |
| Manganese | mg | 9.2 | 462 | 4.7 | 234 | 7.2 | 361 | 3.8 | 189 |
| Niacin | mg | 37.5 | 209 | 52.9 | 294 | 60.1 | 334 | 49.8 | 277 |
| Pantothenic acid | mg | 14.6 | 243 | 9.8 | 164 | 10.6 | 177 | 8.4 | 140 |
| Phosphorous | mg | 1090.6 | 156 | 1074.0 | 153 | 1096.3 | 157 | 2104.3 | 301 |
| Potassium | mg | 1652.1 | 35 | 1940.0 | 41 | 1723.7 | 37 | 3077.4 | 65 |
| Riboflavin | mg | 2.0 | 145 | 3.7 | 263 | 3.8 | 272 | 2.6 | 183 |
| Selenium | µg | 118.2 | 408 | 99.2 | 342 | 212.3 | 732 | 41.6 | 143 |
| Sodium | mg | 2388.8 | 159 | 2411.8 | 161 | 2387.1 | 159 | 2409.4 | 161 |
| Thiamine | mg | 2.5 | 182 | 5.7 | 405 | 5.4 | 386 | 3.5 | 248 |
| Vitamin A | µg RAE | 1386.5 | 173 | 4307.4 | 538 | 4347.5 | 543 | 1386.5 | 173 |
| Vitamin B12 | µg | 2.8 | 108 | 2.8 | 108 | 2.8 | 108 | 2.8 | 108 |
| Vitamin B6 | mg | 3.2 | 166 | 3.3 | 175 | 2.6 | 135 | 2.3 | 123 |
| Vitamin C | mg | 72.8 | 132 | 72.8 | 132 | 72.8 | 132 | 72.8 | 132 |
| Vitamin D | IU | 200.0 | 100 | 200.0 | 100 | 200.0 | 100 | 200.0 | 100 |
| Vitamin E | mg | 22.2 | 148 | 22.4 | 150 | 22.0 | 146 | 21.6 | 144 |
| Vitamin K | µg | 118.0 | 214 | 117.4 | 214 | 119.0 | 216 | 117.4 | 214 |
| Zinc | mg | 31.8 | 245 | 29.7 | 228 | 29.7 | 228 | 26.2 | 201 |
| Absorbed zinc ‡ | mg | 5.2 | 163 | 3.9 | 122 | 4.0 | 126 | 3.3 | 92 |
GFD, general food distribution; LNS, lipid‐based nutrient supplement; PLW, pregnant and lactating women; DFE, dietary folate equivalents; RAE, retinol activity equivalents. *Because there is not a recommended absolute amount of fat for pregnant and lactating women, the per cent of energy from fat is displayed in the ‘% daily intake’ column. For this physiologic group, the per cent of energy from fat is recommended to be between 20 and 35% of energy (Institute of Medicine). †The total amount of iron in the diet is presented as well as the estimated amount of iron absorbed from the diet (based on the calculated bioavailability). The per cent of daily recommended intake is calculated based on the amount of absorbed iron. ‡The total amount of zinc in the diet is presented as well as the estimated amount of zinc absorbed from the diet (based on the calculated bioavailability). The per cent of daily recommended intake is calculated based on the amount of absorbed zinc.
Table 27.
Amount of nutrient provided by each ‘revised’ GFD diet and LNS (PLW formulation) and per cent of the daily recommended intake provided for lactating women. Diets are identified by the type of grain or grain product provided, with all other components equivalent between diets
| Nutrient | Unit | Rice | Corn | Wheat | Sorghum | ||||
|---|---|---|---|---|---|---|---|---|---|
| Amt. | % daily intake | Amt. | % daily intake | Amt. | % daily intake | Amt. | % daily intake | ||
| Protein | g | 63.4 | 89 | 65.3 | 92 | 82.8 | 117 | 92.7 | 131 |
| Fat* | g | 46.3 | 15 | 52.8 | 17 | 48.4 | 15 | 62.5 | 20 |
| Linoleic acid | g | 21.8 | 168 | 25.0 | 192 | 23.2 | 179 | 28.8 | 221 |
| α‐linolenic acid | g | 3.2 | 243 | 3.1 | 240 | 3.1 | 241 | 3.4 | 261 |
| n6 : n3 ratio | 6.9 | 8.0 | 7.4 | 8.5 | |||||
| Carbohydrate | g | 524.4 | 250 | 513.1 | 244 | 503.3 | 240 | 524.4 | 250 |
| Calcium | mg | 434.6 | 43 | 1127.3 | 113 | 1044.3 | 104 | 527.8 | 53 |
| Copper | mg | 3.0 | 233 | 2.4 | 188 | 2.8 | 217 | 2.0 | 156 |
| Folic acid | µg DFE | 1030.1 | 206 | 1150.3 | 230 | 2389.8 | 478 | 987.6 | 198 |
| Iodine | µg | 602.4 | 301 | 602.4 | 301 | 602.4 | 301 | 602.4 | 301 |
| Iron | mg | 30.3 | 202 | 55.1 | 368 | 50.0 | 334 | 51.8 | 345 |
| Absorbed iron † | mg | 4.5 | 302 | 6.7 | 444 | 6.2 | 414 | 5.9 | 396 |
| Magnesium | mg | 350.8 | 130 | 387.3 | 143 | 318.4 | 118 | 197.4 | 73 |
| Manganese | mg | 9.8 | 379 | 4.9 | 188 | 7.6 | 294 | 3.9 | 150 |
| Niacin | mg | 39.3 | 231 | 56.1 | 330 | 64.0 | 376 | 52.7 | 310 |
| Pantothenic acid | mg | 15.3 | 218 | 10.1 | 144 | 11.0 | 157 | 8.5 | 122 |
| Phosphorous | mg | 1173.5 | 168 | 1155.3 | 165 | 1179.6 | 169 | 2280.3 | 326 |
| Potassium | mg | 1785.7 | 35 | 2100.1 | 41 | 1864.0 | 37 | 3342.1 | 66 |
| Riboflavin | mg | 2.1 | 130 | 3.9 | 242 | 4.0 | 250 | 2.6 | 165 |
| Selenium | µg | 125.9 | 360 | 105.1 | 300 | 228.6 | 653 | 42.2 | 120 |
| Sodium | mg | 2622.7 | 175 | 2647.8 | 177 | 2620.8 | 175 | 2645.2 | 176 |
| Thiamine | mg | 2.6 | 176 | 6.0 | 403 | 5.8 | 385 | 3.7 | 243 |
| Vitamin A | µg RAE | 1435.6 | 169 | 4625.1 | 544 | 4668.9 | 549 | 1435.6 | 169 |
| Vitamin B12 | µg | 2.8 | 100 | 2.8 | 100 | 2.8 | 100 | 2.8 | 100 |
| Vitamin B6 | mg | 3.3 | 163 | 3.4 | 172 | 2.6 | 131 | 2.4 | 118 |
| Vitamin C | mg | 73.0 | 104 | 73.0 | 104 | 73.0 | 104 | 73.0 | 104 |
| Vitamin D | IU | 200.0 | 100 | 200.0 | 100 | 200.0 | 100 | 200.0 | 100 |
| Vitamin E | mg | 22.5 | 118 | 22.8 | 120 | 22.2 | 117 | 21.9 | 115 |
| Vitamin K | µg | 123.7 | 225 | 123.2 | 224 | 124.8 | 227 | 123.2 | 224 |
| Zinc | mg | 32.6 | 326 | 30.3 | 303 | 30.3 | 303 | 26.5 | 265 |
| Absorbed zinc ‡ | mg | 5.7 | 159 | 4.3 | 119 | 4.4 | 122 | 3.6 | 101 |
GFD, general food distribution; LNS, lipid‐based nutrient supplement; PLW, pregnant and lactating women; DFE, dietary folate equivalents; RAE, retinol activity equivalents. *Because there is not a recommended absolute amount of fat for pregnant and lactating women, the per cent of energy from fat is displayed in the ‘% daily intake’ column. For this physiologic group, the per cent of energy from fat is recommended to be between 20 and 35% of energy (Institute of Medicine). †The total amount of iron in the diet is presented as well as the estimated amount of iron absorbed from the diet (based on the calculated bioavailability). The per cent of daily recommended intake is calculated based on the amount of absorbed iron. ‡The total amount of zinc in the diet is presented as well as the estimated amount of zinc absorbed from the diet (based on the calculated bioavailability). The per cent of daily recommended intake is calculated based on the amount of absorbed zinc.
In terms of excess intakes (Table 28), folic acid is above the UL for all diets. In the diets in which niacin and vitamin A (and in most cases magnesium) exceed the UL, generally, the intake from the ration was already above the UL before addition of the LNS.
Table 28.
Nutrients that exceed the UL when the PLW LNS formulation is added to the hypothetical intake from the GFD ration. Presented by physiologic group and identified by the staple grain used in the GFD hypothetical intake (with all other components being equal between diets)
| Age group (mo) | Rice | Cornmeal | Wheat flour | Sorghum |
|---|---|---|---|---|
| Pregnant | Folic acid Niacin | Magnesium* Niacin* Vitamin A* Folic acid Iron | Folic acid* Niacin* Vitamin A* Iron | Folic acid Iron |
| Lactating | Folic acid Niacin Magnesium | Magnesium* Vitamin A* Folic acid Iron | Folic acid* Niacin* Vitamin A* Iron | Niacin* Folic acid Iron |
UL, Upper Levels; PLW, pregnant and lactating women; LNS, lipid‐based nutrient supplement; GFD, general food distribution. *Nutrient quantity from the hypothetical intake of the GFD ration (before addition of LNS) already exceeds the UL.
4.3 ‘One‐size‐fits‐all’ approach for developing LNS formulation
For this approach, the needs of all age/physiological groups were to be met by a single LNS formulation. To achieve this, because of the wide range of nutrient requirements, it was assumed that the PLW would consume two rations per day, while the children 6–35 months of age would consume only one. The hypothetical intake from the GFD ration was adjusted accordingly for the PLW to allow for the additional energy coming from the LNS (236 kcal rather than 118 kcal). The formulation that was developed for the 6–35‐month‐old infants was used as a basis for the LNS formulation, with slight increases in the content of vitamins B12, B6 and E in order to meet at least 75% of the recommended intake for PLW (Table 29).
Table 29.
LNS micronutrient content for all groups, ‘one‐size fits all’ approach
| Nutrient | Unit | LNS ‘one‐size’ composition, per 20 g ration | Amount in two rations (40 g) |
|---|---|---|---|
| Protein | g | 2.6 | 5.2 |
| Fat | g | 9.6 | 19.2 |
| Linoleic acid | g | 4.5 | 8.92 |
| α‐linolenic acid | g | 0.6 | 1.16 |
| Carbohydrate | g | 5.3 | 10.6 |
| Energy | kcal | 118 | 236 |
| Calcium | mg | 280* | 560 |
| Copper | mg | 0.34 | 0.68 |
| Folic acid | µg DFE | 150 | 300 |
| Iodine | µg | 90 | 180 |
| Iron | mg | 6 | 12 |
| Magnesium | mg | 60 | 120 |
| Manganese | mg | 1.2 | 2.4 |
| Niacin (total) | mg | 6 | 12 |
| Pantothenic acid | mg | 2 | 4 |
| Phosphorus | mg | 190* | 380 |
| Potassium | mg | 200* | 400 |
| Riboflavin | mg | 0.5 | 1 |
| Selenium | µg | 17 | 34 |
| Thiamine | mg | 0.5 | 1 |
| Vitamin A | µg | 400 | 800 |
| Vitamin B12 | µg | 1.4 † | 2.8 |
| Vitamin B6 | mg | 1 † | 2 |
| Vitamin C | mg | 30 | 60 |
| Vitamin D | IU | 200 | 400 |
| Vitamin E | mg | 6 † | 12 |
| Vitamin K | µg | 15 | 30 |
| Zinc | mg | 5 | 10 |
LNS, lipid‐based nutrient supplement; DFE, dietary folate equivalents; RDA, Recommended Dietary Allowance; RNI, Recommended Nutrient Intake. *Nutrients whose content in LNS is limited by technical/food science concerns. †Content adjusted because intake <75% of RDA/RNI for some groups.
Because essentially the same LNS formulation as in the ‘age‐specific’ approach was used for the ‘one‐size’ approach for 6–35‐month‐old children, the macro‐ and micronutrient content of the overall ‘revised’ GFD ration plus LNS (and breast milk when applicable) does not change significantly. The nutrient content of the combination of the ‘revised’ GFD ration plus ‘one‐size’ LNS does differ slightly for PLW (because they are receiving two doses of LNS) (30, 31). The total fat content of the diet reached the recommended 20–35% of energy for the cornmeal‐ and sorghum‐based rations for the pregnant women and for the sorghum ration for the lactating women, but remained just below the recommended range for the other rations. Protein adequacy of the diets is discussed in Appendix 3. The one‐size formulation provides for at least 75% of the recommended intake of all micronutrients for all groups with the following exceptions:
Table 30.
Amount of nutrient provided by each ‘revised’ GFD diet and LNS (‘one size’ formulation) and per cent of the daily recommended intake provided for pregnant women. Diets are identified by the type of grain or grain product provided, with all other components equivalent between diets
| Nutrient | Unit | Rice | Corn | Wheat | Sorghum | ||||
|---|---|---|---|---|---|---|---|---|---|
| Amt. | % daily intake | Amt. | % daily intake | Amt. | % daily intake | Amt. | % daily intake | ||
| Protein | g | 60.9 | 86 | 62.6 | 88 | 78.6 | 111 | 87.7 | 124 |
| Fat* | g | 52.8 | 18 | 58.7 | 20 | 54.8 | 19 | 67.7 | 24 |
| Linoleic acid | g | 24.8 | 191 | 27.7 | 213 | 26.1 | 201 | 31.2 | 240 |
| α‐linolenic acid | g | 3.5 | 252 | 3.5 | 249 | 3.5 | 250 | 3.7 | 267 |
| n6 : n3 ratio | 7.0 | 8.0 | 7.5 | 8.3 | |||||
| Carbohydrate | g | 486.0 | 278 | 475.6 | 272 | 466.7 | 267 | 486.0 | 278 |
| Calcium | mg | 701.6 | 58 | 1336.0 | 111 | 1260.0 | 105 | 786.9 | 66 |
| Copper | mg | 2.3 | 226 | 1.7 | 172 | 2.1 | 207 | 1.3 | 135 |
| Folic acid | µg DFE | 693.9 | 116 | 804.0 | 134 | 1939.1 | 323 | 654.9 | 109 |
| Iodine | µg | 546.5 | 273 | 546.5 | 273 | 546.5 | 273 | 546.5 | 273 |
| Iron | mg | 21.4 | 119 | 44.2 | 245 | 39.5 | 219 | 41.1 | 229 |
| Absorbed iron † | mg | 5.6 | 121 | 11.8 | 256 | 10.5 | 228 | 11.0 | 238 |
| Magnesium | mg | 381.7 | 174 | 415.1 | 189 | 352.0 | 160 | 241.3 | 110 |
| Manganese | mg | 9.0 | 452 | 4.5 | 224 | 7.0 | 351 | 3.6 | 179 |
| Niacin | mg | 31.5 | 175 | 46.9 | 261 | 54.1 | 301 | 43.8 | 243 |
| Pantothenic acid | mg | 11.6 | 193 | 6.8 | 114 | 7.6 | 127 | 5.4 | 90 |
| Phosphorous | mg | 1280.6 | 183 | 1264.0 | 181 | 1286.3 | 184 | 2294.3 | 328 |
| Potassium | mg | 1852.1 | 39 | 2140.0 | 46 | 1923.7 | 41 | 3277.4 | 70 |
| Riboflavin | mg | 1.4 | 103 | 3.1 | 220 | 3.2 | 229 | 2.0 | 140 |
| Selenium | µg | 117.2 | 404 | 98.2 | 339 | 211.3 | 729 | 40.6 | 140 |
| Sodium | mg | 2388.8 | 159 | 2411.8 | 161 | 2387.1 | 159 | 2409.4 | 161 |
| Thiamine | mg | 2.0 | 146 | 5.2 | 369 | 4.9 | 351 | 3.0 | 212 |
| Vitamin A | µg RAE | 1336.5 | 167 | 4257.4 | 532 | 4297.5 | 537 | 1336.5 | 167 |
| Vitamin B12 | µg | 2.8 | 108 | 2.8 | 108 | 2.8 | 108 | 2.8 | 108 |
| Vitamin B6 | mg | 3.2 | 166 | 3.3 | 175 | 2.6 | 135 | 2.3 | 123 |
| Vitamin C | mg | 62.8 | 114 | 62.8 | 114 | 62.8 | 114 | 62.8 | 114 |
| Vitamin D | IU | 400.0 | 200 | 400.0 | 200 | 400.0 | 200 | 400.0 | 200 |
| Vitamin E | mg | 15.2 | 101 | 15.4 | 103 | 15.0 | 100 | 14.6 | 98 |
| Vitamin K | µg | 93.0 | 169 | 92.4 | 168 | 94.0 | 171 | 92.4 | 168 |
| Zinc | mg | 18.8 | 145 | 16.7 | 128 | 16.7 | 128 | 13.2 | 101 |
| Absorbed zinc ‡ | mg | 3.5 | 109 | 2.5 | 79 | 2.6 | 82 | 2.0 | 63 |
GFD, general food distribution; LNS, lipid‐based nutrient supplement; DFE, dietary folate equivalents; RAE, retinol activity equivalents. *Because there is not a recommended absolute amount of fat for pregnant and lactating women, the per cent of energy from fat is displayed in the ‘% daily intake column’. For this physiologic group, the per cent of energy from fat is recommended to be between 20 and 35% of energy (Institute of Medicine). †The total amount of iron in the diet is presented as well as the estimated amount of iron absorbed from the diet (based on the calculated bioavailability). The per cent of the daily recommended intake is calculated based on the amount of absorbed iron. ‡The total amount of zinc in the diet is presented as well as the estimated amount of zinc absorbed from the diet (based on the calculated bioavailability). The per cent of the daily recommended intake is calculated based on the amount of absorbed zinc.
Table 31.
Amount of nutrient provided by each ‘revised’ GFD diet and LNS (‘one size’ formulation) and per cent of the daily recommended intake provided for lactating women. Diets are identified by the type of grain or grain product provided, with all other components equivalent between diets
| Nutrient | Unit | Rice | Corn | Wheat | Sorghum | ||||
|---|---|---|---|---|---|---|---|---|---|
| Amt. | % daily intake | Amt. | % daily intake | Amt. | % daily intake | Amt. | % daily intake | ||
| Protein | g | 66.0 | 93 | 67.9 | 96 | 85.4 | 120 | 95.3 | 134 |
| Fat* | g | 55.9 | 18 | 62.4 | 20 | 58.0 | 19 | 72.1 | 23 |
| Linoleic acid | g | 8.9 | 69 | 8.9 | 69 | 8.9 | 69 | 8.9 | 69 |
| α‐linolenic acid | g | 1.2 | 89 | 1.2 | 89 | 1.2 | 89 | 1.2 | 89 |
| n6 : n3 ratio | 7.7 | 7.7 | 7.7 | 7.7 | |||||
| Carbohydrate | g | 529.7 | 252 | 518.4 | 247 | 508.6 | 242 | 529.7 | 252 |
| Calcium | mg | 714.6 | 71 | 1407.3 | 141 | 1324.3 | 132 | 807.8 | 81 |
| Copper | mg | 2.4 | 185 | 1.8 | 140 | 2.2 | 169 | 1.4 | 108 |
| Folic acid | µg DFE | 730.1 | 146 | 850.3 | 170 | 2089.8 | 418 | 687.6 | 138 |
| Iodine | µg | 582.4 | 291 | 582.4 | 291 | 582.4 | 291 | 582.4 | 291 |
| Iron | mg | 22.3 | 149 | 47.1 | 314 | 42.0 | 280 | 43.8 | 292 |
| Absorbed iron † | mg | 3.0 | 201 | 5.2 | 345 | 4.7 | 316 | 4.6 | 304 |
| Magnesium | mg | 405.8 | 150 | 442.3 | 164 | 373.4 | 138 | 252.4 | 93 |
| Manganese | mg | 9.6 | 371 | 4.7 | 180 | 7.4 | 286 | 3.7 | 142 |
| Niacin | mg | 33.3 | 196 | 50.1 | 295 | 58.0 | 341 | 46.7 | 275 |
| Pantothenic acid | mg | 12.3 | 175 | 7.1 | 101 | 8.0 | 114 | 5.5 | 79 |
| Phosphorous | mg | 1363.5 | 195 | 1345.3 | 192 | 1369.6 | 196 | 2470.3 | 353 |
| Potassium | mg | 1985.7 | 39 | 2300.1 | 45 | 2064.0 | 40 | 3542.1 | 69 |
| Riboflavin | mg | 1.5 | 92 | 3.3 | 204 | 3.4 | 213 | 2.0 | 128 |
| Selenium | µg | 124.9 | 357 | 104.1 | 297 | 227.6 | 650 | 41.2 | 118 |
| Sodium | mg | 2622.7 | 175 | 2647.8 | 177 | 2620.8 | 175 | 2645.2 | 176 |
| Thiamine | mg | 2.1 | 143 | 5.5 | 370 | 5.3 | 351 | 3.2 | 210 |
| Vitamin A | µg RAE | 1385.6 | 163 | 4575.1 | 538 | 4618.9 | 543 | 1385.6 | 163 |
| Vitamin B12 | µg | 2.8 | 100 | 2.8 | 100 | 2.8 | 100 | 2.8 | 100 |
| Vitamin B6 | mg | 3.3 | 163 | 3.4 | 172 | 2.6 | 131 | 2.4 | 118 |
| Vitamin C | mg | 63.0 | 90 | 63.0 | 90 | 63.0 | 90 | 63.0 | 90 |
| Vitamin D | IU | 400.0 | 200 | 400.0 | 200 | 400.0 | 200 | 400.0 | 200 |
| Vitamin E | mg | 15.5 | 82 | 15.8 | 83 | 15.2 | 80 | 14.9 | 78 |
| Vitamin K | µg | 98.7 | 180 | 98.2 | 179 | 99.8 | 182 | 98.2 | 179 |
| Zinc | mg | 19.6 | 196 | 17.3 | 173 | 17.3 | 173 | 13.5 | 135 |
| Absorbed zinc ‡ | mg | 3.9 | 108 | 2.8 | 78 | 2.9 | 80 | 2.2 | 61 |
GFD, general food distribution; LNS, lipid‐based nutrient supplement; DFE, dietary folate equivalents; RAE, retinol activity equivalents. *Because there is not a recommended absolute amount of fat for pregnant and lactating women, the per cent of energy from fat is displayed in the ‘% daily intake column’. For this physiologic group, the per cent of energy from fat is recommended to be between 20 and 35% of energy (Institute of Medicine). †The total amount of iron in the diet is presented as well as the estimated amount of iron absorbed from the diet (based on the calculated bioavailability). The per cent of the daily recommended intake is calculated based on the amount of absorbed iron. ‡The total amount of zinc in the diet is presented as well as the estimated amount of zinc absorbed from the diet (based on the calculated bioavailability). The per cent of the daily recommended intake is calculated based on the amount of absorbed zinc.
Pregnant women: Calcium is below 75% of the recommended intake level for the diets based on the rice and sorghum GFD rations, as is potassium across all four rations. In addition, the estimated amount of absorbed zinc is below 75% in the sorghum ration.
Lactating women: Calcium is below 75% of the recommended intake level for the diet based on the rice GFD ration, as is potassium across all four rations. Absorbed zinc is also below 75% of the recommended daily intake when the GFD ration includes sorghum.
Two doses of the one‐size LNS formulation provide less iron for PLW than the ‘age‐specific’ formulation for PLW. The level of iron in 20 g of LNS was kept at 6 mg (the level of iron provided in the 6–35‐month‐old formulation) because of concerns regarding ‘safe’ iron intake in malarial areas, especially among children. Providing 6 mg of iron in a daily ration of LNS, and recommending that the ration be divided into at least two meals, would ensure that the ‘dose’ of iron ingested at any particular meal would not exceed the amount of iron typically delivered by fortified processed complementary foods, which are considered a safe source of iron in malaria‐endemic areas (WHO/UNICEF 2007). For pregnant women, however, the 12 mg of iron provided by the two doses of the ‘one‐size’ LNS per day may fall short of meeting their needs, if iron in the base diet is poorly absorbed. Thus, if the one‐size LNS formulation is used, some pregnant women may need an additional source of iron. An alternative strategy would be to develop two different one‐size LNS formulations, for malarial and non‐malarial areas, with different levels of iron (e.g. 10 mg iron per 20 g for non‐malarial areas, and 6 mg iron per 20 g for malarial areas). More research is needed, however, to determine adequate and safe levels and forms of iron during childhood, pregnancy and lactation, both in malarial areas and non‐malarial areas.
The nutrients that exceed the UL when the ‘one‐size’ LNS is used (Table 32) are the same for the 6–35‐month‐old children as when the ‘age‐specific’ LNS is used (Table 24), and similar to the pattern observed for the ‘age‐specific’ PLW diets (Table 28), except for iron, which because of the reduced level in the one‐size formulation only exceeds the UL for the lactating women consuming the GFD based on cornmeal. With the ‘one‐size’ LNS formulation, magnesium is also above the UL for the diets based on the rice and wheat flour rations for the pregnant women and for the wheat flour ration for the lactating women.
Table 32.
Nutrients that exceed the UL when the ‘one‐size’ LNS formulation is added to the hypothetical intake from the GFD ration. Presented by age/physiologic group and identified by the staple grain used in the GFD hypothetical intake (with all other components being equal between diets)
| Age/physiologic group | Rice | Cornmeal | Wheat flour | Sorghum |
|---|---|---|---|---|
| Pregnant | Magnesium* | Magnesium Niacin* Vitamin A* | Folic acid* Magnesium Niacin* Vitamin A* | |
| Lactating | Magnesium | Magnesium* Niacin Vitamin A* Iron | Folic acid* Magnesium Niacin* Vitamin A* | Niacin* |
UL, Upper Levels; LNS, lipid‐based nutrient supplement; GFD, general food distribution. *Nutrient quantity from the hypothetical intake of the GFD ration (before addition of LNS) already exceeds UL.
5. Appropriate use and toxicity concerns
Though the recommended daily dose of LNS as described in this document is small (20 g, the equivalent of ∼4 teaspoons), LNS is generally packaged in larger quantities that provide up to 1–2 weeks worth of product, not unlike the packaging of other nutrient supplements such as iron drops or tablets. For older children or adults who are capable of consuming larger quantities, the risk of eating enough LNS to reach potentially toxic levels of certain nutrients is an important consideration. 33, 34, 35, 36 present the results of an exercise to determine the estimated intake of each nutrient for each age/physiological group, based on consuming 2–7 doses of LNS all at once (using both the age‐specific and the one‐size formulations). Similarly, in the event that two products are used (one for children and one for PLW) the case of a child inappropriately consuming the LNS for PLW was also examined (Table 34).
Table 33.
Toxicity estimates for 6–35‐month‐old children consuming 2–7 times the recommended daily dose of the age‐specific or one‐size LNS formulation (alone)
| Nutrient | Unit | UL 7–11 mo | UL 12–35 mo | LNS age‐specific or one‐size composition (6–35 mo) | ×2 | ×3 | ×4 | ×5 | ×6 | ×7 |
|---|---|---|---|---|---|---|---|---|---|---|
| Energy | kcal | – | – | 118 | 236 | 354 | 472 | 590 | 708 | 826 |
| Calcium | mg | ND | 2500 | 280 | 560 | 840 | 1120 | 1400 | 1680 | 1960 |
| Copper | mg | ND | 1 | 0.34 | 0.68 | 1.02 | 1.36 | 1.7 | 2.04 | 2.38 |
| Folic acid | µg DFE | ND | 300 | 150 | 300 | 450 | 600 | 750 | 900 | 1050 |
| Iodine | µg | 1260 | 600 | 90 | 180 | 270 | 360 | 450 | 540 | 630 |
| Iron | mg | 40 | 40 | 6 | 12 | 18 | 24 | 30 | 36 | 42 |
| Magnesium | mg | ND | 65 | 60 | 120 | 180 | 240 | 300 | 360 | 420 |
| Manganese | mg | ND | 2 | 1.2 | 2.4 | 3.6 | 4.8 | 6.0 | 7.2 | 8.4 |
| Niacin | mg | ND | 10 | 6 | 12 | 18 | 24 | 30 | 36 | 42 |
| Pantothenic acid | mg | ND | ND | 2 | 4 | 6 | 8 | 10 | 12 | 14 |
| Phosphorus | mg | ND | 3000 | 190 | 380 | 570 | 760 | 950 | 1140 | 1330 |
| Potassium | mg | ND | ND | 200 | 400 | 600 | 800 | 1000 | 1200 | 1400 |
| Riboflavin | mg | ND | 30 | 0.5 | 1 | 1.5 | 2 | 2.5 | 3 | 3.5 |
| Selenium | µg | 60 | 90 | 17 | 34 | 51 | 68 | 85 | 102 | 119 |
| Sodium | mg | ND | 1500 | 0 | 0 | 0 | 0 | 0 | 0 | 0 |
| Thiamine | mg | ND | 10 | 0.5 | 1 | 1.5 | 2 | 2.5 | 3 | 3.5 |
| Vitamin A | µg RAE | 600 | 600 | 400 | 800 | 1200 | 1600 | 2000 | 2400 | 2800 |
| Vitamin B12 | µg | ND | ND | 0.9* | 1.8 | 2.7 | 3.6 | 4.5 | 5.4 | 6.3 |
| Vitamin B6 | mg | ND | 30 | 0.5* | 1 | 1.5 | 2 | 2.5 | 3 | 3.5 |
| Vitamin C | mg | ND | 400 | 30 | 60 | 90 | 120 | 150 | 180 | 210 |
| Vitamin D | IU | 1000 | 2000 | 200 | 400 | 600 | 800 | 1000 | 1200 | 1400 |
| Vitamin E | mg | ND | 200 | 5* | 10 | 15 | 20 | 25 | 30 | 35 |
| Vitamin K | µg | ND | ND | 15 | 30 | 45 | 60 | 75 | 90 | 105 |
| Zinc | mg | 6 | 8 | 5 | 10 | 15 | 20 | 25 | 30 | 35 |
LNS, lipid‐based nutrient supplement; UL, Upper Levels; DFE, dietary folate equivalents; ND, not determined; RAE, retinol activity equivalents. *Note that for these nutrients there are slight differences between the age‐specific and one‐size composition: in the one‐size composition, these values are slightly higher (1.4 µg for vitamin B12, 1.0 µg for vitamin B6, and 6 mg for vitamin E). However, these differences do not change the toxicity estimates presented here. Values in bold exceed the UL for either or both age groups of children (6–11 or 12–35‐month‐olds).
Table 34.
Toxicity estimates for 6–35‐month‐old children consuming 2–7 times the recommended daily dose of the PLW LNS formulation (alone)
| Nutrient | Unit | UL 7–11 mo | UL 12–35 mo | LNS PLW composition | ×2 | ×3 | ×4 | ×5 | ×6 | ×7 |
|---|---|---|---|---|---|---|---|---|---|---|
| Energy | kcal | – | – | 118 | 236 | 354 | 472 | 590 | 708 | 826 |
| Calcium | mg | ND | 2500 | 280 | 560 | 840 | 1120 | 1400 | 1680 | 1960 |
| Copper | mg | ND | 1 | 1.3 | 2.6 | 3.9 | 5.2 | 6.5 | 7.8 | 9.1 |
| Folic acid | µg DFE | ND | 300 | 600 | 1200 | 1800 | 2400 | 3000 | 3600 | 4200 |
| Iodine | µg | 1260 | 600 | 200 | 400 | 600 | 800 | 1000 | 1200 | 1400 |
| Iron | mg | 40 | 40 | 20 | 40 | 60 | 80 | 100 | 120 | 140 |
| Magnesium | mg | ND | 65 | 65 | 130 | 195 | 260 | 325 | 390 | 455 |
| Manganese | mg | ND | 2 | 2.6 | 5.2 | 7.8 | 10.4 | 13 | 15.6 | 18.2 |
| Niacin | mg | ND | 10 | 18 | 36 | 54 | 72 | 90 | 108 | 126 |
| Pantothenic acid | mg | ND | ND | 7 | 14 | 21 | 28 | 35 | 42 | 49 |
| Phosphorus | mg | ND | 3000 | 190 | 380 | 570 | 760 | 950 | 1140 | 1330 |
| Potassium | mg | ND | ND | 200 | 400 | 600 | 800 | 1000 | 1200 | 1400 |
| Riboflavin | mg | ND | 30 | 1.6 | 3.2 | 4.8 | 6.4 | 8 | 9.6 | 11.2 |
| Selenium | µg | 60 | 90 | 35 | 70 | 105 | 140 | 175 | 210 | 245 |
| Sodium | mg | ND | 1500 | 0 | 0 | 0 | 0 | 0 | 0 | 0 |
| Thiamine | mg | ND | 10 | 1.5 | 3 | 4.5 | 6 | 7.5 | 9 | 10.5 |
| Vitamin A | µg RAE | 600 | 600 | 850 | 1700 | 2550 | 3400 | 4250 | 5100 | 5950 |
| Vitamin B12 | µg | ND | ND | 2.8 | 5.6 | 8.4 | 11.2 | 14 | 16.8 | 19.6 |
| Vitamin B6 | mg | ND | 30 | 2 | 4 | 6 | 8 | 10 | 12 | 14 |
| Vitamin C | mg | ND | 400 | 70 | 140 | 210 | 280 | 350 | 420 | 490 |
| Vitamin D | IU | 1000 | 2000 | 200 | 400 | 600 | 800 | 1000 | 1200 | 1400 |
| Vitamin E | mg | ND | 200 | 19 | 38 | 57 | 76 | 95 | 114 | 133 |
| Vitamin K | µg | ND | ND | 55 | 110 | 165 | 220 | 275 | 330 | 385 |
| Zinc | mg | 6 | 8 | 23 | 46 | 69 | 92 | 115 | 138 | 161 |
PLW, pregnant and lactating women; LNS, lipid‐based nutrient supplement; UL, Upper Levels; DFE, dietary folate equivalents; ND, not determined; RAE, retinol activity equivalents. Values in bold exceed the UL for either or both age groups of children (6–11 or 12–35‐month‐olds).
Table 35.
Toxicity estimates for PLW consuming 2–7 times the recommended daily dose of the PLW LNS formulation (alone)
| Nutrient | Unit | UL pregnant | UL lactating | LNS PLW composition | ×2 | ×3 | ×4 | ×5 | ×6 | ×7 |
|---|---|---|---|---|---|---|---|---|---|---|
| Energy | kcal | – | – | 118 | 236 | 354 | 472 | 590 | 708 | 826 |
| Calcium | mg | 3000 | 3000 | 280 | 560 | 840 | 1120 | 1400 | 1680 | 1960 |
| Copper | mg | 10 | 10 | 1.3 | 2.6 | 3.9 | 5.2 | 6.5 | 7.8 | 9.1 |
| Folic acid | µg DFE | 1000 | 1000 | 600 | 1200 | 1800 | 2400 | 3000 | 3600 | 4200 |
| Iodine | µg | 1100 | 1100 | 200 | 400 | 600 | 800 | 1000 | 1200 | 1400 |
| Iron | mg | 45 | 45 | 20 | 40 | 60 | 80 | 100 | 120 | 140 |
| Magnesium | mg | 350 | 350 | 65 | 130 | 195 | 260 | 325 | 390 | 455 |
| Manganese | mg | 11 | 11 | 2.6 | 5.2 | 7.8 | 10.4 | 13 | 15.6 | 18.2 |
| Niacin | mg | 35 | 35 | 18 | 36 | 54 | 72 | 90 | 108 | 126 |
| Pantothenic acid | mg | ND | ND | 7 | 14 | 21 | 28 | 35 | 42 | 49 |
| Phosphorus | mg | 3500 | 4000 | 190 | 380 | 570 | 760 | 950 | 1140 | 1330 |
| Potassium | mg | ND | ND | 200 | 400 | 600 | 800 | 1000 | 1200 | 1400 |
| Riboflavin | mg | ND | ND | 1.6 | 3.2 | 4.8 | 6.4 | 8 | 9.6 | 11.2 |
| Selenium | µg | 400 | 400 | 35 | 70 | 105 | 140 | 175 | 210 | 245 |
| Sodium | mg | 2300 | 2300 | 0 | 0 | 0 | 0 | 0 | 0 | 0 |
| Thiamine | mg | ND | ND | 1.5 | 3 | 4.5 | 6 | 7.5 | 9 | 10.5 |
| Vitamin A | µg RAE | 3000 | 3000 | 850 | 1700 | 2550 | 3400 | 4250 | 5100 | 5950 |
| Vitamin B12 | µg | ND | ND | 2.8 | 5.6 | 8.4 | 11.2 | 14 | 16.8 | 19.6 |
| Vitamin B6 | mg | 100 | 100 | 2 | 4 | 6 | 8 | 10 | 12 | 14 |
| Vitamin C | mg | 1000 | 1000 | 70 | 140 | 210 | 280 | 350 | 420 | 490 |
| Vitamin D | IU | 2000 | 2000 | 200 | 400 | 600 | 800 | 1000 | 1200 | 1400 |
| Vitamin E | mg | 1000 | 1000 | 19 | 38 | 57 | 76 | 95 | 114 | 133 |
| Vitamin K | µg | ND | ND | 55 | 110 | 165 | 220 | 275 | 330 | 385 |
| Zinc mg | mg | 40 | 40 | 23 | 46 | 69 | 92 | 115 | 138 | 161 |
PLW, pregnant and lactating women; LNS, lipid‐based nutrient supplement; UL, Upper Levels; DFE, dietary folate equivalents; ND, not determined; RAE, retinol activity equivalents. Values in bold exceed the UL for either or both groups of pregnant and lactating women.
Table 36.
Toxicity estimates for PLW consuming 2–7 times the recommended daily dose of LNS (alone), for the one‐size formulation
| Nutrient | Unit | UL pregnant | UL lactating | LNS one‐size composition | ×2 | ×3 | ×4 | ×5 | x6 | ×7 |
|---|---|---|---|---|---|---|---|---|---|---|
| Energy | kcal | – | – | 118 | 236 | 354 | 472 | 590 | 708 | 826 |
| Calcium | mg | 3000 | 3000 | 280 | 560 | 840 | 1120 | 1400 | 1680 | 1960 |
| Copper | mg | 10 | 10 | 0.34 | 0.68 | 1.02 | 1.36 | 1.7 | 2.04 | 2.38 |
| Folic acid | µg DFE | 1000 | 1000 | 150 | 300 | 450 | 600 | 750 | 900 | 1050 |
| Iodine | µg | 1100 | 1100 | 90 | 180 | 270 | 360 | 450 | 540 | 630 |
| Iron | mg | 45 | 45 | 6 | 12 | 18 | 24 | 30 | 36 | 42 |
| Magnesium | mg | 350 | 350 | 60 | 120 | 180 | 240 | 300 | 360 | 420 |
| Manganese | mg | 11 | 11 | 1.2 | 2.4 | 3.6 | 4.8 | 6.0 | 7.2 | 8.4 |
| Niacin | mg | 35 | 35 | 6 | 12 | 18 | 24 | 30 | 36 | 42 |
| Pantothenic acid | mg | ND | ND | 2 | 4 | 6 | 8 | 10 | 12 | 14 |
| Phosphorus | mg | 3500 | 4000 | 190 | 380 | 570 | 760 | 950 | 1140 | 1330 |
| Potassium | mg | ND | ND | 200 | 400 | 600 | 800 | 1000 | 1200 | 1400 |
| Riboflavin | mg | ND | ND | 0.5 | 1 | 1.5 | 2 | 2.5 | 3 | 3.5 |
| Selenium | µg | 400 | 400 | 17 | 34 | 51 | 68 | 85 | 102 | 119 |
| Sodium | mg | 2300 | 2300 | 0 | 0 | 0 | 0 | 0 | 0 | 0 |
| Thiamine | mg | ND | ND | 0.5 | 1 | 1.5 | 2 | 2.5 | 3 | 3.5 |
| Vitamin A | µg RAE | 3000 | 3000 | 400 | 800 | 1200 | 1600 | 2000 | 2400 | 2800 |
| Vitamin B12 | µg | ND | ND | 1.4 | 2.8 | 4.2 | 5.6 | 7 | 8.4 | 9.8 |
| Vitamin B6 | mg | 100 | 100 | 1 | 2 | 3 | 4 | 5 | 6 | 7 |
| Vitamin C | mg | 1000 | 1000 | 30 | 60 | 90 | 120 | 150 | 180 | 210 |
| Vitamin D | IU | 2000 | 2000 | 200 | 400 | 600 | 800 | 1000 | 1200 | 1400 |
| Vitamin E | mg | 1000 | 1000 | 6 | 12 | 18 | 24 | 30 | 36 | 42 |
| Vitamin K | µg | ND | ND | 15 | 30 | 45 | 60 | 75 | 90 | 105 |
| Zinc mg | mg | 40 | 40 | 5 | 10 | 15 | 20 | 25 | 30 | 35 |
PLW, pregnant and lactating women; LNS, lipid‐based nutrient supplement; DFE, dietary folate equivalents; RAE, retinol activity equivalents; UL, Upper Levels; ND, not determined. Values in bold exceed the UL for either or both groups of pregnant and lactating women.
The results of both simulations are presented with reference to the UL for each age/physiological group and assume that only LNS was consumed; taking into account nutrient intake from other foods consumed with the LNS would provide different estimates. The UL, however, is set based on a determination of the highest level of daily (i.e. chronic) intake that is likely to pose no risk of adverse health effects in the general population; levels that can cause acute adverse effects from a one‐time ingestion (which are generally much higher) are not included as part of this determination. However, the UL provides a ‘starting point’ for discussing which nutrients could reach potentially toxic levels.
For children 6–35 months of age, nutrients that exceed the UL when 2+ doses are consumed (of either the age‐specific or one‐size LNS formulations) include copper, folic acid, magnesium, manganese, selenium, vitamin A, vitamin D, and zinc (Table 33). For the same age group consuming 2–7 doses of the PLW formulation, nutrients that exceed the UL after 2+ doses include copper, folic acid, iodine, iron, magnesium, manganese, niacin, selenium, vitamin A, vitamin C, vitamin D, and zinc (Table 34). For PLW, the nutrients that exceed the UL when 2+ doses of the PLW formulation are consumed are iodine, iron, magnesium, manganese, niacin, vitamin A, and zinc; for the one‐size formulation, folic acid, magnesium and niacin exceed the UL, but only after 6–7 doses are consumed (35, 36). The basis for several of these ULs has been previously discussed, including those for folic acid, niacin, magnesium, manganese and vitamin A; however, the ULs are reviewed again here, focusing on potential acute toxicity from large single doses.
Folic acid: As mentioned previously, the risk of acute toxicity from folic acid in fortified foods appears to be low.
Niacin: Adverse effects are not associated with intake of the nicotinamide form of niacin, which is the chemical form included in LNS.
Magnesium: As discussed, the UL for magnesium refers to its pharmacological use, not as a natural component of food or from fortificants.
Manganese: The extent to which dietary manganese can lead to neurotoxicity is controversial, as adverse events have been primarily from inhalation or from drinking sources (IOM 2009, http://fnic.nal.usda.gov/nal_display/index.php?info_center=4&tax_level=3&tax_subject=256&topic_id=1342&level3_id=5141). Acute toxicity from a large dietary intake of manganese has not been reported.
Vitamin A: Acute toxicity from vitamin A (nausea, headache, vomiting, vertigo and bulging fontanel in children) has been observed from intakes greater than or equal to 150 000 µg retinol activity equivalents (RAE) in adults, and proportionately less for children; assuming a 1–3‐year‐old child has approximately 1/5 the body weight of adults, 30 000 µg would be the value at which acute toxicity would be a concern (IOM 2009, http://fnic.nal.usda.gov/nal_display/index.php?info_center=4&tax_level=3&tax_subject=256&topic_id=1342&level3_id=5141). The highest daily level of vitamin A intake reached through this exercise (after 7 doses) is 2800 µg.
Copper: The UL for copper for children is extrapolated from the UL for adults, based on relative body weight. Acute gastrointestinal effects have been observed at intakes of approximately 4.8 mg/d (IOM 2009, http://fnic.nal.usda.gov/nal_display/index.php?info_center=4&tax_level=3&tax_subject=256&topic_id=1342&level3_id=5141). For a child accidentally consuming the PLW formulation (which has approximately four times the amount of copper as that in the 6–35 month/one‐size formulation), the UL is met after 1 dose, and 7 doses provide approximately 9.1 mg/day. Thus accidental consumption of the PLW formulation by young children could lead to toxic levels of intake, though it is unlikely that a small child could consume 7 doses of LNS (140 g) all at once. Nonetheless, the one‐size formulation, which provides a lower level of copper per dose, may be a safer choice.
Selenium: Ingestion of gram quantities of selenium can lead to fatal or near‐fatal selenium poisoning (IOM 2009, http://fnic.nal.usda.gov/nal_display/index.php?info_center=4&tax_level=3&tax_subject=256&topic_id=1342&level3_id=5141). The quantities of selenium reached in this simulation exercise, even from seven times the recommended dose, are on the order of micrograms.
Vitamin D: The UL for vitamin D is based on the hypercalcemic effects of high vitamin D intakes (IOM 2009, http://fnic.nal.usda.gov/nal_display/index.php?info_center=4&tax_level=3&tax_subject=256&topic_id=1342&level3_id=5141). The age‐specific and one‐size LNS formulations would lead to intake above the UL for the 6–11‐month‐old children after 5 doses; the PLW formulation would lead to intake above the UL after 4 doses. However, because 4–5 doses would represent 80–100 g of product and 472–590 kcal, it is unlikely that a child 6–11 months of age could consume that amount in one day. In addition, there are limited data for acute effects of excess intake of Vitamin D in infants and children.
Zinc: As previously discussed, the UL for zinc used in this document is actually a NOAEL (recommended by IZiNCG) because there are inadequate data to permit setting a UL for children (Hotz & Brown 2004). Nevertheless, this level is exceeded after 2–3 doses of LNS for the 6–35‐month‐old children consuming either the age‐specific or one‐size LNS formulation. Acute adverse effects of excess zinc intake have been reported: in adults, a 225–450 mg dose may cause immediate vomiting. Assuming that children have approximately one‐fifth the body weight of adults, extrapolating these levels to children would mean that 45–90 mg of zinc could be associated with similar symptoms in children. Seven doses of the proposed LNS formulations would provide approximately 35 mg of zinc for children, and consumption of this amount at one time would probably be prevented by gastric capacity. However, accidental consumption by a child of the LNS formulation for PLW would provide 46 mg in two doses. For adults, the IZiNCG recommendation of an upper limit of intake coincides with the IOM recommendation. The UL is quickly exceeded for the PLW consuming multiple doses of the PLW formulation, reaching levels that could cause adverse gastrointestinal effects with chronic intake, though likely not reaching the level of acute toxicity; however, the ‘one‐size’ formulation (which has a lower level of zinc) may be preferable to avoid potential adverse effects.
Iodine: In general, most of the population is very tolerant to daily iodine intakes above the UL; subgroups that will respond adversely to high iodine intake include those with autoimmune thyroid disease and those with iodine deficiency (which could be of concern in some emergency‐affected populations) (IOM 2009, http://fnic.nal.usda.gov/nal_display/index.php?info_center=4&tax_level=3&tax_subject=256&topic_id=1342&level3_id=5141). In this exercise, however, the UL for both children and PLW is reached only when consumption is six to seven times the daily dose of LNS, except for the case of children consuming the PLW formulation, where the UL is reached after 3 doses. However, acute toxicity is generally only observed when the dose is on the order of several grams (IOM 2009, http://fnic.nal.usda.gov/nal_display/index.php?info_center=4&tax_level=3&tax_subject=256&topic_id=1342&level3_id=5141).
Iron: The UL for iron is based on avoiding gastrointestinal side effects (IOM, http://www.iom.edu/CMS/54133.aspx). Iron intake from supplements has been associated with increased morbidity (particularly in malaria endemic regions) (Sazawal et al. 2006) as well as decreased growth among iron‐replete children (Dewey et al. 2002). Acute toxicity (including fatal poisoning) has been observed from large doses of medicinal iron (at levels between 20 and 60 mg/kg body weight) (IOM, http://www.iom.edu/CMS/54133.aspx). However, iron consumed as part of food (either naturally occurring or fortified) and consumed in several portions during the day may not have the same negative effects as supplements taken in bolus doses (Dewey 2007). Gastrointestinal distress has not been reported from diets high in naturally occurring or fortificant iron (IOM, http://www.iom.edu/CMS/54133.aspx). Nevertheless, for a 6–11‐month‐old child weighing approximately 9 kg, toxic levels would be reached after an intake of approximately 180 mg of iron. Seven doses of the age‐specific or one‐size LNS would not provide this amount; seven doses of the PLW LNS would provide approximately 140 mg of iron, but the limited gastric capacity of young children would probably prohibit consumption of this amount. The lower end of the range of toxicity (20–60 mg/kg) for a 1–3‐year‐old child weighing approximately 13 kg would be 260 mg, which would not be reached by consumption of 7 doses of LNS of any of the proposed formulations. For PLW, the UL of 45 mg/day is exceeded with three doses of the ‘age‐specific’ PLW formulation (which contains 20 mg per dose) and eight doses of the ‘one‐size’ formulation (containing 6 mg per dose). Though women frequently consume more than 45 mg/day of iron during pregnancy, both from supplements and fortified foods, it may be preferable to provide the ‘one‐size’ formulation to avoid concerns about excess iron intake in both children and PLW.
5.1 Potential strategies to ensure appropriate use and to avoid inappropriate consumption
Although the risk of reaching toxic levels of intake of any one nutrient through over‐consumption of LNS appears to be low, strategies should be developed to avoid excess intake and ensure appropriate use among the target groups. As discussed in the introduction, particularly in emergency settings there is a need for ensuring the appropriate use of these products, which are likely to be unfamiliar to the recipient population. Strategies that could be employed include thorough training of staff who will be delivering the supplement, social marketing, community mobilization, packaging modifications and labelling. In emergency settings, the need for rapid distribution of what will likely be a completely foreign product to the recipient population will make the execution of some of these strategies challenging.
Training/education of staff delivering LNS and community mobilization to ensure appropriate use by recipients: Staff delivering the supplements need to be familiar with the product and trained on its use so that they can adequately instruct the intended recipients. This education should be reinforced by community mobilization to inform the recipients on the appropriate use of LNS in terms of daily recommended amounts as well as target groups. Examples of some key messages that could be included in the training and community mobilization materials, which would need to be adapted to the local/cultural setting, are described below:
• LNS does not replace breast milk and should not be used as a breast milk substitute. The LNS formulations described herein are not intended to be used as a breast milk substitute, and interventions using LNS should ensure that strategies are in place to protect, promote and support exclusive breastfeeding during the first 6 months of age and continued breastfeeding thereafter.
• LNS is appropriate for children 6 months of age and older. Appropriate introduction of LNS only to children 6 months of age and older is a fundamental message, to protect the period of exclusive breastfeeding. Breastfeeding on demand to children >6 months of age receiving LNS should be encouraged.
• LNS is not a replacement for a varied diet, nor a replacement for GFD rations or other available foods. In an emergency context, micronutrient rich foods, and particularly animal‐source foods, may be unavailable, so LNS will likely provide essential micronutrients and minerals that may not otherwise be available. However, LNS should be seen as a complement to, rather than a replacement of, GFD rations or other foods available in these settings. Training staff to inform caregivers and recipients that LNS is supposed to ‘complement’ the other food in their diet, and not serve as a stand‐alone supplement eaten between meals, may help to reinforce this message.
• LNS is intended for particular groups of individuals only (young children and PLW) and the recommended amount of LNS per day for each group should be followed and should not be exceeded or reduced. The importance of not exceeding the intended small dose may be particularly important in emergency settings where RUTF and RUSF (which are similar in appearance, consistency and taste) are being used for treatment of malnourished children. Because the LNS used for the management of children with severe and moderate acute malnutrition without medical complications are given in much larger quantities (200–300 g/day) according to the established protocols, ensuring that a distinction is made between different products and how they should be consumed (and by whom) is essential. Also, because LNS would be intended for certain groups only, and not for general use, messages clearly specifying the target groups will be needed to avoid household sharing.
Packaging and labelling: Instead of packaging LNS in larger containers, the product could be packaged in single‐dose sachets of 20 g that may encourage ‘single‐serving’ consumption. Smaller packages might also help support the message that this is a special food targeted to a select group, and not a family food to be shared (which would generally come in a larger container). Packaging in small sachets could also facilitate promotion of LNS as a ‘condiment’ used to enrich the ‘base’ diet. Labelling is also an important aspect not only for ensuring safe amounts of consumption, but also for ensuring that the supplement is used for the appropriate groups. Simple messages that can easily be conveyed through pictures on LNS packaging would need to be developed. Though using a ‘one‐size’ LNS for both infants/children and PLW may be logistically preferable, indicating the appropriate use of the same product for two different target groups through simple messages conveyed on the label could be challenging. This reinforces the need for adequate training of staff delivering the LNS.
6. Cost estimates of providing LNS with the ‘revised’ GFD ration
In considering the use of LNS as part of the nutrition response to emergencies, the cost of providing such a product needs to be evaluated. Currently, there are only a few producers of LNS – the largest producer, Nutriset, has its main production facilities in France (where a range of LNS products is produced), and franchisees in several countries in Africa (where currently RUTF is the only LNS produced). At the Nutriset facilities in France, approximately half of the cost of LNS is for ingredients, and half of the total cost is from fixed costs – for example, production machinery and salaries. Packaging accounts for approximately 6–10% of the total cost (Mamane Zeilani, Nutriset, personal communication, April 29, 2009). This however is the cost structure for greater volumes of production, where cost savings are possible through automating certain production elements or customizing production machinery, which may not necessarily be the case at lower levels of production (such as local producers). The estimated current price per kilogram (without transport) of LNS produced in France is approximately €2.2 to 3.0 per kilogram (equivalent to roughly US$3–4 per kilogram). 18 Production volumes will affect cost (greater volume will reduce costs), as will the ingredients used [(e.g. soy‐based LNS, such as Supplementary Plumpy® (Nutriset, Malaunay, France), will cost less than a product that contains milk powder] (Mamane Zeilani, Nutriset, personal communication, April 29, 2009). Packaging affects cost as well, but this depends on the type of packaging and the level of production; for Nutributter, the cost of packaging the product in 20 g sachets as opposed to 140 g pots is roughly half, contributing approximately 10–15 vs. 25–30% of the overall cost structure, respectively (Mamane Zeilani, Nutriset, personal communication, April 29, 2009). The local selling price per kilogram will depend on the size of the production unit, the volume of production as well as the supplier agreements (i.e. how long agreements on fixed commodity prices can be maintained), level of demand, and type of packaging used. Thus the actual price of LNS produced locally would be on a producer by producer basis, though an estimated range of prices of locally produced LNS is approximately €3–3.5 per kilogram (or roughly US$4–5) (Mamane Zeilani, Nutriset, personal communication, April 29, 2009). 19
In terms of the cost of the GFD ration, a ‘typical’ daily adult ration of approximately 2100 kcal, as described in Table 1, costs between $0.14 and $0.34 per day per person depending on the grain used, according to US Title II food aid commodity cost estimates (http://www.usaid.gov/our_work/humanitarian_assistance/ffp/comcalc_new.xls) (37, 38). The cost of providing the hypothetical diet described in this document from a ‘typical’ GFD ration containing CSB ranged from $0.02 for the amount the youngest children would consume to approximately $0.32 for the amount needed by lactating women (Table 39). Removing the CSB from the ‘typical’ diet and providing an equivalent amount of pulse and cereal decreased the cost of the diet for the younger children, but did not change the cost of the diet for the PLW (cost ranged from $0.01 for the youngest child to $0.32 for lactating women, Table 39). Adding 20 g of LNS to the ‘revised’ GFD ration at an approximate cost of $0.07 per 20 g ‘dose’ (the cost of production in France), increased the cost of the entire diet to $0.08 for the youngest children and to $0.39 for the lactating women. For the PLW consuming two doses of LNS, the cost of the ration plus LNS was $0.42 and $0.45 for pregnancy and lactation, respectively (Table 39). If the percentage change in cost is examined for a hypothetical mother–child dyad, providing the ‘revised’ GFD ration plus LNS results in a 34–52% increase in cost, depending on the number of doses provided to the mother (Table 40). However, as transport costs are not included herein, this calculation may overestimate the increase in the total cost of providing LNS in emergency settings. The 2007 report by the US Government Accountability Office (GAO) assessed the contribution of transport costs to total program costs of delivering food aid (United States Government Accountability Office 2007). Of total program expenditures for the Title II program (the largest US government food aid program), 65% were related to transportation of food aid commodities (including transport costs to port of exit in the USA, ocean transport, in‐country delivery and handling costs and administration). Thus, for each $100 in total program costs, if $65 is for transport and $35 is for food, an increase in the cost of food to $53 (an increase in food cost of 50%) represents an 18% increase in overall program costs.
Table 37.
Average commodity cost in US$ per metric ton (MT) of GFD commodities as provided by the Food for Peace commodity calculator for fiscal year 2009 (http://www.usaid.gov/our_work/humanitarian_assistance/ffp/comcalc_new.xls, accessed March 2009)
| Commodity | Commodity Price (US$/MT) |
|---|---|
| Rice (average) | 655 |
| Cornmeal (average) | 385 |
| Wheat flour, all‐purpose | 400 |
| Sorghum (average) | 158 |
| Pulses (average) | 808 |
| CSB – Corn–Soy Blend | 475 |
| Vegetable (soy) oil | 690 |
GFD, general food distribution. When more than one form of a commodity was provided (for example, bagged rice vs. bulk rice with bags) an average was calculated.
Table 38.
Cost estimate (in US$) for ‘typical’ full GFD ration and ‘revised’ full GFD ration (excluding sugar and salt)
| ‘Typical’ GFD ration | |||||
|---|---|---|---|---|---|
| Rice | Cornmeal | Wheat | Sorghum | Average | |
| Grain | 0.26 | 0.15 | 0.16 | 0.06 | 0.16 |
| Corn‐soy blend | 0.02 | 0.02 | 0.02 | 0.02 | 0.02 |
| Pulse | 0.04 | 0.04 | 0.04 | 0.04 | 0.04 |
| Vegetable oil | 0.02 | 0.02 | 0.02 | 0.02 | 0.02 |
| Total cost (1 full ration) | 0.34 | 0.24 | 0.24 | 0.14 | 0.24 |
| ‘Revised’ GFD ration | |||||
|---|---|---|---|---|---|
| Rice | Cornmeal | Wheat | Sorghum | Average | |
| Grain | 0.28 | 0.16 | 0.17 | 0.07 | 0.17 |
| Pulse | 0.06 | 0.06 | 0.06 | 0.06 | 0.06 |
| Vegetable oil | 0.02 | 0.02 | 0.02 | 0.02 | 0.02 |
| Total cost (1 full ration) | 0.36 | 0.24 | 0.25 | 0.15 | 0.25 |
GFD, general food distribution. Cost estimate includes commodity cost only, as provided by the Food For Peace commodity calculator for fiscal year 2009 (http://www.usaid.gov/our_work/humanitarian_assistance/ffp/comcalc_new.xls, accessed March 2009).
Table 39.
Cost (in US$) of providing the hypothetical diet for each age/physiologic group from the ‘typical’ and ‘revised’ GFD rations, with and without addition of LNS, as well as the per cent change in cost from the current ‘typical’ GFD ration
| Average cost ‘typical’ GFD ration (with CSB) | Average cost ‘revised’ GFD ration (no CSB) | Average cost ‘revised’ GFD ration (no CSB) + LNS (1 dose) | Average cost ‘revised’ GFD ration (no CSB) + LNS (2 doses) | Per cent change in cost from ‘typical’ GFD ration (1 dose LNS) | Per cent change in cost from ‘typical’ GFD ration (2 dose LNS) | |
|---|---|---|---|---|---|---|
| Total cost (6–8 month‐olds) | 0.02 | 0.01 | 0.08 | – | 236 | – |
| Total cost (9–11 month‐olds) | 0.04 | 0.02 | 0.09 | – | 160 | – |
| Total cost (12–23 month‐olds) | 0.06 | 0.05 | 0.12 | – | 90 | – |
| Total cost (24–35 month‐olds) | 0.12 | 0.11 | 0.18 | – | 51 | – |
| Total cost (pregnant women) | 0.30 | 0.30 | 0.37 | 0.42 | 23 | 41 |
| Total cost (lactating women) | 0.32 | 0.32 | 0.39 | 0.45 | 21 | 38 |
| Total cost (avg. pregnant/lactating woman + avg. child <3) | 0.37 | 0.36 | 0.50 | 0.56 | 34 | 52 |
GFD, general food distribution; LNS, lipid‐based nutrient supplement; CSB, corn‐soy blend.
Table 40.
Change in total commodity provided (g) for the ‘typical’ GFD diet vs. ‘revised’ GFD diet plus LNS for each age/physiologic group, plus a hypothetical mother–child dyad
| 6–8 months | 9–11 months | 12–23 months | 24–35 months | Pregnant women | Lactating women | Pregnant women (2 doses LNS) | Lactating women (2 doses LNS) | Mother–child dyad* | |
|---|---|---|---|---|---|---|---|---|---|
| Total ‘typical’ GFD ration weight (g) | 53 | 81 | 144 | 269 | 679 | 739 | 679 | 739 | 846 |
| Total ‘revised’ GFD ration weight + LNS (g) | 42 | 70 | 134 | 260 | 674 | 734 | 663 | 723 | 830 |
| Absolute change (g) | 11 | 11 | 10 | 9 | 5 | 5 | 16 | 16 | 16 |
| Per cent change in weight from ‘typical’ GFD ration (%) | 20 | 14 | 7 | 3 | 1 | 1 | 2 | 2 | 2 |
GFD, general food distribution; LNS, lipid‐based nutrient supplement; PLW, pregnant and lactating women. *Calculated as the sum of the average of the child rations plus the average of the PLW rations.
In addition, because of the higher energy density of LNS as compared with CSB (i.e. less quantity of product needed for the same amount of energy), the shipping costs associated with transport of food aid commodities could also potentially be reduced by including LNS in the ‘typical’ GFD ration, which would decrease the weight of the commodities shipped (Table 39). For a hypothetical mother–child dyad, approximately 2% less weight in commodity would need to be provided with a ‘revised’ GFD diet plus LNS, as compared with the ‘typical’ GFD diet.
7. Quality control, nutrient formulation, shelf‐life and packaging
Specifications for local production of RUTF have recently been published (Manary 2006), as have requirements for their safety and adequate composition (WHO/WFP/UNSCN/UNICEF 2007). Though these documents refer specifically to RUTF production, similar ingredients and procedures can be used for production of LNS for prevention of malnutrition, with modifications in the vitamin and mineral content and potentially levels of some other ingredients. As discussed before, the main ingredients of the most commonly used RUTF and other LNS are milk powder, vegetable oil, peanut paste, sugar and powdered vitamins and minerals; however, LNS can be produced without using peanuts (other legumes can be used, or no legumes at all) or without milk powder. In addition, the flavour can be adjusted to meet both cultural and age‐specific taste preferences (e.g. a more savoury product for adults). While the cost of local (or ‘regional’) production of LNS may be more variable than the cost of production in a larger facility, such production of LNS for use in preventing malnutrition in emergency settings could be advantageous in order to have readily available supplies (either through pre‐positioning of product, or through an immediate increase in production from a nearby production source) in the event of a sudden emergency. Local production of LNS could reduce the overall cost of LNS by cutting down transport costs, and could potentially have local economic benefits; however, the smaller production volume typical of local production units may limit cost savings on the production costs, and the creation of demand for a product is essential for the sustainability of production and achieving eventual cost reductions. Though the local production facilities in Africa currently produce only RUTF, production of LNS aimed at prevention of malnutrition would be feasible given that the needed ingredients and the production methods are identical. Addition of LNS products for prevention would likely increase demand and spread it more evenly throughout the year, as demand for RUTF (and RUSF) typically peaks during the hungry season. Production of LNS tailored to address specific nutrient deficiencies in the local diet and accommodate taste preferences and availability of commodities is also being explored in some settings. For example, LNS are being developed using other legumes such as chickpeas or lentils in countries where peanuts are not frequently consumed. The following discussion, however, will focus primarily on the LNS products made with peanut paste, as they are by far the most common at present, and their methods of production have already been published.
7.1 Quality control of LNS production
Important issues in quality control of LNS production include the choice of ingredients, potential contamination (aflatoxin or bacterial), prevention of oxidation, and composition of the final LNS product (Manary 2006). The peanuts used for LNS production should be purchased from a supplier that can guarantee safe harvest and storage methods to avoid aflatoxin contamination, and/or procedures for sorting/testing of ingredients can be used by small producers of LNS to ensure safety from aflatoxin contamination (Huybregts et al. 2009). Aflatoxin is a toxin produced by a fungus that contaminates peanuts; it can have adverse effects on child growth, and when consumed chronically, can increase the risk of liver cancer. The purchased peanuts should be stored in cool, dry conditions to control fungal growth. Although the low water content of LNS inhibits the growth of microbes, avoiding bacterial contamination of the product through faecal contamination (for example, from rodents or workers during production or packaging) is essential, as with production of any food product. Maximum toxin levels (for aflatoxin, yeasts, moulds, salmonella, and other organisms) have been specified for the production of RUTF (WHO/WFP/UNSCN/UNICEF 2007), and products should comply with the Recommended International Code of Hygienic Practice for Foods for Infants and Children of the Codex Alimentarius (Standard CAC/RCP 66 2008). Because LNS is a lipid‐based product, avoiding oxidation of the fatty acids and vitamins contained in the product is important for ensuring adequate shelf‐life; avoiding over‐heating during production and using air‐tight containers are two suggested methods for avoiding unwanted oxidation of the LNS product (Manary 2006) as is storage of the final product in a cool, dry location to the extent possible. Finally, ensuring adequate training of production workers so that the LNS product is produced as specified, and monitoring the product content (for example, levels of protein or fat or a particular micronutrient) are necessary quality control processes.
7.2 Nutrient formulation
As with other food vehicles, factors to consider when choosing the chemical forms of nutrients to be used as the fortificants in LNS include: stability, reactivity with food components, shelf‐life, bioavailability and relative cost (Allen et al. 2006). Vitamins/minerals used as fortificants ideally must not segregate out of the food matrix, nor react with the food in which they are contained to produce undesirable organoleptic qualities (e.g. colour or taste changes, rancidity especially in the case of fat‐based products) or cause unacceptable sensory problems (e.g. taste or smell) at the desired level of concentration. In addition, the fortificants should be sufficiently bioavailable from the food vehicle to provide the recommended level of intake by the target group. Because the biological activity of some nutrients is affected by oxygen or light exposure (e.g. vitamin A and C), the need for adequate storage conditions to achieve the optimal shelf‐life should also be taken into account when selecting a fortificant for a particular food vehicle. ‘Overage’ (including more than the needed level of a fortificant in order to account for activity losses during storage of the product) may need to be specified for particular nutrients whose activity can be affected by storage. Finally, the cost of incorporating a particular chemical form of a nutrient needs to be considered; thus there may be trade‐offs between including a more bioavailable but more costly form of a particular nutrient and a form that is less bioavailable but also less costly. The chemical forms of nutrients that are recommended for fortification of foods for infants and children are provided in Table 41, with the chemical forms most suitable for use in LNS identified in a separate column.
Table 41.
Possible chemical forms of nutrients included in products for infants and young children, and recommended chemical forms for inclusion in LNS
| Nutrient | Possible chemical forms | Recommended chemical forms for LNS |
|---|---|---|
| Vitamin A | Retinyl acetate or retinyl palmitate or beta‐carotene | Retinyl acetate |
| Vitamin D | ergocalciferol (D2) or cholecalciferol (D3) | Cholecalciferol (D3) |
| Vitamin E | Acetates of d or dl‐alpha‐tocopherol | dl‐alpha‐tocopherol acetate |
| Vitamin K | – | Phylloquinone 5% |
| Vitamin C | l‐ascorbic acid | l‐ascorbic acid |
| Thiamine (vitamin B1) | Thiamine mononitrate (preferred for dry products) or Thiamine hydrochloride | Thiamine hydrochloride |
| Riboflavin (vitamin B2) | Riboflavin | Riboflavin |
| Niacin (vitamin B3) | Niacinamide | Niacinamide |
| Vitamin B6 | Pyridoxine hydrochloride | Pyridoxine hydrochloride |
| Vitamin B12 | Cyanocobalamin (diluted form (0.1% or 1%) with 100% active particles, spray dried form | Cyanocobalamin (0.1%) |
| Folic acid | Pteroyl monoglutamic acid | Pteroyl monoglutamic acid |
| Iron | Na Fe EDTA (subject to Codex limits), encapsulated ferrous sulfate, encapsulated ferrous fumarate and micronized ferric pyrophosphate could also be used but costs need to be considered | Encapsulated ferrous sulfate |
| Zinc | Zinc sulfate, zinc gluconate, zinc oxide | Zinc sulfate |
| Copper | Copper sulfate or Copper gluconate | Encapsulated copper sulfate |
| Selenium | Sodium selenate, Sodium selenite | Sodium selenite 1.5% |
| Calcium | Several forms available some with higher contents of Ca, such as Ca phosphate and Ca carbonate; Soluble organic Ca salts such as Ca citrate5; Calcium salts containing well absorbed anions (such as chloride) should be avoided as they may induce acidosis5 | Tricalcium phosphate |
| Phosphorous | – | Tricalcium phosphate Dipotassium phosphate |
| Potassium | – | Dipotassium phosphate, potassium chloride |
| Magnesium | Soluble organic magnesium salts such as Mg citrate. Magnesium salts containing well absorbed anions (such as chloride) should be avoided as they may induce acidosis | Magnesium citrate |
| Manganese | – | Mangasese sulphate |
| Iodine | Potassium iodate | Potassium iodate |
LNS, lipid‐based nutrient supplement; EDTA, ethylene‐diamine‐tetra‐acetic acid. Adapted from ‘Formulation Subgroup, 2009’.
7.3 Shelf‐life and packaging
Currently the shelf‐life for LNS products packaged in air‐tight foil sachets is 24 months (Manary 2006). For locally produced LNS not packaged in airtight containers, a shelf‐life of approximately 3–4 months has been achieved (Manary 2006). As mentioned previously, decreasing the potential for oxidation of the product during production, packaging and storage will ensure the maximum shelf‐life. Shelf‐life is particularly important with respect to the use of LNS in emergencies. Because of the sudden nature of many emergencies, and the frequent delay between the occurrence of an emergency and the arrival of food aid, food aid commodities are often ‘pre‐positioned’ in several storage locations globally to provide needed supplies more rapidly. Pre‐positioning LNS would require that the shelf‐life be long enough so that even with prolonged storage, the product could still be safely used. As a comparison, most of the commonly used food aid commodities have a shelf‐life between 12 and 18 months (USAID).
8. Discussion
These analyses indicate that the ‘typical’ GFD ration currently provided in emergency settings – based on cereals, pulse, an FBF, oil and sugar – does not meet the nutritional needs of groups who are most vulnerable to malnutrition, such as infants and young children and PLW. These groups have particularly high nutrient needs for growth and development, and meeting these needs is challenging in settings where the ration may be limited to few food commodities, with little diversity and/or few bioavailable sources of micronutrients. The hypothetical intake from a ration composed of food aid commodities (based on the current USAID/USDA specifications for exported food aid commodities used in emergency settings), and including breast milk for children 6–24 months of age, provided less than 75% of the recommended intake for several micronutrients for certain age/physiologic groups, including calcium, iron, zinc, B vitamins such as riboflavin, B6 and B12, and fat‐soluble vitamins such as D, E and K. Although international organizations recommend that micronutrient supplements be provided in emergency settings, interventions providing micronutrients alone will not address macronutrient deficiencies, which are also apparent from our analyses. The hypothetical diet based on a ‘typical’ GFD ration generally contained lower than recommended levels of fat and EFAs. Furthermore, because some nutrients already exceed the UL in the ‘typical’ GFD ration alone, providing additional micronutrients without addressing the levels of fortification in the ‘base’ ration may not be advisable. WFP is currently revising the recommended specifications for the food aid commodities they procure, so additional analysis using these updated specifications would be desirable, once they are available.
These findings illustrate that FBF based on grains and legumes, though originally developed for feeding children, may not be the best product for meeting the nutrient requirements of infants and young children. In addition to concerns about the composition of the FBFs themselves – for example, high levels of anti‐nutrients, and thus poor bioavailability of some minerals – it is challenging to meet the nutrient requirements of a range of age groups, consuming differing amounts of the FBF, with just one formulation. Point‐of‐use fortification with products such as LNS, which provide the key nutrients in a small quantity of food, allows requirements of each individual to be met, even when only small quantities of the base ration are consumed.
As previously mentioned, adding micronutrient supplements to a diet that is already fortified may not be advisable because of concerns about excess intake; for this reason we created a ‘revised’ GFD ration in which CSB was replaced with an equivalent amount of energy from equal parts grain and pulses. This ‘revised’ GFD diet served as the base diet to which LNS would be added, but only for the vulnerable populations of PLW and children under 3 years of age, and not the entire population. We assessed the nutritional adequacy of a ‘revised’ GFD ration for other population groups, to evaluate whether their rations would be significantly worsened by this change. For a 4‐year‐old child and an adult male, the ‘revised’ GFD diet provided less than 75% of the recommended daily intake for several nutrients including calcium, potassium, vitamin B12, C and D and zinc. However, the ‘typical’ GFD diet including CSB, provided to these same groups, also provided inadequate levels for many of these same nutrients (though the gaps for certain nutrients, such as vitamins B12, C and D, were not as severe as with the ‘revised’ GFD diet). It would be preferable from a logistical and cost standpoint not to provide multiple forms of highly fortified products – for example, CSB and LNS – in emergency situations. However, if LNS were to be incorporated as part of an emergency nutrition strategy in place of other fortified commodities such as CSB, a thorough review of the remaining food aid commodities and potential modifications to their nutrient content should be undertaken to account for the needs of the ‘less vulnerable’ subgroups who would not be receiving LNS.
Determining the desired formulation of LNS for the prevention of malnutrition is challenging when there are few data on the nutritional status of recipients and the composition of the base diet being consumed, and thus little information on which nutrients are limiting. This dilemma is not unique to emergency settings. Ideally, nutrient specifications for LNS (or any other product for prevention of malnutrition) should be based on an assessment of population and context‐specific needs, though this is rarely possible in emergency settings where a rapid response is required and thus a ‘generic’ LNS formulation is needed. Therefore, for the purposes of these analyses, we assumed 100% reliance on food aid commodities. Complete reliance on food aid commodities in an emergency is not unrealistic, and may be a frequent situation especially in the early phases of an emergency when other coping mechanisms – such as bartering for other foods, or growing food – are not yet possible. We chose to develop an LNS formulation that provided approximately 1 RDA per daily dose for most micronutrients, with adjustments when levels greatly exceeded the UL for certain subgroups and there were relevant concerns about adverse effects from chronic consumption of such levels. Providing a formulation that contains 1 RDA per daily dose will likely ensure that most nutrient requirements are covered even with variations from the base diet. In addition, though we have designed the LNS in the context of prevention of malnutrition in emergency settings, it is likely that there will be baseline levels of acute and chronic malnutrition in such populations that could warrant levels slightly above 1 RDA to allow for catch‐up growth. In the event that modifications in the GFD ration were to be made as the emergency progresses – for example, less than a full ration provided as coping strategies of the population are developed – continuing to provide the daily dose of LNS would still be recommended, to ensure that the nutrient needs of the population are met.
We also assessed the possibility of developing a ‘one‐size’ LNS formulation that could be provided to both infants and young children and PLW (with the PLW consuming two doses per day). It may be advantageous to use a one‐size formulation for several reasons. Having only one product to distribute rather than two may be logistically easier. From a nutritional perspective, providing two doses of the LNS to PLW would contribute additional fat, which is currently below recommended levels in the ‘typical’ GFD ration as well as in the ‘revised’ GFD ration with one dose of LNS. Finally, providing a product with lower levels of fortification may be preferable to decrease the risk of excess intake if more than the recommended amount of product is consumed. On the other hand, because one product would be provided for two target groups but at two different levels of consumption, precautions would need to be taken to ensure that each target group is consuming the correct daily amount (i.e. 20 g for children under 3 and 40 g for PLW). Packaging of the product into 20‐g sachets and providing simple messages both during distribution as well as on the packaging regarding the correct amount to be consumed would be recommended.
As anticipated, addition of LNS to the ‘revised’ GFD ration is more expensive than providing the ‘typical’ GFD ration. The ‘revised’ ration without CSB but with LNS would cost 34–52% more (food only) than the ‘typical’ GFD ration for a hypothetical mother–infant pair, depending on how many LNS ‘doses’ were provided to PLW. This is due not only to the cost of LNS, but also because the rest of the energy that came from CSB in the ‘typical’ GFD ration (after subtracting the energy to come from LNS) was replaced with half grain and half pulse, which is more expensive (per 100 g) than CSB. Although cost is an important consideration, the ‘typical’ GFD ration as it is currently formulated does not meet the nutrient requirements of the populations it is meant to serve. Thus, alternative options such as inclusion of LNS need to be assessed not only in terms of relative costs but also with regard to effectiveness in maintaining and improving nutritional outcomes. A recent study in Malawi (though not in an emergency setting) showed that LNS had a greater impact than a locally produced FBF made from corn and soy (likuni phala) on preventing severe stunting in young children (Phuka et al. 2008, 2009). Other potential advantages of using a product like LNS should also be investigated; for example, sharing of LNS may be less likely, because of its packaging, consistency, and the potential for ‘positioning’ it as a specific food just for children or PLW. This might make it more easily targeted to the individuals for whom it is intended than is the case for other food aid commodities, such as CSB. This could have substantial cost implications, as blanket and targeted SFPs generally provide 2–2.5 times more CSB than what is needed for the child (to account for sharing in the family) (WHO 2000; WFP/Nutrition Works 2000). If these extra allotments could be significantly reduced, cost savings would be considerable. We did not take this potential scenario into account in our cost comparisons. Furthermore, we did not take into account transport costs, which, at least in the case of US food aid, represent the majority of the cost of food aid programs and would likely be somewhat lower if LNS were added to the ‘revised’ GFD ration.
There are several limitations to our analyses. As previously mentioned, we made several assumptions regarding the composition of the ‘base’ ration consumed by the target groups. However, we took a ‘conservative’ approach when formulating the LNS composition, by attempting to design LNS that would provide close to 100% of the recommended levels of intake. Thus, regardless of the base ration, levels of adequate intake would be ensured. In addition to complete reliance on food aid, we also assumed that the ration consumed by each age/physiologic group would have the same proportions of each food as in the overall ration (i.e. if grains provided 70% of the total energy in the ration, they would also provide 70% of the energy in the hypothetical diet for each age group). This may not necessarily be the case, particularly for young children who may consume less of certain foods such as pulses.
This document is intended to be a starting point for considering the incorporation of LNS in the food packages provided in emergency settings. Our goal was to examine the potential nutritional benefits but also the challenges of adopting such a strategy. We recognize that there are many different options for emergency nutrition programs, and many considerations governing which option to choose. We hope that this document encourages further evaluation of all of these options.
Conflicts of interest
The authors have declared no conflicts of interest.
Acknowledgements
We would like to thank the following individuals for their helpful consultations during different stages of the development of this document: Caroline Abla, Mary Arimond, Per Ashorn, Paul Blizzard, André Briend, Judy Canahuati, Eunyong Chung, Hedwig Deconinck, Megan Deitchler, Stéphane Doyon, Mike Lagoon, Mark Manary, Guillaume Sauvage, Ron Shaw, Susan Shepherd, Toby Stillman, Anne Swindale, Omar Taha, Laura Turner and Mamane Zeilani. Ana Perez‐Expósito completed the protein adequacy calculations. We would also like to thank Bineti Vitta for her assistance with the cost calculations and Josh Jorgensen for his assistance with creating the figures for this document.
Appendix 1: Planned general food distribution ration examples used for development of ‘typical’ general food distribution ration
Documentation on the following WFP Emergency Operations (EMOP) is available, organized by country and operation ID, at http://www.wfp.org/operations/list (last accessed 2 December 2009).
Table A1.1–A1.3.
Rice‐based examples of emergency general food distribution rations
|
Myanmar Emergency Operation (EMOP) 10749.0: May–November 2008 • Emergency response to cyclone‐affected populations | |
|---|---|
| Commodity | Amount (g) |
| Rice | 400 |
| Pulse | 100 |
| Veg. Oil | 30 |
| Salt | 5 |
| Total (g) | 535 |
| Total (kcal) | 2100 |
|
Nicaragua Emergency Operation (EMOP) 10700.0, October 2007–June 2008 • Emergency response to victims of Hurricane Felix | |
|---|---|
| Commodity | Amount (g) |
| Rice | 400 |
| Pulses | 40 |
| Veg. Oil | 20 |
| CSB | 100 |
| Salt | 0 |
| Total (g) | 560 |
| Total (kcal) | 2131 |
|
The Gambia Emergency Operation (EMOP) 10572.0, February–October 2007 • Assistance to Senegalese refugees and host community in the Gambia | |
|---|---|
| Commodity | Amount (g) |
| Rice | 400 |
| Pulses | 60 |
| Veg. Oil | 25 |
| CSB | 60 |
| Salt | 5 |
| Total (g) | 550 |
| Total (kcal) | 2104 |
Table A1.4–A1.5.
Corn‐based examples of emergency general food distribution rations
|
Cameroon Emergency Operation (EMOP) 10735.0 March 2008–March 2009 • Emergency food assistance to Central African and Chadian refugees | |
|---|---|
| Commodity | Amount (g) |
| Maize meal | 400 |
| Pulses | 60 |
| Veg. Oil | 25 |
| Salt | 5 |
| Sugar | 15 |
| CSB | 50 |
| Total (g) | 555 |
| Total (kcal) | 2113 |
|
Togo Emergency Operation (EMOP) 10465.0 July–December 2005 • Assistance to internally displaced persons in Togo and refugees in Benin and Ghana | |
|---|---|
| Commodity | Amount (g) |
| Maize meal | 420 |
| Pulses | 50 |
| Veg. Oil | 30 |
| Salt | 5 |
| CSB | 50 |
| Total (g) | 555 |
| Total (kcal) | 2100 |
Table A1.6.
Wheat‐based examples of emergency general food distribution rations : Yemen Emergency Operation EMOP 10684.0, September–November 2007 • Humanitarian assistance to internally displaced persons in Sa'ada Governorate
| Commodity | Amount (g) |
|---|---|
| Wheat | 477 |
| Oil | 24 |
| Pulses | 48 |
| Sugar | 24 |
| Salt | 5 |
| Total (g) | 578 |
| Total (kcal) | 2137 |
Table A1.7.
Sorghum‐based examples of emergency general food distribution rations : Sudan Emergency Operation (EMOP) 10693.0, January–Decemeber 2008 • Food assistance to populations affected by conflict
| Commodity | Amount (g) |
|---|---|
| Cereals* | 450 |
| Pulses | 60 |
| Veg. Oil | 30 |
| Salt | 10 |
| Sugar | 10 |
| CSB | 16.5 |
| Total (g) | 596.5 |
| Total (kcal) | 1942 |
Appendix 2: Nutrient composition of principal food aid commodities used in this document
Table 46.
| Commodity and description | Corn‐soy blend | Rice | Cornmeal | Wheat flour | Sorghum | Pulse | Vegetable oil | |
|---|---|---|---|---|---|---|---|---|
| Unenriched, average of all varieties | Degermed, unenriched, yellow | White unenriched, all‐purpose | Average of beans, lentils and peas | USDA commodity food, refined soybean oil | ||||
| USDA nutrient database identification number | NA* | – | 20422 † | 20481 ‡ | 20067 | – | 04669 § | |
| Per 100 g of commodity | Unit | |||||||
| Protein | g | 15.0 | 6.7 | 7.3 | 10.3 | 11.3 | 22.0 | 0.0 |
| Fat | g | 8.7 | 0.6 | 1.8 | 1.0 | 3.3 | 1.2 | 100.0 |
| Carbohydrate | g | 62.6 | 79.5 | 79.2 | 76.3 | 74.6 | 62.0 | 0.0 |
| Energy | kcal | 386.8 | 361.0 | 369.0 | 364.0 | 339.0 | 340.0 | 884.0 |
| Calcium | mg | 839.2 | 13.0 | 141.0 | 124.0 | 28.0 | 138.5 | 0.0 |
| Choline | mg | 49.3 | 5.8 | 10.8 | 10.4 | 71.8 | 0.2 | |
| Copper | mg | 0.4 | 0.2 | 0.1 | 0.1 | 0.9 | 0.0 | |
| Folate | ug DFE | 418.0 | 7.7 | 30.0 | 255.0 | 445.3 | 0.0 | |
| Iodine | µg | 56.9 | 0.0 | |||||
| Iron | mg | 17.3 | 0.8 | 5.4 | 4.4 | 4.4 | 6.0 | 0.0 |
| Magnesium | mg | 169.0 | 27.7 | 35.0 | 22.0 | 172.2 | 0.0 | |
| Manganese | mg | 0.8 | 1.1 | 0.2 | 0.7 | 1.2 | ||
| Niacin | mg | 9 | 2.9 | 6.1 | 7.4 | 5.0 | 6.1 | 0.0 |
| Pantothenic acid | mg | 3.3 | 1.2 | 0.3 | 0.4 | 0.9 | 0.0 | |
| Phosphorous | mg | 220.1 | 106.0 | 105.0 | 108.0 | 287.0 | 406.5 | 0.0 |
| Potassium | mg | 561.3 | 92.0 | 152.0 | 107.0 | 350.0 | 1386.3 | 0.0 |
| Riboflavin | mg | 0.5 | 0.0 | 0.4 | 0.4 | 0.1 | 0.2 | 0.0 |
| Selenium | µg | 20.9 | 15.1 | 11.6 | 33.9 | 11.9 | 0.0 | |
| Sodium | mg | 6.8 | 2.3 | 7.0 | 2.0 | 6.0 | 11.3 | 0.0 |
| Thiamine | mg | 0.6 | 0.1 | 0.7 | 0.6 | 0.2 | 0.7 | 0.0 |
| Vitamin A | µg RAE | 709.6 | 0.0 | 588.0 | 588.0 | 0.0 | 0.0 | 1801.8 |
| Vitamin B12 | µg | 1.3 | 0.0 | 0.0 | 0.0 | 0.0 | 0.0 | 0.0 |
| Vitamin B6 | mg | 0.5 | 0.2 | 0.2 | 0.0 | 0.4 | 0.0 | |
| Vitamin C | mg | 40.1 | 0.0 | 0.0 | 0.0 | 0.0 | 3.2 | 0.0 |
| Vitamin D | IU | 198.4 | 0.0 | |||||
| Vitamin E | mg | 5.7 | 0.1 | 0.2 | 0.1 | 0.2 | 8.2 | |
| Vitamin K | µg | 2.3 | 0.1 | 0.0 | 0.3 | 7.4 | 183.9 | |
| Zinc | mg | 4.2 | 1.1 | 0.7 | 0.7 | 2.9 | 0.0 | |
| 18:2 (undifferentiated) ¶ | g | 3.2 | 0.1 | 0.7 | 0.4 | 1.3 | 0.3 | 50.3 |
| 18:2 cc n‐6 (linoleic acid) | g | 50.1 | ||||||
| 18:2 t not further defined | g | |||||||
| 18:2 trans trans | g | |||||||
| 18:3 (undifferentiated) ¶ | g | 0.3 | 0.0 | 0.0 | 0.0 | 0.1 | 0.3 | 7.0 |
| 18:3 ccc n‐3 (alpha‐linolenic) | g | 0.0 | 0.5 | 6.5 | ||||
| 18:3 ccc n6 (gamma linolenic) | g | 0.0 | 0.0 | 0.0 | ||||
| 18:4 | g | 0.0 | 0.0 | 0.0 | 0.0 | 0.0 | 0.0 | |
| 20:2 cc n‐6 (eicosadienoic acid) | g | 0.0 | 0.0 | 0.0 | ||||
| 20:3 | g | 0.0 | 0.0 | 0.0 | ||||
| 20:3 ccc n‐3 (eicosatrienoic acid (ETE)) | g | 0.0 | ||||||
| 20:3 n‐6 (dihomo‐gamma‐linolenic acid (DGLA)) | g | 0.0 | ||||||
| 20:4 | g | 0.0 | 0.0 | 0.0 | 0.0 | 0.0 | 0.0 | |
| 20:4 n‐6 (arachadonic acid) | g | 0.0 | ||||||
| 20:5 n‐3 (eicosapentaenoic acid) | g | 0.0 | 0.0 | 0.0 | 0.0 | 0.0 | 0.0 | |
| 22:4 (adrenic acid) | g | 0.0 | 0.0 | |||||
| 22:5 n‐3 (docosapentaenoic acid) | g | 0.0 | 0.0 | 0.0 | 0.0 | 0.0 | 0.0 | |
| 22:6 n 3 (docosahexaenoic acid) | g | 0.0 | 0.0 | 0.0 | 0.0 | 0.0 | 0.0 | |
| Monounsaturated fat | g | 2.9 | 0.2 | 0.3 | 0.1 | 1.0 | 0.1 | 22.7 |
| Polyunsaturated fat | g | 3.4 | 0.2 | 0.7 | 0.4 | 1.4 | 0.6 | 57.3 |
| Saturated fat | g | 1.2 | 0.2 | 0.2 | 0.2 | 0.5 | 0.3 | 15.3 |
Nutritional composition of CSB was constructed from data in the USDA nutrient database for its ingredients (defatted soy flour, degermed and unenriched yellow cornmeal and refined soybean oil), with reference to the USAID CRG for the proportion of each ingredient contained in the final product and the USDA commodity specifications for the required vitamin and mineral levels.
† Nutritional composition was verified with USDA commodity specifications for cornmeal for export.
‡ Nutritional composition was verified with USDA commodity specifications for all‐purpose wheat‐flour for export.
§ Nutritional composition was verified with USDA commodity specifications for vegetable oil for export.
Because information is not available for all polyunsaturated fatty‐acid isomers, for the purposes of the calculation of the content of linoleic and alpha‐linolenic acid and the n6 : n3 ratio, the ‘undifferentiated’ isomers were used as the most common 18:2 isomer is linoleic acid and the most common 18:3 isomer is linolenic.
Appendix 3: Protein adequacy of diets in emergency settings when supplemented with lipid‐based nutrient supplements
Methods
To evaluate the protein content of diets typically distributed in emergency situations and their adequacy with respect to current international recommendations, the proportion of the safe intake of protein recommended by WHO that would be consumed by each age group was calculated. Several dietary scenarios were evaluated:
-
1
Typical diet distributed in emergency situations
-
2
Typical diet distributed in emergency situations supplemented with 20 grams of LNS formulated with milk (LNS‐MILK).
-
3
Typical diet distributed in emergency situations supplemented with 20 grams of LNS formulated without milk (LNS‐NO MILK). 20
-
4
Typical diet distributed in emergency situations supplemented with 40 grams of LNS formulated with milk (pregnant and lactating women only).
-
5
Typical diet distributed in emergency situations supplemented with 40 grams of LNS formulated without milk (pregnant and lactating women only).
All diets for children <24 months of age assumed an average intake of breast milk (World Health Organization 1998). For all age groups, protein intake was calculated using either rice, cornmeal, wheat flour, or sorghum as the grain provided in the GFD ration, i.e. four different base GFD rations were evaluated.
As described in previous sections, the hypothetical intakes and types of food provided were based on the GFD rations usually distributed by WFP in Emergency Operations and adjusted to WHO energy recommendations for each age group. In the case of children <24 months, the amount of energy from breast milk was subtracted from the total energy requirement before calculating the amount of energy from each food in the overall ration. When including LNS supplements, the energy provided by LNS (118 kcal per 20 g) was subtracted from the total energy requirement before calculating the amount of energy coming from each of the other foods in the diet.
Protein and essential amino acid content of each diet was calculated using the USDA National Nutrient Database (U.S. Department of Agriculture 2008). Single values of nutrient composition were used for wheat flour, cornmeal, and sorghum. In the case of rice, an average of the protein content of different types of raw unenriched rice was calculated. To calculate the protein content of pulses, an average of values for raw beans, lentils and peas was used. The amino acid content of lentils was not available; therefore the amino acid profile of pulses was calculated using the average values for beans and peas only. WHO recommends calculating total protein in the diet as Total Nitrogen * 6.25 (WHO 2007), however the USDA database provides the specific conversion factor for each food when available, and uses the general factor of 6.25 only when information on the conversion factor for a given food is not available. The USDA items included in these calculations with specific conversion factors are: rice (5.95), wheat (5.7), and the LNS protein sources peanuts (5.46) and dry non‐fat milk (6.38) (U.S. Department of Agriculture 2008).
For breast milk protein content, we assumed that 85% of estimated protein concentration (based on nitrogen content) was ‘true protein’, based on previously published data (Dewey et al. 1996). The amino acid composition of breast milk was obtained from the recent WHO report on protein and amino acid requirements in human nutrition (WHO 2007).
Table A3.1 presents the amount of each commodity and breast milk that children <3 years old and pregnant and lactating women would consume in each hypothetical diet, before the addition of LNS.
To obtain the final protein content of each diet, corrections for protein quality were applied according to WHO recommendations [total protein in the diet * protein digestibility corrected amino acid score (PDCAAS)]. PDCAAS values were calculated by multiplying the weighted average digestibility of the diet by the lowest amino acid score. PDCAAS values greater than 1 were considered equal to 1. Amino acid scores were calculated by dividing the total amount of that amino acid in the diet by the WHO requirement for that amino acid. Protein digestibility values for each of the commodities and the ingredients in LNS were obtained from the WHO report (WHO 2007) (using a value for maize instead of cornmeal). Sorghum digestibility was based on a study of protein digestibility in Peruvian children recovering from malnutrition (Maclean 1981). Breast milk protein digestibility was assumed to be 100%.
Safe levels of protein intake (g/kg/day) and amino acid requirements (mg/g of protein/day) for children and pregnant and lactating women were based on the latest WHO recommendations (WHO 2007). For the age groups in our analyses, the average of the safe levels or requirements at the relevant ages was calculated, e.g. the safe level of protein intake for children 6–8 months of age was the average of the WHO values for 6 and 9 months. The body weights used to calculate protein needs of children were determined based on the median weight‐for‐age for boys and girls in each age range, based on the WHO Child Growth Standards (WHO Multicentre Growth Reference Study Group 2006). Protein needs of pregnant and lactating women were based on the WHO recommendation of 0.83 g/kg of body weight plus the increment recommended for each trimester of pregnancy or period of lactation, using the reference weight for adult non‐pregnant women in the United States (57 kg) due to lack of international reference weights for this purpose (IOM, http://www.iom.edu/CMS/54133.aspx; WHO 2007,). A3.2a, A3.2b present the calculated protein needs for each group.
Results
-
•
The percentage of the WHO recommended safe level of protein intake covered by the four different hypothetical base diets (before the addition of LNS) is >75% except for the sorghum‐based diets for pregnant and lactating women and the rice and cornmeal‐based diets for pregnant women in the third trimester and lactating women during the first 6 months of lactation (Table A3.3). For children, all of the diets exceed 90% of the recommended level except for the sorghum‐based diets. Although sorghum has higher protein content than rice, cornmeal and wheat flour, its protein quality is relatively low due to low protein digestibility and amino acid score.
-
•
For the diets in which 20 g of LNS‐MILK replaces an equivalent amount of energy in the base diet, the percentage of the safe level that is covered is >75% for most age groups (Table A3.4). The exceptions are the sorghum‐based diets for pregnant and lactating women and the rice and cornmeal‐based diets for pregnant women in the third trimester. For children, all of the diets exceed or are close to 90% of the recommended level.
-
•
For the diets in which 20 g of LNS‐NO MILK is used instead of LNS‐MILK (Table A3.5), the percentage of the safe level that is covered is lower, falling below 75% for the sorghum‐based diets for boys at 6–8, 9–11, and 24–35 mo as well as for pregnant and lactating women. In addition, the rice and cornmeal‐based diets for pregnant women in the third trimester and lactating women during the first 6 months of lactation provide <75% of the recommended level.
-
•
For the diets in which 40 g of LNS‐MILK replaces an equivalent amount of energy in the base diet for pregnant or lactating women (Table A3.6), the results are close to those obtained when 20 g of LNS‐MILK is used. Similarly, for the diets in which 40 g of LNS‐NO MILK replaces an equivalent amount of energy in the base diet for pregnant or lactating women (Table A3.7), the results are close to those obtained when 20 g of LNS‐NO MILK is used.
-
•
Limitations:
-
○
Because the calculations of protein needs are based on median weights for children, they will be over‐ or under‐estimates for individuals with lower or higher weight for age, respectively. For malnourished children for whom rapid catch‐up growth is desirable, protein needs will be higher.
-
○
The same caveat applies to pregnant and lactating women with greater or lower weight than the reference weight used (based on US women).
-
○
Total protein content and quality of the diets for children <24 months of age were calculated assuming an average intake of breast milk. Results will be different for children consuming less than the average amount, other types of milk (e.g. formula, cow's milk), or no milk at all.
-
○
These results assume that children and pregnant and lactating women consume the total amount of the specified diet in the specific proportions presented in the document. Any change in amounts or commodities would affect protein amount, protein quality, and therefore the protein adequacy of the diet.
-
○
Table A3.1.
Hypothetical base diet composition (without LNS provided)
| Commmodity (g) | Age group | |||||
|---|---|---|---|---|---|---|
| 6–8 months | 9–11 months | 12–23 months | 24–35 months | Pregnant | Lactating | |
| Grain (g)* | 42 | 63 | 113 | 212 | 535 | 581 |
| Pulses (g) | 7 | 11 | 19 | 36 | 90 | 98 |
| Vegetable oil (g) | 3 | 4 | 7 | 13 | 32 | 35 |
| Salt (g) | 0.2 | 0.5 | 1.1 | 2.2 | 6.1 | 7 |
| Sugar (g) | 2 | 2 | 4 | 8 | 20 | 22 |
| Breast milk (g) | 674 | 616 | 549 | |||
Because 4 different grains/grain products (rice, cornmeal, wheat flour and sorghum) were used, with slight variations in energy density, there were small differences in the quantity assumed for each grain; for purposes of presentation in the table, the average quantity for all four grains is presented.
Table A3.2a.
Calculated protein needs of children
| Age (mo) | Girls | Boys | ||||||
|---|---|---|---|---|---|---|---|---|
| 6–8 | 9–11 | 12–23 | 24–35 | 6–8 | 9–11 | 12–23 | 24–35 | |
| PROTEIN (g/day) | 9.7 | 10.0 | 10.5 | 11.8 | 10.5 | 10.9 | 11.3 | 12.3 |
Table A3.2b.
Calculated protein needs of pregnant and lactating women
| Women | |||||
|---|---|---|---|---|---|
| Pregnant | Lactating | ||||
| 1st trimester | 2nd trimester | 3rd trimester | First 6 mo | Second 6 mo | |
| PROTEIN (g/day) | 48.0 | 56.9 | 78.5 | 66.3 | 60.3 |
Table A3.3.
Percentage of the WHO recommended safe level of protein intake covered by the four different hypothetical base diets before the addition of LNS for each group
| Group | Diet | ||||||||
|---|---|---|---|---|---|---|---|---|---|
| Rice | Cornmeal | Wheat flour | Sorghum | ||||||
| Girls | Boys | Girls | Boys | Girls | Boys | Girls | Boys | ||
| Children | 6–8 mo | 99 | 91 | 98 | 90 | 112 | 103 | 79 | 73 |
| 9–11 mo | 103 | 95 | 103 | 95 | 122 | 112 | 78 | 72 | |
| 12–23 mo | 135 | 125 | 134 | 125 | 169 | 157 | 94 | 87 | |
| 24–35 mo | 131 | 125 | 130 | 125 | 186 | 178 | 80 | 76 | |
| Pregnancy | First trimester | 94 | 93 | 133 | 57 | ||||
| Second trimester | 79 | 79 | 113 | 48 | |||||
| Third trimester | 57 | 57 | 82 | 35 | |||||
| Lactation | First 6 mo | 74 | 74 | 105 | 45 | ||||
| After 6 mo | 81 | 81 | 115 | 49 | |||||
Table A3.4.
Percentage of the WHO recommended safe level of protein intake covered by the four different hypothetical base diets supplemented with 20 g of LNS‐MILK
| Group | Diet | ||||||||
|---|---|---|---|---|---|---|---|---|---|
| Rice | Cornmeal | Wheat flour | Sorghum | ||||||
| Girls | Boys | Girls | Boys | Girls | Boys | Girls | Boys | ||
| Children | 6–8 mo | 106 | 98 | 107 | 98 | 112 | 103 | 101 | 93 |
| 9–11 mo | 115 | 106 | 115 | 106 | 127 | 117 | 96 | 89 | |
| 12–23 mo | 148 | 138 | 147 | 137 | 175 | 163 | 112 | 104 | |
| 24–35 mo | 143 | 137 | 142 | 136 | 193 | 184 | 93 | 88 | |
| Pregnancy | First trimester | 98 | 98 | 136 | 61 | ||||
| Second trimester | 83 | 82 | 115 | 52 | |||||
| Third trimester | 60 | 60 | 83 | 37 | |||||
| Lactation | First 6 mo | 77 | 77 | 107 | 48 | ||||
| After 6 mo | 85 | 84 | 118 | 53 | |||||
Table A3.5.
Percentage of the WHO recommended safe level of protein intake covered by the four different hypothetical base diets supplemented with 20 g of LNS‐NO MILK
| Group | Diet | ||||||||
|---|---|---|---|---|---|---|---|---|---|
| Rice | Cornmeal | Wheat flour | Sorghum | ||||||
| Girls | Boys | Girls | Boys | Girls | Boys | Girls | Boys | ||
| Children | 6–8 mo | 88 | 81 | 88 | 81 | 93 | 86 | 79 | 72 |
| 9–11 mo | 93 | 86 | 93 | 86 | 105 | 97 | 76 | 70 | |
| 12–23 mo | 126 | 117 | 125 | 116 | 153 | 142 | 92 | 85 | |
| 24–35 mo | 123 | 118 | 123 | 118 | 173 | 165 | 77 | 74 | |
| Pregnancy | First trimester | 93 | 92 | 131 | 57 | ||||
| Second trimester | 78 | 78 | 110 | 48 | |||||
| Third trimester | 57 | 56 | 80 | 35 | |||||
| Lactation | First 6 mo | 73 | 73 | 103 | 45 | ||||
| After 6 mo | 80 | 80 | 113 | 49 | |||||
Table A3.6.
Percentage of the WHO recommended safe level of protein intake covered by the four different hypothetical base diets supplemented with 40 g of LNS‐MILK (pregnant and lactating women)
| Group | Diet | ||||
|---|---|---|---|---|---|
| Rice | Cornmeal | Wheat flour | Sorghum | ||
| Pregnancy | First trimester | 101 | 100 | 137 | 64 |
| Second trimester | 85 | 85 | 116 | 54 | |
| Third trimester | 62 | 61 | 84 | 39 | |
| Lactation | First 6 mo | 79 | 79 | 108 | 50 |
| After 6 mo | 87 | 86 | 119 | 55 | |
Table A3.7.
Percentage of the WHO recommended safe level of protein intake covered by the four different hypothetical base diets supplemented with 40 g of LNS‐NO MILK (pregnant and lactating women)
| Group | Diet | ||||
|---|---|---|---|---|---|
| Rice | Cornmeal | Wheat flour | Sorghum | ||
| Pregnancy | First trimester | 90 | 89 | 126 | 56 |
| Second trimester | 76 | 75 | 106 | 47 | |
| Third trimester | 55 | 55 | 77 | 34 | |
| Lactation | First 6 moths | 71 | 71 | 100 | 44 |
| After 6 moths | 78 | 78 | 109 | 48 | |
Prepared for the Inter‐Agency Standing Committee Global Nutrition Cluster by Camila M. Chaparro (FANTA‐2 Project/AED) and Kathryn G. Dewey (University of California, Davis), July 2009.
This work was funded by a grant from the IASC Global Nutrition Cluster and support from the Food and Nutrition Technical Assistance II Project (FANTA‐2).
The contribution from FANTA‐2 was made possible by the generous support of the American people through the support of the Office of Health, Infectious Disease, and Nutrition, Bureau for Global Health, United States Agency for International Development (USAID), under terms of Cooperative Agreement No. GHN‐A‐00‐08‐00001‐00, through the Food and Nutrition Technical Assistance II Project (FANTA‐2), managed by the Academy for Educational Development (AED). The contents are the responsibility of the authors and do not necessarily reflect the views of USAID or the United States Government.
Footnotes
Specifications for US food aid export commodities (as outlined by the United States Department of Agriculture and the United States Agency for International Development) were used for this document, as nutritional information for these products was available. The World Food Program was in the process of revising their commodity specifications during the development of this document.
Though WFP recommends a one‐to‐one substitution of pulse for FBF when FBF is not available (WFP/Nutrition Works 2000), pulses have high levels of soluble fibre leading to gastrointestinal discomfort and may not be well‐tolerated by young children. Thus, in the ‘revised’ GFD ration, an equal mix of cereals and pulses was used to replace the energy supplied by CSB in the ‘typical’ GFD ration.
Nutributter was developed to provide one daily recommended dietary allowance for most nutrients (with the exception of ‘bulkier’ nutrients that were difficult to include or those that at high levels have an adverse taste); Nutributter was shown to be effective at promoting linear growth and motor development in an efficacy study in Ghana. The recently re‐formulated product is similar to Nutributter, but contains higher levels of EFA (to maximize their potential beneficial effect), less sugar (to reduce the possibility of over‐consumption and sharing) and higher levels of some of the micronutrients that were below the recommended dietary allowances in Nutributter. The re‐formulated LNS will be used in three clinical trials in Africa beginning in 2009.
Previous reviews of nutritional needs of children during the complementary feeding period (Dewey & Brown 2003; World Health Organization 1998) have categorized breast milk intake as ‘low’, ‘average’ and ‘high’.
For the purposes of this document, the fortification specifications of US export commodities are used; however, there may be instances in which commodities used in emergency settings are fortified at different levels, or are not fortified at all, such as when locally procured commodities are used.
Niacin can also be obtained from conversion of the amino acid tryptophan; approximately 60 mg of tryptophan is equivalent to 1 mg of niacin.
WFP is currently revising the specifications for the food aid commodities they procure and thus it was not possible to complete the calculations using the updated WFP specifications.
The Recommended Nutrient Intake (RNI) is the daily intake which meets the nutrient requirements of almost all apparently healthy individuals in an age‐ and sex‐specific population group.
The Recommended Dietary Allowance (RDA) is the dietary intake level sufficient to meet the nutrient requirements of nearly all (97–98%) healthy individuals in a particular life stage and gender group. An Adequate Intake (AI) is a recommended intake value based on observed or experimentally determined approximations or estimates of nutrient intake that are assumed to be adequate, and is used when an RDA cannot be determined.
The UL is the highest level of daily nutrient intake that is likely to pose no risk of adverse health effects for almost all individuals in the general population. Note that the UL is set for a chronic level of intake; the calculation of the UL does not usually take into account levels that would lead to acute toxicity.
Used for most nutrients; the CV used for vitamin A and iodine is 20%.
The EAR is the daily intake value that is estimated to meet the requirement (as determined by the specific indicator of adequacy) in half of apparently healthy individuals in a life‐stage or gender group. The RDA is calculated as the EAR + 2 SDEAR, but in situations in which the SDEAR is not known, an assumed CV of 10–15% is used to calculate the RDA (e.g., for a CV of 10% the RDA = 1.2 × EAR).
Currently, LNS is primarily produced by the French company Nutriset and its franchisees in the Ethiopia, Democratic Republic of Congo, Dominican Republic, Malawi, Mozambique and Niger and will be produced in the future in Cambodia, Ghana, India, Madagascar, Tanzania and Yemen. Currently, RUTF is the only product produced by the franchisees. The cost of RUTF from each franchisee can vary depending on different factors discussed later in this document.
Assuming an average energy density of the GFD rations of 3.7 kcal/g, if the ration were to be diluted to provide approximately 0.8 kcal/g (the recommended minimum energy density of complementary foods), representing a concentration of about 20%, the resulting volume of complementary food to be consumed would be approximately 252 g. The gastric capacity of a well‐nourished 6–8‐month‐old child is 249 g per meal. Thus, the total daily ration could be consumed if at least two meals are offered.
For the purposes of this document, the term ‘ration’ refers to only what is provided by the food aid commodities; the term ‘diet’ refers to the intake of GFD commodities from the GFD ration, as well as breast milk (when applicable) and LNS (when applicable).
A NOAEL, or no observed adverse effect level, is the highest intake at which no adverse effects have been reported. The UL is set several‐fold lower – in the case of Vitamin A, 10‐fold lower – based on the uncertainty around the data for the NOAEL, which provides a margin of safety.
Currently, WHO recommends that 60 mg of iron be provided daily to pregnant women. Stoltzfus R.J. & Dreyfuss M.L. (1998) Guidelines for the Use of Iron Supplements to Prevent and Treat Iron Deficiency Anemia. International Life Sciences Institute Press: Washington, DC.
Assuming an exchange rate of 1€ = 1.4 USD (6/29/2009).
Currently, only RUTF (Plumpy'nut) is locally produced, thus the estimated cost range provided in this document reflects that product only.
Note that this scenario was not explored in the main document; the LNS used in the main document contained milk.
References
- Adu‐Afarwuah S., Lartey A., Brown K.H., Zlotkin S., Briend A. & Dewey K.G. (2007) Randomized comparison of 3 types of micronutrient supplements for home fortification of complementary foods in Ghana: effects on growth and motor development. American Journal of Clinical Nutrition 86, 412–420. [DOI] [PubMed] [Google Scholar]
- Adu‐Afarwuah S., Lartey A., Brown K.H., Zlotkin S., Briend A. & Dewey K.G. (2008) Home fortification of complementary foods with micronutrient supplements is well‐accepted and has positive effects on infant iron status in Ghana. American Journal of Clinical Nutrition 87, 929–938. [DOI] [PubMed] [Google Scholar]
- Allen L., De Benoist B., Dary O. & Hurrell R. (eds) (2006) Guidelines on Food Fortification with Micronutrients. WHO/FAO: Geneva. [Google Scholar]
- Allen L. & Haskell M. (2002) Estimating the potential for vitamin A toxicity in women and young children. Journal of Nutrition 132, 2907S–2919S. [DOI] [PubMed] [Google Scholar]
- Auestad N., Scott D.T., Janowsky J.S., Jacobsen C., Carroll R.E., Montalto M.B. et al. (2003) Visual, cognitive and language assessments at 39 months: a follow‐up study of children fed formulas containing long‐chain polyunsaturated fatty acids to 1 year of age. Pediatrics 112, e177–e183. [DOI] [PubMed] [Google Scholar]
- Bouwstra H., Dijck‐Brouwer D.J., Decsi T., Boehm G., Boersma E.R., Muskiet F.A. et al. (2006) Relationship between umbilical cord essential fatty acid content and the quality of general movements of healthy term infants at 3 months. Pediatric Research 59, 717–722. [DOI] [PubMed] [Google Scholar]
- CRDNF/NIHRD/SEAMO/UNICEF (2006) Second Health and Nutrition Assessment in Nanggore Aceh Darussalam Province and Nias, September 2005. UNICEF: Jakarta, Indonesia. [Google Scholar]
- Defourny I., Minetti A., Harczi G., Doyon S., Shepherd S., Tectonidis M. et al. (2009) A large‐scale distribution of Milk‐based fortified spreads: evidence for a new approach in regions with a high burden of acute malnutrition. PLoS ONE 4 (5), e5455. doi:10.1371/journal.pone.0005455 [DOI] [PMC free article] [PubMed] [Google Scholar]
- Dewey K.G. (2003) Nutrient composition of fortified complementary foods: should age‐specific micronutrient content and ration sizes be recommended? Journal of Nutrition 133, 2950S–2952S. [DOI] [PubMed] [Google Scholar]
- Dewey K.G. (2007) Increasing iron intake of children through complementary foods. Food and Nutrition Bulletin 28, S595–S609. [DOI] [PubMed] [Google Scholar]
- Dewey K.G. & Adu‐Afarwuah S. (2008) Systematic review of the efficacy and effectiveness of complementary feeding interventions in developing countries. Maternal & Child Nutrition 4, 24–85. [DOI] [PMC free article] [PubMed] [Google Scholar]
- Dewey K.G. & Brown K.H. (2003) Update on technical issues concerning complementary feeding of young children in developing countries and implications for intervention programs. Food and Nutrition Bulletin of the 24, 5–28. [DOI] [PubMed] [Google Scholar]
- Dewey K.G., Beaton G., Fjeld C., Lonnerdal B. & Reeds P. (1996) Protein requirements of infants and children. European Journal of Clinical Nutrition 50, S119–47. [PubMed] [Google Scholar]
- Dewey K.G., Domellöf M.D., Cohen R.J., Rivera L.L., Hernell O. & Lönnerdal B. (2002) Iron supplementation affects growth and morbidity of breast‐fed infants: results of a randomized trial in Sweden and Honduras. Journal of Nutrition 132, 3249–3255. [DOI] [PubMed] [Google Scholar]
- Eilander A., Hundscheid D.C., Osendarp S.J., Transler C. & Zock P.L. (2007) Effects of n‐3 long chain polyunsaturated fatty acid supplementation on visual and cognitive development throughout childhood: a review of human studies. Prostaglandins, Leukotrienes, and Essential Fatty Acids 76, 189–203. [DOI] [PubMed] [Google Scholar]
- Formulation Subgroup, Ten Year Strategy to Reduce Vitamin and Mineral Deficiencies, Maternal. Infant and Young Child Nutrition Working Group (2009) Formulations for fortified complementary foods and supplements: Review of successful products for improving the nutritional statics of infants and young children. Food and Nutrition Bulletin 30 (2) supplemen, S239–S255. [PubMed] [Google Scholar]
- Galloway R. & McGuire J. (1994) Determinants of compliance with iron supplementation: supplies, side effects, or psychology? Social Science & Medicine 39, 381–390. [DOI] [PubMed] [Google Scholar]
- Golden M.H. (2009) Proposed recommended nutrient densities for moderately malnourished children. WHO, UNICEF, WFP and UNHCR Consultation on the Dietary Management of Moderate Malnutrition in Under_5 Children. Geneva. Available at: http://www.who.int/nutrition/publications/moderate_malnutrition/MM_Background_paper1.pdf (accessed 12 December 2009).
- Hadders‐Algra M., Bouwstra H., Van Goor S.A., Dijck‐Brouwer D.J. & Muskiet F.A. (2007) Prenatal and early postnatal fatty acid status and neurodevelopmental outcome. Journal of Perinatal Medicine 35, 549–571. [DOI] [PubMed] [Google Scholar]
- Hallberg L. & Hulthen L. (2000) Prediction of dietary iron absorption: an algorithm for calculating absorption and bioavailability of dietary iron. American Journal of Clinical Nutrition 71, 1147–1160. [DOI] [PubMed] [Google Scholar]
- Heird W.C. & Lapillonne A. (2005) The role of essential fatty acids in development. Annual Review of Nutrition 25, 549–571. [DOI] [PubMed] [Google Scholar]
- Helland I.B., Saugstad O.D., Saarem K., Van Houwelingen A.C., Nylander G. & Drevon C.A. (2006) Supplementation of n‐3 fatty acids during pregnancy and lactation reduces maternal plasma lipid levels and provides DHA to the infants. Journal of Maternal-Fetal & Neonatal Medicine 19, 397–406. [DOI] [PubMed] [Google Scholar]
- Home Fortification Technical Advisory Group (HFTAG) (2009) Summary Report of a Workshop on Multiple Micronutrient Powders. Workshop on scaling up the use of multiple micronutrient powders to improve the quality of complementary foods for young children in Asia; Bangkok, Thailand.
- Horvath A., Koletzko B. & Szajewska H. (2007) Effect of supplementation of women in high‐risk pregnancies with long‐chain polyunsaturated fatty acids on pregnancy outcomes and growth measures at birth: a meta‐analysis of randomized controlled trials. British Journal of Nutrition 98, 253–259. [DOI] [PubMed] [Google Scholar]
- Hotz C. (2007) Dietary indicators for assessing the adequacy of population zinc intakes. Food and Nutrition Bulletin 28, S430–S453. [DOI] [PubMed] [Google Scholar]
- Hotz C. & Brown K.H. (2004) IZiNCG technical document #1 Assessment of the risk of zinc deficiency in populations and options for its control. Food and Nutrition Bulletin 25, 1, Suppl. 2: S99–S203. [PubMed] [Google Scholar]
- Huybregts L., Roberfroid D., Lanou H., Menten J., Meda N., Van Camp J. et al (2009) Prenatal food supplementation fortified with multiple micronutrients increases birth length: a randomized controlled trial in rural Burkina Faso. American Journal of Clinical Nutrition 90, 1593–1600. [DOI] [PubMed] [Google Scholar]
- IOM (Institute of Medicine of The National Academies) (2009) Dietary Reference Intakes. Available at: http://fnic.nal.usda.gov/nal_display/index.php?info_center=4&tax_level=3&tax_subject=256&topic_id=1342&level3_id=5141 (accessed 2 December 2009).
- Kuusipalo H., Maleta K., Briend A., Manary M. & Ashorn P. (2006) Growth and change in blood haemoglobin concentration among underweight Malawian infants receiving fortified spreads for 12 weeks: a preliminary trial. Journal of Pediatric Gastroenterology and Nutrition 43, 525–532. [DOI] [PubMed] [Google Scholar]
- Larque E., Demmelmair H. & Koletzko B. (2002) Perinatal supply and metabolism of long‐chain polyunsaturated fatty acids: importance for the early development of the nervous system. Annals of the New York Academy of Sciences 967, 299–310. [DOI] [PubMed] [Google Scholar]
- Maclean W.C. (1981) Protein quality and digestibility of sorghum in preschool children. Journal of Nutrition 111, 1928–1936. [DOI] [PubMed] [Google Scholar]
- Manary M. (2006) Local production and provision of ready‐to‐use therapeutic food (RUTF) spread for the treatment of severe childhood malnutrition. Food and Nutrition Bulletin 27, S83–S89. [DOI] [PubMed] [Google Scholar]
- Navarro‐Colorado C., Mason F. & Shoham J. (2008) Measuring the effectiveness of Supplementary Feeding Programmes in emergencies. Humanitarian Practice Network Paper, No. 63, Overseas Development Institute, London. Available at: http://www.odi.org.uk/resources/download/2496.pdf (accessed 2 December 2009).
- Ndekha M.J., Manary M., Ashorn P. & Briend A. (2005) Home‐based therapy with ready‐to‐use therapeutic food is of benefit to malnourished, HIV‐infected Malawian children. Acta Paediatrica 94, 222–225. [DOI] [PubMed] [Google Scholar]
- De Pee S., Moench‐Pfanner R., Martini E., Zlotkin S., Darton‐Hill I. & Bloem M.W. (2007) Home fortification in emergency response and transition programming: experiences in Aceh and Nias, Indonesia. Food and Nutrition Bulletin 28, 189–197. [DOI] [PubMed] [Google Scholar]
- Phuka J.C., Maleta K., Thakwalakwa C., Cheung Y.B., Briend A., Manary M. et al. (2008) Complementary feeding with fortified spread and incidence of severe stunting in 6‐ to 18‐month‐old rural Malawians. Archives of Pediatric and Adolescent Medicine 162, 629–626. [DOI] [PMC free article] [PubMed] [Google Scholar]
- Phuka J.C., Maleta K., Thakwalakwa C., Cheung Y.B., Briend A., Manary M. et al. (2009) Postintervention growth of Malawian children who received 12‐mo dietary complementation with a lipid‐based nutrient supplement or maize‐soy flour. American Journal of Clinical Nutrition 89, 382–390. [DOI] [PubMed] [Google Scholar]
- Prudhon C., Briend A., Weise Prinzo Z., Daelmans B.M.E.G. & Mason J.B. (2006) SCN Nutrition Policy Paper No. 21: WHO, UNICEF, and SCN informal consultation on community‐based management of severe malnutrition in children. Food and Nutrition Bulletin 27, Suppl. 3, S99–S104. [DOI] [PubMed] [Google Scholar]
- Rowe J.P., Brodegard W.C., Pike O.A., Steele F.M. & Dunn M.L. (2008) Storage, preparation and usage of fortified food aid among Guatemalan, Ugandan and Malawian beneficiaries: a field study report. Food and Nutrition Bulletin 29, 213–220. [DOI] [PubMed] [Google Scholar]
- Ruel M., Menon P., Habicht J.P., Loechl C., Bergeron G., Pelto G. et al. (2008) Age‐based preventive targeting of food‐assistance and behaviour change and communication of reduction of childhood undernutrition in Haiti: a cluster randomised trial. The Lancet 371, 588–595. [DOI] [PubMed] [Google Scholar]
- Sazawal S., Black R.E., Ramsan M., Chwaya H.M., Stoltzfus R.J., Dutta A. et al. (2006) Effects of routine prophylactic supplementation with iron and folic acid on admission to hospital and mortality in preschool children in a high malaria transmission setting: community‐based, randomised, placebo‐controlled trial. The Lancet 367, 133–143. [DOI] [PubMed] [Google Scholar]
- Seal A. & Prudhon C. (2007) Assessing Micronutrient Deficiencies in Emergencies. UNS/Standing Committee on Nutrition: Geneva. [Google Scholar]
- Stoltzfus R.J. & Dreyfuss M.L. (1998) Guidelines for the Use of Iron Supplements to Prevent and Treat Iron Deficiency Anemia. International Life Sciences Institute Press: Washington, DC. [Google Scholar]
- SUSTAIN (1999) Final Report of the Micronutrient Assessment Project. SUSTAIN: Washington, DC. [Google Scholar]
- Szajewska H., Horvath A. & Koletzko B. (2006) Effect of n‐3 long‐chain polyunsaturated fatty acid supplementation of women with low‐risk pregnancies on pregnancy outcomes and growth measures at birth: a meta‐analysis of randomized controlled trials. American Journal of Clinical Nutrition 83, 1337–1344. [DOI] [PubMed] [Google Scholar]
- UNHCR/UNICEF/WFP/WHO (2004) Food and Nutrition Needs in Emergencies. WHO: Geneva. [Google Scholar]
- United States Government Accountability Office (2007) Report to the Committee on Agriculture, Nutrition and Forestry U.S. Senate: Foreign Assistance Various Challenges Impede the Efficiency and Effectiveness of U.S. Food Aid. Government Accountability Office: Washington, DC. [Google Scholar]
- U.S. Department of Agriculture (2008) Composition of Foods Raw, Processed, Prepared. USDA National Database for Standard Reference, Release 21. Available at: http://www.nal.usda.gov/fnic/foodcomp/search/ (accessed 12 February 2009).
- USAID . (2006) Commodity Reference Guide. Available at: http://www.usaid.gov/our_work/humanitarian_assistance/ffp/crg (Accessed March 30, 2009.
- WFP (2006) Nutrition in emergencies: WFP experiences and challenges. Food and Nutrition Bulletin 27, 57–66. [DOI] [PubMed] [Google Scholar]
- WFP/Nutrition Works (2000) Food and Nutrition Handbook. WFP: Rome. [Google Scholar]
- WHO (2000) The Management of Nutrition in Major Emergencies. WHO: Geneva. [Google Scholar]
- WHO (2007) Protein and Amino Acid Requirements in Human Nutrition Report of a Joint WHO/FAO/UNU Expert Consultation. WHO: Geneva. [Google Scholar]
- WHO Multicentre Growth Reference Study Group (2006) WHO Child Growth Standards: Length/Height‐for‐age, Weight‐for‐age, Weight‐for‐length, Weight‐for‐height and Body Mass Index‐for‐age. Available at: http://www.who.int/childgrowth/standards/en/
- WHO/FAO (2004) Vitamin and Mineral Requirements in Human Nutrition. WHO: Geneva. [Google Scholar]
- WHO/UNICEF (2007) Iron Supplementation of Young Children in Regions where Malaria Transmission is Intense and Infectious Disease Highly Prevalent. WHO/UNICEF: Geneva. [Google Scholar]
- WHO/WFP/UNICEF (2007) Preventing and Controlling Micronutrient Deficiencies in Populations Affected by an Emergency. WHO: Geneva. [Google Scholar]
- WHO/WFP/UNSCN/UNICEF (2007) Community‐Based Management of Severe Acute Malnutrition. WHO/WFP/UNSCN/UNICEF: Geneva. [Google Scholar]
- World Health Organization (1998) Complementary Feeding of Young Children in Developing Countries: A Review of Current Scientific Knowledge. WHO: Geneva. [Google Scholar]